")
Back to Journals » Drug Design, Development and Therapy » Volume 11
Insight into resistance mechanisms of AZD4547 and E3810 to FGFR1 gatekeeper mutation via theoretical study
Authors Liang D, Chen Q, Guo Y, Zhang T, Guo W
Received 11 December 2016
Accepted for publication 6 January 2017
Published 17 February 2017 Volume 2017:11 Pages 451—461
DOI https://doi.org/10.2147/DDDT.S129991
Checked for plagiarism Yes
Review by Single anonymous peer review
Peer reviewer comments 2
Editor who approved publication: Dr Tuo Deng
Donglou Liang,1,* Qiaowan Chen,2,* Yujin Guo,1 Ting Zhang,3 Wentao Guo4
1Pharmacy Department, Jining First People’s Hospital, 2Department of Obstetrics, Affiliated Hospital of Jining Medical University, Jining, Shandong, 3Department of Rheumatology, The First Affiliated Hospital of Wenzhou Medical University, 4School of Pharmacy, Wenzhou Medical University, Wenzhou, Zhejiang, People’s Republic of China
*These authors contributed equally to this work
Abstract: Inhibitors targeting the amplification of the fibroblast growth factor receptor 1 (FGFR1) have found success in the treatment of FGFR1-positive squamous cell lung and breast cancers. A secondary mutation of gatekeeper residue (V561M) in the binding site has been linked to the acquired resistance. Recently, two well-known small molecule inhibitors of FGFR1, AZD4547 and E3810, reported that the V561M mutation confers significant resistance to E3810, while retaining affinity for AZD4547. FGFR1 is widely investigated as potential therapeutic target, while there are few computational studies made to understand the resistance mechanisms about FGFR1 V561M gatekeeper mutation. In this study, molecular docking, classical molecular dynamics simulations, molecular mechanics/generalized born surface area (MM/GBSA) free energy calculations, and umbrella sampling (US) simulations were carried out to make clear the principle of the binding preference of AZD4547 and E3810 toward FGFR1 V561M gatekeeper mutation. The results provided by MM/GBSA reveal that AZD4547 has similar binding affinity to both FGFR1WT and FGFR1V561M, whereas E3810 has much higher binding affinity to FGFR1WT than to FGFR1V561M. Comparison of individual energy terms indicates that the major variation of E3810 between FGFR1WT and FGFR1V561M are van der Waals interactions. In addition, US simulations prove that the potential of mean force (PMF) profile of AZD4547 toward FGFR1WT and FGFR1V561M has similar PMF depth. However, the PMF profile of E3810 toward FGFR1WT and FGFR1V561M has much higher PMF depth, suggesting that E3810 is more easily dissociated from FGFR1V561M than from FGFR1WT. The results not only show the drug-resistance determinants of FGFR1 gatekeeper mutation but also provide valuable implications and provide vital clues for the development of new inhibitors to combat drug resistance.
Keywords: FGFR1, gatekeeper mutation, V561M, theoretical study, resistance mechanisms
Introduction
The fibroblast growth factor receptor (FGFR) regulates critical cellular processes, such as proliferation, differentiation, and apoptosis. FGFRs, a subfamily of the receptor tyrosine kinase superfamily with four distinct isoforms (FGFR1–4), are composed of extracellular ligand-binding domain, a transmembrane helix and an intracellular tyrosine kinase domain (KD).1 The binding of fibroblast growth factor (FGF) and FGFR triggers the dimerization of the extracellular receptor domains, transphosphorylation of the intracellular KD, and the subsequent activation of downstream signaling pathways, including the mitogen-activated protein kinase and phosphoinositide-3-kinase (PI3K)/Akt.2,3
In FGFR1, mutation or amplification can lead to aberrant FGFR1 activity, implicating this kinase in cancers, for example, non-small-cell lung cancer, breast cancer, multiple myeloma, and rhabdomyosarcoma.2,4 A growing body of research reported that the inhibition of FGF–FGFR1 may present an effective therapeutic option for cancers. Particularly, the KD of FGFR1 is believed to be an important target for anticancer drug development.2,5–9
The KD of FGFR1 adopts the canonical bilobate fold with two major conserved subdomains, a smaller N-terminal lobe showing the characteristic twisted five-stranded β-sheet and the αC helix and a larger C-terminal lobe consisting of mainly α helices (Figure 1A). The two domains are connected by a flexible linker (kinase hinge). The adenosine triphosphate (ATP) binding site is located in the cleft between the two domains and the kinase hinge.10,11 Numerous studies have reported several small molecule tyrosine kinase inhibitors (TKIs) targeting FGFR1 for the treatment of advanced solid tumors.2 Unfortunately, resistance severely hampers the long-term success of TKIs, with mutations at the gatekeeper residues (such as V561M, located deep in the active site that controls access of the TKIs to the hydrophobic pocket) often serving as an early means of resistance to cancer therapy, resulting in tumor progression (Figure 1A).12,13
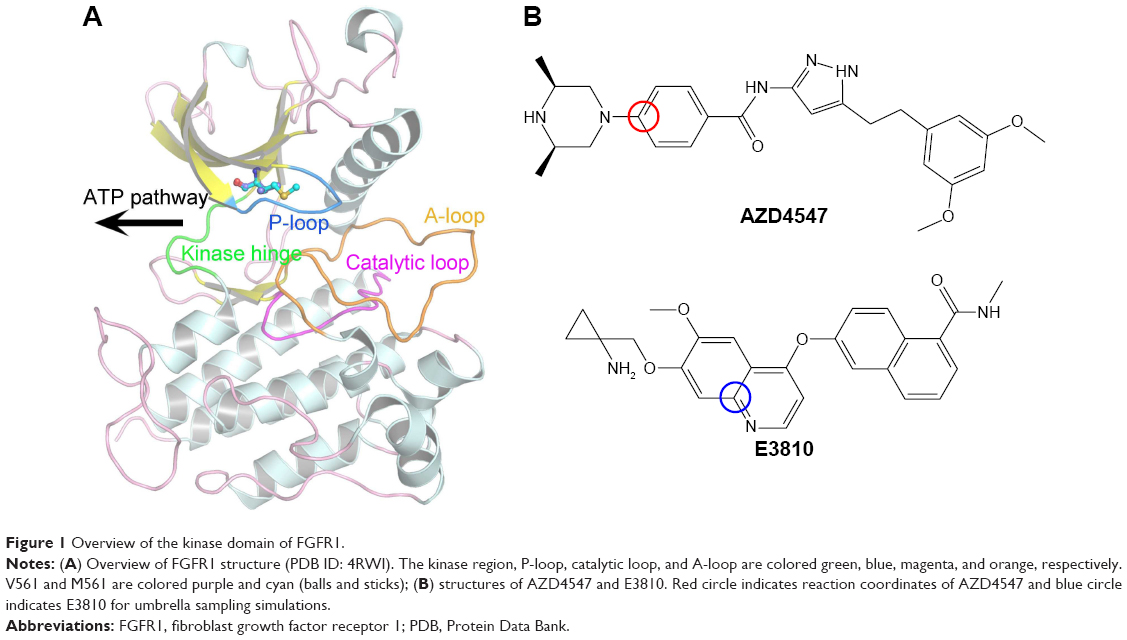 | Figure 1 Overview of the kinase domain of FGFR1. |
Sohl et al10 first showed the AZD4547 binding in unique ways to the wild type (WT) and the gatekeeper mutant (V561M) forms of FGFR1. In addition, AZD4547 showed high affinity toward FGFR1WT and FGFR1V561M isoforms, but E3810 displayed much reduced inhibition toward FGFR1V561M. Crystal structural analysis showed that binding affinity of AZD4547 is preserved by V561M mutation due to a flexible linker that allows multiple inhibitor binding modes while E3810 remains unknown.10 It should be noted that the affinity for the various inhibitors was not disrupted in V561M, such as AZD4547, indicating that the drug-resistance mechanism could not be simply explained by the steric hindrance.
The pyrazole derivative AZD4547 (Figure 1B) is a novel and selective FGFR1-3 inhibitor developed by AstraZeneca and currently in clinical trials (ClinicalTrials.gov identifier, NCT01457846).14 E3810 (lucitanib; Figure 1B) is a potent, oral inhibitor of the tyrosine kinase activity of FGFR1–3, vascular endothelial growth factor receptors 1–3 (VEGFR1–3), and platelet-derived growth factor receptors A/B (PDGFRA/B). The on-going Phase I/II clinical study of E3810 has demonstrated objective responses in breast cancer patients with FGF-aberrant tumors.15,16 In this study, AZD4547 and E3810 were studied to determine the mechanisms of binding affinity toward FGFR1WT and FGFR1V561M. We studied the binding specificity of AZD4547 and E3810 by using multiple molecular modeling methods. Classical molecular dynamics (MD) simulations and structural analysis reveal that E3810 bind in new conformations with minor adjustments in order to accommodate V561M gatekeeper mutation, which is consistent with the induced-fit theory. Molecular mechanics/generalized born surface area (MM/GBSA) and free energy decomposition calculations were used to determine binding free energies. Furthermore, umbrella sampling (US) simulations were used to study the dissociation process of the two inhibitors from the active pockets of FGFR1WT and FGFR1V561M. The results show that the van der Waals interactions are critical for binding affinity of AZD4547 and E3810 toward FGFR1WT and FGFR1V561M. Moreover, US simulations show that dissociation process plays an essential role in maintaining potency. The potential of mean force (PMF) profile of FGFR1WT/E3810 has much higher PMF depth than FGFR1V561M/E3810 compared with the PMF profile of FGFR1WT/AZD4547 and FGFR1V561M/AZD4547, indicating that E3810 is easier to dissociate from FGFR1V561M than from FGFR1WT. Therefore, E3810 cannot maintain potency against V561M gatekeeper mutation. Our results are consistent with previous reports and provide new vital insights for designing future inhibitors effective against the FGFR1 V561M gatekeeper mutation.
Materials and methods
Construction of the FGFR1V561M/E3810 model
As one of the most widely used computational approaches for structure-based drug design, molecular docking study was used to construct the FGFR1V561M/E3810 model by the latest version of AutoDock 4.2.6 package.17 AutoDock 4.2.6 package is a flexible docking program that is based on Lamarkian genetic algorithm to search the optimal conformation of ligand in a macromolecule. The crystal structure of human FGFR1V561M (Protein Data Bank [PDB] ID: 4RWI) was obtained from the PDB.10 For docking calculations, AutoDock4 atomic radii and Gasteiger partial charges were assigned to the FGFR1V561M and E3810 in molecular docking. The grid dimensions of 60×60×60 Å beside the XYZ directions were assigned using the AutoGrid module with a grid spacing of 0.375 Å. The docking protocol consisting of 100 conformations was generated, which were clustered according to the root mean square deviation (RMSD) tolerance of 2.0 Å, population size of 300, maximum number of evaluation 25,000,000, and other settings were set default. AutoDockTools program17 and PyMol program18 were used to analyze the docking results.
Classical MD simulations
Classical MD simulation, an unbiased MD simulation method, gives the evolution of a molecular system as a function of time. The X-ray crystal structures of FGFR1WT/AZD4547 (PDB ID: 4RWJ), FGFR1V561M/AZD4547 (PDB ID: 4RWK), FGFR1WT/E3810 (PDB ID: 4RWL), and modeled FGFR1V561M/E3810 were used as the initial structures for the classical MD simulations.10 Prior to the classical MD simulations, the ligand–protein systems were constructed by antechamber and the functionality of link, edit and parm (known as LeaP module) in Assisted Model Building with Energy Refinement (Amber) 11 simulation package (Amber Software Administrator, San Francisco, CA, USA).19 The proteins were described by the Amber ff99SB force field.20 AZD4547 and E3810 used the generalized Amber force field with partial charges assigned by restrained electrostatic potential fitting method based on the electrostatic potentials computed at Hartree–Fock SCF/6-31G* level of theory.21,22 All complexes were solvated in a box of TIP3P water molecules with a 10 Å distance between the protein surface and the box boundary. In addition, an appropriate number of sodium ions were used to ensure electro neutrality.
Classical MD simulations were carried out by Amber 11 software package.23 Before the MD productive simulation, we carried out an equilibration protocol consisting of an initial minimization (5,000 steps of steepest descent and 2,500 steps of conjugate gradient) to the solvent molecules. Then the side chains of proteins were subjected to energy minimization with harmonic restraints of 4 kcal/mol−1/Å−2 (5,000 steps of steepest descent and 2,500 steps of conjugate gradient). After that, proteins and ligands were subjected to energy minimization in the water box (5,000 steps of steepest descent and 2,500 steps of conjugate gradient). The systems were then heated to 300 K using a time constant at constant volume during 100 ps. Before the production of classical MD simulation, the whole system was equilibrated >200 ps at constant pressure of 1 bar. Finally, each system was submitted to 50 ns classical MD simulation without any restraint. During these simulations, pressure and temperature were maintained using the Langevin temperature scalings.24 SHAKE constraints were applied to all bonds involving hydrogens.25 Moreover, periodic boundary conditions and electrostatic interactions were treated using the particle-mesh Ewald algorithm with cutoff of 8 Å.26 Conformational snapshots were saved every 10 ps for further analysis.
MM/GBSA binding free energy calculations
Binding free energies for all systems were calculated using MM/GBSA methods as implemented in Amber 11.27,28 MM/GBSA computes the binding free energies by using a thermodynamic cycle that combines the molecular mechanical energies with the continuum solvent approaches. The binding free energies (ΔGbind) were calculated according to the following equations:
|
|

|
|

|
|

|
|

The binding free energies ΔGbind in equation (1) was calculated as a sum of the three terms in equation (2). ΔEMM and ΔGsol represent the molecular mechanics interaction energy and solvation energy. TΔS, at temperature T, represents the change of the conformational entropy upon ligand binding. In equation (3), ΔEMM can be decomposed into three components: intermolecular interaction energy (ΔEint), van der Waals energy (ΔEVDW), and electrostatic energy (ΔEelec). The polar part ΔGGB accounts for the electrostatic contribution to solvation and was calculated using a Generalized–Boltzmann model at igb =5 with a parameters for solvation energy charge/radii set, a 1.4 Å solvent probe radius, and a 0.5 Å grid spacing.29,30 The solvent’s dielectric constant was set to 80, whereas the dielectric constant was set to 1 in the proteins’ interior. The nonpolar part (ΔGSA) accounts for the nonpolar contribution to solvation and was approximated by relating it to the solvent accessible surface area with the coefficient of 0.0072. −TΔS was not considered here due to the high computational demand and low prediction accuracy.31 In this study, trajectories from classical MD simulation between 40 and 50 ns with 500 snapshots were considered for binding free energy calculations and free energy decomposition.
US simulations
Because biological processes are stochastic events that usually occur on the microsecond to millisecond or even longer timescales, classical MD simulations are not well suited to simulate such processes.32 To improve the efficiency of conformational sampling, great efforts have been made to develop enhanced MD sampling techniques.33–36 The US method is a technique that overcomes the problem of sampling trap into local minima, such as the unbinding process of a ligand, by adding a bias to the potential function. In this study, US simulations were carried out to characterize the unbinding processes of AZD4547 and E3810 from FGFR1WT and FGFR1V561M to elucidate the resistance mechanisms. The equilibrated snapshots extracted from the trajectories provided by the classical MD simulations were used as the initial structures for the US simulations. Numerous researches have focused on the ATP pocket for the dissociations of type I inhibitors (Figure 1A).37,38 Herein, the distance between one atom in receptor (Cβ in Glu-531 in FGFR1WT/FGFR1V561M) and another carbon atom in ligand (red circle, Figure 1B) was selected as the reaction coordinates (RCs) for AZD4547. For E3810, the distance between one atom in receptor (Cβ in Met-535 in FGFR1WT/FGFR1V561M) and another carbon atom in ligand (blue circle, Figure 1B) was chosen as the RC. All systems’ RCs were extended 30 Å from the initial distance and separated into 60 windows by a step of 0.5 Å. For each window, 7 ns MD simulations were performed for each window to ensure the convergence of each system. In addition, harmonic potential was used as the original potential for each window to make thermodynamic state from one state to another. Harmonic potential values are calculated by the following equation:
|
|

where ui is the biased potential with the current position r; ri, the reference position in window i; and ki, the elastic constant to pull the ligand out of the binding pocket. In this study, an elastic constant of 5 kcal/mol/Å2 was applied to all the windows to pull each ligand away from the binding cavity at a constant speed and force. The weighted histogram analysis method (WHAM) was carried out to calculate the PMF along the RC.39 The RC was split into 2,000 bins and the temperature was set to 300 K for the WHAM calculation.
Results and discussion
Classical MD simulations
In our study, molecular docking was used for generating the initial FGFR1V561M/E3810 complex structure. To probe the structural stability of the modeled complex of FGFR1V561M/E3810, we ran 50 ns classical MD simulations for the modeled complex and the three crystal structures as control. The detailed RMSD evolutions along the 50 ns classical MD simulations are summarized in Figure 2. The increasing RMSD in 0–20 ns of E3810 in the binding site of FGFR1V561M can be explained as induced-fit phenomenon that the ligand and receptor undergoes conformational change to accommodate each other and reach the optimal binding mode. Thus, the binding process showed amplified fluctuations. Afterward, the FGFR1V561M and E3810 are stable with the backbone atoms’ RMSD value near 3 and 0.7 Å, respectively (Figure 2G). The conformational alignment of initial and the last snapshots further visualize the results that the naphthalene nucleus of E3810 show significant difference (Figure 2H). For it can be explained that the V561M gatekeeper mutation disrupts some interactions to binding pocket of FGFR1 compared with the WT system. Sohl et al10 previously reported that the valine residue is 3.6 Å from the napthamide ring of E3810, so accommodating a 2.8 Å increase in residue length upon methionine substitution would require inhibitor rearrangement. In our study, the E3810 binds to FGFR1V561M in a very similar fashion to FGFR1V561M/AZD4547 through minor adjustments in order to accommodate the increased length. Other simulated crystal systems achieved stability after ~5–10 ns, and the alignment between initial structure and last snapshot shows high similar conformations (Figure 2A–F). Therefore, the structures from the classical MD simulations are satisfactory to be used for MM/GBSA free energy calculations and as the initial structures for the US simulations.
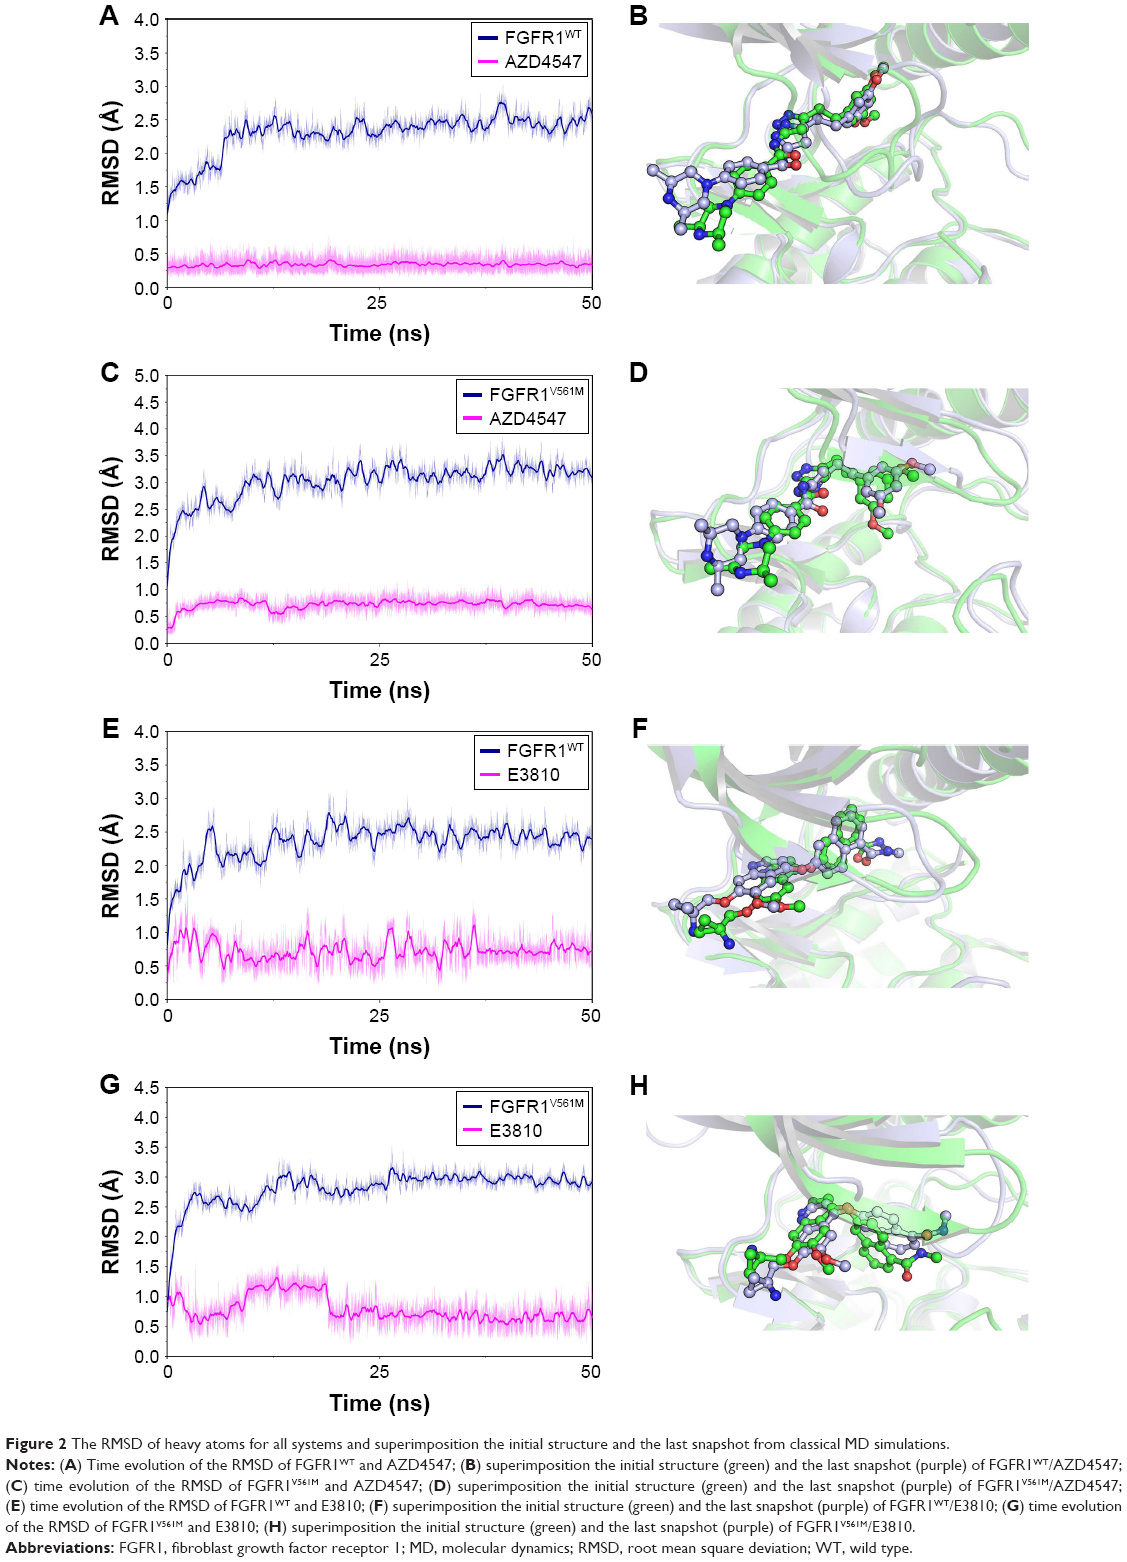 | Figure 2 The RMSD of heavy atoms for all systems and superimposition the initial structure and the last snapshot from classical MD simulations. |
Binding free energies predicted MM/GBSA methodology
Calculating binding free energies using classical MD simulation is a widely explored topic in the field of computational biophysics. In this study, to analyze the energetic contributions in determining protein–ligand association, the binding free energies were decomposed into the contributions of each energy term for all systems based on MM/GBSA methodology. As shown in Table 1, the predicted binding affinities of the FGFR1WT/AZD4547, FGFR1V561M/AZD4547, FGFR1WT/E3810, and FGFR1V561M/E3810 are −44.78±3.05, −36.59±2.67, −41.46±3.39, and −27.59±2.97 kcal/mol, respectively. Obviously, the mutational systems have decreased binding affinities compared with the WT system, and the trend of predicted binding affinities is generally consistent with the reported study.10 In addition, the Pearson’s correlation between the experimental binding affinities and the van der Waals (ΔEVDW), electrostatic (ΔEelec), polar contribution to solvation (ΔGGB), and nonpolar contribution to solvation components (ΔGSA) is 0.91, −0.17, 0.80, and 0.92, respectively (Table 1). Apparently, van der Waals interaction energies between FGFR1WT and FGFR1V561M determine the difference of the binding affinities.
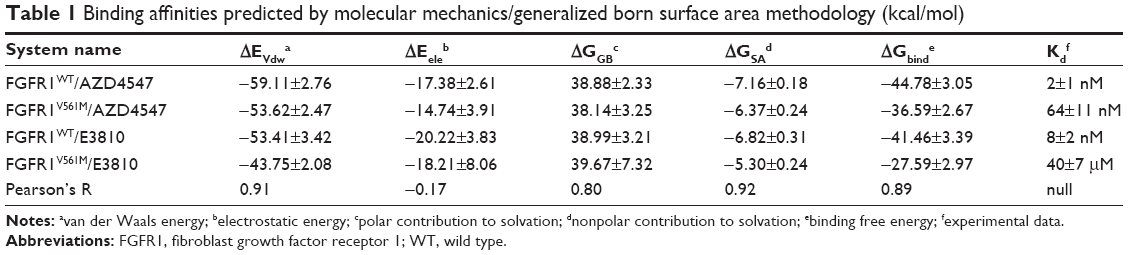 | Table 1 Binding affinities predicted by molecular mechanics/generalized born surface area methodology (kcal/mol) |
To further highlight the key residues for protein–ligand recognition patterns and understand the important energetic distributions, the average interaction of energetic contributions was decomposed into residue–ligand pairs based on the 500 snapshots extracted from the last 10 ns classical MD trajectories. The contributions of key residues for the FGFR1WT/AZD4547 are Leu-484, Phe-489, Lys-514, Gly-567, Leu-630, Ala-640, Ile-545, Val-492, Gly-485, Met-535, Lys-566, Asp-641, Tyr-563, and Phe-642 (Figure 3A and B). Meanwhile, it can be observed that the major favorable energetic contributions for FGFR1V561M/AZD4547 originate predominantly from the residues Val-492, Tyr-563, Leu-630, Leu-484, Gly-567, Ile-545, Lys-566, Ala-512, Met-561, Ala-640, Lys-514, Gly-485, Gly-487, and Asn-568 (Figure 3C and D). The results show that FGFR1WT/AZD4547 and FGFR1V561M/AZD4547 share nine identical key residues, including Leu-484, Lys-514, Gly-567, Leu-630, Ala-640, Ile-545, Val-492, Gly-485, and Tyr-563. In addition, we also find that the residues V561 and M561 in the major favorable energetic contributions, consistent with the reported study that AZD4547 affinity is preserved by V561M FGFR1.
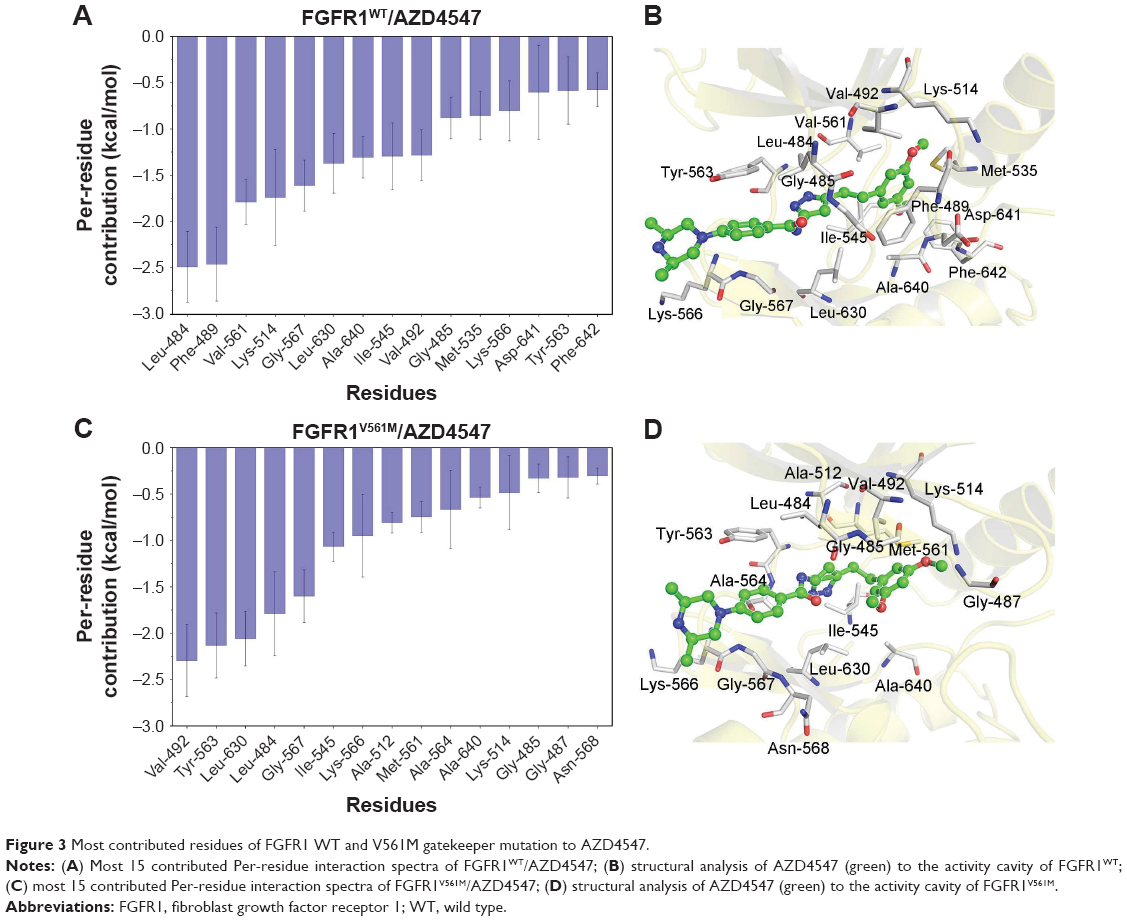 | Figure 3 Most contributed residues of FGFR1 WT and V561M gatekeeper mutation to AZD4547. |
The most 15 contributed key residues for the FGFR1WT/E3810 are Tyr-563, Leu-484, Leu-630, Ala-564, Ile-545, Val-561, Val-492, Lys-514, Met-535, Ala-640, Phe-642, Ala-512, Asp-641, Gly-567, and Val-559 (Figure 4A and B). For comparison, the residue–ligand interaction spectra of most contributed residues for FGFR1V561M/E3810 are Leu-484, Leu-630, Tyr-563, Ala-564, Val-492, Gly-567, Ala-640, Lys-566, Ala-512, Gly-485, Ile-545, Asn-568, Met-561, Asp-641, and Ser-565 (Figure 4C and D). Interestingly, we observed 10 similar key residues as AZD4547 to WT and mutational systems. Moreover, V561 and M561 are also in the major favorable energetic contributions. Overall, by analyzing each energy term and the residue–ligand interaction spectra, it can be seen that the van der Waals interactions at the binding site contribute to the resistance mechanisms.
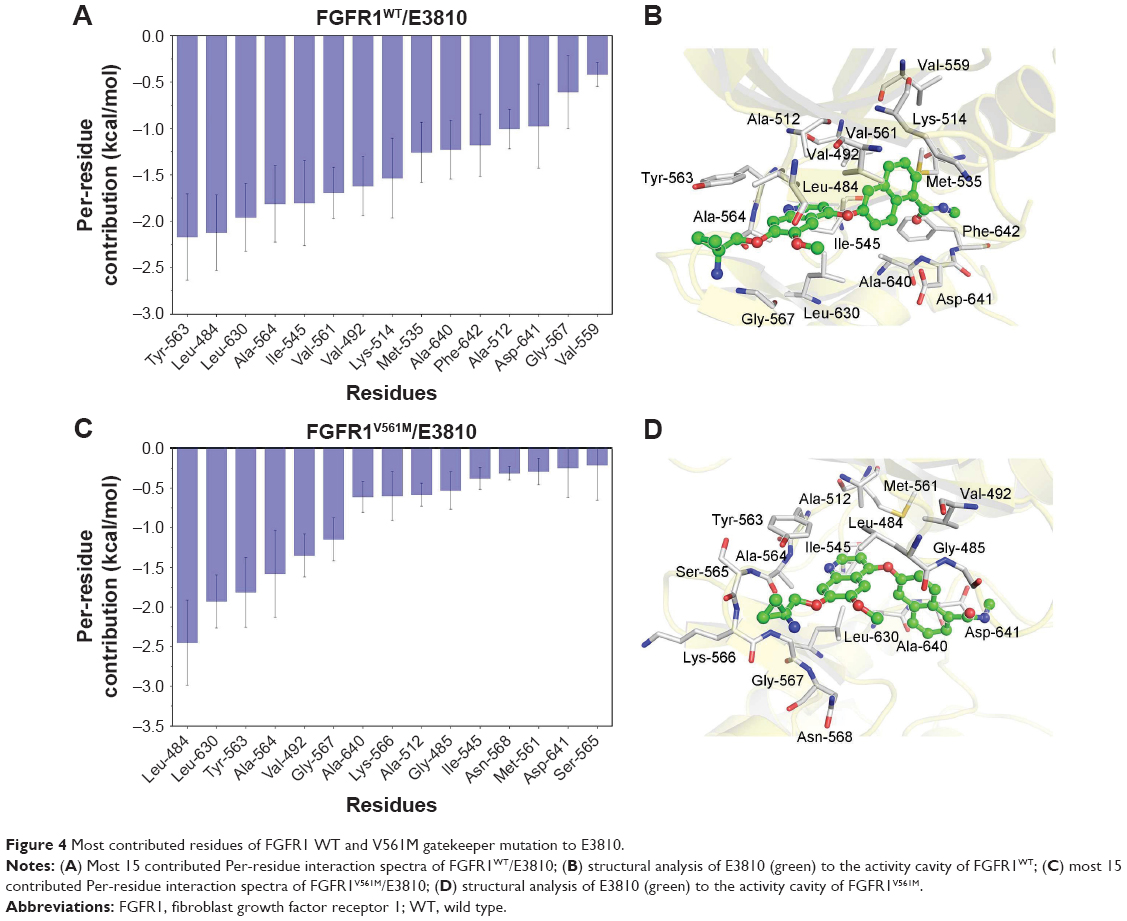 | Figure 4 Most contributed residues of FGFR1 WT and V561M gatekeeper mutation to E3810. |
US simulations reveal the resistance mechanisms of FGFR1 V561M gatekeeper mutation
Previous enzymatic assays have proved that the V561M gatekeeper mutation induces serious resistance to E3810, whereas the mutation is barely resistant to AZD4547. According to the predictions by MM/GBSA methodology shown in Table 1, the V561M gatekeeper mutation has great impact on the E3810 binding, which is consistent with the enzymatic assays.10 To further characterize the ligand dissociation process, US simulations were performed for the four complexes along the RCs.
Due to the gatekeeper mutation, which may affect the conformation of the residues around modeled FGFR1V561M/E3810, it is inevitable to get an equilibrium conformation for postanalysis. In this study, the equilibrated snapshots extracted from the 50 ns classical MD trajectories were used as the initial structures for the US simulations. To guarantee the sampling convergence of the US simulations, 7 ns US simulations for each window were performed for all the systems, and the convergence of PMF was checked after each nanosecond. As shown in Figure 5, seven curves were plotted for each system and the PMFs achieved satisfactory coincidence after 4–6 ns US simulations (PMFs difference <0.5 kcal/mol).
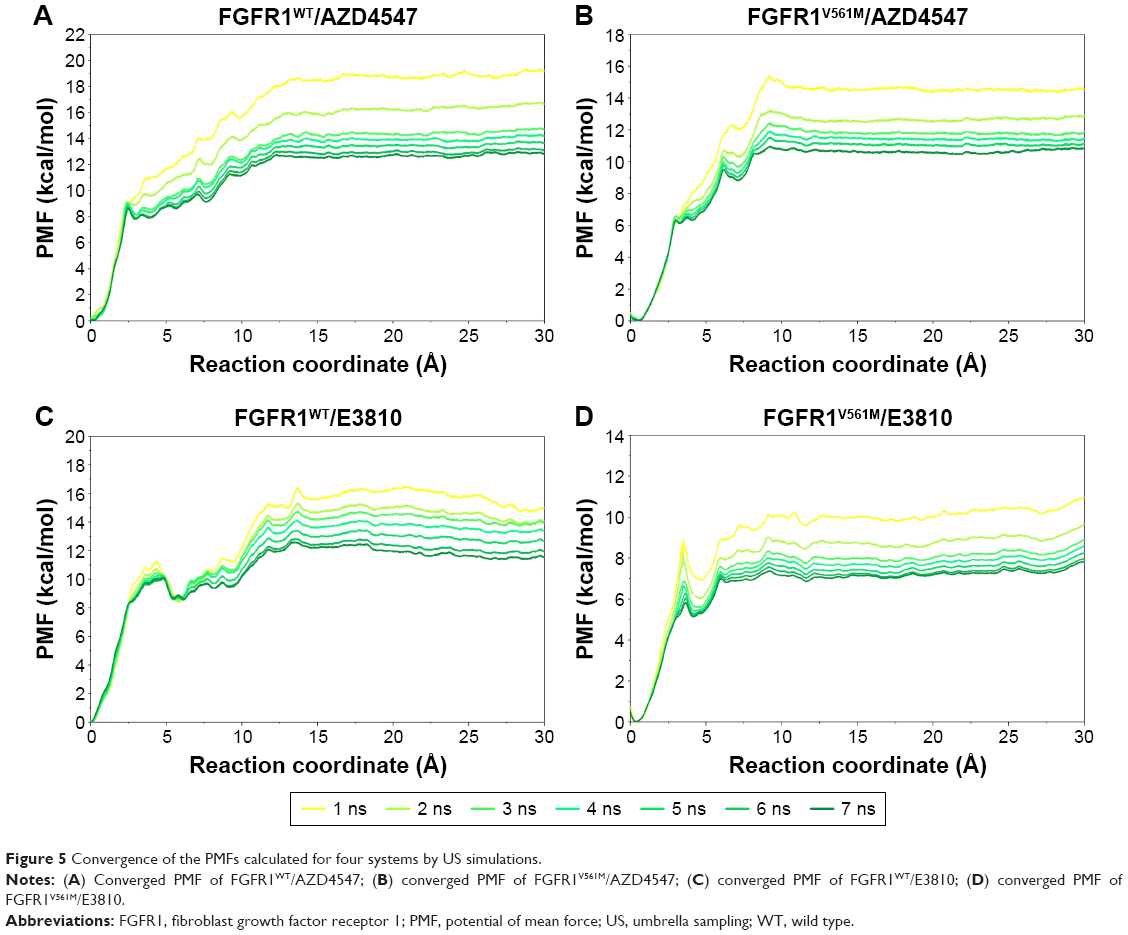 | Figure 5 Convergence of the PMFs calculated for four systems by US simulations. |
As shown in Table 2 and Figure 6, the PMF values predicted by US simulations (WHAM methodology) along the ATP pathway for the two inhibitors can be correctly ranked. Furthermore, the binding free energy difference (ΔPMFUS) between the WT system and the mutational system for AZD4547 and E3810 is 2.09±0.09 and 4.22±0.30, which are in good consistent with that of the experimental data. Moreover, the Pearson’s correlation between experimental binding affinities and predicted PMF values are 0.93, indicating the PMF values derived from the US simulations highlight the good ranking ability of the US simulations. In addition, the PMF values also reveal different dissociation processes of ligands unbinding from the binding pocket of FGFR1 WT and V561M gatekeeper mutation. For instance, it can be observed that the PMF values derived from WT systems are much higher than the V561M gatekeeper mutation systems, suggesting a deeper energy potential depth and, thus, a longer residence time.
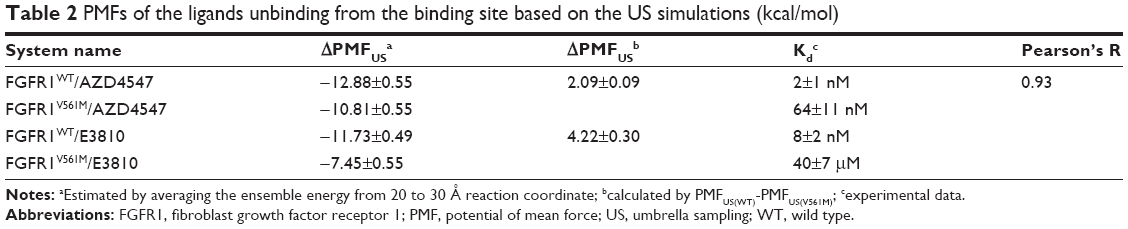 | Table 2 PMFs of the ligands unbinding from the binding site based on the US simulations (kcal/mol) |
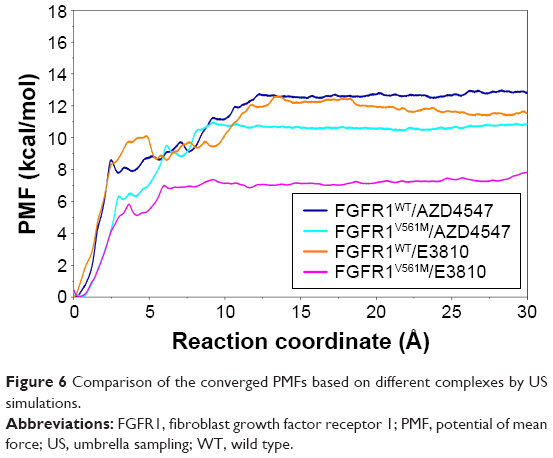 | Figure 6 Comparison of the converged PMFs based on different complexes by US simulations. |
For FGFR1V561M/E3810 system, the PMF of E3810 along the RC increases gradually (0–3.5 Å, Figure 6, magenta line). Then, E3810 trapped into local minima ~0.8 kcal/mol (3.5–4.1 Å). Thereafter, E3810 along the RC increases gradually without meeting any local minima and then reaches stability. Similar behavior was observed for FGFR1WT/E3810 system. However, a big difference was observed at the region 5-6 Å of the RC with a large local minima (~1.5 kcal/mol, Figure 6, orange line). Besides, before the PMF of E3810 reaches stability, the PMF curve has many peaks and valleys, implying that the dissociations of E3810 from the WT system may be more easily trapped into local minima and have more residence time. The processes of the AZD4547 unbinding from the WT and V561M gatekeeper mutation are illustrated in Figure 6 (blue and cyan line). When AZD4547 move out of the binding pocket, the PMF values increase quickly. Afterward, the PMFs along the RC of WT/V561M systems increase gradually with similar peaks and valleys toward equivalence. This supports the previous study and the results of our MM/GBSA free energy calculations that AZD4547 maintains nanomolar affinity for V561M FGFR1.10
Overall, the drug resistance may be caused by the mutation-induced change of the energetic distributions and dissociation process between the inhibitors and the binding pocket. The redistributed energies may have great impact on the binding approaches of E3810, not AZD4547 to the FGFR1 V561M gatekeeper mutation. This affinity loss may stem from altered binding conformations. The dynamic and energetic aspects obtained here are vital for understanding the challenges that next-generation TKIs must overcome.
Conclusion
In this study, the resistance mechanisms of two inhibitors (AZD4547 and E3810) of FGFR1 were studied by combining molecular docking, classical MD simulations, MM/GBSA methodology, energy decomposition, and US simulations. The results unambiguously suggest that the binding preference of E3810 to FGFR1V561M is controlled by both the conformational change and the variance of the van der Waals interactions due to the inherent planar and rigid. In contrast to E3810, AZD457 is far more flexible. Therefore, AZD4547 can bind in new conformations that accommodate the acquisition of V561M gatekeeper mutation binding pocket that would potentially preserve high inhibitor affinity. Besides, the energy decomposition analysis demonstrates the major favorable energy contributed residues in both WT and V561M gatekeeper mutation of FGFR1-binding pocket are crucial in determining the binding specificity. The US simulation results and PMF calculations show that both AZD4547 and E3810 dissociate from WT system needs to overcome much higher free energy barrier than V561M gatekeeper mutation system when unbinding from the target. Compared with AZD4547, the PMF depths of E3810 for WT system are much higher than V561M gatekeeper mutation system, suggesting that the dissociation of E3810 from FGFR1WT is more difficult than that from FGFR1V561M, which are consistent with the MM/GBSA predictions and experimental data. In summary, our study suggests that the drug-resistance mechanism cannot be simply explained by the steric hindrance, the V561M gatekeeper mutation not only affects the conformations and binding affinities but also affects the dissociation process and residence time. In this study, the structural analysis and energetic calculations provide a feasible way to predict the unbinding kinetics of protein–ligand systems, which can facilitate the rational design of highly selective inhibitors with high binding affinity and long residence time for FGFR1 V561M gatekeeper mutation.
Disclosure
The authors report no conflicts of interest in this work.
References
Beenken A, Mohammadi M. The FGF family: biology, pathophysiology and therapy. Nat Rev Drug Discov. 2009;8(3):235–253. | ||
Turner N, Grose R. Fibroblast growth factor signalling: from development to cancer. Nat Rev Cancer. 2010;10(2):116–129. | ||
Schlessinger J, Plotnikov AN, Ibrahimi OA, et al. Crystal structure of a ternary FGF-FGFR-heparin complex reveals a dual role for heparin in FGFR binding and dimerization. Mol Cell. 2000;6(3):743–750. | ||
Weeden CE, Solomon B, Asselin-Labat ML. FGFR1 inhibition in lung squamous cell carcinoma: questions and controversies. Cell Death Discov. 2015;1:15049. | ||
Cheng W, Wang M, Tian X, Zhang X. An overview of the binding models of FGFR tyrosine kinases in complex with small molecule inhibitors. Eur J Med Chem. 2016;126:476–490. | ||
Touat M, Ileana E, Postel-Vinay S, Andre F, Soria JC. Targeting FGFR signaling in cancer. Clin Cancer Res. 2015;21(12):2684–2694. | ||
Gudernova I, Vesela I, Balek L, et al. Multikinase activity of fibroblast growth factor receptor (FGFR) inhibitors SU5402, PD173074, AZD1480, AZD4547 and BGJ398 compromises the use of small chemicals targeting FGFR catalytic activity for therapy of short-stature syndromes. Hum Mol Genet. 2016;25(1):9–23. | ||
Goke F, Franzen A, Hinz TK, et al. FGFR1 expression levels predict BGJ398 sensitivity of FGFR1-dependent head and neck squamous cell cancers. Clin Cancer Res. 2015;21(19):4356–4364. | ||
Wan X, Corn PG, Yang J, et al. Prostate cancer cell-stromal cell crosstalk via FGFR1 mediates antitumor activity of dovitinib in bone metastases. Sci Translational Med. 2014;6(252):252ra122. | ||
Sohl CD, Ryan MR, Luo B, Frey KM, Anderson KS. Illuminating the molecular mechanisms of tyrosine kinase inhibitor resistance for the FGFR1 gatekeeper mutation: the Achilles’ heel of targeted therapy. ACS Chem Biol. 2015;10(5):1319–1329. | ||
Yosaatmadja Y, Patterson AV, Smaill JB, Squire CJ. The 1.65 A resolution structure of the complex of AZD4547 with the kinase domain of FGFR1 displays exquisite molecular recognition. Acta Crystallogr D Biol Crystallogr. 2015;71(Pt 3):525–533. | ||
Greulich H, Pollock PM. Targeting mutant fibroblast growth factor receptors in cancer. Trends Mol Med. 2011;17(5):283–292. | ||
Bunney TD, Wan S, Thiyagarajan N, et al. The effect of mutations on drug sensitivity and kinase activity of fibroblast growth factor receptors: a combined experimental and theoretical study. EBioMed. 2015;2(3):194–204. | ||
Gavine PR, Mooney L, Kilgour E, et al. AZD4547: an orally bioavailable, potent, and selective inhibitor of the fibroblast growth factor receptor tyrosine kinase family. Cancer Res. 2012;72(8):2045–2056. | ||
Zhou Y, Chen Y, Tong L, et al. AL3810, a multi-tyrosine kinase inhibitor, exhibits potent anti-angiogenic and anti-tumour activity via targeting VEGFR, FGFR and PDGFR. J Cell Mol Med. 2012;16(10):2321–2330. | ||
Soria JC, DeBraud F, Bahleda R, et al. Phase I/IIa study evaluating the safety, efficacy, pharmacokinetics, and pharmacodynamics of lucitanib in advanced solid tumors. Ann Oncol. 2014;25(11):2244–2251. | ||
Morris GM, Huey R, Lindstrom W, et al. AutoDock4 and AutoDockTools4: automated docking with selective receptor flexibility. J Comput Chem. 2009;30(16):2785–2791. | ||
Lill MA, Danielson ML. Computer-aided drug design platform using PyMOL. J Comput Aided Mol Des. 2011;25(1):13–19. | ||
Wang J, Wang W, Kollman PA, Case DA. Antechamber: an accessory software package for molecular mechanical calculations. J Am Chem Soc. 2001;222:U403. | ||
Lindorff-Larsen K, Piana S, Palmo K, et al. Improved side-chain torsion potentials for the Amber ff99SB protein force field. Proteins. 2010;78(8):1950–1958. | ||
Wang J, Wolf RM, Caldwell JW, Kollman PA, Case DA. Development and testing of a general amber force field. J Comput Chem. 2004;25(9):1157–1174. | ||
Vanquelef E, Simon S, Marquant G, et al. R.E.D. Server: a web service for deriving RESP and ESP charges and building force field libraries for new molecules and molecular fragments. Nucleic Acids Res. 2011;39(Web Server issue):W511–W517. | ||
Pearlman DA, Case DA, Caldwell JW, et al. AMBER, a package of computer programs for applying molecular mechanics, normal mode analysis, molecular dynamics and free energy calculations to simulate the structural and energetic properties of molecules. Comput Phys Commun. 1995;91(1):1–41. | ||
Izaguirre JA, Catarello DP, Wozniak JM, Skeel RD. Langevin stabilization of molecular dynamics. J Chem Phys. 2001;114(5):2090–2098. | ||
Kräutler V, Van Gunsteren WF, Hünenberger PH. A fast SHAKE algorithm to solve distance constraint equations for small molecules in molecular dynamics simulations. J Comput Chem. 2001;22(5):501–508. | ||
Essmann U, Perera L, Berkowitz ML, Darden T, Lee H, Pedersen LG. A smooth particle mesh Ewald method. J Chem Phys. 1995;103(19):8577–8593. | ||
Kuhn B, Gerber P, Schulz-Gasch T, Stahl M. Validation and use of the MM-PBSA approach for drug discovery. J Med Chem. 2005;48(12):4040–4048. | ||
Miller BR 3rd, McGee TD Jr, Swails JM, Homeyer N, Gohlke H, Roitberg AE. MMPBSA.py: an efficient program for end-state free energy calculations. J Chem Theory Comput. 2012;8(9):3314–3321. | ||
Onufriev A, Bashford D, David A. Modification of the generalized Born model suitable for macromolecules. J Phys Chem. 2000;104(15):3712–3720. | ||
Weiser J, Shenkin PS, Still WC. Approximate atomic surfaces from linear combinations of pairwise overlaps (LCPO). J Comput Chem. 1999;20(2):217–230. | ||
Hou T, Wang J, Li Y, Wang W. Assessing the performance of the MM/PBSA and MM/GBSA methods. 1. The accuracy of binding free energy calculations based on molecular dynamics simulations. J Chem Inf Model. 2011;51(1):69–82. | ||
Nygaard R, Zou Y, Dror RO, et al. The dynamic process of beta(2)-adrenergic receptor activation. Cell. 2013;152(3):532–542. | ||
Mortier J, Rakers C, Bermudez M, Murgueitio MS, Riniker S, Wolber G. The impact of molecular dynamics on drug design: applications for the characterization of ligand-macromolecule complexes. Drug Discov Today. 2015;20(6):686–702. | ||
Park S, Im W. Theory of adaptive optimization for umbrella sampling. J Chem Theory Comput. 2014;10(7):2719–2728. | ||
Pfaendtner J, Bonomi M. Efficient sampling of high-dimensional free-energy landscapes with parallel bias metadynamics. J Chem Theory Comput. 2015;11(11):5062–5067. | ||
Kokubo H, Tanaka T, Okamoto Y. Prediction of protein-ligand binding structures by replica-exchange umbrella sampling simulations: application to kinase systems. J Chem Theory Comput. 2013;9(10):4660–4671. | ||
Sun H, Li Y, Li D, Hou T. Insight into crizotinib resistance mechanisms caused by three mutations in ALK tyrosine kinase using free energy calculation approaches. J Chem Inf Model. 2013;53(9):2376–2389. | ||
Yang LJ, Zou J, Xie HZ, Li LL, Wei YQ, Yang SY. Steered molecular dynamics simulations reveal the likelier dissociation pathway of imatinib from its targeting kinases c-Kit and Abl. PLoS One. 2009;4(12):e8470. | ||
Kumar S, Rosenberg JM, Bouzida D, Swendsen RH, Kollman PA. The weighted histogram analysis method for free-energy calculations on biomolecules. I. The method. J Comput Chem. 1992;13(8):1011–1021. |
 © 2017 The Author(s). This work is published and licensed by Dove Medical Press Limited. The full terms of this license are available at https://www.dovepress.com/terms.php and incorporate the Creative Commons Attribution - Non Commercial (unported, v3.0) License.
By accessing the work you hereby accept the Terms. Non-commercial uses of the work are permitted without any further permission from Dove Medical Press Limited, provided the work is properly attributed. For permission for commercial use of this work, please see paragraphs 4.2 and 5 of our Terms.
© 2017 The Author(s). This work is published and licensed by Dove Medical Press Limited. The full terms of this license are available at https://www.dovepress.com/terms.php and incorporate the Creative Commons Attribution - Non Commercial (unported, v3.0) License.
By accessing the work you hereby accept the Terms. Non-commercial uses of the work are permitted without any further permission from Dove Medical Press Limited, provided the work is properly attributed. For permission for commercial use of this work, please see paragraphs 4.2 and 5 of our Terms.