")
Back to Journals » OncoTargets and Therapy » Volume 10
Inhibitory effects of a selective Jak2 inhibitor on adrenocorticotropic hormone production and proliferation of corticotroph tumor AtT20 cells
Authors Asari Y, Kageyama K , Nakada Y, Tasso M, Takayasu S, Niioka K, Ishigame N, Daimon M
Received 8 May 2017
Accepted for publication 3 August 2017
Published 1 September 2017 Volume 2017:10 Pages 4329—4338
DOI https://doi.org/10.2147/OTT.S141345
Checked for plagiarism Yes
Review by Single anonymous peer review
Peer reviewer comments 2
Editor who approved publication: Dr Samir Farghaly
Yuko Asari, Kazunori Kageyama, Yuki Nakada, Mizuki Tasso, Shinobu Takayasu, Kanako Niioka, Noriko Ishigame, Makoto Daimon
Department of Endocrinology and Metabolism, Graduate School of Medicine, Hirosaki University, Hirosaki, Japan
Purpose: The primary cause of Cushing’s disease is adrenocorticotropic hormone (ACTH)-producing pituitary adenomas. EGFR signaling induces POMC mRNA-transcript levels and ACTH secretion from corticotroph tumors. The Jak–STAT pathway is located downstream of EGFR signaling; therefore, a Jak2 inhibitor could be an effective therapy for EGFR-related tumors. In this study, we determined the effect of a potent and selective Jak2 inhibitor, SD1029, on ACTH production and proliferation in mouse AtT20 corticotroph tumor cells.
Materials and methods: AtT20 pituitary corticotroph tumor cells were cultured after transfection with PTTG1- or GADD45β-specific siRNA. Expression levels of mouse POMC, PTTG1, and GADD45β mRNAs were evaluated using quantitative real-time polymerase chain reaction. ACTH levels were measured using ACTH ELISA. Western blot analysis was performed to examine protein expression of phosphorylated STAT3/STAT3. Viable cells and DNA fragmentation were measured using a cell-proliferation assay and cell-death detection ELISA, respectively. Cellular DNA content was analyzed using fluorescence-activated cell sorting.
Results: SD1029 decreased POMC and PTTG1 mRNA and ACTH levels, while increasing GADD45β levels. The drug also decreased AtT20-cell proliferation and induced apoptosis, but did not alter cell-cycle progression. SD1029 also inhibited STAT3 phosphorylation. PTTG1 knockdown inhibited POMC mRNA levels and cell proliferation. However, combined treatment with PTTG1 knockdown and SD1029 had no additive effect on POMC mRNA levels or cell proliferation. GADD45β knockdown inhibited the SD1029-induced decrease in POMC mRNA levels and also partially inhibited the decrease in cell proliferation.
Conclusion: Both PTTG1 and GADD45β may be responsible, at least in part, for the Jak2-induced suppression of ACTH synthesis and cell proliferation. Accordingly, therapies that target EGFR-dependent Jak2/STAT3 may have clinical applications for treating Cushing’s disease.
Keywords: Cushing’s disease, adrenocorticotropic hormone, POMC, pituitary tumor, treatment
Introduction
The primary cause of Cushing’s disease is the hypersecretion of adrenocorticotropic hormone (ACTH) from a pituitary adenoma.1,2 ACTH then in turn stimulates the release of glucocorticoids from the adrenal glands. However, in pituitary adenoma cells, the normal cortisol-feedback mechanism of the hypothalamic–pituitary–adrenal axis is disturbed, resulting in hypercortisolism, which can lead to diabetes mellitus, hypertension, atherosclerosis, immune dysfunction, and other metabolic derangements.3 ACTH production may have a partial association with cell masses or pituitary corticotroph tumor-cell growth.4 The primary treatment for Cushing’s disease is excision of tumors from the pituitary, but unsuccessful excision necessitates further therapy to treat the resulting hypercortisolism.5,6 Therefore, Cushing’s disease requires effective medical therapy as a complementary treatment.
Tumor growth is at least partially determined by cell proliferation, the progression of the cell cycle, and an interruption of apoptosis.7 The PTTG1 oncogene was first cloned from the pituitary tumor of rat,8 and PTTG1 has since been identified as a signature gene expressed by pituitary tumors.9,10 PTTG1 is involved in several important processes, including cell-cycle progression, increased pituitary-cell proliferation, and the promotion of murine pituitary development.11,12 Our previous study demonstrated that a decrease in PTTG1 levels contributed to a decrease in AtT20 corticotroph tumor-cell proliferation.13 Histone-acetylation modification has also been identified as playing an important role in the control of PTTG1 expression.14 In contrast, the stress-responsive GADD45 gene family is involved in a range of related processes that include the maintenance of genomic stability, DNA repair, and active DNA demethylation, as well as cell-cycle control, cell survival, and apoptosis.15 Additionally, GADD45β is both a putative downstream target of p53 and a novel pituitary suppressor that blocks proliferation, survival, and tumorigenesis when expressed.16
Mutations in the deubiquitinase gene USP8 have been found in ACTH-producing pituitary adenoma cells derived from humans.17 A mutational hotspot hyperactivates USP8, contributing to the rescue of EGFR from lysosomal degradation and ensuring EGFR-stimulatory signaling in Cushing’s disease. The Jak–STAT pathway is located downstream of EGFR signaling. Therefore, a Jak2 inhibitor might be an effective treatment for EGFR-related tumors.
SD1029, a compound initially used as an antifungal agent, is a potent, cell-permeable Jak2 inhibitor that blocks cell-cycle progression and both suppresses tumor cell proliferation and induces cellular differentiation.18 SD1029 inhibits the nuclear translocation of STAT3, and then targets the antiapoptotic proteins of activated STAT3.19 The present study involved the application of SD1029 to AtT20 corticotroph tumor cells and revealed its effects on cell proliferation and ACTH production. To elucidate other potential mechanisms of SD1029 action, we also assessed the roles of GADD45β and PTTG1 in these effects.
Materials and methods
Materials
SD1029 was acquired from Merck KGaA (Darmstadt, Germany) and used throughout the study as a standardized solution. After dissolving SD1029 in dimethyl sulfoxide, it was diluted further with cell-culture medium to between 100 nM and 10 μM. Many of the cell-culture conditions, techniques, and protocols used by Nakada et al were adapted for use in the current study.13
Cell-culture conditions
AtT20 pituitary corticotroph tumor cells were obtained from ATCC (Manassas, VA, USA). Cells were cultured in DMEM with 10% FBS, 100 μg/mL streptomycin, and 100 U/mL penicillin in T75 culture flasks at 37°C under a humidified 5% CO2 atmosphere. AtT20 cells were subsequently cultured in six-well plates at a density of 1.5×10⁵ cells/well for 3 days prior to each experiment, and culture medium was exchanged with fresh medium every 48 hours. Exogenous factors within the FBS were minimized 1 day prior to each experiment by washing and serum-starving the AtT20 cells overnight with DMEM supplemented with 0.2% bovine serum albumin. Total cellular RNA or protein was collected at the conclusion of each experiment and then stored at −80°C until use.
RNA extraction and quantitative real-time PCR
Both RNA extraction and quantitative real-time polymerase chain reaction (PCR) generally followed the procedures outlined by Nakada et al.13 For the control and experimental treatments, AtT20 cells were incubated for the times indicated in each figure with medium alone or medium containing SD1029. Dose-dependent SD1029 effects were induced by incubating AtT20 cells for the times indicated under control or experimental SD1029 conditions, with a gradient of SD1029 concentrations ranging from 100 nM to 10 μM. Total cellular RNA was extracted using an RNeasy minikit (Qiagen, Venlo, the Netherlands) according to the manufacturer’s protocol at the conclusion of each experiment. Then, 0.5 μg of RNA was used as a template for synthesizing cDNA with random hexamer primers using the SuperScript first-strand synthesis system for reverse-transcription PCR (Thermo Fisher Scientific, Waltham, MA, USA) according to the manufacturer’s instructions.
In accordance with the study by Nakada et al,13 both total cellular RNA extraction and cDNA synthesis were performed.20,21 Real-time PCR was performed using the resulting cDNA. Transcript-specific primer and probe sets (Assays-on-Demand gene-expression products; Thermo Fisher Scientific) were used to perform quantitative real-time PCR to assay the expression levels of three mRNA mouse transcripts: POMC (NM_008895.3), PTTG1 (NM_001131054.1), and GADD45β (NM_008655.1). To standardize gene-expression levels, B2MG was used as a reference gene. Across all treated samples, B2MG mRNA levels did not significantly differ from those of controls. The 25 μL real-time PCR reactions contained TaqMan universal PCR master mix (Thermo Fisher Scientific), gene-expression products (Assays-on-Demand) for each of the transcripts (with Mm00437762_m1 for B2MG, Mm00435874_m1 for POMC, Mm00479224_m1 for PTTG1, and Mm00435121 g1 for GADD45β), and 500 ng of cDNA. An ABI Prism 7000 sequence-detection system (Thermo Fisher Scientific) was used for amplification, with thermal cycling conditions in accordance with the study by Nakada et al: 95°C for 10 minutes, followed by 40 cycles of 95°C for 15 seconds and 60°C for 1 minute.13
In order to eliminate the risk of DNA contamination, transcript-specific primer sets and a TaqMan probe spanning exon–exon junctions were used in each of the real-time PCR assays. All expression data were expressed as a function of the threshold cycle (CT) for quantitative analyses using the ABI Prism 7000. Analyses that used diluted samples of genes of interest (POMC, PTTG1, and GADD45β) and the reference gene (B2MG) revealed identical amplification efficiency.
ACTH assay
Following the procedure outlined by Nakada et al,13 AtT20 cells were incubated for 24 hours at 37°C with a gradient of SD1029 concentrations. A sample of each incubation medium was then aspirated, and ACTH levels in the supernatants were measured using an ACTH enzyme-linked immunosorbent assay kit (MD Bioproducts, Zurich, Switzerland). As determined by Nakada et al,13 intra- and interassay coefficients of variation are 6.7% at 42.2 pg/mL and 7.1% at 42.3 pg/mL ACTH. The coefficients of variation for ACTH fragment (amino acids 1–24), ACTH fragment (amino acids 18–39), and α-melanocyte-stimulating hormone were −3.4%, −2.4%, and −1.7%, respectively.
Cell-proliferation, cell-death, and cell-cycle assays
Protocols again reflected those of Nakada et al for cell-proliferation, cell-death, and cell-cycle assays.13 A range of SD1029 concentrations were used for AtT20-cell incubation at 37°C for 48 hours. The Cell Counting Kit 8 (Dojindo, Kumamoto, Japan) was used to assess the number of viable cells for all samples from each treatment.
The same AtT20 cells in the same SD1029 conditions were incubated at 37°C for 24 hours for the cell-death assay. A cell death-detection enzyme-linked immunosorbent-assay kit (Hoffman-La Roche, Basel, Switzerland) was used to measure DNA fragmentation, and each enrichment factor was calculated according to the manufacturer’s protocol.
Cell-cycle assays were conducted following a 24-hour incubation period for AtT20 cells in either control medium or a 10 μM SD1029 medium. Cells were harvested after trypsinization of the cell cultures, centrifugation, and resuspension of the cell pellets in Triton X-100. After treatment with 0.5% RNase A, the resuspended cells were incubated at 37°C for 30 minutes with 50 μg/mL propidium iodide, a fluorescent intercalating agent. Fluorescence-activated cell sorting (FACS) was used to analyze the stained cellular DNA content. The resulting flow-cytometry images were analyzed using FACSDiva (Becton Dickinson, Franklin Lakes, NJ, USA) to determine cell-cycle profiles.
RNA-interference experiments
Both PTTG1- and GADD45β-specific siRNA fragments and control siRNAs were designed. All siRNA fragments were purchased from Qiagen. HiPerfect transfection reagent (Qiagen) was used to transfect AtT20 cells with siRNA fragments following the manufacturer’s protocol. Target mRNA levels in samples were determined from cells that were seeded in 12-well plates at a density of 12×104 cells/well; cultures were incubated for 48 hours in 1 mL of culture medium containing control siRNA (siControl) or the experimental siRNAs, that is, the PTTG1-specific siRNA (siPTTG1; Mm_Pttg1_7) or the GADD45β-specific siRNA (siGADD45β; Mm_GADD45β_4). PTTG1, GADD45β, POMC, and B2MG transcript levels were then assayed via quantitative reverse-transcription PCR. Cell proliferation was measured from cells cultured in 200 μL of culture medium containing siRNA fragments in 96-well plates (1.5×10⁴ cells/well density); the medium was changed after 24 hours of incubation. Cell viability was measured at 48 hours posttransfection using the Cell Counting Kit 8.
Western blot analysis
Western blot analysis was conducted following the protocol described by Yamagata et al, with minor modifications.22 Protein expression of phosphorylated STAT3/STAT3 in AtT20 cells was assessed by Western blot analysis. After being washed twice with phosphate-buffered saline, cells were lysed with Laemmli sample buffer and centrifuged to remove cell debris. The supernatant was recovered from samples, which were boiled to denature the proteins, and electrophoresed on a 4%–20%-gradient polyacrylamide gel. After electrophoresis, the proteins were cross-linked to a polyvinylidene fluoride membrane (Daiichi Kagaku, Tokyo, Japan). Detector Block buffer (Kirkegaard and Perry Laboratories, Gaithersburg, MD, USA) was used to block the cross-linked proteins on the membrane, followed by a 1-hour incubation with a 1/1,000 dilution of anti-STAT3 antibody (Cell Signaling Technology, Danvers, MA, USA) or a 1/1,000 dilution of anti-pSTAT3 antibody (Cell Signaling Technology). Membranes were washed with 0.05% Tween 20 phosphate-buffered saline, followed by incubation with horseradish peroxidase-labeled antirabbit immunoglobulin G (Daiichi Kagaku). SuperSignal West Pico chemiluminescent substrate (Pierce Chemical, Dallas, TX, USA) was used to detect antibodies, after which the membrane was exposed to BioMax film (Eastman Kodak, Rochester, NY, USA) for visualization.
Statistical analyses
Each in vitro experiment was performed in triplicate. Following Nakada et al,13 within each group of experiments, samples were run in duplicate or triplicate. Data were recorded, and are presented as mean ± SE. Analysis of variance (ANOVA) and subsequent Fisher’s protected least significant difference post hoc tests or unpaired Student’s t-tests were used to analyze the data, and P<0.05 was considered significant.
Results
Effect of SD1029 on POMC transcript and ACTH levels
To determine the dose- and time-dependent effects of SD1029 on POMC mRNA levels, AtT20 cells were incubated with the compound at various concentrations and for various incubation periods. POMC mRNA levels were significantly decreased by 10 μM SD1029 (ANOVA, P<0.05); over the course of a 24-hour SD1029 incubation, POMC transcript levels were reduced to 69% of levels in the control (Figure 1A). Additionally, POMC transcript levels decreased in a dose-dependent manner throughout SD1029 incubations (ANOVA, P<0.05), with significant effects occurring at a concentration of 10 μM (Figure 1B). Similarly, ACTH levels of the cell-culture medium also decreased significantly under SD1029 treatment for an SD1029 concentration of 10 μM (P<0.0001, Figure 1C).
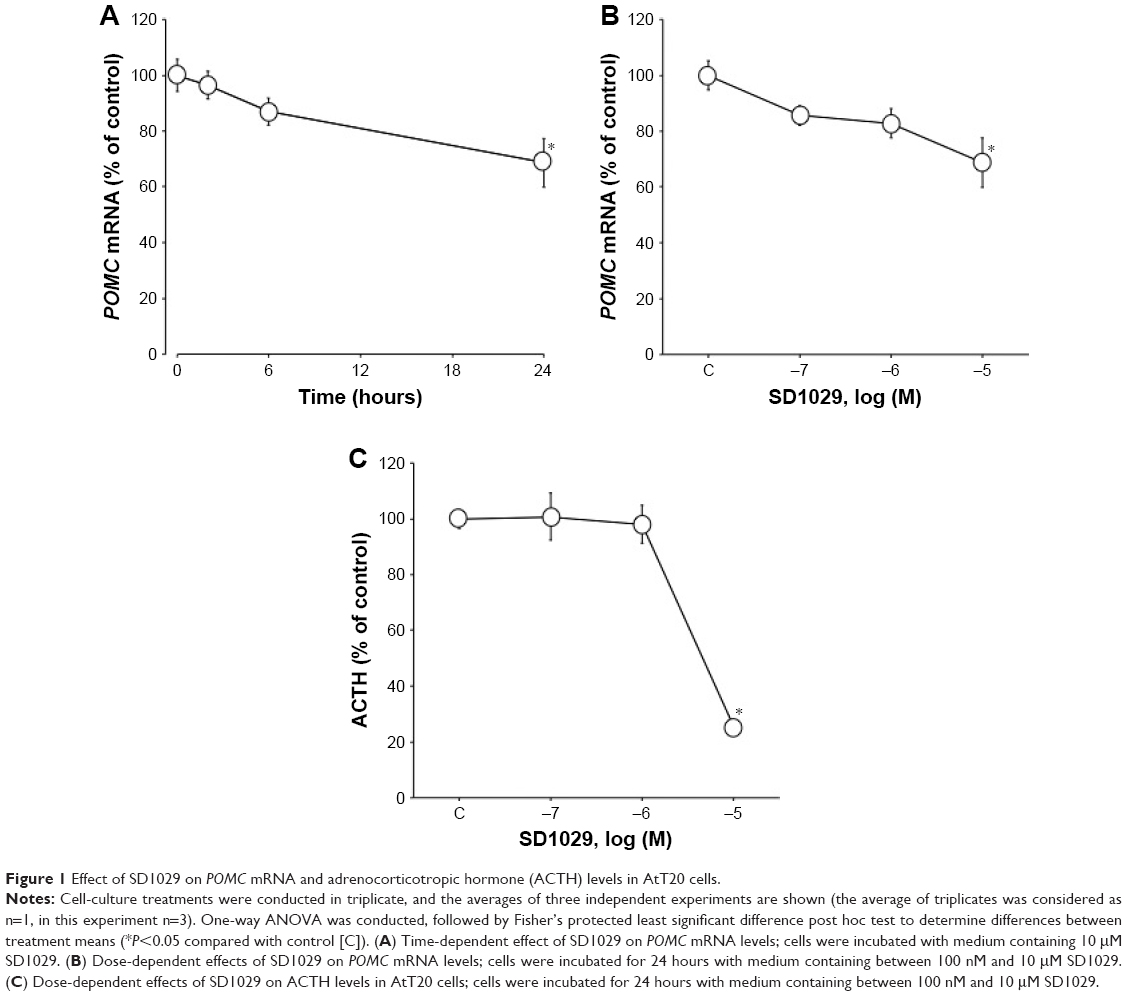 | Figure 1 Effect of SD1029 on POMC mRNA and adrenocorticotropic hormone (ACTH) levels in AtT20 cells. |
SD1029 effects on cell proliferation and death
The effects of SD1029 on the proliferation and death of AtT20 cells were also revealed through SD1029 incubations. Cell proliferation exhibited a dose-dependent decrease under SD1029 treatments, with significant (ANOVA, P<0.0005) effects observed at 10 μM (Figure 2A). Cytoplasmic histone-associated DNA fragmentation was used as a proxy for cell-death induction by SD1029; again, at 10 μM SD1029 concentration, DNA fragmentation increased significantly (Figure 2B).
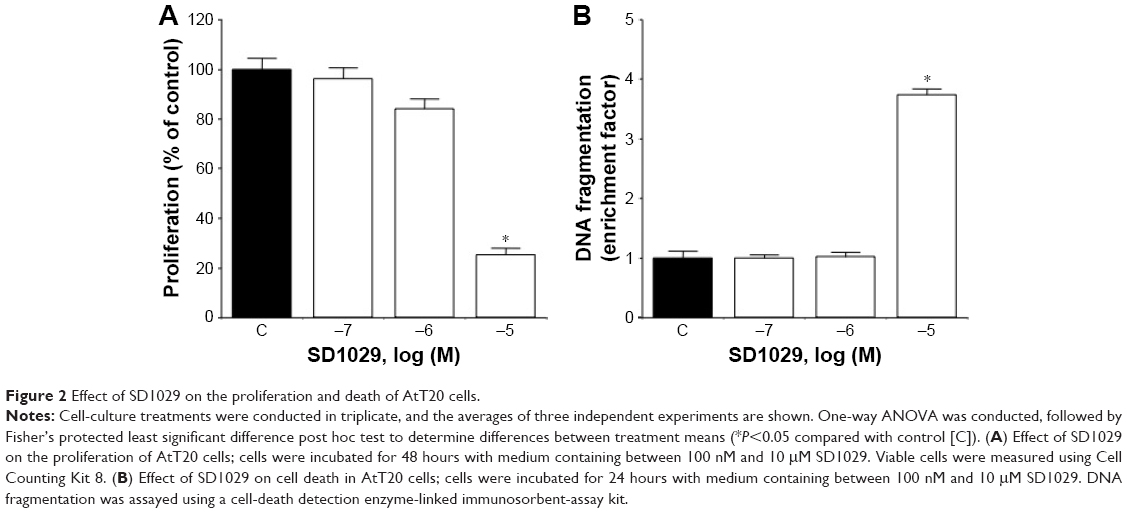 | Figure 2 Effect of SD1029 on the proliferation and death of AtT20 cells. |
SD1029 effects on cell-cycle profile
Flow cytometry was used to assess the cell-cycle distribution of the cultures. FACS analyses indicated that the percentages of G0/G1, S, and G2/M phase cells were not modulated by incubation with SD1029 at 10 μM (Figure 3).
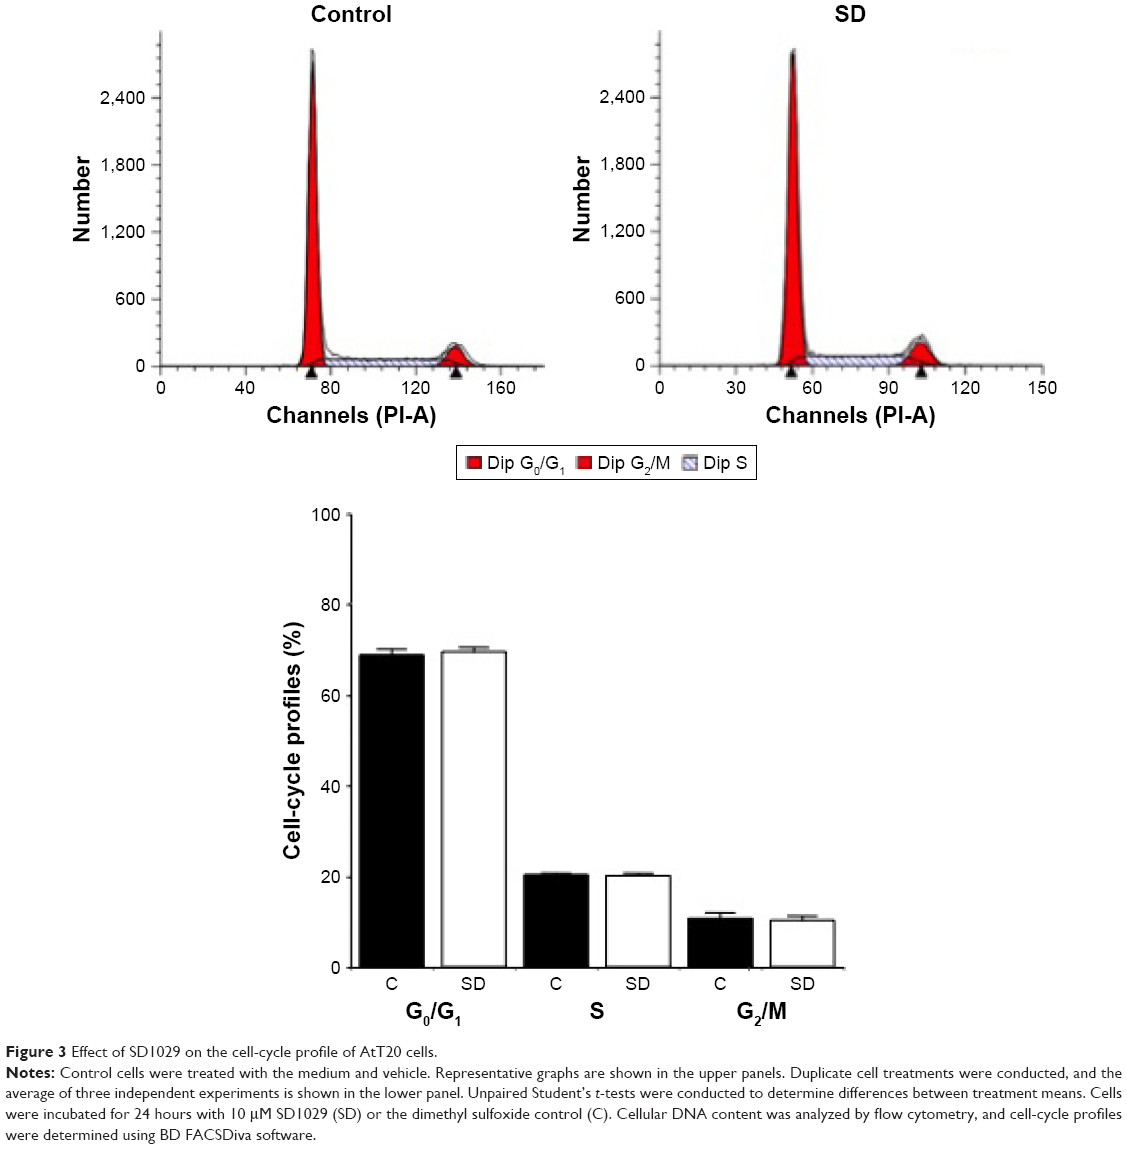 | Figure 3 Effect of SD1029 on the cell-cycle profile of AtT20 cells. |
SD1029 effects on PTTG1 and GADD45β transcript levels
Time-course cultures indicated that 10 μM SD1029 significantly decreased and subsequently increased PTTG1 (ANOVA, P<0.05) and GADD45β transcript levels (ANOVA, P<0.0001). Within the first 24 hours of SD1029 incubation, PTTG1 transcript levels decreased to 77% of the level of the control treatment (Figure 4A); additionally, PTTG1 levels decreased as SD1029 concentrations increased (ANOVA, P<0.005), with significant effects initially occurring at 10 μM SD1029 (Figure 4B). SD1029 also significantly increased GADD45β transcript levels in a time- and dose-dependent manner (Figure 4C and D).
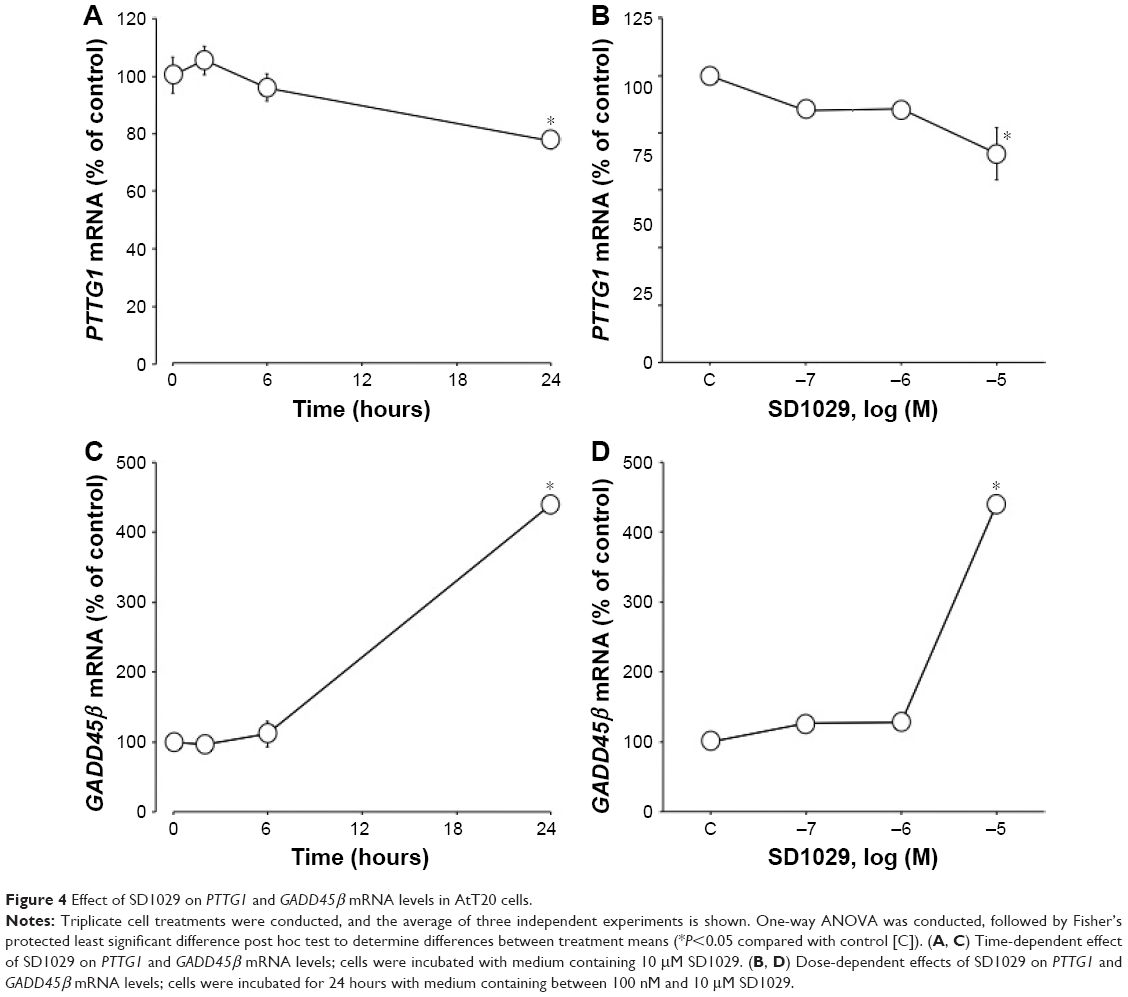 | Figure 4 Effect of SD1029 on PTTG1 and GADD45β mRNA levels in AtT20 cells. |
Effects of PTTG1 and GADD45β on POMC transcript levels and cell proliferation
The roles of PTTG1 and GADD45β, gene candidates for cell-proliferation regulation, were also examined in AtT20 cells. After transfection with transcript-specific siRNA fragments, PTTG1 and GADD45β mRNA levels were reduced by 42% and 67%, respectively. PTTG1 knockdown and SD1029 each individually induced a significant decrease in POMC transcript levels (ANOVA, P<0.001, Figure 5A). Combined treatment with PTTG1 knockdown and SD1029 had no additive effect on POMC transcript levels (P<0.001, Figure 5A). PTTG1 knockdown or SD1029 alone significantly inhibited cell proliferation (P<0.05, Figure 5B). Combined treatment with PTTG1 knockdown and SD1029 had no additive effect on cell proliferation (P<0.001, Figure 5B).
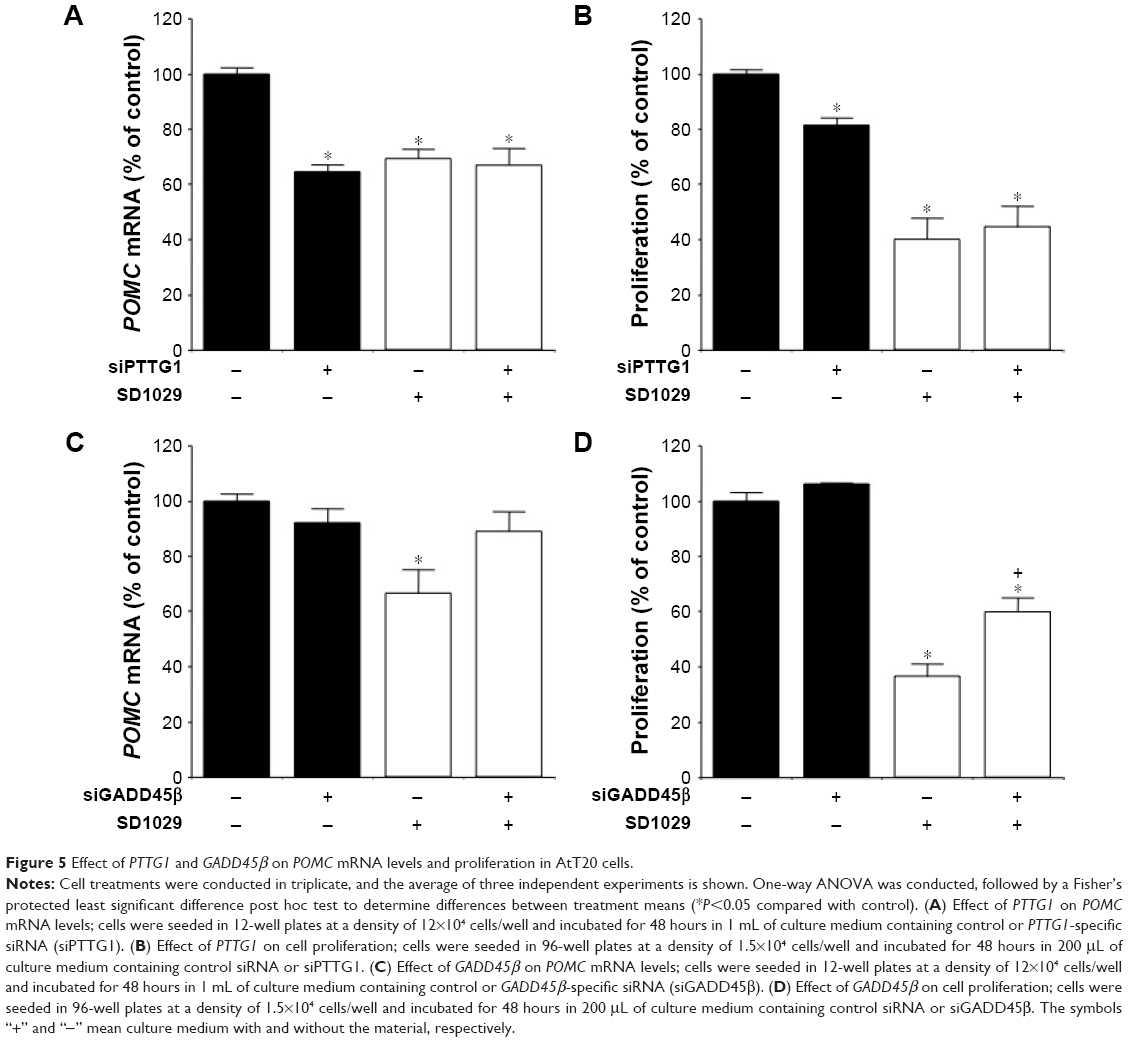 | Figure 5 Effect of PTTG1 and GADD45β on POMC mRNA levels and proliferation in AtT20 cells. |
GADD45β knockdown did not modify basal POMC mRNA levels or cell proliferation (Figure 5C and D). SD1029 significantly decreased POMC mRNA levels and cell proliferation. GADD45β knockdown also significantly inhibited the decrease in POMC mRNA levels (Figure 5C), and its knockdown partially inhibited the observed decrease in cell proliferation (Figure 5D).
Time-dependent changes in SD1029-induced STAT3 phosphorylation
AtT20 cells were incubated with 10 μM SD1029 to determine their effects on STAT3 phosphorylation. Time-course incubation revealed that SD1029 significantly inhibited STAT3 phosphorylation from 15 to 120 minutes during the incubation period (ANOVA, P<0.0001, Figure 6).
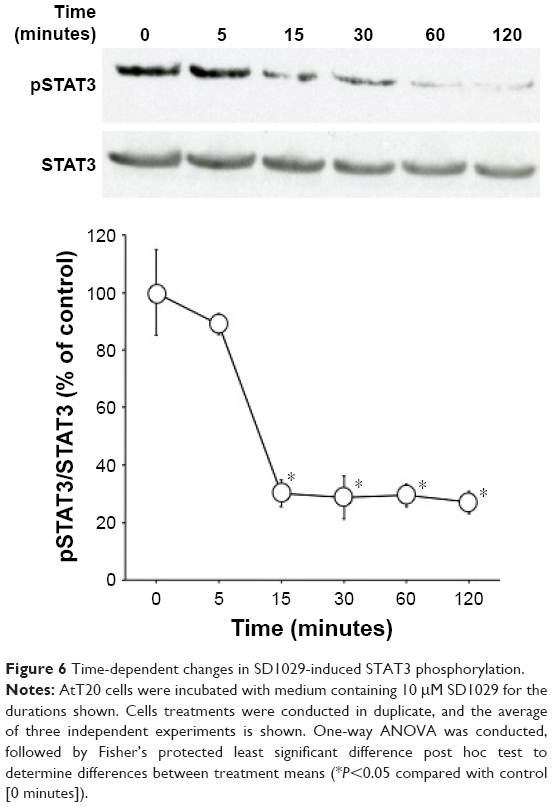 | Figure 6 Time-dependent changes in SD1029-induced STAT3 phosphorylation. |
Discussion
This study demonstrated that application of the Jak2 inhibitor SD1029 to AtT20 cell cultures decreased both POMC transcript levels and basal ACTH levels. These in vitro experiments suggest the Jak2 inhibitor suppresses both the autonomic synthesis and release of ACTH in corticotroph tumor cells. SD1029 was also found to inhibit AtT20-cell proliferation. This is supported by previous research on SD1029 that showed the compound increases DNA fragmentation in AtT20 cells, implicating it in the induction of cell death in corticotroph tumor cells.23,24 FACS analyses indicated that SD1029 did not modulate the percentage of AtT20 cells in any phase of the cell cycle, suggesting that this compound does not attenuate cell-cycle progression, nor does it arrest the cell cycle.23 ACTH production is dependent upon both cell proliferation and synthesis; as such, decreased overall cell growth via apoptosis may contribute to the decreased ACTH levels observed in the culture medium.
PTTG1 is a key signaling molecule in pituitary tumors,25 and is known to facilitate cell-cycle progression and increase pituitary-cell proliferation.12 Accordingly, the overexpression of PTTG1 results in the proliferation of pituitary gonadotroph cells.10 Previous studies have shown that histone deacetylases or HSP90 inhibitors repress PTTG1 mRNA levels.13,26 In the present study, the application of SD1029 to AtT20 cells gradually decreased PTTG1 transcript levels. PTTG1 was implicated by these AtT20 cell-culture experiments in the Jak2 inhibitor-induced suppression of cell proliferation. Moreover, PTTG1 knockdown inhibited POMC transcript levels and cell proliferation in the current study; however, combined treatment with PTTG1 knockdown and SD1029 had no additive effect on POMC transcript levels or cell proliferation. Combined, PTTG1 is at least partially implicated in the Jak2-induced suppression of ACTH synthesis and cell proliferation that was observed in AtT20 cells.
GADD45β, a putative downstream target of the tumor-suppressing protein p53, has been shown to inhibit cell proliferation and survival in normal, healthy pituitary tissues.16 Accordingly, a loss-of-function mutation in GADD45β may contribute to the initiation and/or progression of tumorigenesis in human gonadotroph tumors.16 Overall, SD1029 increased GADD45β mRNA levels. SD1029 also decreased POMC mRNA levels and cell proliferation. GADD45β knockdown inhibited SD1029-induced decreases in POMC mRNA levels, suggesting that GADD45β may also be involved in the Jak2 inhibitor-induced suppression of POMC mRNA levels. Its knockdown also partially inhibited the decrease in cell proliferation. Therefore, the GADD45β pathway may be involved in the suppression of proliferation in corticotroph tumor cells.
EGFR signaling induces POMC mRNA levels and ACTH secretion in corticotroph tumors.27 Accordingly, blocking EGFR-tyrosine activity suppresses ACTH production and hence tumor growth.27 Cleavage of USP8 contributes to increased deubiquitination of EGFR, impairing its downregulation and enhancing cellular EGFR signaling.17 Therefore, this receptor may be a candidate target for Cushing’s disease therapies. The Jak–STAT pathway is located downstream of the EGFR-signaling pathway.28 Therefore, Jak2/STAT3 signaling is a critical element in EGFR-driven migration and invasion29 and a potential target for cancer therapy.30 STAT3 is also required for POMC transcription.31 Indeed, STAT3 has been shown directly to regulate POMC in the pituitary and hypothalamus.31,32 The tolerance of normal cells to the loss of Jak2/STAT3 function has driven recent research efforts to identify molecules capable of Jak2/STAT3 inhibition,19 yielding SD1029 as a novel potent Jak2 and STAT3 inhibitor. In our study, SD1029 decreased STAT3 phosphorylation in corticotroph AtT20 tumor cells. EGFR-dependent Jak2/STAT3 therapies have potential clinical implications for treating Cushing’s disease.
Conclusion
In AtT20 cell, SD1029 decreased POMC transcript and ACTH levels and proliferation. Additionally, SD1029 decreased and increased PTTG1 and GADD45β transcript levels, respectively. Both PTTG1 and GADD45β may be responsible, at least partially, for the Jak2-induced suppression of cell proliferation and ACTH synthesis. SD1029 decreased STAT3 phosphorylation. Accordingly, research on Cushing’s disease therapies should focus on EGFR-dependent Jak2/STAT3 therapies.
Acknowledgment
We thank the Department of Social Medicine, Hirosaki University Graduate School of Medicine for assistance with the FACS analysis.
Author contributions
All authors made substantial contributions to conception and design, acquisition of data, or analysis and interpretation of data; took part in drafting the article or revising it critically for important intellectual content; gave final approval of the version to be published; and agreed to be accountable for all aspects of the work. All authors contributed toward data analysis, drafting and critically revising the paper and agree to be accountable for all aspects of the work.
Disclosure
The authors report no conflicts of interest in this work.
References
Nieman LK, Biller BM, Findling JW, et al. The diagnosis of Cushing’s syndrome: an Endocrine Society clinical practice guideline. J Clin Endocrinol Metab. 2008;93(5):1526–1540. | ||
Kageyama K, Oki Y, Sakihara S, Nigawara T, Terui K, Suda T. Evaluation of the diagnostic criteria for Cushing’s disease in Japan. Endocr J. 2013;60(2):127–135. | ||
Biller BM, Grossman AB, Stewart PM, et al. Treatment of adrenocorticotropin-dependent Cushing’s syndrome: a consensus statement. J Clin Endocrinol Metab. 2008;93(7):2454–3462. | ||
Rhode PR, Gorski J. Growth and cell cycle regulation of mRNA levels in GH3 cells. Mol Cell Endocrinol. 1991;82(1):11–22. | ||
Bertagna X, Guignat L. Approach to the Cushing’s disease patient with persistent/recurrent hypercortisolism after pituitary surgery. J Clin Endocrinol Metab. 2013;98(4):1307–1318. | ||
Schteingart DE. Drugs in the medical treatment of Cushing’s syndrome. Expert Opin Emerg Drugs. 2009;14(4):661–671. | ||
Kageyama K, Sugiyama A, Murasawa S, et al. Aphidicolin inhibits cell proliferation via the p53-GADD45β pathway in AtT-20 cells. Endocr J. 2015;62(7):645–654. | ||
Pei L, Melmed S. Isolation and characterization of a pituitary tumor-transforming gene (PTTG). Mol Endocrinol. 1997;11(4):433–441. | ||
Zhang X, Horwitz GA, Heaney AP, et al. Pituitary tumor transforming gene (PTTG) expression in pituitary adenomas. J Clin Endocrinol Metab. 1999;84(2):761–767. | ||
Chesnokova V, Zonis S, Zhou C, et al. Lineage-specific restraint of pituitary gonadotroph cell adenoma growth. PLoS One. 2011;6(3):e17924. | ||
Hernández A, López-Lluch G, Bernal JA, Navas P, Pintor-Toro JA. Dicoumarol down-regulates human PTTG1/Securin mRNA expression through inhibition of Hsp90. Mol Cancer Ther. 2008;7(3):474–482. | ||
Chesnokova V, Zonis S, Wawrowsky K, et al. Clusterin and FOXL2 act concordantly to regulate pituitary gonadotroph adenoma growth. Mol Endocrinol. 2012;26(12):2092–2103. | ||
Nakada Y, Kageyama K, Sugiyama A, et al. Inhibitory effects of trichostatin A on adrenocorticotropic hormone production and proliferation of corticotroph tumor AtT-20 cells. Endocr J. 2015;62(12):1083–1090. | ||
Hernández A, López-Lluch G, Navas P, Pintor-Toro JA. HDAC and Hsp90 inhibitors down-regulate PTTG1/securin but do not induce aneuploidy. Genes Chromosomes Cancer. 2009;48(2):194–201. | ||
Hoffman B, Liebermann DA. Gadd45 in modulation of solid tumors and leukemia. Adv Exp Med Biol. 2013;793:21–33. | ||
Michaelis KA, Knox AJ, Xu M, et al. Identification of growth arrest and DNA-damage-inducible gene β (GADD45 β) as a novel tumor suppressor in pituitary gonadotrope tumors. Endocrinology. 2011;152(10):3603–3613. | ||
Reincke M, Sbiera S, Hayakawa A, et al. Mutations in the deubiquitinase gene USP8 cause Cushing’s disease. Nat Genet. 2015;47(1):31–38. | ||
Duan Z, Bradner JE, Greenberg E, et al. SD-1029 inhibits signal transducer and activator of transcription 3 nuclear translocation. Clin Cancer Res. 2006;12(22):6844–6852. | ||
Yang C, Schwab JH, Schoenfeld AJ, et al. A novel target for treatment of chordoma: signal transducers and activators of transcription 3. Mol Cancer Ther. 2009;8(9):2597–2605. | ||
Kageyama K, Hanada K, Suda T. Differential regulation of urocortins1–3 mRNA in human umbilical vein endothelial cells. Regul Pept. 2009;155(1–3):131–138. | ||
Kageyama K, Hanada K, Suda T. Differential regulation and roles of urocortins in human adrenal H295R cells. Regul Pept. 2010;162(1–3):18–25. | ||
Yamagata S, Kageyama K, Akimoto K, Watanuki Y, Suda T, Daimon M. Regulation of corticotropin-releasing factor and urocortin 2/3 mRNA by leptin in hypothalamic N39 cells. Peptides. 2013;50:1–7. | ||
Murasawa S, Kageyama K, Sugiyama A, et al. Inhibitory effects of SOM230 on adrenocorticotropic hormone production and corticotroph tumor cell proliferation in vitro and in vivo. Mol Cell Endocrinol. 2014;394(1–2):37–46. | ||
Tanase C, Albulescu R, Codrici E, et al. Decreased expression of APAF-1 and increased expression of cathepsin B in invasive pituitary adenoma. Onco Targets Ther. 2014;8:81–90. | ||
Tanase CP, Neagu M, Albulescu R. Key signaling molecules in pituitary tumors. Expert Rev Mol Diagn. 2009;9(8):859–877. | ||
Sugiyama A, Kageyama K, Murasawa S, Ishigame N, Niioka K, Daimon M. Inhibition of heat shock protein 90 decreases ACTH production and cell proliferation in AtT-20 cells. Pituitary. 2014;18(4):542–553. | ||
Fukuoka H, Cooper O, Ben-Shlomo A, et al. EGFR as a therapeutic target for human, canine, and mouse ACTH-secreting pituitary adenomas. J Clin Invest. 2011;121(12):4712–4721. | ||
Andl CD, Mizushima T, Oyama K, Bowser M, Nakagawa H, Rustgi AK. EGFR-induced cell migration is mediated predominantly by the JAK-STAT pathway in primary esophageal keratinocytes. Am J Physiol Gastrointest Liver Physiol. 2004;287(6):G1227–G1237. | ||
Zheng Q, Han L, Dong Y, et al. JAK2/STAT3 targeted therapy suppresses tumor invasion via disruption of the EGFRvIII/JAK2/STAT3 axis and associated focal adhesion in EGFRvIII-expressing glioblastoma. Neuro Oncol. 2014;16(9):1229–1243. | ||
Cruceru ML, Enciu AM, Popa AC, et al. Signal transduction molecule patterns indicating potential glioblastoma therapy approaches. Onco Targets Ther. 2013;6:1737–1749. | ||
Xu AW, Ste-Marie L, Kaelin CB, Barsh GS. Inactivation of signal transducer and activator of transcription 3 in proopiomelanocortin (Pomc) neurons causes decreased Pomc expression, mild obesity, and defects in compensatory refeeding. Endocrinology. 2007;148(1):72–80. | ||
Bousquet C, Zatelli MC, Melmed S. Direct regulation of pituitary proopiomelanocortin by STAT3 provides a novel mechanism for immuno-neuroendocrine interfacing. J Clin Invest. 2000;106(11):1417–1425. |
 © 2017 The Author(s). This work is published and licensed by Dove Medical Press Limited. The full terms of this license are available at https://www.dovepress.com/terms.php and incorporate the Creative Commons Attribution - Non Commercial (unported, v3.0) License.
By accessing the work you hereby accept the Terms. Non-commercial uses of the work are permitted without any further permission from Dove Medical Press Limited, provided the work is properly attributed. For permission for commercial use of this work, please see paragraphs 4.2 and 5 of our Terms.
© 2017 The Author(s). This work is published and licensed by Dove Medical Press Limited. The full terms of this license are available at https://www.dovepress.com/terms.php and incorporate the Creative Commons Attribution - Non Commercial (unported, v3.0) License.
By accessing the work you hereby accept the Terms. Non-commercial uses of the work are permitted without any further permission from Dove Medical Press Limited, provided the work is properly attributed. For permission for commercial use of this work, please see paragraphs 4.2 and 5 of our Terms.