")
Back to Journals » OncoTargets and Therapy » Volume 14
Inhibitory Effect of Crocin Against Gastric Carcinoma via Regulating TPM4 Gene
Authors Luo Y, Yu P, Zhao J, Guo Q, Fan B, Diao Y, Jin Y, Wu J, Zhang C
Received 16 March 2020
Accepted for publication 21 November 2020
Published 7 January 2021 Volume 2021:14 Pages 111—122
DOI https://doi.org/10.2147/OTT.S254167
Checked for plagiarism Yes
Review by Single anonymous peer review
Peer reviewer comments 2
Editor who approved publication: Professor Gaetano Romano
Yushuang Luo, Pengjie Yu, Junhui Zhao, Qijing Guo, Baohua Fan, Yinzhuo Diao, Yulong Jin, Jing Wu, Chengwu Zhang
Department of Oncology, Affiliated Hospital of Qinghai University, Xining 810001, People’s Republic of China
Correspondence: Chengwu Zhang
Department of Oncology, Affiliated Hospital of Qinghai University, Xining 810001, People’s Republic of China
Email [email protected]
Background: Gastric cancer (GC) is one of the most common malignant tumors and the second most frequent cause of cancer death worldwide. Crocin is a kind of bioactive constituent found in the stigmas of saffron, which has shown various pharmacological activities.
Methods: In this study, we investigated the inhibitory effect of crocin on gastric cancer AGS cells proliferation and explored the underlying mechanism. A series of methods were used including cell counting kit assay, gene microarray analysis, qRT-PCR, Celigo image cytometry, cell clone formation assay, Western blot, and cell xenograft growth in vivo.
Results: The results indicated that crocin inhibited AGS cells proliferation and promoted cell apoptosis. Further studies suggested that crocin decreased a series of genes expression, among which TPM4 gene downregulation inhibited the tumor cells proliferation and tumor growth in mice, and overexpression of TPM4 gene abolishes the inhibitory effect of crocin. Further study using microarray analysis suggested that knocking down of TPM4 altered genes related to the proliferation and apoptosis of cells.
Discussion: Crocin could inhibit the gastric cancer cells AGS cells proliferation by regulating TPM4 gene expression, and TPM4 may be a promising therapeutic target for GC treatment.
Keywords: gastric cancer, crocin, TPM4, HER2
Introduction
Gastric cancer (GC) is one of the most common malignant tumors and the second most frequent cause of cancer death worldwide, with one million new cases every year.1,2 Gastric cancer becomes symptomatic in the advanced stage, making 5-year survival rates poor in most areas in the world because of the late diagnosis.3,4 Although the most common and recommended treatment for GC, chemotherapy, could improve the overall survival for patients after surgery, the overall survival is still unoptimistic.5 The only targeted drug, trastuzumab, which was approved by FDA in 2010 for the treatment of locally advanced and metastatic HER2-positive GC, cannot meet the need of HER-2 negative patients. So, it is of vital importance to find a new agent for GC treatment.
A growing number of herbal medicine monomers have been extracted and identified, which exhibit the effects on the inhibition of tumor cell proliferation, angiogenesis, invasion, and metastasis, and improve multidrug resistance.6–10 Crocin is a kind of bioactive constituent found in the stigmas of saffron,11 which has shown various pharmacological activities.12–14 It was reported that crocin inhibited many types of cancer cells growth, and protected against breast cancer in rats.15–18 Our previous study showed that crocin could downregulate various gene expressions related to cell proliferation.19 Here we reported crocin’s inhibitory effect of tumor cell proliferation, and tumor growth in mice, and explained the underlying mechanism.
Materials and Methods
Tissue Collection
Fifty cases of gastric cancer patients in QingHai University affiliated hospital from July 2018 to August 2019 were collected (the information shown in Table 1). All the specimens of this project were from the biological sample bank of QingHai University affiliated hospital. All patients signed an informed consent form before the specimens were put into storage. The study was approved by the institutional ethics committee of QingHai University affiliated hospital (approval no. P-SL-2,017,065) and was performed in accordance with the Declaration of Helsinki. The inclusion criteria of patients were: 1) diagnosed with gastric cancer based on surgical pathology, 2) with relatively complete clinicopathological data, and 3) can be followed continuously. Patients with gastric adenocarcinoma or incomplete surgical and postoperative pathological data were excluded. After the specimens were isolated from the body, the samples were taken within 10 minutes and put into the RNA tube containing RNA later preservation solution, which was stored in a refrigerator at −80°C until the experimental study.
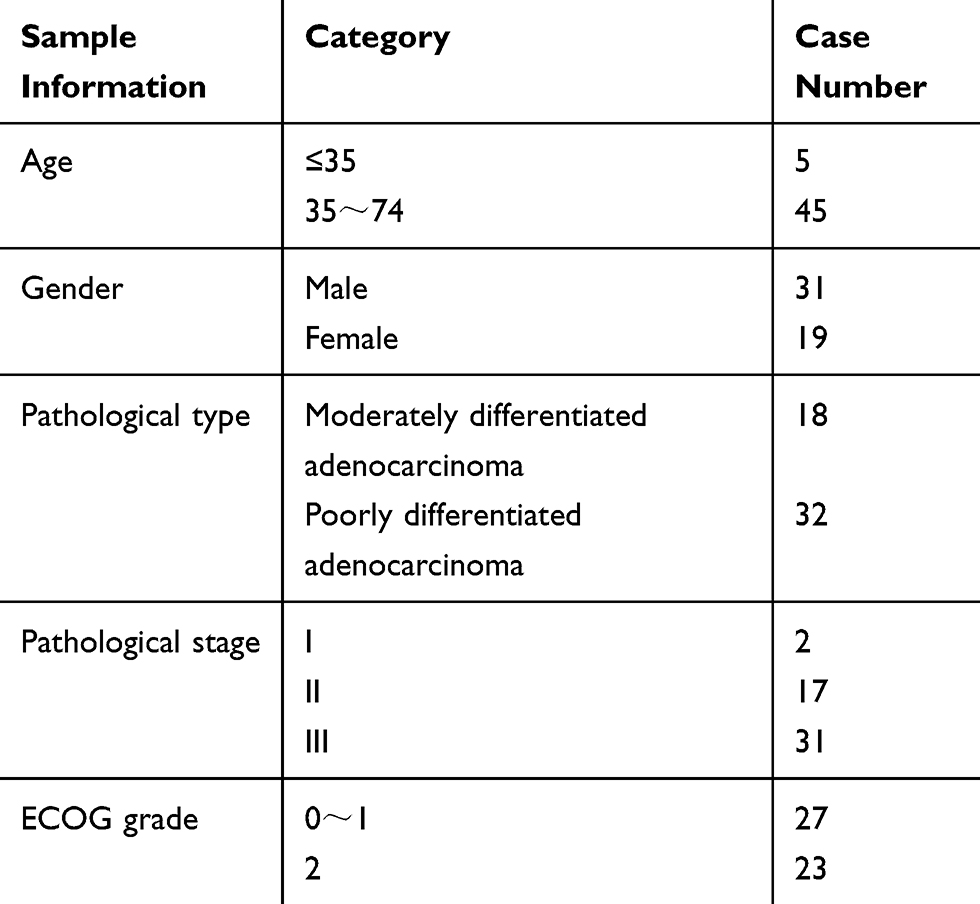 |
Table 1 The Information of Clinicopathologic Patients |
Cell Culture
AGS gastric adenocarcinoma cells (American Type Culture Collection, Manassas, VA) were grown in F-12K medium supplemented with 10% FBS, 1% penicillin, and streptomycin, and were maintained in a humidified incubator with 5% CO2. HGC-27 cells (Type Culture Collection of the Chinese Academy of Sciences, Shanghai, China) were grown in RPMI-1640 medium supplemented with 10% FBS, 1% penicillin and streptomycin, and were maintained in a humidified incubator with 5% CO2. Cell culture experiments were conducted in 6-, 12-, or 96-well polypropylene tissue culture plates (Corning Costar, Cambridge, MA).
Cell Proliferation Inhibition Test
For the experiment of crocin on the proliferation of AGS cells, AGS cells were plated in a 96-well microplate at a density of 5×10³ cells/well. Twenty-four hours after being cultured, cells were treated with different concentrations of Crocin (0, 2, 4, 6, 8, and 12 mg/mL) for 48 hours. Cell counting assay was then performed with Cell Counting Kit-8 (Dojindo Laboratories, Kumamoto, Japan). OD450 was read with a 96-well plate reader (DG5032, Hua dong, Nanjing, China).
For TPM4-RNAi stable cells screening, AGS cells were cultured in a 6-well plate at a density of 2×10⁵ cells/well. After the cells reached the confluence of 30%, the cells were treated with TPM4 knockdown lentivirus shTPM4 (6×10⁸ TU/mL, 1.67 μL) and the negative control lentivirus shCtrl (1×10⁹ TU/mL, 1 μL) for 72 hours, then 4 μg/mL puromycin was used to screen the stable transfected cells.
RNA Extraction and Reverse Transcription‑Quantitative Polymerase Chain Reaction (RT‑qPCR)
Total RNA was extracted from AGS cells treated with crocin (2.4 mg•mL−1) or not by using TRIzol® reagent (Invitrogen; Thermo Fisher Scientifc, Inc.) according to the manufacturer’s protocol. The quantity and purity of total RNA were measured with a NanoDrop spectrophotometer (Thermo Fisher, Wilmington, DE, USA). To detect the expression level of indicated genes, 1 μg of total RNA was reverse transcribed into cDNA using AMV reverse transcriptase (Takara, Japan) and a RT primer according to the manufacturer’s recommendation. The reaction conditions were: 16°C for 30 minutes, 42°C for 30 minutes, and 85°C for 5 minutes. Real-time PCR (RT-PCR) was carried out by using an Applied Biosystems 7300 sequence detection system (Applied Biosystems, USA), with GAPDH as the internal control. The reactions were performed in a 96-well plate at 95°C for 10 minutes, followed by 40 cycles of 95°C for 10 seconds, 56°C for 30 seconds, and 72°C for 30 seconds.
Celigo Image Cytometry
Celigo image cytometry was used to detect the cell proliferation after gene knockdown as previously described.20 Cells were cultured in a 6-well plate at a density of 2×10⁵ cells/well. After the cells reached the confluence of 30%, the cells were treated with TPM4 knockdown lentivirus shTPM4 (6×10⁸ TU/mL, 1.67 μL) and the negative control lentivirus shCtrl (1×10⁹ TU/mL, 1 μL) for 72 hours, then 4 μg/mL puromycin was used to screen the stable transfected cells. The shTPM4 AGS cells and shCtrl AGS cells were plated in a 96-well plate at a density of 2×10³ cells/well. After 24 hours, the plate was scanned on the Celigo image cytometry (Nexcelom, USA), and the scan was performed at the same time in the following 5 days.
Cell Clone Formation Assay
The shTPM4 AGS cells and shCtrl AGS cells were plated in a 6-well plate at a density of 600 cells/well. The cells were cultured in a humidified incubator with 5% CO2 for 14 days, then the cells were fixed with 4% formalin for 1 hour. After being washed with 1×PBS three times, the cells were stained with crystal violet (0.5%) for 5 minutes. The cells were photographed by a digital camera (SONY, DSC-HX300) and the number of clones was counted.
Western Blot Analysis
Total protein was extracted from shTPM4 AGS cells and shCtrl AGS cells by using RIPA lysis buffer (Beyotime, China) according to the manufacturer’s protocol. The concentration of the extracted total protein was measured with a BCA Protein Assay Kit (Beyotime) according to the manufacturer’s protocol. Then 40 μg total protein was electrophoresed, and transferred onto PVDF membranes, blocked with 5% milk, and incubated with primary antibodies against PCNA (1:1,000, CST, MA, China), TPM4 (1:1000, CST, MA), and GAPDH (1:2000, Santa Cruz Biotechnology, CA, USA). Following primary antibody incubation, membranes were incubated with HRP‑conjugated secondary antibodies (1:2,000, Santa Cruz Biotechnology). Protein bands were visualized using a HiSignal™ ECL WB Detection Kit (Tanon, China) according to the manufacturer’s protocol.
Cell Apoptosis Assay
shTPM4 AGS cells and shCtrl AGS cells were plated in a 6-well plate at a density of 2×10⁵ cells/well. After the cells reached 70% confluence, the cells were collected and resuspended in cold PBS. After centrifugation, the supernatant was discarded and 100 μL 1×binding buffer was added into each sample. The cells were then stained with Annexin V-FITC/PI with an Apoptosis Detection Kit (BD, Shanghai, China) according to the manufacturer’s protocol. The samples were then detected using a CytoFLEX flowcytometry (Beckman Coulter, CA, USA).
Tumor Growth in Nude Mice
All procedures were conducted in accordance with the NIH Guide for the Care and Use of Laboratory Animals and were approved by the Qinghai University. Balb/c nude mice (GemPharmatech, China) were maintained on a 12-hour light, 12-hour dark schedule with ad libitum access to laboratory chow and water. shTPM4 AGS cells and shCtrl AGS cells were harvested and 4×10⁶ cells were injected subcutaneously into the right side of axillary of the mice. The tumor sizes were measured with digital calipers twice a week, and tumor volumes were estimated according to the formula for an ellipse (short dimension)2×(long dimension)/2. For the treatment of the crocin, crocin was intraperitoneally injected at the dose of 6.25 mg/kg/day. The mice were anesthetized by using pentobarbital sodium (10 μL/g) and the image of tumor was detected by using the whole-body fluorescent imaging system (Perkin Elmer Lumina LT) to measure the radiant efficiency. The mice were sacrificed on the 16th day after the injection and the tumors were isolated, sized and weighed, and were photographed by digital camera (SONY, DSC-HX300).
Gene Microarray Analysis
Microarray analysis was conducted to evaluate the gene expression in TPM4-RNAi AGS cells. The cells were collected and total RNA was isolated using TRIzol® reagent (Invitrogen; Thermo Fisher Scientifc, Inc.) and purified by the RNeasy MinElute Cleanup kit (Qiagen GmbH, Hilden, Germany) according to the manufacturer’s protocol. The quantity of RNA was subsequently measured using a NanoDrop™ ND-2000 spectrophotometer (Thermo Fisher Scientifc, Inc.). The quantified samples were performed human GeneChip® PrimeView™ Human Gene Expression Array (Affymetrix, USA). The gene expression was analyzed by using the ingenuity software (www.ingenuity.com). Hierarchical clustering was used to determine the differences in the gene expression profiles using MultiExperiment Viewer software (version 4.6; The Institute for Genomic Research, Rockville, MA, USA).
Statistical Analysis
All statistical analyses were performed using SPSS software (version 18.0; SPSS, Inc., Chicago, IL, USA) or GraphPad Prism (version 6.0; GraphPad Software, Inc., La Jolla, CA, USA). Experiments were conducted three times and data are presented as the mean±SD. Differences among multiple groups were analyzed by one-way ANOVA analysis with Fisher’s LSD post-hoc test, and differences between two groups were analyzed by Student’s t-test. P<0.05 was used to indicate a statistically significant difference.
Results
Crocin Inhibited the Proliferation of Gastric Cancer Cells and Down-Regulated Various Gene Expressions
In this study, we first investigated the effect of crocin on AGS cells proliferation (Figure 1A). We detected the cell viability of AGS under different concentrations of crocin treatment using a Cell Counting Kit-8 (CCK8) assay. As shown in Figure 1, cells incubated with crocin had significantly reduced in cell amount compared with DMSO-treated control cells, which was in a dose-dependent manner.
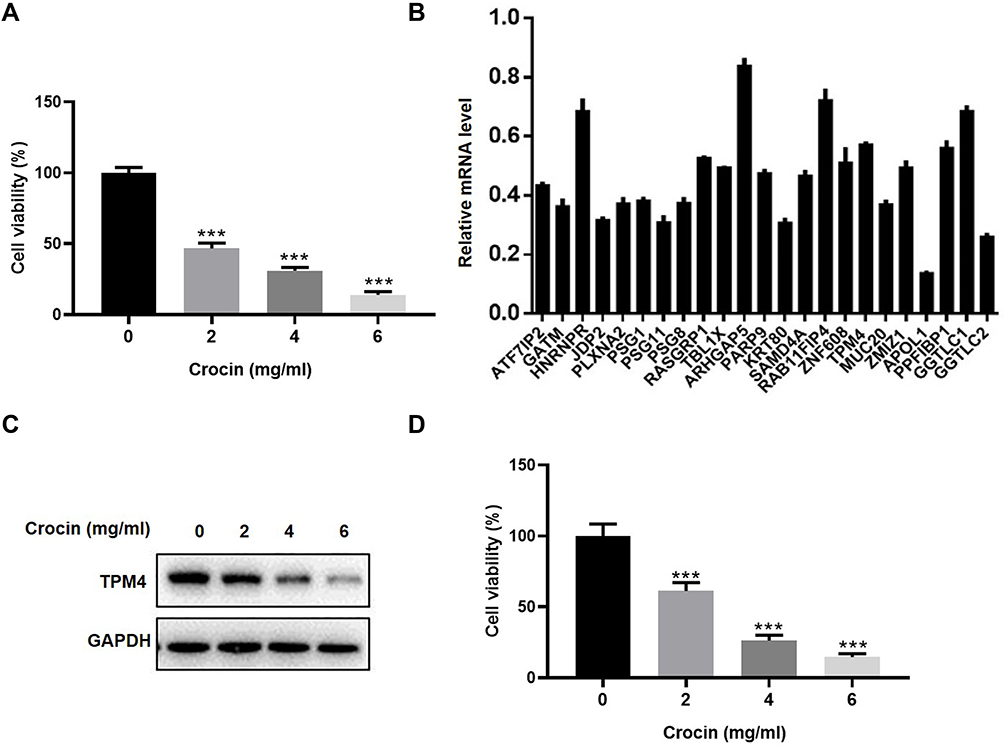 |
Figure 1 Crocin inhibited the proliferation and gene expression in gastric adenocarcinoma AGS cells. (A) Inhibition of AGS cells proliferation by treatment of different does of crocin (2.0 mg/mL, 4.0 mg/mL, 6.0 mg/mL) for 48 hours. (B) mRNA level of the 23 significantly downregulated genes was confirmed by qRT-PCR after the AGS cells treated with crocin (2.4 mg/mL, the IC50 concentration of crocin) for 48 hours. Relative mRNA level was calibrated by the mRNA level in the control group. (C) TPM4 expression was detected in the HGC-27 cells treated with crocin (2.0 mg/mL, 4.0 mg/mL, 6.0 mg/mL) by Western blot. (D) Inhibition of HGC-27 cells proliferation by treatment of different does of crocin (2.0 mg/mL, 4.0 mg/mL, 6.0 mg/mL) for 48 hours. Data were presented as the mean±SD. n=3. ***P<0.001 vs Control group. |
To examine the potential involvement of gene expression in the pharmacological effect of crocin, we had performed microarray analysis previously to determine the gene expression in the cells treated with crocin.19 A large number of gene expressions had been demonstrated to alter after being treated with crocin.19 Among the down-regulated genes, we chose 23 genes which were significantly down-regulated with the expression fold change over 1.3-fold compared to the control group to confirm their expression by using qRT-PCR. As shown in Figure 1B, all 23 genes were downregulated with an expression fold change less than 1. We also used Western blot to detect the TPM4 expression after treating gastric cancer cells with crocin. We found that crocin decreased the expression of TPM4 (Figure 1C). We also examined the effect of crocin in HGC-27 gastric cancer cells lines. As shown in Figure 1D, crocin inhibited the cell proliferation of HGC-27 cells in a dose-dependent manner.
TPM4 Was Involved in the Inhibitory Effect of Crocin on Gastric Cancer Cells Proliferation
As TPM4 was found to be overexpressed in cancers, and associated with clinical stage,21–23 we first investigated the expression of TPM4 in gastric cancer. Tissues from 50 clinical patients (the statistics information is displayed in Table 1) diagnosed with gastric cancer were applied to detect the expression of TPM4. qRT-PCR and Western blot showed that TPM4 was highly expressed in cancer tissues at mRNA and protein level compared with para-carcinoma tissues (Figure 2A–C). We then investigated the role of TPM4 on the effect of crocin. As shown in Figure 2D, overexpression of TPM4 totally abolished the inhibitory effect of crocin on cancer cell proliferation. These results suggested that crocin’s inhibitory effect on cancer cells proliferation relied on down-regulation of TPM4.
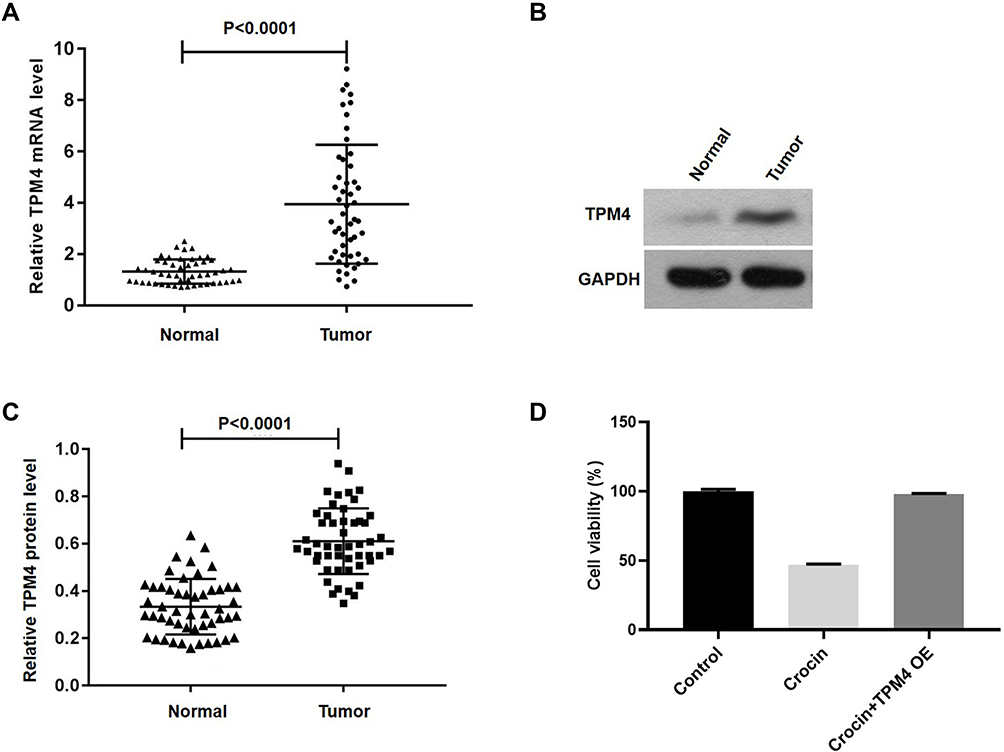 |
Figure 2 The expression of TPM4 in gastric carcinoma tissues (Tumor) or para-carcinoma tissues (Normal) was verified by qPCR or Western blot. (A) The expression of TPM4 was assessed in gastric carcinoma and para-carcinoma tissues (n=50). (B) Western blot was applied to detect the expression level of TPM4 in cancer tissues and para-carcinoma. (C) Histogram of the TPM4 protein quantification in E normalized to GAPDH. (D) AGS cells were treated with crocin (2.4 mg/mL) for 48 hours after transfecting with TPM4 for 24 hours, the cell viability was measured by CCK-8 assay (n=6). Data are presented as the mean±SD. |
Knockdown of TPM4 Inhibited AGC Cell Proliferation
Since overexpression of TPM4 could abolish the effect of crocin, we further investigated the effect of TPM4 on gastric cancer cell proliferation. Sh-RNA lentivirus was constructed to inhibit the expression of TPM4, and puromycin was used to obtain the TPM4 knockdown stable cell lines. The down-regulated TPM4 gene expression was confirmed by qRT-PCR and Western blot (Figure 3A–C). Cell proliferation was then measured by Celigo image cytometry which was determined by the green fluorescence of the cells. We found that the cells showed a significant reduction of cells proliferation after knockdown of TPM4 for 5 days, compared to the control group (Figure 3D). The result of CCK-8 assay was consistent with Celigo image cytometry (Figure 3E). Moreover, TPM4 knockdown cells showed a reduction in cloning efficiency and proliferating cell nuclear antigen (PCNA) protein expression (Figure 3F–I). Using flow cytometry analysis, we found the cell apoptosis of the TPM4 knockdown group increased compared to the control group (Figure 3J and K). These results indicated that the expression of TPM4 was positively correlated with cell proliferation and negatively correlated with cell apoptosis.
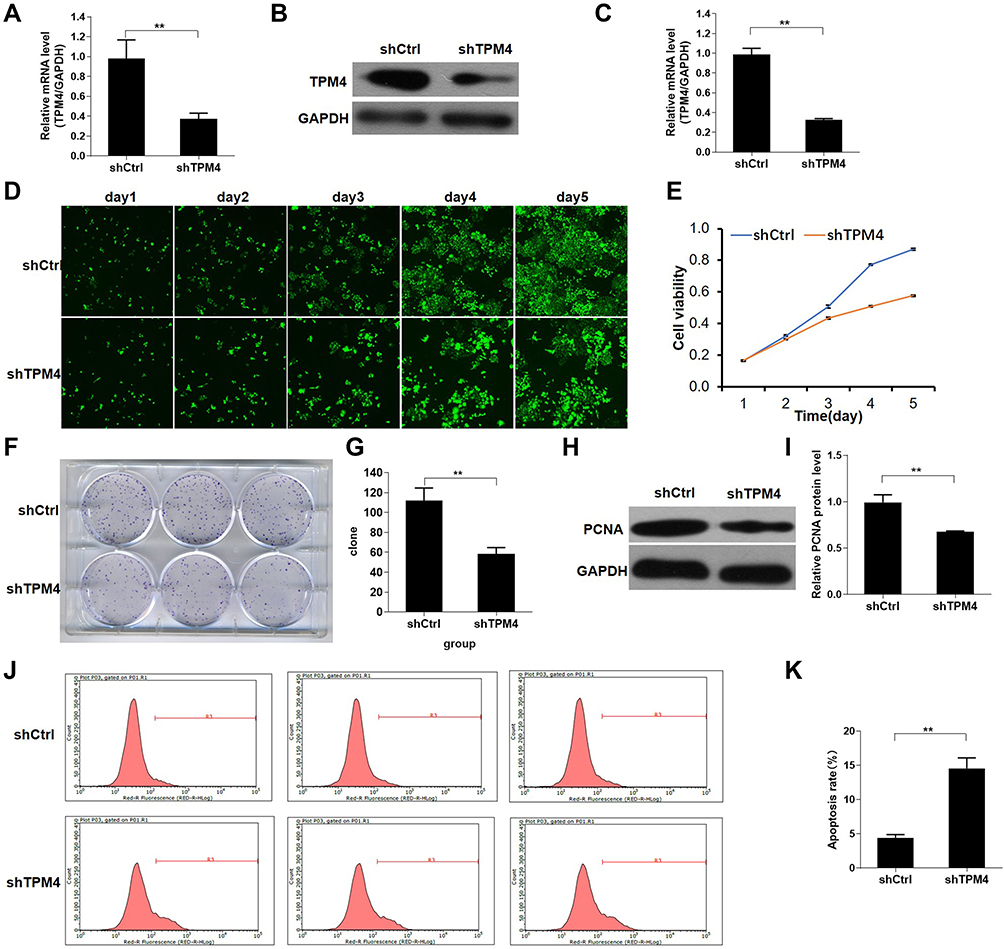 |
Figure 3 Knockdown of TPM4 inhibited AGC cell proliferation. (A) The stable shTPM4 AGS cells and shCtrl AGS cells were used to detect the mRNA level by qRT-PCR. (B and C) TPM4 protein expression in the stable shTPM4 AGS cells and shCtrl AGS cells were detected by Western blot. The cell proliferation was measured by Celigo image cytometry (D) and CCK-8 assay (E). (F and G) Cell clone formation assay was performed by using crystal violet staining. (H and I) Proliferating cell nuclear antigen (PCNA) protein expression in the stable shTPM4 AGS cells and shCtrl AGS cells was detected by Western blot. (J and K) Apoptosis of the stable shTPM4 AGS cells and shCtrl AGS cells was detected by flow cytometry. (G, I, and K) were histograms of (F, H, and J), respectively. Mean levels (±SD) were calculated from three replications. **P<0.01. |
Knockdown of TPM4 Inhibited the Xenograft Growth in Nude Mice
To further investigate the role of TPM4 in tumor growth, we constructed a xenotransplanted tumor model and transplanted the nude mice with the tumor cells with or without TPM4 RNAi. As shown in Figure 4, the whole-body fluorescent tumors imaging of the control group showed a larger and more obvious image of tumor than the TPM4 knockdown group (Figure 4A–C). The TPM4 knockdown group exhibit a smaller size and lower weight of the tumor than the control mice (Figure 4D–F). All these data suggested that knockdown of TPM4 inhibited the tumor growth in the xenotransplanted tumor model.
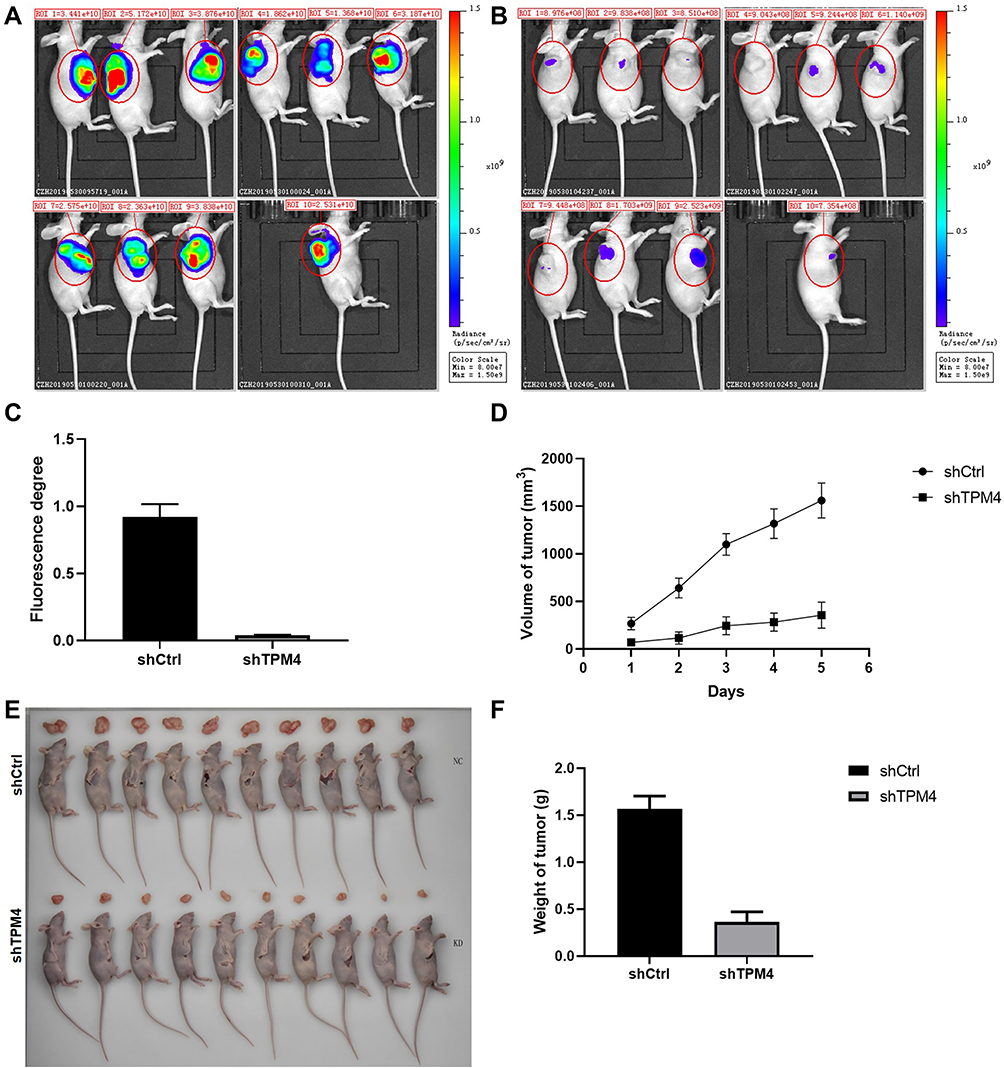 |
Figure 4 Knockdown of TPM4 inhibited the xenograft growth in nude mice. (A) Whole-body fluorescent imaging system showed the size of tumor in nude mice of the control group. (B) Whole-body fluorescent imaging system showed the size of tumor in nude mice of the TPM4 knockdown group. (C) The fluorescence degree of the tumor. (D) The tumor volume of shCtrl and shTPM4 mice. (E) The mice were sacrificed and the tumors were isolated. (F) The weight of the isolated tumor of the two groups (n=10). Data were presented as the mean±SD. |
The Down-Regulated TPM4 Inhibited the Expression of Genes Associated with the Proliferation of Gastric Cancer Cells and Promotes the Expression of Genes Related to Apoptosis
To further explore how TPM4 affected the proliferation and apoptosis of gastric cancer cells, we conducted a high-content microarray to test the differential genes expression between control and TPM4-RNAi AGS cells. Pearson’s correlation coefficient between the control and TPM4-RNAi RNA samples was >0.99, which meant gene expression patterns were similar in the same group with large differences between groups, suggesting this result was reliable. The volcano plot showed the overall features of the gene set in TPM4-RNAi AGS cells. After standardization, 896 significantly up-regulated genes and 605 significantly down-regulated genes were identified (|fold change|>1.3 and P<0.05) between control and TPM4-RNAi AGS cells (Figure 5A). A heat map was created upon comparison of the differential gene expression (Figure 5B). Further, we constructed molecular regulatory networks using genes which were abnormally expressed in TPM4-RNAi AGS cells and had been shown to be associated with cell proliferation and apoptosis (Figure 6A). The results show that most genes that promote proliferation or inhibit apoptosis of tumor cells were down-regulated, including EGFR, HMGB1, CXCL8, CXCL1, CXCL1, RB1, etc.; while those genes promoting apoptosis or antiproliferation of tumor cells were up-regulated, such as AR, JUN, TGFB1, TNFRSF21, PHLDA1, etc. The expressions of down-regulated genes, such as EGFR, PTSG2, CXCL8, and RB1, were further assessed by Western blot which was consistent with the microarray result (Figure 6B). These results suggested that the reduced expression of TPM4 affected the progression of tumor cells by affecting the expression of many proliferation or apoptosis-related genes.
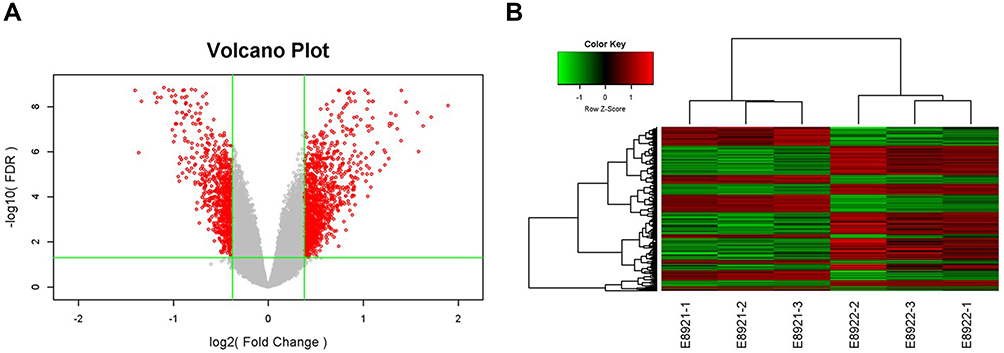 |
Figure 5 Differentially expressed genes between TPM4-RNAi AGS cells and control AGS cells were assessed by microarray detection. (A) Volcano Plot demonstrated the distribution of the differentially expressed genes between TPM4-RNAi AGS cells and control AGS cells. Horizontal coordinates represented the difference multiple with the logarithm conversion based on two and the ordinate represented the significant FDR of the difference with the logarithm conversion based on 10. The red color represents all the probes with fold difference >1.3 and FDR<0.05. Gray dots are genes with no significant differences. (B) Gene-wise hierarchical clustering heat map exhibiting the expression of genes with fold difference >1.3 and FDR <0.05. Each column represents one sample, and each row represents a differentgene. The upper tree structure was the aggregation or classification of all samples according to the expression profile of differentgenes. The tree structure on the left indicates the aggregation of expression patterns of differentially expressed genes. The red color demonstrates the up-regulated genes; the green color indicates the down-regulated genes. The black color displays the genes with no significant change, and the gray shows non-detected. E8921-1, E8921-2, and E8921-3 were the control group, while E8922-1, E8922-2, and E8922-3 were the TPM4-RNAi group. |
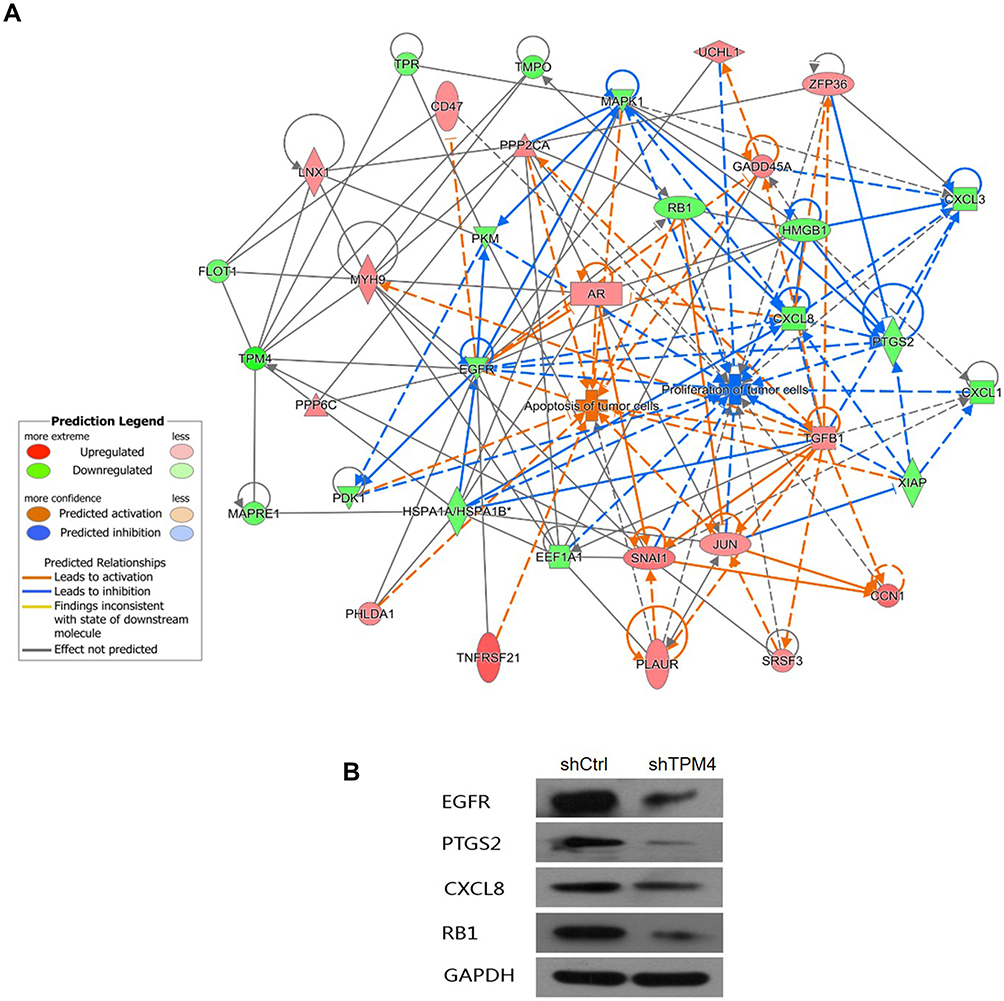 |
Figure 6 The molecular network of inhibition of proliferation and promotion of apoptosis caused by down-regulated TPM4. (A) The network displayed interactions genes related to cell proliferation and apoptosis that were differentially expressed in TPM4-RNAi AGS cells compared to the control group. Genes up-regulated in TPM4-RNAi AGS cells were colored in shades of red; genes in green were down-regulated. Solid and dashed lines indicate direct and indirect interactions, respectively. The regulators are colored by their predicted activation state: activated (orange) or inhibited (blue). Pointed arrowheads represent that the downstream node was expected to be activated if the upstream node connected to it was activated, while blunt arrowheads demonstrate that the downstream node is expected to be inhibited if the upstream node that connects to it is activated; and the grey lines indicate no predicted effects. (B) The expression of down-regulated genes was confirmed by Western blot, including EGFR, PTGS2, CXCL8, and RB1. GAPDH served as an internal control. |
The Knockdown of TPM4 Weakened the Inhibitory Effect of Crocin on Gastric Cancer Cells and the Xenotransplanted Tumor Model
We further verified the role of TPM4 in the effect of crocin by detecting the cell viability and cell clone formation. We found that overexpression of TPM4 abrogated the inhibitory effect of crocin on cell viability and cell clone formation (Figure 7A and B). Knockdown of TPM4 inhibited the tumor cells proliferation and cell clone formation, and co-treatment with crocin enhanced the inhibitory effect (Figure 7A and B). We further investigate the role of TPM4 after treating gastric cancer with crocin in vivo. We use TPM4 knockdown AGS cells or TPM4 overexpression AGS cells to construct a xenotransplanted tumor model with treatment of crocin. As shown in Figure 7C, D, and F, we found that crocin inhibited the tumor growth in the mice, while overexpression of TPM4 abolished the effect of crocin. Knockdown of TPM4 inhibited the tumor growth and enhanced the inhibitory effect of crocin (Figure 7C, D, and F). Treatment with crocin or tumor cells did not change the weight of mice (Figure 7E). All these data suggested that knockdown of TPM4 weakened the inhibitory effect of crocin on gastric cancer cells and a xenotransplanted tumor model.
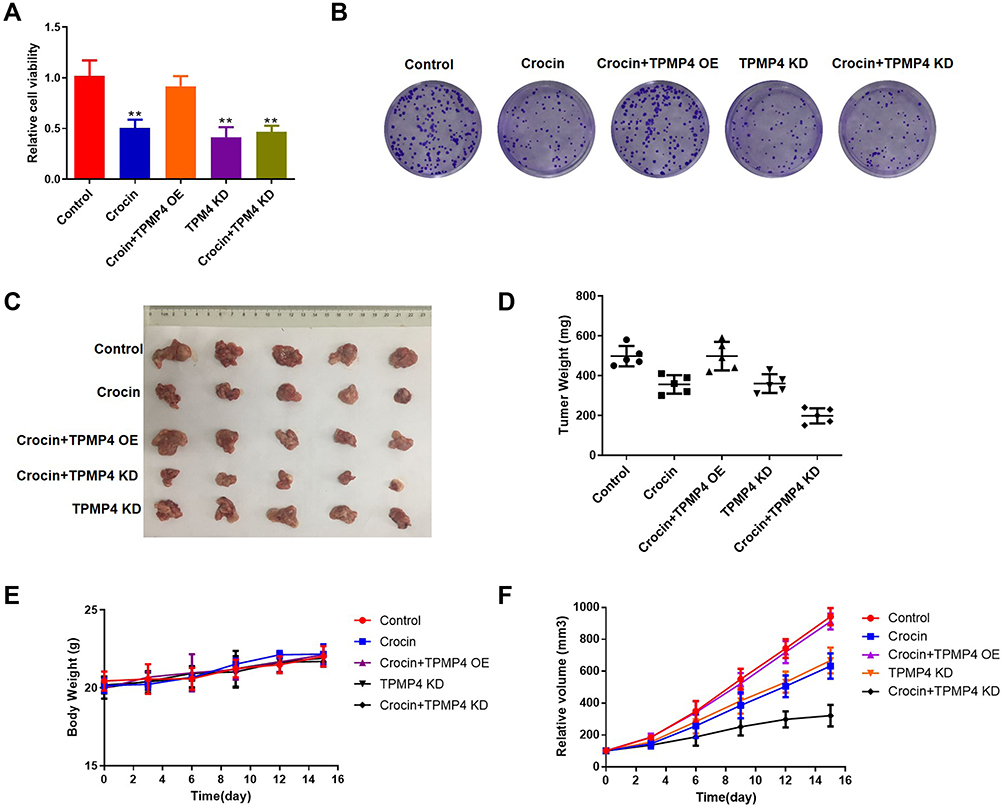 |
Figure 7 The knockdown of TPM4 weakened the inhibitory effect of crocin on gastric cancer cells and a xenotransplanted tumor model. AGS cells overexpressed or knocked down TPM4 treated with crocin (6 mg/mL) or not. (A) The cell viability was measured by using CCK-8. (B) Cell clone formation was assayed by using crystal violet staining. We used TPM4 knockdown AGS cells or TPM4 overexpression AGS cells to construct a xenotransplanted tumor model with intraperitoneal injection of crocin (6.25 mg/kg/day). (C) The photo of the isolated tumor was shown in the indicated group. (D) The weight of the tumors was measured. (E) The change of the body weight of mice. (F) The volume of the tumor was recorded every 3 days. Mean levels (±SD) were calculated from three replications. **P<0.01. |
Discussion
Crocin is a kind of bioactive constituent found in the stigmas of saffron, a herb containing various components including fat, moisture, minerals, proteins, crude fibers, and sugars,24 and shows considerable pharmaceutical effects on treatment of central nerve system disease, cardiovascular disease, and cancer.25–27 Here in the present studies, we found crocin inhibited the gastric adenocarcinoma cells AGS proliferation in a dose-dependent manner. It was reported that crocin induced apoptosis of chemo-resistant cervical cancer cells.28 Consistently, our previous study found cisplatin enhanced the inhibitory effect on tumor cell proliferation while co-treated with crocin, indicating crocin could increase the cell sensitivity to chemotherapeutics (unpublished data).
Certain studies had clarified the change of gene expression in the tumor cell proliferation.29 To investigate the mechanism of crocin’s effect on tumor cell proliferation and apoptosis, we previously performed gene microarray analysis, and identified 301 down-regulated genes in the crocin-treated cells, among which 23 genes were significantly down-regulated and barely reported in the studies of GC.19 TPM4, reported to express a high molecular weight protein in human ovary tumor tissues, was isoform of proteins and tropomyosins (TPM) family members, and regulated muscle contraction in conjunction with other sarcomeric proteins like actin, troponins, and tropomodulin.30,31 It was reported that TPM4 gene products showed postsynaptic localization and might relate to postsynaptic functions.32 The role of the TPM4 gene in tumor pathogenesis is misty. Lawrence et al33 reported that TPM protein could regulate inflammatory myofibroblastic tumors (IMTs) by regulating the ALK receptor. Lomnytska et al22 reported that the TPM4 expression level was lower in invasive squamous cervical cancer (SCC) than in the normal epithelium. In the present studies, we first clarified that crocin down-regulated the TPM4 gene expression, and overexpression of TPM4 abolishes the effect of crocin, indicating crocin’s effect relied on the down-regulation of TPM4. We found that TPM4 gene expression played important roles in the pathogenesis of gastric cancer which affected the expression of many proliferation or apoptosis-related genes. Knockdown of TPM4 inhibited the AGS cells proliferation and clone formation, and TPM4 knockdown cells showed increased cell apoptosis. Tumor transplanted with TPM4 knockdown cells exhibited lower growth ability than the tumor transplanted with normal AGS cells, indicating that TPM4 was a proliferation-related gene. Furthermore, using microarray analysis, we found that knocking down TPM4 inhibited the expression of genes associated with the proliferation of gastric cancer cells and promotes the expression of genes related to apoptosis, which indicated that TPM4 might be a key regulator gene related to cancer progression.
In conclusion, we found that crocin could inhibit the gastric adenocarcinoma cells AGS cells proliferation by suppressing a key regulator concerned with cell proliferation –TPM4. These results provided new understanding of the molecular mechanism of the progression of gastric cancer, a new target for the treatment of gastric cancer, and also reveal the inhibitory molecular mechanism of gastric cancer by crocin.
Ethical Approval
All mice were treated according to the Guide for the Care and Use of Laboratory Animals published by the US National Institutes of Health (NIH publication, 8th edition, 2011), and approved by the Institutional Laboratory Animal Care and Use Committee of Affiliated hospital of Qinghai university.
Acknowledgments
The authors gratefully acknowledge the financial support from Scientific research project funds of Qinghai department (2018-ZJ-735), National Natural Science Foundation of China (N0. 81760730) and Qinghai cancer clinical research center (NO. 2018-SF-113).
Disclosure
The authors declare that they have no conflicts of interest. No benefits in any form have been or will be received from any commercial party related directly or indirectly to the subject of this manuscript.
References
1. Kamangar F, Dores GM, Anderson WF. Patterns of cancer incidence, mortality, and prevalence across five continents: defining priorities to reduce cancer disparities in different geographic regions of the world. J Clin Oncol. 2006;24(14):2137–2150. doi:10.1200/JCO.2005.05.2308
2. Jemal A, Bray F, Center MM, Ferlay J, Ward E, Forman D. Global cancer statistics. CA Cancer J Clin. 2011;61:69–90. doi:10.3322/caac.20107
3. Sitarz R, Skierucha M, Mielko J, Offerhaus J, Maciejewski R, Polkowski W. Gastric cancer: epidemiology, prevention, classification, and treatment. Cancer Manag Res. 2018;10:239–248. doi:10.2147/CMAR.S149619
4. Parkin DM, Bray F, Ferlay J, Pisani P. Global cancer statistics, 2002. CA Cancer J Clin. 2005;55:74–108. doi:10.3322/canjclin.55.2.74
5. Cunningham D, Allum WH, Stenning SP, et al. Perioperative chemotherapy versus surgery alone for resectable gastroesophageal cancer. N Engl J Med. 2006;355:11–20. doi:10.1056/NEJMoa055531
6. Yano H, Mizoguchi A, Fukuda K, et al. The herbal medicine sho-saiko-to inhibits proliferation of cancer cell lines by inducing apoptosis and arrest at the G0/G1 phase. Cancer Res. 1994;54:448–454.
7. Chia J-S, Du J-L, Hsu W-B, Sun A, Chiang C-P, Wang W-B. Inhibition of metastasis, angiogenesis, and tumor growth by Chinese herbal cocktail tien-hsien liquid. BMC Cancer. 2010;10(1):175. doi:10.1186/1471-2407-10-175
8. Ji Q, Liu X, Fu X, et al. Resveratrol inhibits invasion and metastasis of colorectal cancer cells via MALAT1 mediated Wnt/β-catenin signal pathway. PLoS One. 2013;8(11):e78700. doi:10.1371/journal.pone.0078700
9. Khazal K, Simon L, Odemuyiwa S, Hill D, Grubbs C. Abstract P6-09-08: withania somnifera extract inhibits invasion and metastasis of MDA-MB-231 cells by inhibiting CCL2 and CD44 high/CD24low stem cells. Am Assoc Cancer Res. 2013;
10. Wang Z, Ravula R, Cao M, Chow M, Huang Y. Transporter-mediated multidrug resistance and its modulation by chinese medicines and other herbal products. Curr Drug Discov Technol. 2010;999(999):1–13. doi:10.2174/1570210201561361638
11. Lee I-A, Lee JH, Baek N-I, Kim D-H. Antihyperlipidemic Effect of crocin isolated from the fructus of gardenia jasminoides and its metabolite crocetin. Biol Pharm Bull. 2005;28:2106–2110. doi:10.1248/bpb.28.2106
12. Li J, Lei H, Cao L, Mi Y-N, Li S, Cao Y-X. Crocin alleviates coronary atherosclerosis via inhibiting lipid synthesis and inducing M2 macrophage polarization. Int Immunopharmacol. 2018;55:120–127. doi:10.1016/j.intimp.2017.11.037
13. Yosri H, Elkashef WF, Said E, Gameil NM. Crocin modulates IL-4/IL-13 signaling and ameliorates experimentally induced allergic airway asthma in a murine model. Int Immunopharmacol. 2017;50:305–312. doi:10.1016/j.intimp.2017.07.012
14. Abou-Hany HO, Atef H, Said E, Elkashef HA, Salem HA. Crocin mediated amelioration of oxidative burden and inflammatory cascade suppresses diabetic nephropathy progression in diabetic rats. Chem Biol Interact. 2018;284:90–100. doi:10.1016/j.cbi.2018.02.001
15. Noureini SK, Wink M. Antiproliferative effects of crocin in HepG2 cells by telomerase inhibition and hTERT down-regulation. Asian Pac J Cancer Prev. 2012;13:2305–2309. doi:10.7314/APJCP.2012.13.5.2305
16. Puthanveettil S, Kandel E. Molecular mechanisms for the initiation and maintenance of long-term memory storage. In: Two Faces of Evil: Cancer and Neurodegeneration. Berlin, Heidelberg: Springer; 2011:143–160. doi:10.1007/978-3-642-16602-0_13
17. Garc-Olmo DC, Riese HH, Escribano J, et al. Effects of long-term treatment of colon adenocarcinoma with crocin, a carotenoid from saffron (Crocus sativus L.): an Experimental Study in the Rat. Nutr Cancer. 1999;35:120–126. doi:10.1207/S15327914NC352_4
18. Sajjadi M, Bathaie Z. Comparative study on the preventive effect of saffron carotenoids, crocin and crocetin, in NMU-induced breast cancer in rats. Cell J. 2017;19:94–101. doi:10.22074/CELLJ.2016.3901
19. Luo YS, Yu P, Zhao J, et al. Analysis of the pathogenesisi and anti-proliferation mechanisms of crocin in human gastric carcinoma cell. Int J Clin Exp Pathol. 2020;13(5):912.
20. Hansen HG, Hansen HG. Celigo-based cell-counting and viability assay for mammalian cells. Protoc Exch. 2016. doi:10.1038/protex.2016.038
21. Li D-Q, Wang L, Fei F, et al. Identification of breast cancer metastasis-associated proteins in an isogenic tumor metastasis model using two-dimensional gel electrophoresis and liquid chromatography-ion trap-mass spectrometry. Proteomics. 2006;6(11):3352–3368. doi:10.1002/pmic.200500617
22. Lomnytska MI, Becker S, Bodin I, et al. Differential expression of ANXA6, HSP27, PRDX2, NCF2, and TPM4 during uterine cervix carcinogenesis: diagnostic and prognostic value. Br J Cancer. 2011;104:110–119. doi:10.1038/sj.bjc.6605992
23. Yang R, Zheng G, Ren D, et al. The clinical significance and biological function of tropomyosin 4 in colon cancer. Biomed Pharmacother. 2018;101:1–7. doi:10.1016/j.biopha.2018.01.166
24. Mollazadeh H, Emami SA, Hosseinzadeh H. Razi’s Al-Hawi and saffron (Crocus sativus): a review., Iran. J Basic Med Sci. 2015;18:1153–1166.
25. Imenshahidi M, Hosseinzadeh H, Javadpour Y. Hypotensive effect of aqueous saffron extract (Crocus sativus L.) and its constituents, safranal and Crocin, in normotensive and hypertensive rats. Phyther Res. 2009. doi:10.1002/ptr.3044
26. Vahdati Hassani F, Naseri V, Razavi B, Mehri S, Abnous K, Hosseinzadeh H. Antidepressant effects of crocin and its effects on transcript and protein levels of CREB, BDNF, and VGF in rat hippocampus. DARU J Pharm Sci. 2014;22:16. doi:10.1186/2008-2231-22-16
27. Rastgoo M, Hosseinzadeh H, Alavizadeh H, Abbasi A, Ayati Z, Jaafari M. Antitumor activity of PEGylated nanoliposomes containing crocin in mice bearing C26 colon carcinoma. Planta Med. 2013;79:447–451. doi:10.1055/s-0032-1328363
28. Mollaei H, Safaralizadeh R, Babaei E, Abedini MR, Hoshyar R. The anti-proliferative and apoptotic effects of crocin on chemosensitive and chemoresistant cervical cancer cells. Biomed Pharmacother. 2017;94:307–316. doi:10.1016/j.biopha.2017.07.052
29. Hardwick JS, Yang Y, Zhang C, et al. Identification of biomarkers for tumor endothelial cell proliferation through gene expression profiling. Mol Cancer Ther. 2005;4:413–425. doi:10.1158/1535-7163.MCT-04-0209
30. Tang H-Y, Beer LA, Tanyi JL, Zhang R, Liu Q, Speicher DW. Protein isoform-specific validation defines multiple chloride intracellular channel and tropomyosin isoforms as serological biomarkers of ovarian cancer. J Proteom. 2013;89:165–178. doi:10.1016/j.jprot.2013.06.016
31. Dube DK, Dube S, Abbott L, Alshiekh-Nasany R, Mitschow C, Poiesz BJ. Cloning, sequencing, and the expression of the elusive sarcomeric TPM4 α isoform in humans. Mol Biol Int. 2016;2016:1–11. doi:10.1155/2016/3105478
32. Guven K, Gunning P, Fath T. TPM3 and TPM4 gene products segregate to the postsynaptic region of central nervous system synapses. Bioarchitecture. 2011;1(6):284–289. doi:10.4161/bioa.1.6.19336
33. Lawrence B, Perez-Atayde A, Hibbard MK, et al. TPM3-ALK and TPM4-ALK oncogenes in inflammatory myofibroblastic tumors. Am J Pathol. 2000;157:377–384. doi:10.1016/S0002-9440(10)64550-6
 © 2021 The Author(s). This work is published and licensed by Dove Medical Press Limited. The full terms of this license are available at https://www.dovepress.com/terms.php and incorporate the Creative Commons Attribution - Non Commercial (unported, v3.0) License.
By accessing the work you hereby accept the Terms. Non-commercial uses of the work are permitted without any further permission from Dove Medical Press Limited, provided the work is properly attributed. For permission for commercial use of this work, please see paragraphs 4.2 and 5 of our Terms.
© 2021 The Author(s). This work is published and licensed by Dove Medical Press Limited. The full terms of this license are available at https://www.dovepress.com/terms.php and incorporate the Creative Commons Attribution - Non Commercial (unported, v3.0) License.
By accessing the work you hereby accept the Terms. Non-commercial uses of the work are permitted without any further permission from Dove Medical Press Limited, provided the work is properly attributed. For permission for commercial use of this work, please see paragraphs 4.2 and 5 of our Terms.