")
Back to Journals » Cancer Management and Research » Volume 11
Inhibitor of DNA binding 1 (Id1) mediates stemness of colorectal cancer cells through the Id1-c-Myc-PLAC8 axis via the Wnt/β-catenin and Shh signaling pathways
Authors Sun Y, Lai X, Yu Y, Li J, Cao L, Lin W, Huang C, Liao J, Chen W, Li C, Yang C, Ying M, Chen Q, Ye Y
Received 28 February 2019
Accepted for publication 15 June 2019
Published 23 July 2019 Volume 2019:11 Pages 6855—6869
DOI https://doi.org/10.2147/CMAR.S207167
Checked for plagiarism Yes
Review by Single anonymous peer review
Peer reviewer comments 2
Editor who approved publication: Dr Ahmet Emre Eşkazan
Yanxia Sun,*,1,2 Xiaolan Lai,*,3 Yue Yu,1,2 Jieyu Li,2,4 Lei Cao,3 Wansong Lin,2,4 Chuanzhong Huang,2,4 Jinrong Liao,2,4 Wei Chen,1,2 Chao Li,5 Chunkang Yang,6 Mingang Ying,6 Qiang Chen,3 Yunbin Ye2,4
1School of Basic Medical Sciences, Fujian Medical University, Fuzhou 350122, Fujian Province, People’s Republic of China; 2Laboratory of Immuno-Oncology, Fujian Provincial Cancer Hospital, Fuzhou 350014, Fujian Province, People’s Republic of China; 3Department of Medical Oncology, Union Hospital of Fujian Medical University, Fuzhou 350001, Fujian Province, People’s Republic of China; 4Fujian Key Laboratory of Translational Cancer Medicine, Fuzhou 350014, Fujian Province, People’s Republic of China; 5Department of Pathology, Fujian Provincial Cancer Hospital, Fuzhou 350014, Fujian Province, People’s Republic of China; 6Department of Abdominal Surgery, Fujian Provincial Cancer Hospital, Fuzhou 350014, Fujian Province, People’s Republic of China
*These authors contributed equally to this work
Background: Inhibitor of DNA binding 1 (Id1) is upregulated in multiple cancers, and Id1overexpression correlates with cancer aggressiveness and poor clinical outcomes in cancer patients. However, its roles in cancer stem-like cells (CSCs) and epithelial-mesenchymal transition (EMT) are still elusive.
Purpose: This study aimed to examine the role of Id1 on the mediation of CRC stemness and explore the underlying mechanisms.
Methods: Id1 and CD133 expression was detected by qPCR assay and immunohistochemistry (IHC) in normal mucosal and primary colorectal cancer (CRC) specimens. Id1 was stably knocked down (KD) in human CRC cell lines. Spheres forming assay and tumorigenic assay were performed to evaluate self-renewal capacity and tumor initiation. Expression of CSC- and EMT-related markers and TCF/LEF activity were assessed in HCT116 cells after Id1 KD.
Results: qPCR assay showed higher Id1 and CD133 expression in CRC specimens than in normal mucosal specimens (P<0.05). IHC detected high cytoplasmic Id1 expression in 35 CRC specimens (46.7%), and high CD133 expression in 22 CRC specimens (29.3%) and negative expression in 18 normal mucosal specimens. High Id1 expression positively correlated with poor differentiation (P=0.034), and CD133 expression correlated with T category in CRC patients (P=0.002). Spearman correlation analysis revealed a positive correlation between Id1 and CD133 expression in CRC patients (P<0.05). Id1 KD resulted in suppression of proliferation, cell-colony formation, self-renewal capability and CSC-like features in HCT116 cells, and impaired the tumor-initiating capability in CRC cells. In addition, Id1 maintained the stemness of CRC cells via the Id1-c-Myc-PLAC8 axis through activating the Wnt/β-catenin and Shh signaling pathways.
Conclusions: Id1 expression significantly correlates with CD133 expression in CRC patients, and Id1 KD impairs CSC-like capacity and reverses EMT traits, partially via the Wnt/β-catenin signaling. Id1 may be a promising therapeutic target against colon CSCs.
Keywords: inhibitor of DNA binding 1, Id1, self-renewal, stemness, epithelial-mesenchymal transition, colon cancer, Wnt/β-catenin signaling pathway
Introduction
Colorectal cancer (CRC) is the third most common cancer and the third leading cause of cancer-related deaths globally.1,2 Currently, management of this malignancy still depends on surgery, chemotherapy and radiotherapy.3 and immunotherapy has shown promising benefits.4 The prognosis of early-stage CRC is satisfactory; however, if the malignancy has progresses into advanced or metastatic diseases, the 5-year survival rate is very low.1 Understanding of the mechanisms of CRC progression and metastasis is therefore of great significance to develop interventions to prevent and manage the progressive behaviors.5
There is increasing evidence supporting the crucial role of cancer stem-like cells (CSCs) in the progression and metastasis of CRC.6 Chemoresistance and radioresistance are two major factors leading to the poor outcomes of CRC,7–9 and CSCs have been shown to contribute to both chemoresistance and radioresistance to CRC.10–12 Therefore, understanding of the molecular regulation of the maintenance of CSCs may be useful for establishing efficient treatments targeting CRC.
Inhibitor of DNA-binding proteins (Id) is a family of transcription factors belonging to the basic helix-loop-helix (bHLH) protein superfamily,13 and four family members have been identified in humans until now, including Id1, Id2, Id3 and Id4.14 Id proteins function as negative regulators of bHLH and inhibit cell differentiation.15 Increasing evidence supports that Id1, the most frequently studied Id protein in cancer to date,16 is upregulated in multiple solid tumors, including breast cancer, prostate cancer, gastric cancer, lung cancer, esophageal squamous cell carcinoma and colorectal cancer,17–22 and overexpression of Id1 was found to correlate with cancer aggressiveness and poor clinical outcomes in cancer patients.18,21,22 In addition, previous studies have shown that Id1 down-regulation resulted in an increases in the sensitivity to chemotherapeutic agents in multiple cancers.23–26 Moreover, Id1 has been found to play an important role in the maintenance of self-renewal in neural and embryonic stem cells,27,28 and Id1 and Id3 were found to jointly function to govern colon CSCs self-renewal through cell-cycle restriction driven by p21.29 However, the mechanisms underlying the functional roles of Id1 in cancer have not been fully demonstrated, and there is little knowledge on the mediation of colorectal CSCs markers CD24, CD166, ALDH and Lgr5 by Ids until now.30 This ex vivo, in vivo and in vitro study was designed with aims to examine the role of Id1 in the mediation of CRC cell stemness and explore the underlying mechanisms.
Materials and methods
Ethical consideration
This study was reviewed and approved by the Ethics Review Committee of Fujian Provincial Cancer Hospital (approval no. FJZLYY2012-00087). Written informed consent was obtained from all study subjects following a detailed description of the purpose of the study. All experiments were done in accordance with the Declaration of Helsinki and international and national Guidelines for the Care and Use of Laboratory Animals.
Subjects and specimens
A total of 75 CRC patients undergoing surgical treatment in Fujian Provincial Cancer Hospital (Fuzhou, China) during the period from January 2010 through August 2012 were enrolled in this study, and all patients were definitely diagnosed using pathological examinations. The subjects included 47 males and 28 females, and had a mean age of 58.0±14.0 years (Table 1). The mean tumor size was 5.3±1.9 cm, and none of the patients received chemotherapy or radiotherapy. Human CRC and paired normal mucosa specimens were sampled for the experiments.
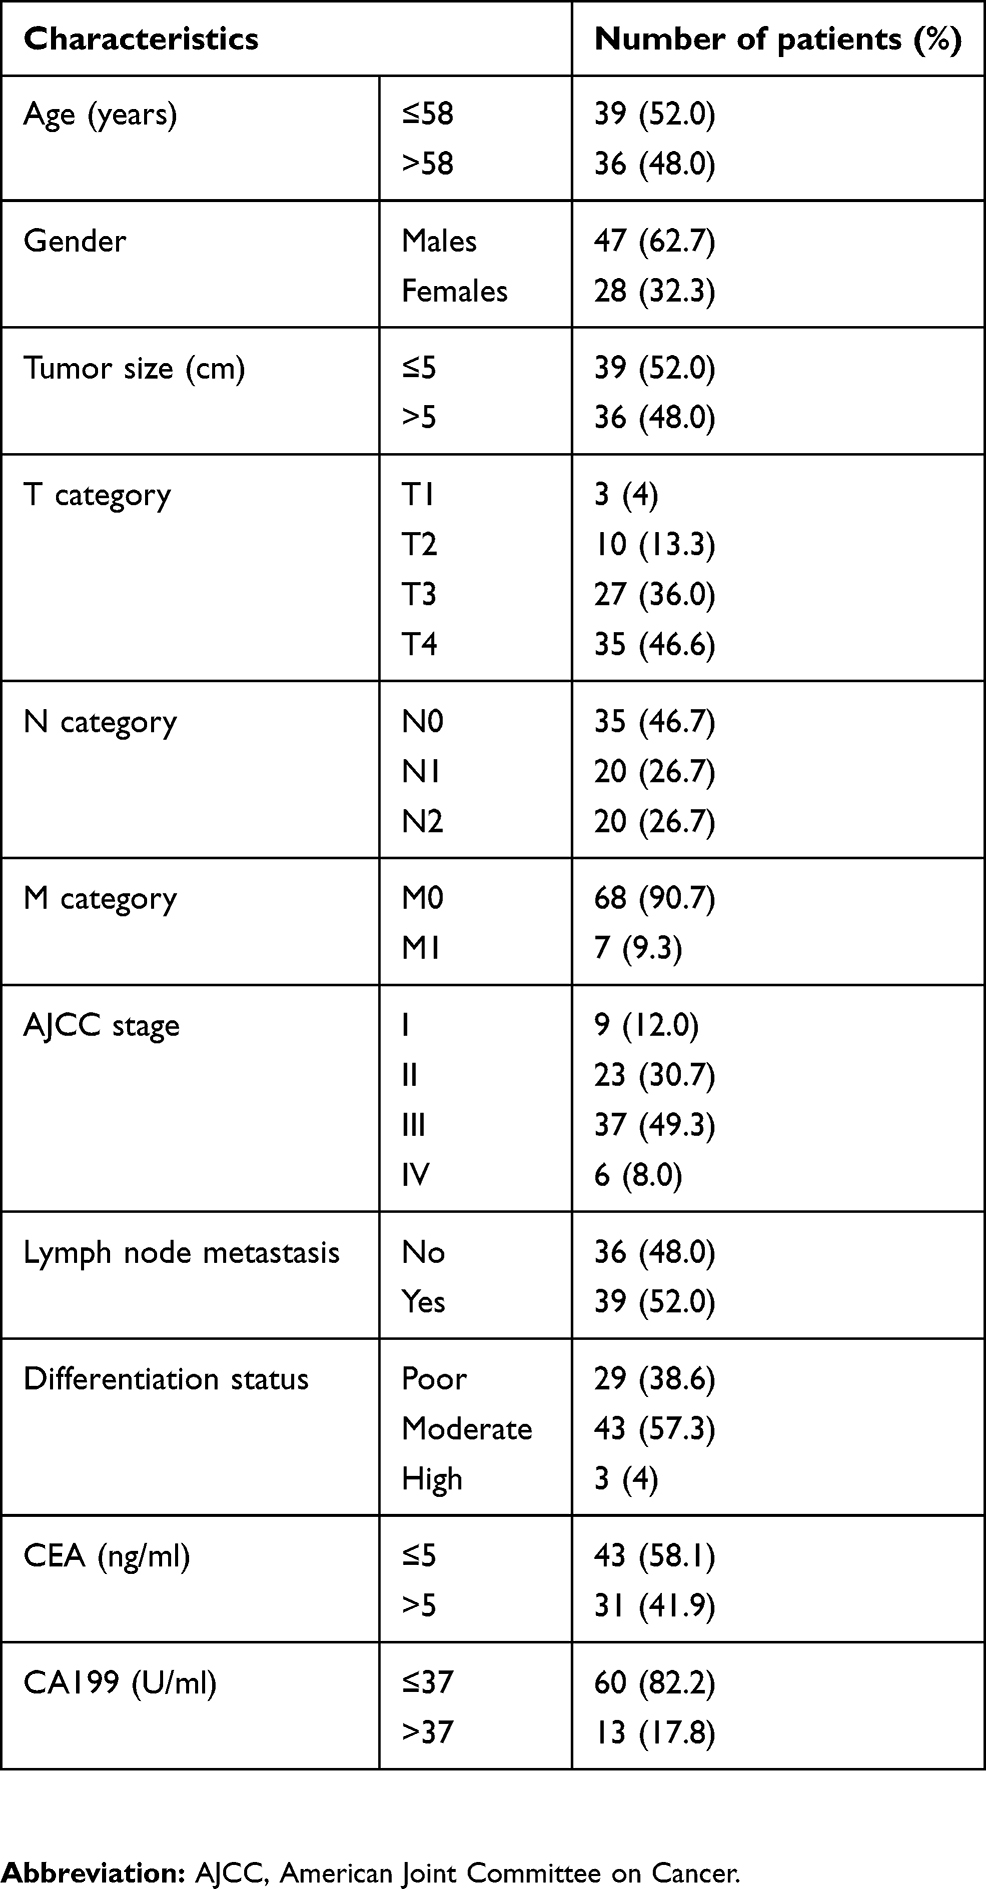 |
Table 1 Demographic and clinical characteristics of the study subjects |
Cell line and culture
Human CRC line HCT116 were purchased from the Cell Bank of Chinese Academy of Sciences (Shanghai, China), and incubated in McCoy’s 5A medium (Sigma-Aldrich; St. Louis, MO, USA) at 37 °C in a humidified atmosphere containing 5% CO2. Cells growing to at least 80% confluence were harvested for the subsequent experiments.
Animals
Male 4 to 6 weeks old nude mice of the BALB/c nu/nu strain, each weighing 16 to 19 g, were purchased from Shanghai SLAC Laboratory Animal Co., Ltd. (Shanghai, China), and were housed in a clean facility in the Laboratory Animal Center of Fujian Medical University (Fuzhou, China), with free access to water and food.
Immunohistochemistry (IHC)
The Id1 and CD133 protein expression was determined in human CRC and normal mucosal specimens using IHC with an immunostaining SP kit (Fuzhou Maixin Biotech Co., Ltd.; Fuzhou, China). Briefly, paraffin-embedded sections were deparaffinized by xylene, dehydrated in a graded methanol series, and antigen-retrieved in 10 mM citrate buffer (pH 6.0) for 5 min. Sections were then treated with peroxidase-blocking agent to block endogenous peroxidase and normal rabbit serum to block non-specific binding sites. Subsequently, sections were incubated in the primary rabbit anti-Id1 monoclonal antibody (Abcam, Inc.; Cambridge, MA, USA) and rabbit anti-CD133 polyclonal antibody (Abcam, Inc.; Cambridge, MA, USA) overnight at 4 °C, followed by incubation in the secondary antibodies at room temperature for 10 min. The sections were visualized with DAB and counterstained with hematoxylin. Stained sections were viewed and photographed under a fluorescence microscope.
The immunoreactivity scores of both Id1 and CD133 were calculated as the product of staining intensity and percentage of positive cells. The percentage of positive cells was rated as follows: 0, no positive cells; 1 point, 1% to 20% positive cells; 2 points, 21–50% positive cells; 3 points, 51–70% positive cells; and 4 points, 71% and more positive cells, and the staining intensity was categorized into 4 grades: 0, no staining of cancer cells; 1, weak staining; 2, moderate staining; and 3, strong staining. The immunoreactivity score of <4 was defined as low expression and a score of 4 and greater as high expression. All immunohistochemical slides were reviewed by two well-experienced pathologists, independently and blinded for any clinical data.
Cell transfection
Four short-hairpin RNAs (shRNAs) targeting Id1 and c-Myc overexpression (LV-Myc) were designed and synthesized by Shanghai Genechem Co., Ltd. (Shanghai, China), while a control shRNA, and control lentiviral vectors LVCON238 and LVCON220 unrelated to human sequences served as negative controls (Table 2). The shRNA vector (Sigma-Aldrich; St. Louis, MO, USA) was co-transfected with packaging vectors pCMV-Dr82 (Sigma-Aldrich; St. Louis, MO, USA) and pCMV-VSVG (Sigma-Aldrich; St. Louis, MO, USA) at a ratio of 4:3:2 into 293T cells using a Lipofectamine 2000 reagent (Invitrogen; Carlsbad, CA, USA). Polybrene (6 µg/mL; Sigma-Aldrich; St. Louis, MO, USA) was added for viral infection. For generating stable clones, the Id1 knockdown (KD) and control cells were selected by 1.5 µg/mL puromycin (Merck KGaA; Darmstadt, Germany) for three weeks. The KD of Id1 was checked by Western blotting and qPCR assays.
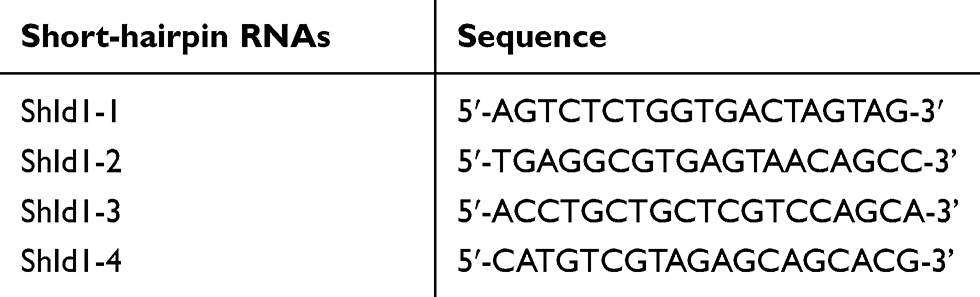 |
Table 2 Sequences of short-hairpin RNAs targeting inhibitor of DNA binding 1 |
Measurement of cell growth
Id1 KD HCT116 cells and respective controls were seeded onto cell culture E-plates (Corning; Corning, NY, USA) at a cell density of 1×10⁵ cells per well incubated in culture medium at 37 °C containing 5% CO2. The cell growth curves were automatically recorded on the RTCA system (ACEA Biosciences, Inc.; San Diego, CA, USA). The cell index was followed for 3 days.
Cell-colony formation assay
Log-phase cells were seeded onto 6-well plates (Corning; Corning, NY, USA) at a density of 800 cells in each well. Following incubation for 12 to 14 days, the medium was removed, and cells were washed twice with PBS, fixed in methanol for 30 min, stained with 0.1% crystal violet staining solution for 10 to 20 min, and washed twice in PBS. The cell colonies were counted.
Luciferase reporter assay
The HCT116 cells stably transfected with shId1 and vector controls were seeded onto 6-well plates (Corning; Corning, NY, USA) at a density of 4×10⁵ cells per well and incubated in an atmosphere containing 5% CO2 at 37 °C for 24 h. Then, cells were co-transfected with 1 µg TCF/LEF reporter (firefly luciferase; Genomeditech Co., Ltd.; Shanghai, China) and 0.02 µg of pRL (Renilla luciferase)-SV40 (internal standard) using a Lipofectamine 2000 reagent. At 24 h after transfection, luciferase reporter assays were performed using the Dual-Luciferase Reporter Assay System (Promega; Madison, WI, USA). The activities of target luciferase reporters vs pRL-SV40 (firefly/Renilla) were presented as the relative luciferase activity (RLA). Promoter activities were measured in at least three independent experiments.
MTS assay
HCT116 cells transfected with ShId1 and control shRNA were seeded onto 96-well plates (Corning; Corning, NY, USA) at a density of 4×10³ cells per well and cultured at 37 °C containing 5% CO2 for 48 h. Cell proliferation was determined using an MTS assay (Promega; Madison, WI, USA) according to the manufacturer’s instructions.
Flow cytometry
The CD133/2 and CD24 expression was quantified using flow cytometry using a standard protocol. Briefly, cells were labeled with mouse anti-human CD24-Percp-Cy 5.5 (BD Biosciences; San Jose, CA, USA) and mouse anti-human CD133/2-PE (Miltenyi Biotec GmbH; Bergisch Gladbach, Germany) antibodies, while mouse Percp-Cy 5.5-IgG1 K isotype antibodies (BD Biosciences; San Jose, CA, USA) and PE-IgG2b isotype (Miltenyi Biotec GmbH; Bergisch Gladbach, Germany) served as isotype controls. Then, cells were washed and analyzed on a FACSCaliber flow cytometer (BD Biosciences; San Jose, CA, USA). Apoptosis or necrosis was determined using the AnnexinV-PE/7-AAD Apoptosis Detection Kit (BD Biosciences; San Jose, CA, USA) following the manufacturer’s instructions, and cell cycle was determined using BD CycletestTM Plus DNA Reagent Kit (BD Biosciences; San Jose, CA, USA). All experiments were repeated in triplicate.
Sphere-forming assay
For a sphere-forming assay, cells were harvested, prepared into single-cell suspensions and cultured in the serum-free DMEM/F12 medium (HyClone; Logan, UT, USA) supplemented with 20 ng/mL basic fibroblast growth factor (bFGF; Millipore, Billerica, MA, USA), 10 ng/mL recombinant human epidermal growth factor (rhEGF; R&D Systems, Minneapolis, MN, USA) and 2% B27 (Gibco; GrandIsland, NY, USA). Cell were plated with a defined number (100 cells) in a fixed volume of 200 μl per well in 96-well plates, with at least 6 wells assigned for each cell concentration. Cells were cultured for 5 to 7 days and numbers of floating spheres with more than 50 µm were evaluated. Sphere forming efficiency was calculated in each well as numbers of spheres. The mean size derived from individual spheres constituted the in vitro self-renewal assay.
Wnt and Shh signaling inhibitor treatment
Cells were seeded onto 6-well plates (Corning; Corning, NY, USA) at a density of 4×10⁵ cells per well and incubated in an atmosphere containing 5% CO2 at 37 °C for 24 h. Then, cells were exposed to a Wnt signaling inhibitor FH535 (Abcam, Inc.; Cambridge, MA, USA) and Shh signaling inhibitor HPI-1 (Abcam, Inc.; Cambridge, MA, USA) at a dose of 10 μM. Cells were harvested for the subsequent experiments 48 h post-treatment.
qPCR assay
Total RNA was extracted from cells and fresh specimens using the RNeasy Mini Kit (Qiagen, Inc.; Valencia, CA, USA) and reverse-transcribed into cDNA using the Promega Reverse Transcription System A3500 (Promega; Madison, WI, USA). qPCR assay was run on a LightCycler Roche 480 Real-time PCR system (Roche Molecular Biochemicals; Basel, Switzerland) with a DyNAmo Flash SYBR Green qPCR Kit (Thermo Fisher Scientific, Inc.; Waltham, MA, USA) under the following conditions: at 95 °C for 15 min; followed by 40 cycles of at 95 °C for 15s, at 55 °C for 30 s, at 72 °C 1 s, and at 55 °C for 1 s; and finally at 40 °C for 1 min. Primers for genes of interest were listed in Table 3, and β-actin served as an internal reference control. For the relative quantification of the mRNA levels, three independent amplifications were performed for each target gene, with triplicate samples. The relative quantity of mRNA expression was calculated using the 2−ΔΔCt method.
 |
Table 3 Primers for genes of interest |
Western blotting assay
Cells were harvested and homogenized in a lysis buffer containing 50 mM HEPES (pH 7.4), 250 mM NaCl, 1% Nonidet P-40, 1 mM EDTA, 1 mM Na3VO4, 1 mM NaF, 1 mM PMSF, 1 mM dithiothreitol, and a protease inhibitor cocktail (Roche; Indianapolis, IN, USA). Total protein concentration was quantified using the BCA Protein Assay Kit (Pierce; Rockford, IL, USA), and the samples were boiled for 5 min. Equal amounts of protein were electrophoresed on 10–15% polyacrylamide gradient gels (Bio-Rad Laboratories, Inc.; Hercules, CA, USA). After immunoblotting, membranes were blocked in 3% bovine serum albumin (BSA; VWR International, Radnor, PA, USA) at room temperature for 2 h. Then, the membrane was incubated with primary mouse anti-CD24 monoclonal antibody (1:5000; Abcam, Inc.; Cambridge, MA, USA), mouse anti-CD133-2 monoclonal antibody (1:5000; Abcam, Inc.; Cambridge, MA, USA), rabbit anti-MUC2 monoclonal antibody (1:5000; Abcam, Inc.; Cambridge, MA, USA), rabbit anti-Lgr5 monoclonal antibody (1:5000; Abcam, Inc.; Cambridge, MA, USA), rabbit anti-Id1 polyclonal antibody (1:200; Santa Cruz Biotechnology; Santa Cruz, CA, USA), rabbit β-catenin monoclonal antibody (1:5000; Abcam, Inc.; Cambridge, MA, USA), rabbit anti-Twist, -Snail, -Slug, -twist, EpCAM, CD166, CyclinD1 (Santa Cruz Biotechnology; Santa Cruz, CA, USA), CD44, EZH2, snail, slug, OCT4 (Cell Signaling Technology; Beverly, MA, USA) and β-actin (Santa Cruz Biotechnology; Santa Cruz, CA, USA), respectively overnight at 4 °C. The binding of secondary horseradish peroxidase antibodies was visualized by enhanced chemiluminescence (ECL; Pierce, Rockford, IL, USA).
Tumorigenic assay
To assess the effect Id1 KD on tumor initiation, shId1-transfected and non-transfected HCT116 cells were subcutaneously injected into the right and left groins at densities of 1×10⁴ 1×10⁵ 5×10⁵ and 1×10⁶ cells, respectively. The emergence of tumors was monitored for 6 weeks post-injection. Tumor size was measured every week with a digimatic caliper (Mitutoyo; Tokyo, Japan), and the tumor volume was calculated using the following formula:
tumor volume = tumor length × tumor width2/2
Statistical analysis
All measurement data were expressed as mean ± standard deviation (SD), and the categorical data were presented as number or proportions. Differences of means between groups were compared with Student's t-test, and comparison of the categorical data was done with chi-square test or Fisher’s exact test. The correlation between Id1 and CD133 expression was examined using Spearman correlation analysis. All statistical analyses were performed using the statistical software SPSS version 20.0 (SPSS, Inc.; Chicago, IL, USA), and a P-value of <0.05 was considered statistically significant.
Results
Correlation between Id1 and CD133 expression in human CRC specimens
Previous studies have shown elevated Id1 and CD133 expression in human CRC specimens;22,31 however, there is no direct evidence to support the link between Id1 and CD133 in clinical specimens until now. We detected Id1 and CD133 mRNA expression in 30 human CRC and paired normal mucosal specimens, and qPCR assay showed higher Id1 and CD133 mRNA expression in the CRC specimens than in normal mucosal specimens (P<0.05) (Figure 1A and B). Spearman correlation analysis revealed that Id1 mRNA expression positively correlated with CD133 mRNA expression (r =0.401, P=0.031) (Figure 1C).
 |
Figure 1 Id1 and CD133 expression in human colorectal cancer specimens and normal mucosal specimens. (A and B) higher Id1 (A) and CD133 (B) mRNA expression is detected in human colorectal cancer specimens than in matched normal mucosal specimens (P<0.05). The data are presented as mean ± SD. *P<0.05 vs the normal mucosal specimens; (C) Spearman correlation analysis reveals a positive correlation between Id1 and CD133 mRNA expression; (D) representative immunohistochemical staining of Id1 and CD133 expression (400×); (E) Spearman correlation analysis reveals a positive correlation between Id1 and CD133 protein expression in colorectal cancer patients. Abbreviation: Id1, inhibitor of DNA binding 1. |
Then, we used IHC to determine the protein levels of Id1 and CD133 in human CRC and normal mucosal specimens. There was no cytoplasmic expression of Id1 seen in the 20 normal mucosal specimens (Figure 1D), and high cytoplasmic expression of Id1 was detected in 35 CRC specimens (46.7%); while CD133 was highly expressed in 22 CRC specimens (29.3%) and negatively expressed in 18 normal mucosal specimens, but mildly expressed in 2 normal mucosal specimens. We then examined the associations of Id1 and CD133 expression with the clinicopathologic characteristics in the CRC patients. High Id1 expression was found to positively correlate with poor differentiation (P=0.034), and CD133 expression was found to correlate with T category (P=0.002) (Table 4). In addition, Spearman correlation analysis revealed a positive correlation between Id1 and CD133 protein expression in CRC patients (r =0.319, P=0.005) (Figure 1E), indicating a link between Id1 and CRC stem cell phenotype.
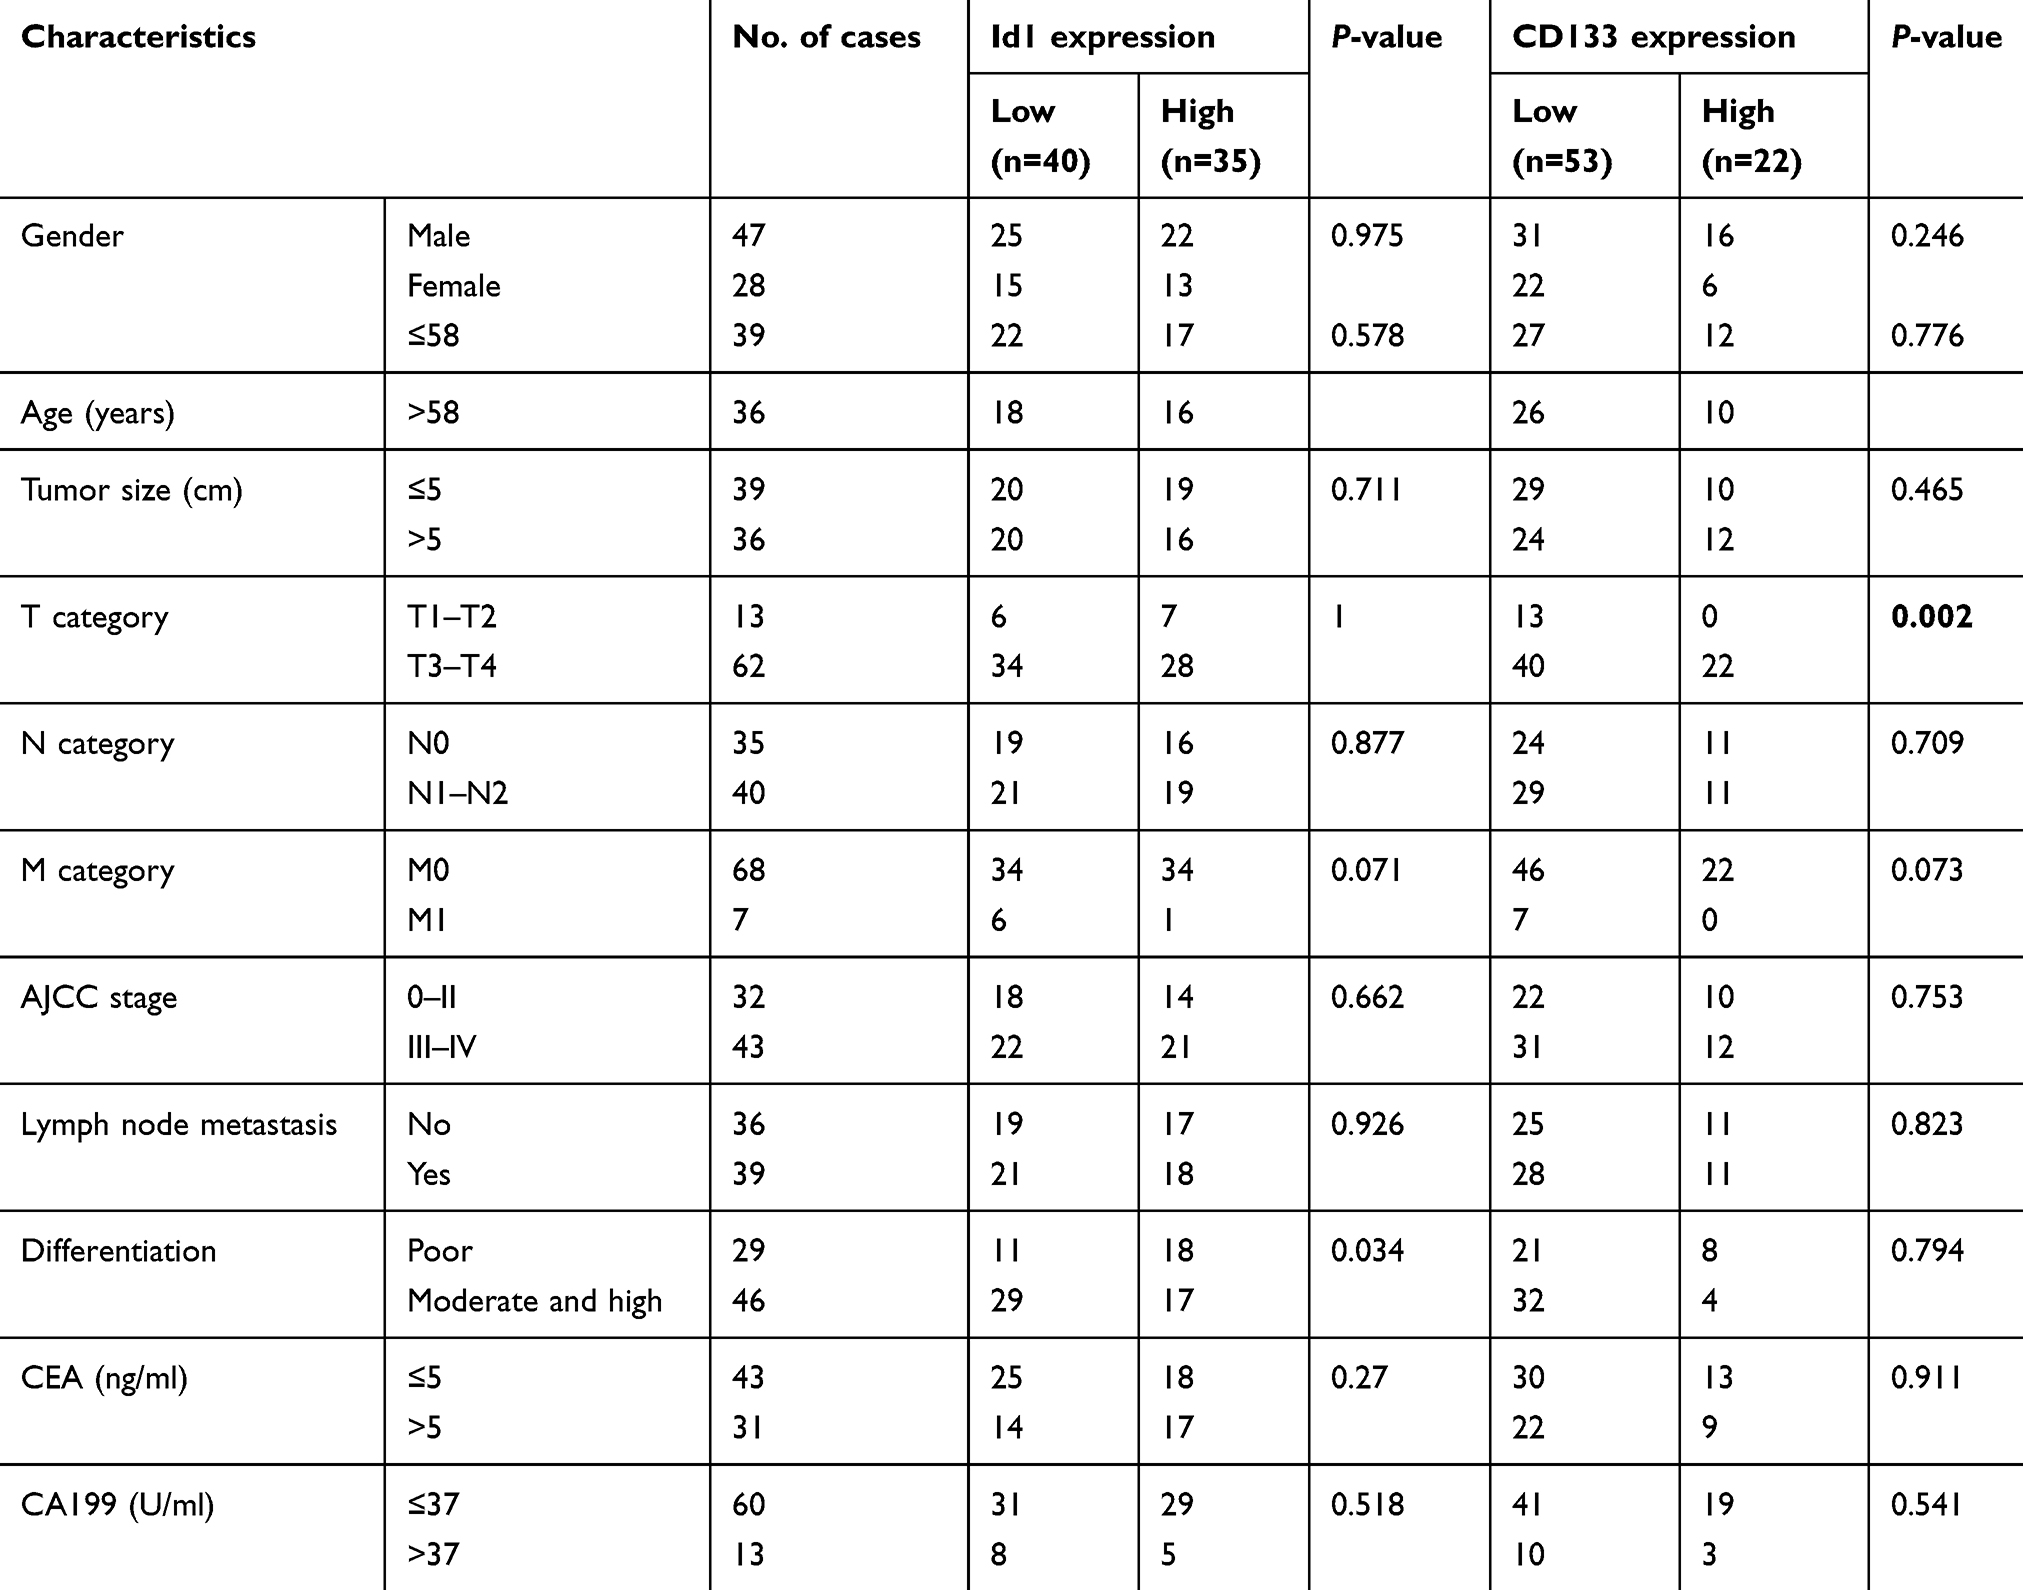 |
Table 4 Associations of Id1 and CD133 expression with clinicopathologic characteristics in colorectal cancer patients |
Id1 KD inhibits CRC cell proliferation and colony formation
Since high Id1 expression was positively associated with poor differentiation in human CRC specimens, and HCT116 is a poorly differentiated CRC cell line, a stable Id1 KD HCT116 cell line was generated using shRNA, and Western blotting was performed to check the KD efficiency (Figure 2A). Then, we evaluated the effect of Id1 KD on HCT116 cell proliferation, and real-time cell analysis (RTCA) showed greater inhibition of Id1 KD HCT116 cells than control cells 48 h post-transfection (Figure 2B). Fluorescence-activated cell sorting (FACS) analysis revealed a significant reduction in the number of Id1 KD HCT116 cells at S phase and a remarkable rise in the number of Id1 KD HCT116 cells at G0/G1 phase relative to controls cells (P<0.05) (Figure 2C). Cell colony-forming assay showed lower numbers of cell colonies in Id1 KD HCT116 cells than in control cells (P<0.05) (Figure 2D). These data demonstrate that Id1 KD suppresses CSC cell proliferation and colony formation.
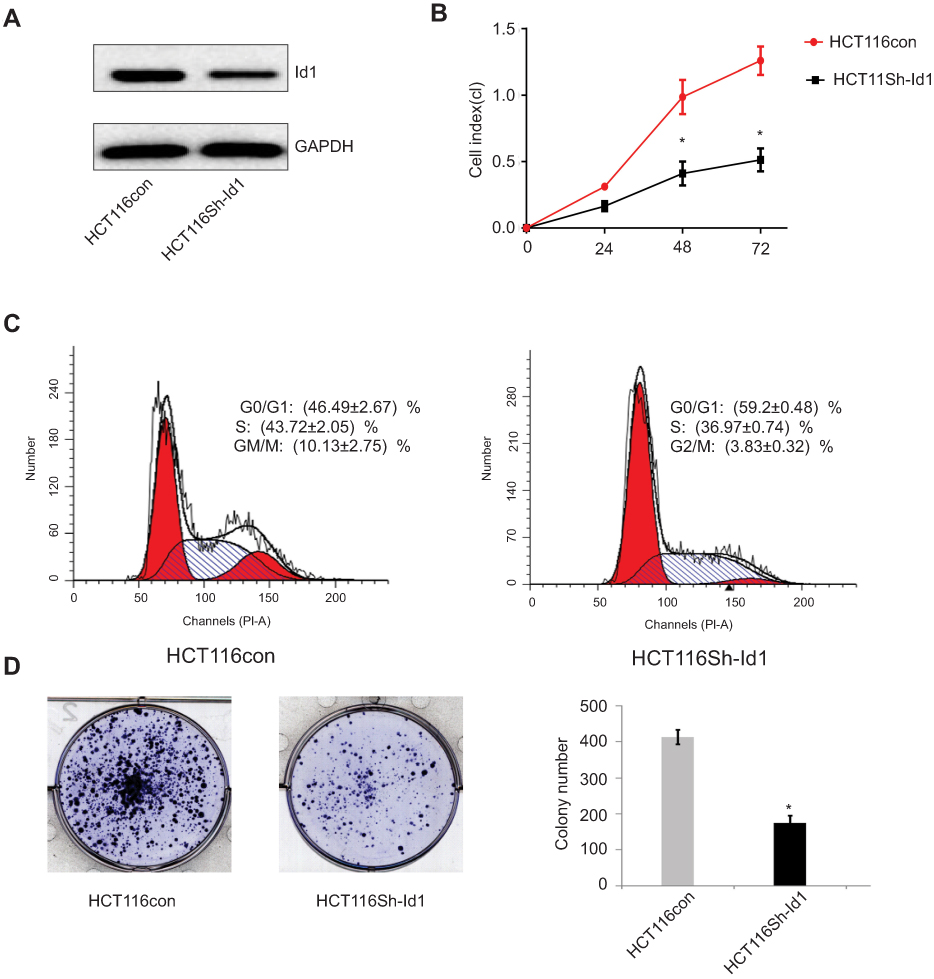 |
Figure 2 Effects of inhibitor of DNA binding 1 (Id1) knockdown on cancer-initiating cell features in HCT116 cells. (A) Id1 knockdown efficiency is checked by Western blotting assay; (B) real-time cell analysis (RTCA) shows greater inhibition of Id1 knockdown HCT116 cells than control cells 48 h post-transfection; (C) fluorescence-activated cell sorting (FACS) analysis reveals a significant reduction in the number of Id1 knockdown HCT116 cells at S phase and a remarkable rise in the number of Id1 knockdown HCT116 cells at G0/G1 phase relative to controls cells (P<0.05); (D) cell colony-forming assay shows lower numbers of cell colonies in Id1 knockdown HCT116 cells than in control cells. *P<0.05 vs the control cells. |
Id1 promotes CRC cell stemness and tumor-initiating capability
Since Id1 expression was found to correlate positively with CD133 expression, we therefore evaluated the effect of Id1 KD on the stemness of HCT116 cells. First, HCT116 cells were cultured in serum-free medium to assess the self-renewal capability of CSC. The sphere-forming rate was 37%±2.4% in Id1 KD HCT116 cells and 14%±1.8% in the control cells (P<0.01), and the median diameter of sphere-forming cells was 115.3±5.24 μm in Id1 KD HCT116 cells and 41.67±3.48 μm in control cells (P<0.01) (Figure 3A). To further verify the self-renewal potential of the sphere-forming cells, the spheres were dissociated and subjected to secondary sphere-forming assay 5 to 7 days post-dissociation. Similarly, Id1 KD decreased both the number and size of spheres by 1/3 to 1/2 compared to the controls. These data suggest that the Id1 KD suppresses the self-renewal capability of HCT116 cells.
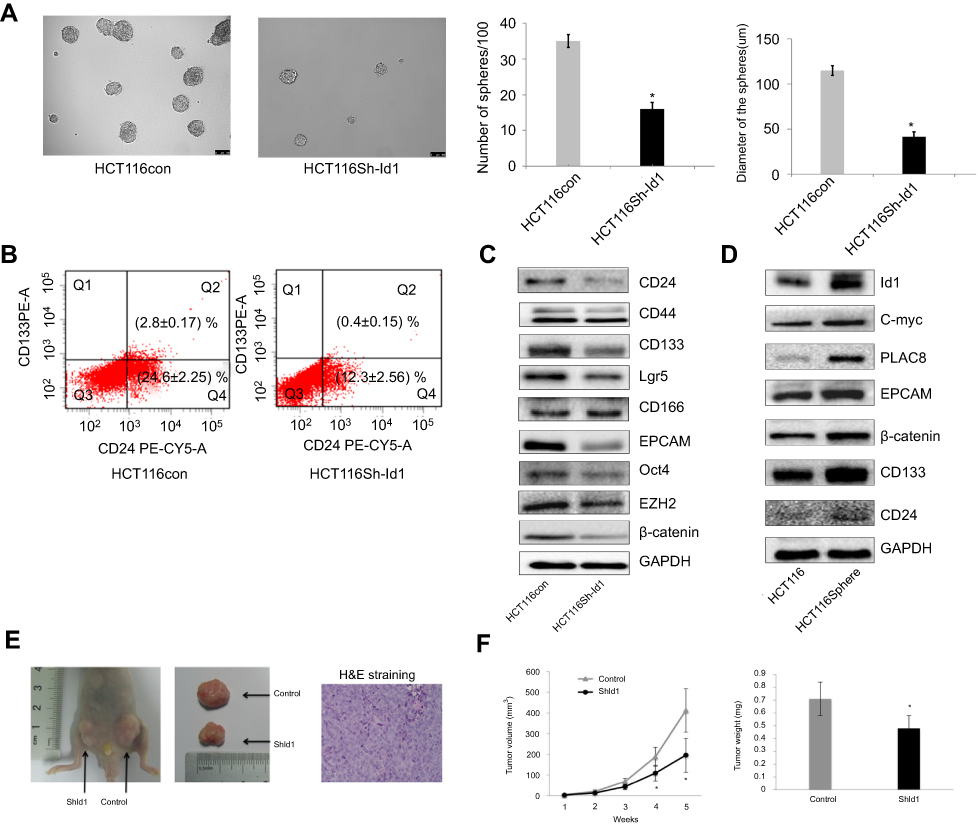 |
Figure 3 Inhibitor of DNA binding 1(Id1) promotes colorectal cancer cell stemness and tumor-initiating capability. (A) sphere-forming assay reveals higher sphere-forming rate of Id1 knockdown HCT116 cells than that of control cells (37% ±2.4% vs 14% ±1.8%) and larger Id1 knockdown HCT116 cells than controls cells (median diameter, 115.3±5.24 vs 41.67±3.48 μm), *P<0.01 vs the control cells; (B) fluorescence-activated cell sorting (FACS) analysis shows lower proportions of CD24+, CD24+/CD133+ and CD133+ cells in Id1 knockdown HCT116 cells than in control cells; (C) Western blotting determines lower CD24, CD133, EpCAM, Oct4, EZH2, Lgr5 and β-catenin expression in Id1 knockdown HCT116 cells than in controls cells, and no significant differences are seen in CD44 or CD166 expression between in Id1 knockdown HCT116 cells and control cells; (D) Western blotting determines significantly higher Id1 expression in sphere-forming HCT116 cells than in HCT116 cells; (E) slower growth of the xenograft tumor is seen from Id1 knockdown HCT116 cells than from HCT116 cells at a same cell dosing; (F) smaller xenograft tumors are measured from Id1 knockdown HCT116 cells than from HCT116 cells at a same cell dosing. *P<0.05 vs the control cells. |
Then, FACS analysis showed a clear-cut reduction of CD24+, CD24+/CD133+ and CD133+ cells in Id1 KD HCT116 cells relative to control cells (Figure 3B). Western blotting assay was performed to examine the effect of Id1 KD on the expression of CSC markers in CRC cells. Id1 KD was found to cause a significant reduction in the CD24, CD133, EpCAM, Oct4, EZH2, Lgr5 and β-catenin expression, but did not affect the CD44 or CD166 expression (Figure 3C). In addition, Western blotting determined significantly higher Id1 expression in sphere-forming HCT116 cells than in HCT116 cells (Figure 3D). These data indicate that Id1 KD plays a critical role in maintaining the stemness of CRC cells.
Furthermore, an in vivo tumorigenicity assay was performed to examine the role of Id1 in the tumor-initiating capability. As expected, Id1 KD significantly decreased the number of tumor-initiating HCT116 cells. At 3 week post-injection, 105 control HCT116 cells were sufficient to initiate CRC growth in 1/6 of the mice, while at least 5×10⁵ Id1 KD HCT116 cells were required to initiate xenograft tumors (Table 5). Continuous monitoring of the xenograft tumor growth showed that Id1 KD HCT116 cells initiated much slower xenograft tumor growth and formed smaller xenograft tumors than control cells at a same cell dosing (Figure 3E and F). These data demonstrate that Id1 KD impairs the tumor-initiating capability in CRC.
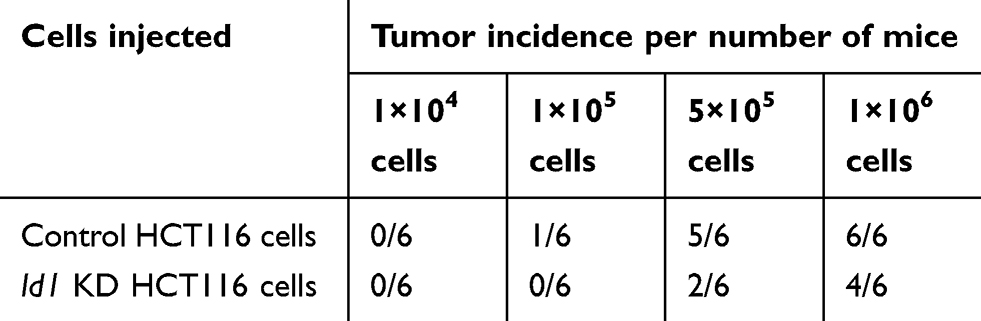 |
Table 5 Tumor incidence of inhibitor of DNA binding 1 (Id1) knocked down (KD) HCT116 and control HCT116 cells injected into nude mice |
Id1 KD suppresses epithelial-mesenchymal transition (EMT) and increases chemosensitivity in HCT116 cells
To assess the effect of Id1 KD on EMT features in HCT116 cells, we determined the expression of EMT-associated markers. Id1 KD HCT116 cells had their morphology shifting from scattered, spindle- and fibroblastic-like shapes to tightly packed, cuboid, epithelial-like appearance (Figure 4A), indicating the presence of EMT reversal. Western blotting analysis showed that Id1 KD resulted in down-regulation of Twist, Snail, Vimentin and Slug expression and up-regulation of E-cadherin, ZO-1 and Claudin-1 expression (Figure 4B).
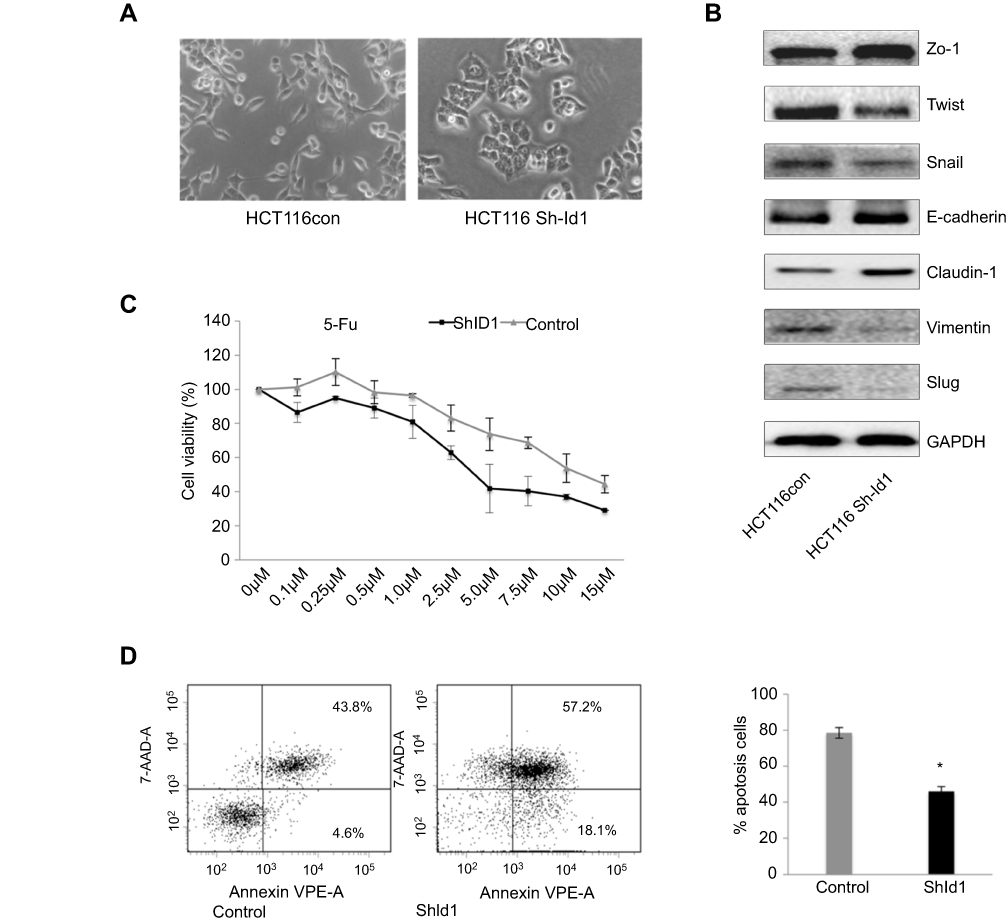 |
Figure 4 Inhibitor of DNA binding 1 (Id1) knockdown suppresses epithelial-mesenchymal transition (EMT) and increases chemosensitivity in HCT116 cells. (A) HCT116 cells have scattered, spindle- and fibroblastic-like shapes, and Id1 knockdown HCT116 cells have tightly packed, cuboid, epithelial-like appearance; (B) Western blotting analysis determines lower Twist, Snail, Vimentin and Slug expression and higher E-cadherin, ZO-1 and Claudin-1 expression in Id1 knockdown HCT116 cells than in HCT116 cells; (C) MTS assay measures a lower viability of Id1 knockdown HCT116 cells than that of control cells following 5-FU treatment, and the 5-FU IC50 values are 5.2±0.3 and 8.4±0.4 μM for the Id1 knockdown HCT116 cells and control cells, respectively; (D) flow cytometry detects a significantly higher apoptotic rate in Id1 knockdown HCT116 cells than in control cells following treatment with 5-FU at a dose of 10 μM. *P<0.05 vs the control cells. |
According to the CSC theory,31 CSCs have a low sensitivity to chemotherapy,32 we therefore investigated whether Id1 KD led to an increase in the sensitivity to 5-fluorouracil (5-FU), a common anticancer drug. MTS assay showed that the viability of Id1 KD HCT116 cells was lower than that of control cells following 5-FU treatment, and the 5-FU IC50 values were 5.2±0.3 and 8.4±0.4 μM for the Id1 KD HCT116 cells and control cells, respectively (P<0.05, Figure 4C).
Subsequently, we examined whether Id1 KD-induced increased sensitivity to 5-FU was attributed to the increase in apoptosis, flow cytometry detected a significantly higher apoptotic rate in Id1 knockdown HCT116 cells than in control cells following treatment with 5-FU at a dose of 10 μM (Figure 4D), suggesting that Id1 KD decreases the chemoresistance to 5-FU in HCT116 cells. Taken together, our data demonstrate that Id1 KD inhibits CSC-like characteristics in CRC cells.
Id1 maintains CRC stemness through the Id1-c-Myc-PLAC8 axis via the Wnt/β-catenin and Sonic Hedgehog (Shh) signaling pathways
Since Id1 KD was found to reduce CD133 expression, and inhibition of the Wnt signaling has been shown to decrease CD133 expression,33 it is therefore hypothesized that Id1 affects CSC functions via the Wnt signaling pathway. Firstly, we detected the subcellular localization of β-catenin in Id1 KD HCT116 cells, and Id1 KD was found to induce a reduction in the cytoplasmic and nuclear β-catenin levels (Figure 5A). Following entry in nucleus, β-catenin interacts with the transcription factors of the T-cell factor/lymphoid enhancer factor (TCF/LEF) family, thereby activating the transcription of downstream molecules of the Wnt signaling pathway.34 The TCF/LEF reporter luciferase assay revealed that the relative TCF/LEF activity was significantly lower in Id1 KD HCT116 cells as compared to the control cells, and Western blotting resulted in down-regulation of CyclinD1, Survivin and C-myc expression in Id1 KD HCT116 cells (Figure 5A). These findings demonstrate that Id1 may maintain the stemness of CRC cells through activating the Wnt/β-catenin signaling pathway.
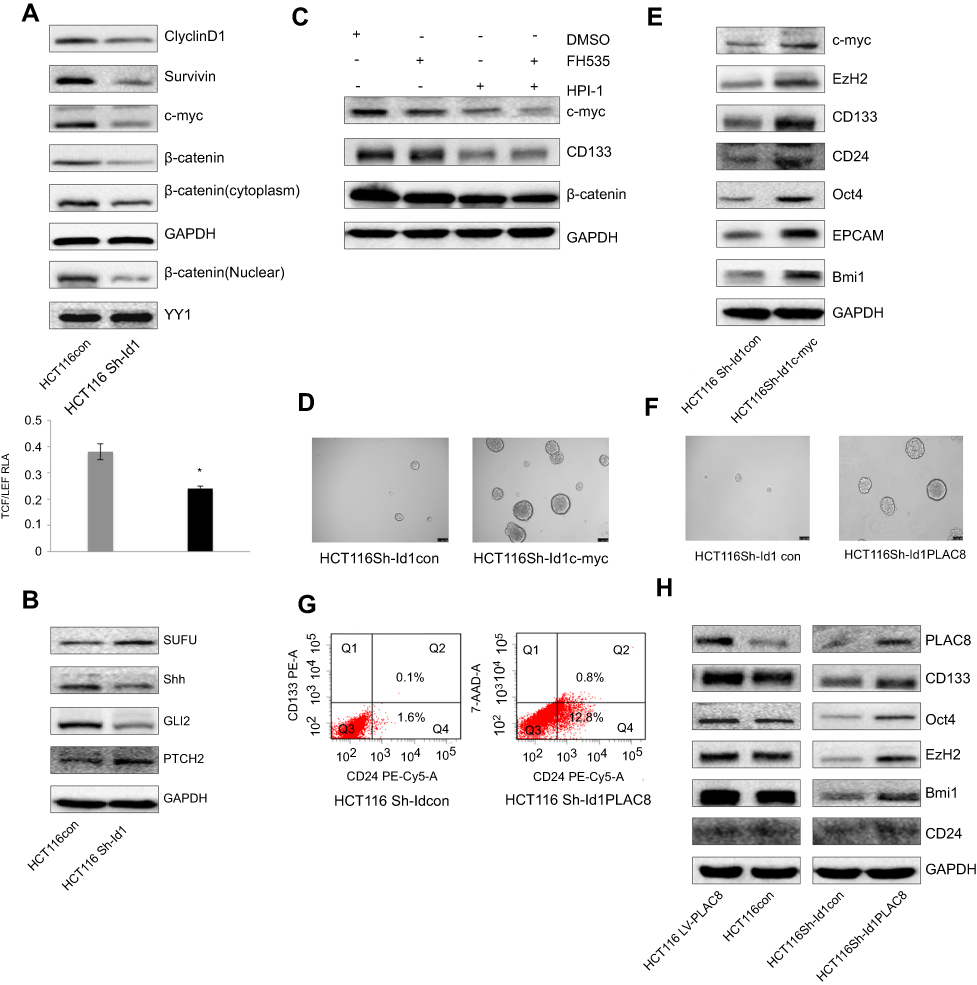 |
Figure 5 Inhibitor of DNA binding 1 (Id1) maintains the stemness of colorectal cancer cells through the Id1-c-Myc-PLAC8 axis via the Wnt/β-catenin and Sonic Hedgehog (Shh) signaling pathways. (A) Western blotting determines lower CyclinD1, Survivin, C-myc and cytoplasmic and nuclear β-catenin expression in Id1 knockdown HCT116 cells than in control cells, and lower relative TCF/LEF activity is measured in Id1 knockdown HCT116 cells than in control cells. *P<0.05; (B) Western blotting determines higher PTCH2 and SUFU expression and lower GLI2 and Shh expression in Id1 knockdown HCT116 cells than in control cells; (C) Western blotting determines lower C-myc expression in HCT116 cells exposed to FH535 and HPI-1 than in cell treated with FH535 or HPI-1 alone; (D) higher C-myc expression is seen in Id1 knockdown HCT116 cell overexpressing C-myc than in Id1 knockdown HCT116 cells; (E) Western blotting determines higher C-myc, EZH2, CD133, CD24, Oct4, EPCAM and Bmi1 expression in Id1 knockdown HCT116 cell overexpressing C-myc than in Id1 knockdown HCT116 cells; (F) lower PLAC8 expression is detected in Id1 knockdown HCT116 cells than in control cells; (G) fluorescence-activated cell sorting (FACS) analysis reveals a significant rise in the number of CD24+ and CD133+/CD24+ cell populations in Id1 knockdown HCT116 cells overexpressing PLAC8 than in control cells; (H) Western blotting determines higher C-myc, EZH2, CD133, CD24, Oct4, EPCAM and Bmi1 expression in Id1 knockdown HCT116 cells overexpressing PLAC8 relative to Id1 knockdown HCT116 cells. |
Since Shh signaling is an important pathway involved in mediating cell stemness, the expression of key proteins in the Shh signaling pathway was detected. Western blotting showed that Id1 KD upregulated PTCH2 and SUFU expression and downregulated GLI2 and Shh protein in HCT116 cells (Figure 5B). Then, we further examined whether Id1 maintained the stemness of CRC cells through activating the Wnt and Shh signaling pathways. HCT116 cells were exposed to a Wnt signaling inhibitor FH535 and a Shh inhibitor HPI-1, and the combined treatment with FH535 and HPI-1 caused a higher reduction in the C-myc protein expression than treatment with FH535 or HPI-1 alone (Figure 5C). It is therefore hypothesized that C-myc may be a key gene that regulates Id1-mediated CRC stemness. To test this hypothesis, C-myc was overexpessed in Id1 KD HCT116 cells, and both Western blotting and sphere-forming assay showed that C-myc overexpression reversed the stemness of Id1 KD HCT116 cells (Figure 5D and E).
When we detected the expression of stemness-related markers in sphere-forming HCT116 cells, higher PLAC8 expression was found in the sphere-forming HCT116 cells than in HCT116 cells. Since PLAC8 is a downstream target gene of C-myc, we quantified PLAC8 expression using Western blotting, and Id1 KD was found to downregulate PLAC8 expression while Id1 overexpression upregulated PLAC8 expression (Figure 5F). To examine the effect of PLAC8 on the stemness features of CRC cells, PLAC8 was overexpressed in HCT116 and Id1 KD HCT116 cells, and Western blotting showed that PLAC8 overexpression resulted in elevated expression of stemness-related markers in HCT116 cells relative to Id1 knockdown HCT116 cells (Figure 5H). In addition, sphere-forming assays showed that the number and the mean diameter of sphere-forming Id1 KD HCT116 cells overexpressing PLAC8 were significantly greater than the control cells, and FACS analysis revealed a significant rise in the number of CD24+ and CD133+/CD24+ cell populations in Id1 KD HCT116 cells overexpressing PLAC8 than in control cells (Figure 5G). Taken together, these data demonstrate that Id1 maintains the stemness of CRC cells via the Id1-c-Myc-PLAC8 axis through activating the Wnt/β-catenin and Shh signaling pathways.
Discussion
Using immunohistochemical methods, we found that high Id1 expression was associated with poor differentiation state in CRC patients, and this result was in line with previous study.22 As current knowledge considers that cancers are initiated and maintained by a subpopulation of cells with the ability to self-renew, termed CSCs.35 In recent years, great progresses have been achieved in identifying markers of colon CSCs, such as CD133, CD24, CD44, CD166, Lgr5.35 However, CD133 was the first discovered and considered as a potential specific marker of colon CSCs in 2007.36 It was reported that only 1/262 of CC-IC in CD133+ cells formed tumors in immunodeficient mice while 1/5.73×104 unfractionated tumor cells could form tumor.36 In addition, injection of CD133+ but not CD133− colon cancer cells produced tumors in immunodeficient mice.37 Although the role of CD133 as a marker of colon CSCs is questioned, a recent meta-analysis study showed that CD133 is an efficient prognostic factor in CRC, and its expression is significantly associated with poorer clinical outcome, T category, N category and vascular invasion.38 In this study, we confirmed that high CD133 expression was associated with T category. More importantly, this is the first report to demonstrate a positive association between Id1 and CD133 expression in CRC samples. Our data further support the evidence that Id1 may play a critical role in regulating colon CSCs through governing CD133 expression.
It is becoming quite clear that HCT116 cell line has a high proportion of CSCs.39 Indeed, we found HCT116 had high rates of CSC markers such as CD133 and CD44. Using shRNA to knockdown Id1 expression in HCT116 cells, we found that Id1 KD blocked the sphere-formation capacity of HCT116 cells and suppressed CD133 expression. In vivo animal studies demonstrated the Id1 KD impaired tumor growth and tumor-initiating capabilities in HCT116 cells. As multiple reports have demonstrated that using co-expressed stemness markers including CD133, CD166, CD44, EpCAM, CD24, Lgr5 and β-catenin would be better than a single stemness marker to present colon CSCs.40 Then, we found Id1 KD restrained other colon CSC markers at both translational and transcriptional levels, including CD24, OCT4, EpCAM and EZH2, and a reduction was detected in the percentages of CD133+, CD24+ and CD133+/CD24+ cell populations in Id1 KD HCT116 cells. These data demonstrate that Id1 plays a crucial role in cancer stem-like properties in HCT116 cells. Both Id1 and Id3 KD were reported to impair the self-renewal capacity of CRCs; however, no changes were seen in the phenotype of colon CSCs,29 which may be attributed to various cell lines used. In the previous study, 0% to 49.8% CD133 expression was detected, which was much lower than that (83%) in our study.
It has been proved that CSCs are responsible for chemoresistance after standard treatment.30,41 Previous studies have shown that Id1 increases resistance to chemotherapeutic agents in solid tumors, such as taxol, docetaxel and oxaliplatin,29,42,43 and Id1 down-regulation resulted in an increases in the sensitivity to chemotherapeutic agents in multiple cancers.23–26 In the present study, we found that Id1 KD increased the sensitivity to 5-FU and induced apoptosis of HCT116 cells. It was indicated that CD133+ CRCs exhibited a higher proliferating potential and showed a higher resistance to 5-FU and irradiation compared with CD133− cells.44 In this study, we found a higher sensitivity to 5-Fu in Id1 KD cells, which was in agreement with previous studies.23–26 This may be attribute to the reduced CD133 expression in HCT116 cells; however, the underlying mechanisms warrant further investigations.
As we know, HCT116 cell line has little capacity to differentiate.39 Previous studies have demonstrated that Id proteins are required for differentiation in various cell types.16 In our study, we found Id1 KD increased expression of differentiation markers (MUC2 and CK20), which supported the role of Id1 in induction of colonic cell differentiation. Upon cell differentiation, CD133 expression is quickly decreased.45 Our findings suggest that Id1 KD may enable the colon CSCs to differentiate in HCT116 cells. It is therefore assumed that Id1 might be a promising therapeutic strategy against colorectal CSCs.
EMT causes loss of intercellular adhesion and epithelial polarization and also gains of mesenchymal traits, which facilitates cells to undergo changes in cell morphology and mediate single-cell invasion in cancer.46 In addition, EMT is believed to act in tumor development by producing cells with stem cell features.47 It was indicated that loss of Id1 and Id3 upregulated E-cadherin expression in EMT negative prostate cancer cell lines,48 and suppression of KLF17 expression was reported to promote breast cancer cell invasion and EMT by directly binding to the promoter of Id1 to inhibit its transcription.49 In the current study, we found that Id1 KD resulted in EMT reversal possibly through increasing E-cadherin expression and decreasing the expression of major EMT regulators in CRCs, such as Snail and Twist. This may provide stronger evidence for the important role of Id1 in regulating the stemness of colon CSCs.
The mechanism by which Id1 KD regulates the self-renewal of CSCs and EMT features remains unclear. Multiple signaling pathways are involved in the regulation of stem cell self-renewal, EMT-like states and differentiation, including the Wnt/β-catenin signaling pathway. β-catenin is a central modulator of the canonical Wnt signaling pathway. If the accumulated cytosolic β-catenin translocates into the nucleus and forms the β-catenin/TCF complex, the transcription of Wnt target genes are activated.50 In breast cancer, overexpression of Id1 could activate Akt-mediated Wnt signaling pathway.51 Here, we observed that Id1 KD decreased the cytoplasmic/nuclear β-catenin expression and LEF/TCF luciferase activity, as well as the expression of Wnt target genes including cyclinD1 and Survivin. CD133, EpCAM, Snail and Twist are found to act as Wnt/β-catenin signaling-responsive molecule.52–54 Thus, it is reasonable to speculate that decreased Wnt/β-catenin may responsible for the stemness feature, cell differentiation, EMT and other phenotypic changes. Further studies are required to investigate the detailed molecular mechanisms underlying whether Id1 is involved in the regulation of EMT and stemness features via the non-classical Wnt pathway or other pathways.
Conclusions
In conclusion, the results of the present study demonstrate that Id1 expression is significantly associated with CSC marker CD133 expression in CRC patients. In addition, Id1 KD impairs CSC-like capacity and reverses EMT-traits, partially through the regulation of classical Wnt/β-catenin signaling in vitro. Targeting of Id1-based prevention and therapeutics may be beneficial and offer new hopes for CRC clinically.
Ethics approval and informed consent
This study was reviewed and approved by the Ethics Review Committee of Fujian Provincial Cancer Hospital (approval no. FJZLYY2012-00087). Written informed consent was obtained from all study subjects following a detailed description of the purpose of the study. All experiments were done in accordance with the Declaration of Helsinki and international and national Guidelines for the Care and Use of Laboratory Animals.
Abbreviation lists
CRC, colorectal cancer; CSC, cancer stem-like cell; KD, knockdown; Id: inhibitor of DNA-binding proteins; bHLH, basic helix-loop-helix; shRNA: short-hairpin RNA; rhEGF, recombinant human epidermal growth factor; BSA: bovine serum albumin; ECL, enhanced chemiluminescence; SD, standard deviation; FACS, fluorescence-activated cell sorting; 5-FU, 5-fluorouracil; TCF/LEF, T-cell factor/lymphoid enhancer factor; EMT, epithelial-mesenchymal transition; Shh, Sonic Hedgehog; RTCA, real-time cell analysis.
Acknowledgments
This study was supported by the grant from the National Natural Science Foundation of China (grant nos. 81472720 and 81250002).
Disclosure
The authors report no conflicts of interest in this work.
References
1. Brenner H, Kloor M, Pox CP. Colorectal cancer. Lancet. 2014;383(9927):1490–1502. doi:10.1016/S0140-6736(13)61612-8
2. Siegel RL, Miller KD, Fedewa SA, et al. Colorectal cancer statistics, 2017. CA Cancer J Clin. 2017;67(3):177–193. doi:10.3322/caac.21395
3. Ciombor KK, Wu C, Goldberg RM. Recent therapeutic advances in the treatment of colorectal cancer. Annu Rev Med. 2015;66:83–95. doi:10.1146/annurev-med-051513-102539
4. Bashir B, Snook AE. Immunotherapy regimens for metastatic colorectal carcinomas. Hum Vaccin Immunother. 2018;14(2):250–254. doi:10.1080/21645515.2017.1397244
5. Takayama T, Miyanishi K, Hayashi T, Sato Y, Niitsu Y. Colorectal cancer: genetics of development and metastasis. J Gastroenterol. 2006;41(3):185–192. doi:10.1007/s00535-006-1801-6
6. Mathonnet M, Perraud A, Christou N, et al. Hallmarks in colorectal cancer: angiogenesis and cancer stem-like cells. World J Gastroenterol. 2014;20(15):4189–4196. doi:10.3748/wjg.v20.i15.4189
7. Crea F, Nobili S, Paolicchi E, et al. Epigenetics and chemoresistance in colorectal cancer: an opportunity for treatment tailoring and novel therapeutic strategies. Drug Resist Updat. 2011;14(6):280–296. doi:10.1016/j.drup.2011.08.001
8. Fanale D, Castiglia M, Bazan V, Russo A. Involvement of non-coding RNAs in chemo- and radioresistance of colorectal cancer. Adv Exp Med Biol. 2016;937:207–228.
9. Debeb BG
10. Crea F, Danesi R, Farrar WL. Cancer stem cell epigenetics and chemoresistance. Epigenomics. 2009;1(1):63–79. doi:10.2217/epi.09.4
11. Hittelman WN, Liao Y, Wang L, Milas L. Are cancer stem cells radioresistant? Future Oncol. 2010;6(10):1563–1576. doi:10.2217/fon.10.121
12. Pranatharthi A, Ross C, Srivastava S. Cancer stem cells and radioresistance: rho/ROCK pathway plea attention. Stem Cells Int. 2016;2016:5785786. doi:10.1155/2016/1243659
13. Benezra R, Davis RL, Lockshon D, Turner DL, Weintraub H. The protein Id: a negative regulator of helix-loop-helix DNA binding proteins. Cell. 1990;61(1):49–59. doi:10.1016/0092-8674(90)90214-Y
14. Ling F, Kang B, Sun XH. Id proteins: small molecules, mighty regulators. Curr Top Dev Biol. 2014;110:189–216.
15. Lasorella A, Uo T, Iavarone A. Id proteins at the cross-road of development and cancer. Oncogene. 2001;20(58):8326–8333. doi:10.1038/sj.onc.1205093
16. Ling MT, Wang X, Zhang X, Wong YC. The multiple roles of Id-1 in cancer progression. Differentiation. 2006;74(9–10):481–487. doi:10.1111/j.1432-0436.2006.00083.x
17. Schoppmann SF, Schindl M, Bayer G, et al. Overexpression of Id-1 is associated with poor clinical outcome in node negative breast cancer. Int J Cancer. 2003;104(6):677–682. doi:10.1002/ijc.11009
18. Forootan SS, Wong YC, Dodson A, et al. Increased Id-1 expression is significantly associated with poor survival of patients with prostate cancer. Human Pathol. 2007;38(9):1321–1329. doi:10.1016/j.humpath.2007.02.011
19. Yang HY, Liu HL, Liu GY, et al. Expression and prognostic values of Id-1 and Id-3 in gastric adenocarcinoma. J Surg Res. 2011;167(2):258–266. doi:10.1016/j.jss.2009.08.006
20. Rothschild SI, Kappeler A, Ratschiller D, et al. The stem cell gene “inhibitor of differentiation 1” (ID1) is frequently expressed in non-small cell lung cancer. Lung Cancer. 2011;71(3):306–311. doi:10.1016/j.lungcan.2010.06.018
21. Luo KJ, Wen J, Xie X, et al. Prognostic relevance of Id-1 expression in patients with resectable esophageal squamous cell carcinoma. Ann Thorac Surg. 2012;93(5):1682–1688. doi:10.1016/j.athoracsur.2012.01.114
22. Zhao ZR, Zhang ZY, Zhang H, Jiang L, Wang MW, Sun XF. Overexpression of Id-1 protein is a marker in colorectal cancer progression. Oncol Rep. 2008;19(2):419–424.
23. Li L, Wei X, Wu B, Xiao Y, Yin M, Yang Q. siRNA-mediated knockdown of ID1 disrupts Nanog- and Oct-4-mediated cancer stem cell-likeness and resistance to chemotherapy in gastric cancer cells. Oncol Lett. 2017;13(5):3014–3024. doi:10.3892/ol.2017.5828
24. Przybyła T, Sakowicz-Burkiewicz M, Maciejewska I, Bielarczyk H, Pawełczyk T. Suppression of ID1 expression in colon cancer cells increases sensitivity to 5-fluorouracil. Acta Biochim Pol. 2017;64(2):315–322. doi:10.18388/abp.2016_1421
25. Ponz-Sarvisé M, Nguewa PA, Pajares MJ, et al. Inhibitor of differentiation-1 as a novel prognostic factor in NSCLC patients with adenocarcinoma histology and its potential contribution to therapy resistance. Clin Cancer Res. 2011;17(12):4155–4166. doi:10.1158/1078-0432.CCR-10-3381
26. Hu H, Han HY, Wang YL, et al. The role of Id-1 in chemosensitivity and epirubicin-induced apoptosis in bladder cancer cells. Oncol Rep. 2009;21(4):1053–1059. doi:10.3892/or_00000323
27. Jung S, Park RH, Kim S, et al. Id proteins facilitate self-renewal and proliferation of neural stem cells. Stem Cells Dev. 2010;19(6):831–841. doi:10.1089/scd.2009.0290
28. Romero-Lanman EE, Pavlovic S, Amlani B, Chin Y, Benezra R. Id1 maintains embryonic stem cell self-renewal by up-regulation of Nanog and repression of Brachyury expression. Stem Cells Dev. 2012;21(3):384–393. doi:10.1089/scd.2011.0428
29. O’Brien CA, Kreso A, Ryan P, et al. ID1 and ID3 regulate the self-renewal capacity of human colon cancer-initiating cells through p21. Cancer Cell. 2012;21(6):777–792. doi:10.1016/j.ccr.2012.04.036
30. Ke J, Wu X, Wu X, et al. A subpopulation of CD24+ cells in colon cancer cell lines possess stem cell characteristics. Neoplasma. 2012;59(3):282–288. doi:10.4149/neo_2012_036
31. Gil J, Stembalska A, Pesz KA, Sasiadek MM. Cancer stem cells: the theory and perspectives in cancer therapy. J Appl Genet. 2008;49(2):193–199. doi:10.1007/BF03195612
32. Spillane JB, Henderson MA. Cancer stem cells: a review. ANZ J Surg. 2007;77(6):464–468. doi:10.1111/j.1445-2197.2007.04156.x
33. Katoh Y, Katoh M. Comparative genomics on PROM1 gene encoding stem cell marker CD133. Int J Mol Med. 2007;19(6):967–970.
34. MacDonald BT, Tamai K, He X. Wnt/beta-catenin signaling: components, mechanisms, and diseases. Dev Cell. 2009;17(1):9–26. doi:10.1016/j.devcel.2009.06.016
35. Botchkina G. Colon cancer stem cells–from basic to clinical application. Cancer Lett. 2013;338(1):127–140. doi:10.1016/j.canlet.2013.03.034
36. O’Brien CA, Pollett A, Gallinger S, Dick JE. A human colon cancer cell capable of initiating tumour growth in immunodeficient mice. Nature. 2007;445(7123):106–110. doi:10.1038/nature05372
37. Ricci-Vitiani L, Lombardi DG, Pilozzi E, et al. Identification and expansion of human colon-cancer-initiating cells. Nature. 2007;445(7123):111–115. doi:10.1038/nature05384
38. Chen S, Song X, Chen Z, et al. Cd133 expression and the prognosis of colorectal cancer: a systematic review and meta-analysis. PLoS One. 2013;8(2):e56380. doi:10.1371/journal.pone.0056380
39. Yeung TM, Gandhi SC, Wilding JL, Muschel R, Bodmer WF. Cancer stem cells from colorectal cancer-derived cell lines. Proc Natl Acad Sci U S A. 2010;107(8):3722–3727. doi:10.1073/pnas.0910097107
40. Benoit YD. Identification of novel molecules targeting cancer stem cells. Methods Mol Biol. 2018;1765:333–347.
41. Karlsson H, Fryknas M, Larsson R, Nygren P. Loss of cancer drug activity in colon cancer hct-116 cells during spheroid formation in a new 3-d spheroid cell culture system. Exp Cell Res. 2012;318(13):1577–1585. doi:10.1016/j.yexcr.2012.03.026
42. Zhang X, Ling MT, Wang X, Wong YC. Inactivation of id-1 in prostate cancer cells: a potential therapeutic target in inducing chemosensitization to taxol through activation of jnk pathway. Int J Cancer. 2006;118(8):2072–2081. doi:10.1002/ijc.21592
43. Geng H, Rademacher BL, Pittsenbarger J, et al. Id1 enhances docetaxel cytotoxicity in prostate cancer cells through inhibition of p21. Cancer Res. 2010;70(8):3239–3248. doi:10.1158/0008-5472.CAN-09-3186
44. Kawamoto H, Yuasa T, Kubota Y, et al. Characteristics of CD133+ human colon cancer SW620 cells. Cell Transplant. 2010;19(6):857–864. doi:10.3727/096368910X508988
45. Sgambato A, Puglisi MA, Errico F, et al. Post-translational modulation of CD133 expression during sodium butyrate-induced differentiation of HT29 human colon cancer cells: implications for its detection. J Cell Physiol. 2010;224(1):234–241.
46. Wan L, Pantel K, Kang Y. Tumor metastasis: moving new biological insights into the clinic. Nat Med. 2013;19(11):1450–1464.
47. Scheel C, Weinberg RA. Cancer stem cells and epithelial-mesenchymal transition: concepts and molecular links. Semin Cancer Biol. 2012;22(5–6):396–403. doi:10.1016/j.semcancer.2012.04.001
48. Asirvatham AJ, Carey JP, Chaudhary J. ID1-, ID2-, and ID3-regulated gene expression in E2A positive or negative prostate cancer cells. Prostate. 2007;67(13):1411–1420. doi:10.1002/pros.20633
49. Gumireddy K, Li A, Gimotty PA, et al. KLF17 is a negative regulator of epithelial-mesenchymal transition and metastasis in breast cancer. Nat Cell Biol. 2009;11(11):1297–1304. doi:10.1038/ncb1826
50. Kühl SJ, Kühl M. On the role of Wnt/β-catenin signaling in stem cells. Biochim Biophys Acta. 2013;1830(2):2297–2306. doi:10.1016/j.bbagen.2012.08.010
51. Lee JY, Kang MB, Jang SH, et al. Id-1 activates Akt-mediated Wnt signaling and p27(Kip1) phosphorylation through PTEN inhibition. Oncogene. 2009;28(6):824–831. doi:10.1038/onc.2008.451
52. Zhu L, Gibson P, Currle DS, et al. Prominin 1 marks intestinal stem cells that are susceptible to neoplastic transformation. Nature. 2009;457(7229):603–607. doi:10.1038/nature07589
53. Yamashita T, Ji J, Budhu A, et al. Epcam-positive hepatocellular carcinoma cells are tumor-initiating cells with stem/progenitor cell features. Gastroenterology. 2009;136(3):1012–1024. doi:10.1053/j.gastro.2008.11.049
54. Yook JI, Li XY, Ota I, et al. A Wnt-Axin2-GSK3beta cascade regulates Snail1 activity in breast cancer cells. Nat Cell Biol. 2006;8(12):1398–1406. doi:10.1038/ncb1508
 © 2019 The Author(s). This work is published and licensed by Dove Medical Press Limited. The full terms of this license are available at https://www.dovepress.com/terms.php and incorporate the Creative Commons Attribution - Non Commercial (unported, v3.0) License.
By accessing the work you hereby accept the Terms. Non-commercial uses of the work are permitted without any further permission from Dove Medical Press Limited, provided the work is properly attributed. For permission for commercial use of this work, please see paragraphs 4.2 and 5 of our Terms.
© 2019 The Author(s). This work is published and licensed by Dove Medical Press Limited. The full terms of this license are available at https://www.dovepress.com/terms.php and incorporate the Creative Commons Attribution - Non Commercial (unported, v3.0) License.
By accessing the work you hereby accept the Terms. Non-commercial uses of the work are permitted without any further permission from Dove Medical Press Limited, provided the work is properly attributed. For permission for commercial use of this work, please see paragraphs 4.2 and 5 of our Terms.