")
Back to Journals » OncoTargets and Therapy » Volume 8
Inhibition of FOXO1 by small interfering RNA enhances proliferation and inhibits apoptosis of papillary thyroid carcinoma cells via Akt/FOXO1/Bim pathway
Authors Song H , Song J, Li D, Hua K, Zhao B, Fang L
Received 29 August 2015
Accepted for publication 7 November 2015
Published 1 December 2015 Volume 2015:8 Pages 3565—3573
DOI https://doi.org/10.2147/OTT.S95395
Checked for plagiarism Yes
Review by Single anonymous peer review
Peer reviewer comments 3
Editor who approved publication: Dr Faris Farassati
Hong-ming Song,* Jia-lu Song,* Deng-feng Li, Kai-yao Hua, Bing-kun Zhao, Lin Fang
Department of Breast and Thyroid Surgery, Shanghai Tenth People’s Hospital, School of Medicine, Tongji University, Shanghai, People’s Republic of China
*These authors contributed equally to this work
Abstract: Forkhead box protein O1 (FOXO1) is a multifunctional transcription factor of the forkhead family. It may function as a tumor suppressor through its ability to regulate cellular events, including cell proliferation, apoptosis, and cell cycle control. As reported, FOXO1 is downregulated in papillary thyroid carcinoma (PTC). However, the function of FOXO1 in human PTC remains unclear. In this study, we investigated the function and underlying regulatory mechanisms of FOXO1 in PTC cells. PTC cell lines K1 and TPC1 were transiently transfected with FOXO1 small interfering RNA (siRNA) and negative control RNA. Successful transfection was confirmed by RT-qPCR and Western blot analysis. 3-(4,5-Dimethylthiazol-2-yl)-2,5-diphenyltetrazolium bromide cell proliferation assays, colony formation assays, apoptosis, and cell cycle assays were used to explore the potential function of FOXO1 in the PTC cell lines. We found that downregulation of FOXO1 promoted cellular proliferation, enhanced clonogenesis, and inhibited cellular apoptosis. However, the cell cycle was not markedly affected by FOXO1 siRNA. Furthermore, Bim, a downstream target of the Akt/FOXO1 signaling pathway, was downregulated at both mRNA and protein levels in cells transfected with FOXO1 siRNA. Collectively, these results indicate that FOXO1 may play an important role in inhibiting PTC development by regulating cellular proliferation, growth, and apoptosis. FOXO1 expression is a potentially useful biomarker for human PTC. Moreover, tumorigenesis of PTC may be associated with repression of the Akt/FOXO1/Bim signaling pathway.
Keywords: siRNA, FOXO1, Akt/FOXO1/Bim pathway, papillary thyroid carcinoma, proliferation, apoptosis
Introduction
Thyroid cancer is an endocrine malignancy classified into four major types: papillary thyroid carcinoma (PTC), follicular thyroid cancer, medullary thyroid cancer, and undifferentiated anaplastic thyroid cancer. Among these four types, PTC is the most common malignant thyroid cancer in the countries with sufficient iodine diets, and comprises up to 80% of all thyroid malignancies.1 An epidemiologic study indicated that the incidence of thyroid cancer has nearly tripled from 1975 to 2009, and that an increase in PTC is the biggest contributor, according to Surveillance, Epidemiology, and End Results registry data.2 The causes and pathogenesis of PTC are poorly understood. Exploring the underlying molecular mechanisms controlling the development and progression of PTC may provide us new therapeutic insights into this disease.
The transcription factor forkhead box protein O1 (FOXO1), a founding member of the FOXO family, participates in diverse functions involving cell proliferation, cell cycle control, apoptosis, differentiation, metabolism, and DNA damage repair.3–5 Increasing evidence suggests that the human FOXO1 protein is likely involved in carcinogenesis, diabetes, and other human diseases,4 because FOXO1 is downregulated in many human malignancies, including breast cancer,6 prostate cancer,7 endometrial cancer,8 and Hodgkin’s lymphoma.9 Phosphatidyl inositol 3-kinase (PI3-K) and Akt signaling appear to play an important role in the progression of both papillary and follicular thyroid cancers.10 FOXO1 activity is negatively regulated by PI3-K/Akt, which phosphorylates FOXO1 at multiple sites and forces FOXO1 into the cytoplasm, thus decreasing its transcriptional activity.11–15 Bim, a downstream target of Akt/FOXO1 signaling, is a proapoptotic BH3 domain-only member of the Bcl-2 family. It has been reported that Bim is involved in the regulation of apoptosis in several different cell types,16–21 and has been shown to play a key role in depsipeptide-induced apoptosis in some human lung cancer cell lines.15
Although FOXO1 has been recognized as a novel tumor suppressor in different kinds of cancer, its role in PTC has not been well established. Therefore, the role of FOXO1 in PTC cells was validated by transfecting TPC1 and K1 cells with siRNA oligonucleotides targeting FOXO1. After transfection with siRNA, mRNA, and protein, expression levels of FOXO1 and Bim were clearly downregulated. Downregulation of FOXO1 was associated with increased PTC cell proliferation and inhibition of apoptosis. FOXO1 may thus act as an anti-oncogene in PTC via the Akt/FOXO1/Bim pathway.
Materials and methods
Papillary thyroid carcinoma cell lines and culture conditions
The PTC cell lines TPC1 and K1 were purchased from the cell bank of the Chinese Academy of Science (Shanghai, People’s Republic of China). K1 and TPC1 cells were cultured in Dulbecco’s Modified Eagle’s Medium (DMEM; Thermo Fisher Scientific, Waltham, MA, USA) and RPMI1640 medium (RPMI1640; Thermo Fisher Scientific) respectively, supplemented with 100 U/mL penicillin, 100 μg/mL streptomycin (Enpromise, Hangzhou, People’s Republic of China), and 10% fetal bovine serum (FBS, Thermo Fisher Scientific) at 37°C in a humidified atmosphere containing 5% CO2. To maintain cells in viable condition, cells were passaged using trypsin/ethylenediaminetetraacetic acid solution (saline containing 0.05% trypsin, 0.01 M sodium phosphate, and 0.53 μM ethylenediaminetetraacetic acid, pH 7.4) when the cell density reached 80%–90% confluency. No ethics statement was required from the institutional review board for the use of these cell lines.
Cell transfection
FOXO1 small interfering RNA (siRNA) and siRNA negative control (NC) oligonucleotides were purchased from Sangon Biotech (Shanghai, People’s Republic of China). The sequence of the FOXO1 siRNAs was 5′-GGAGGUAUGAGUCAGUAUATT-3′ (sense) and 5′-UAUACUGACUCAUACCUCCTT-3′ (antisense), the sequence of the siRNA NC was 5′-UUCUCCGAACGUGUCACGUTT-3′ (sense) and 5′-ACGUGACACGUUCGGAGAATT-3′ (antisense). TPC1 and K1 cells were seeded into six-well plates with a starting cell number of 1×10⁵ and 1.2×10⁵, respectively, and cultured with RPMI1640 and DMEM, respectively, without serum and antibiotics. Cells were transfected with FOXO1 siRNA and siRNA NC at a final concentration of 200 nmol/L using Lipofectamine 2000 transfection reagent (Thermo Fisher Scientific) according to the manufacturer’s instructions, when cell density reached 30%–50%. After 6 hours incubation, the media were replaced with fresh medium containing 10% FBS. After 48–72 hours further incubation, cells at approximately 90% confluence were harvested for further analysis.
RNA extraction and real-time quantitative PCR analysis
FOXO1 and Bim mRNA were analyzed by real-time quantitative PCR as previously described.22 Total RNA was extracted from cells using TRIZOL reagent (Thermo Fisher Scientific). Briefly, a total of 1 μg RNA was used for the initial reverse transcription (RT) reaction using a PrimeScript™ RT-PCR kit (Takara, Otsu, Japan) in accordance with the manufacturer’s instructions. Reactions were performed in a total volume of 20 μL using 1 μg total RNA. RT conditions were 37°C, 15 minutes, then 85°C, 5 seconds. Real-time quantitative PCR was performed using the SYBR® FAST qPCR Master Mix kit (Kapa Biosystems, Boston, MA, USA). qPCR conditions were as follows: 95°C, 3 minutes, followed by 40 cycles of 95°C, 3 seconds and 60°C, 30 seconds. Expression of mRNA was assessed by evaluating threshold cycle (CT) values. The CT values of FOXO1 were normalized to the expression level of β-actin. Primers for FOXO1, Bim, and β-actin were purchased from Sangon Biotech with the following sequences: FOXO1, 5′-AGGGTTAGTGAGCAGGTTACAC-3′ (forward) and 5′-TGCTGCCAAGTCTGACGAAA-3′ (reverse); Bim, 5′-GTATTCGGTTCGCTGCGTTC-3′ (forward) and 5′-CGCAGGCTGCAATTGTCTAC-3′ (reverse); β-actin 5′-CAGAGCCTCGCCTTTGCC-3′ (forward) and 5′-GTCGCCCACATAGGAATC-3′ (reverse). Each sample was run in triplicate. Relative expression was calculated using the relative quantification equation (RQ) =2−ΔΔCt. The specificity of amplification was examined by melting curve analysis.
Western blot analysis
The expression of FOXO1 and Bim proteins was determined by Western blot analysis. TPC1 and K1 cells were seeded in six-well plates at a concentration of 1×10⁵ and 1.2×10⁵ cells/well, respectively, then transfected as described earlier. After transfection for 48–72 hours, cell samples were lysed for 30 minutes on ice in 80 μL/well RIPA buffer (Beyotime, Shanghai, People’s Republic of China), and soluble proteins were recovered in the supernatant following a 30 minutes centrifugation (12,000 rpm). Protein concentrations were quantified using a bicinchoninic acid protein assay kit (Beyotime, Jiangsu, People’s Republic of China). Total protein was mixed with 5× sodium dodecyl sulfate (SDS) loading buffer (Beyotime, Jiangsu, People’s Republic of China) in boiling water for 15 minutes before electrophoresis.
Equal amounts of protein (50 μg) from each sample were separated by 8% or 10% SDS-polyacrylamide gel electrophoresis (SDS-PAGE), transferred electrophoretically to 0.45 μm nitrocellulose membrane (Beyotime, Jiangsu, People’s Republic of China), and blocked in 5% bovine serum albumin in phosphate-buffered saline containing 0.1% Tween-20 (PBST) at room temperature for 60 minutes. Membranes were incubated with the primary antibodies rabbit anti-FOXO1 (1:1,000, Cell Signaling Technology, Boston, MA, USA), rabbit anti-Bim (1:500, Proteintech, Chicago, IL, USA), and mouse anti-β-actin (1:1,000, Cell Signaling Technology) at 4°C overnight. The membranes were then washed three times with PBST and incubated with anti-rabbit or anti-mouse secondary antibodies (1:1,000, Epitomics, Burlingame, CA, USA) for 1 hour at room temperature. After three washes in PBST, antibody binding was visualized using the Odyssey Scanning system (Li-Cor, Lincoln, NE, USA). Experiments were repeated three times.
Cell growth/cell viability assay
Following transfection for 24 hours, TPC1 and K1 cells were seeded into 96-well plates at a density of 500 and 1,500 cells per well, respectively. Cell viability was measured every 24 hours for 5 days by adding 20 μL of 3-(4,5-dimethyl-2-thiazoyl)-2,5-diphenyl-2H-tetrazolium bromide (MTT) solution (5 mg/mL; Sigma, St Louis, MO, USA) to each well following the manufacturer’s protocol. The plates were incubated in a 5% CO2-humidified incubator at 37°C for 4 hours. Supernatants were discarded, and purple-colored precipitates of formazan were dissolved in 150 μL dimethyl sulfoxide by placing the plates on a low-speed shaker for 10 minutes to fully dissolve the crystals. Absorbance was measured at optical density (OD) of 490 nm using a microplate reader (BioTek, Winooski, VT, USA). The experiment was performed in sextuplicate wells and repeated three times.
Clonogenic assay
After transfection for 24 hours, TPC1 and K1 cells were seeded in six-well plates at 500 cells per well and incubated at 37°C incubator for 7–10 days. Cell colonies were washed twice with PBS, fixed with 95% ethanol for 10 minutes, and stained with 0.1% crystal violet for 20 minutes. Colonies with at least 50 cells were counted, and representative colonies were photographed. Each experiment was performed in triplicate.
Apoptosis assay
Apoptosis was detected using the Annexin V-FITC Apoptosis Detection kit (BD Biosciences, San Diego, CA, USA). After 24 hours transfection with siRNA and NC RNA (200 nmol/L), apoptosis was induced with 10 mmoL/L 5-fluoro-2,4(1H, 3H)-pyrimidinedione (5-FU; Xudong Haipu, Shanghai, People’s Republic of China) in medium supplemented with 10% FBS for 24 hours. Cells were stained with fluorescein isothiocyanate (FITC)-conjugated Annexin V and propidium iodide (FITC-Annexin V/PI) according to the manufacturer’s instruction. Cell apoptosis was analyzed by flow cytometry and CellQuest software (BD Biosciences) was used for analysis. Each sample was measured in duplicate, and results are presented as the average of three independent assays.
Cell cycle analysis
Cell cycle distributions were analyzed by flow cytometer following PI staining. Cells were seeded into six-well plates at a final concentration of 4.5×10⁵ cells per well and transfected as described earlier. Cells were allowed to rest for 24 hours, and were then subsequently serum-starved for 24 hours. After transfection for 48 hours, cells were digested, resuspended, centrifuged at 4°C at 1,200 rpm for 10 minutes, then washed three times with cold PBS. Ethanol (75%) was subsequently added dropwise, and the cells were fixed at 4°C overnight. The ethanol was removed by centrifugation, and the remaining cell pellets were resuspended in 100 μg/mL of DNase-free RNase for 30 minutes at room temperature in the dark. Finally, PI solution (100 μg/mL) was added to the cell suspension and analyzed by flow cytometer (FACS Calibur™, BD Biosciences). Each sample was measured in duplicate, and results are presented as the average of three independent assays.
Statistical analysis
Statistical analyses were performed with GraphPad Prism version 6.0 (GraphPad, San Diego, CA, USA) or SPSS 20.0 (StataCorp LP, College Station, TX, USA). Data are presented as the mean ± standard error of the mean from three independent assays. Two-tailed t-tests were used to compare groups. P-value <0.05 was considered statistically significant.
Results
FOXO1 siRNA inhibits FOXO1 expression in PTC cells
To examine the repressive potential of siRNA on FOXO1, TPC1, and K1 cells were transfected with FOXO1 siRNA or NC RNA (200 nmol/L) using Lipofectamine 2000. After 48 hours, endogenous FOXO1 expression levels were monitored using qRT-PCR and Western blot analysis. As shown by real-time PCR results in Figure 1A, TPC1 (siRNA group: 0.37±0.01; NC group: 1.00±0.00) and K1 (siRNA group: 0.30±0.02; NC group: 1.00±0.00) cells were successfully transfected with FOXO1 siRNA, causing suppression of FOXO1 mRNA expression (P<0.05). Similarly, FOXO1 protein expression was also effectively inhibited following FOXO1 siRNA transfection in both TPC1 (siRNA group: 0.54%±0.06%; NC group: 2.55%±0.36%) and K1 (siRNA group: 0.56%±0.05%; NC group: 1.57%±0.25%) cells (Figure 2A and B, P<0.05). These experiments confirmed that FOXO1 siRNA can effectively repress FOXO1 expression in PTC cells.
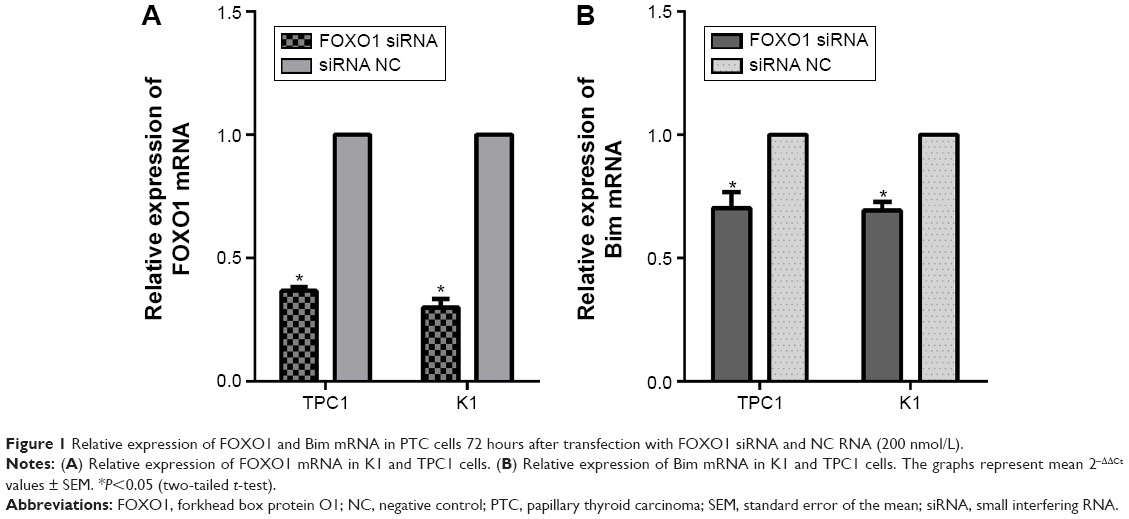 | Figure 1 Relative expression of FOXO1 and Bim mRNA in PTC cells 72 hours after transfection with FOXO1 siRNA and NC RNA (200 nmol/L). |
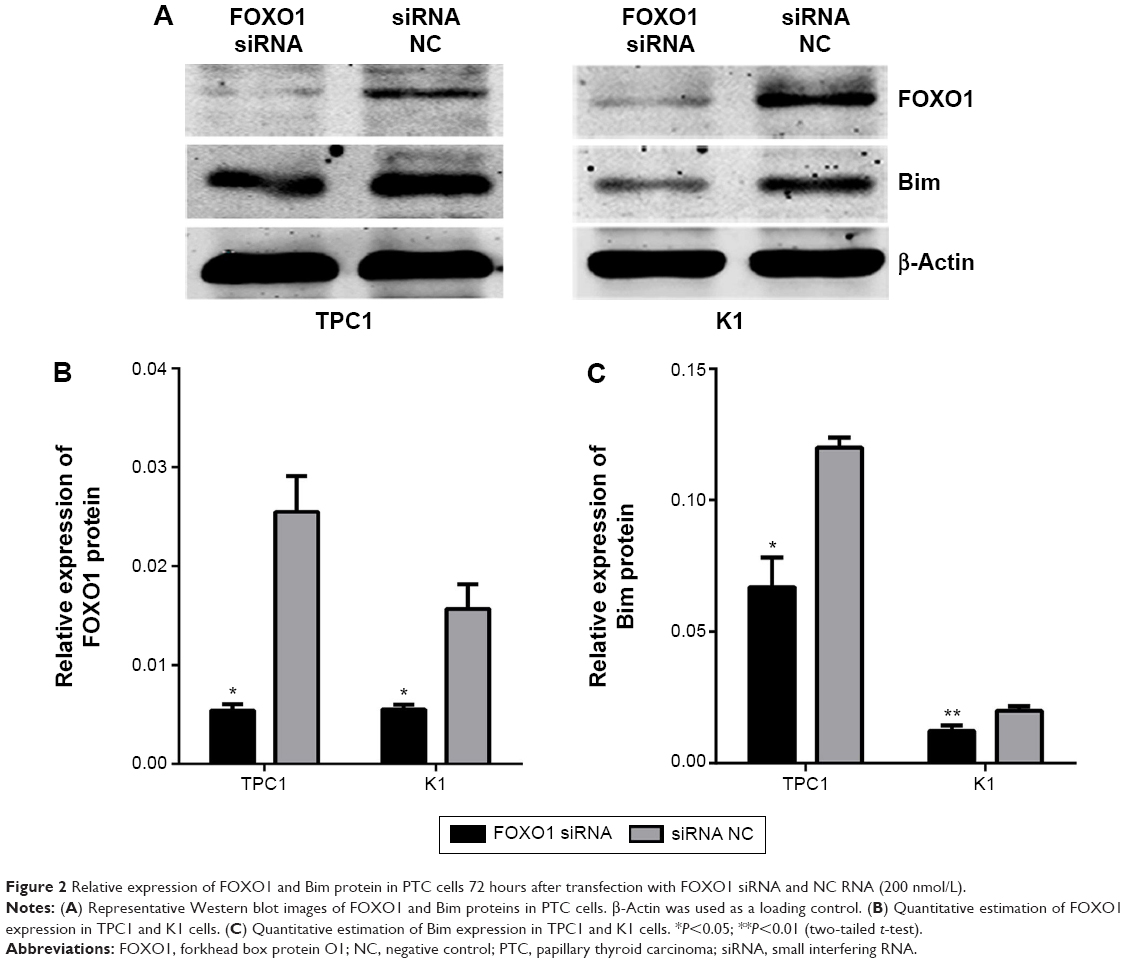 | Figure 2 Relative expression of FOXO1 and Bim protein in PTC cells 72 hours after transfection with FOXO1 siRNA and NC RNA (200 nmol/L). |
FOXO1 depletion enhances the proliferation of PTC cells
The effect of FOXO1 siRNA transfection on proliferation of PTC cells was measured by an MTT assay. Transfection was performed as described earlier. The viability of cells transfected with FOXO1 siRNA was measured and compared with that of NC-transfected cells at 24, 48, 72, and 96 hours post-transfection. The increased growth rate was calculated as follows: increased growth rate (%) = (OD value of the experimental group - OD value of the control group)/OD value of the control group ×100%. A marked elevation in cell viability was detected 96 hours after transfection with FOXO1 siRNA in TPC1 cells (increased growth rate =18.93%±3.54%; Figure 3A, P<0.05) and in K1 cells (increased growth rate =23.79%±1.65%; Figure 3B, P<0.05). These results suggest that transient depletion of FOXO1 promotes the proliferation of both TPC1 and K1 cells.
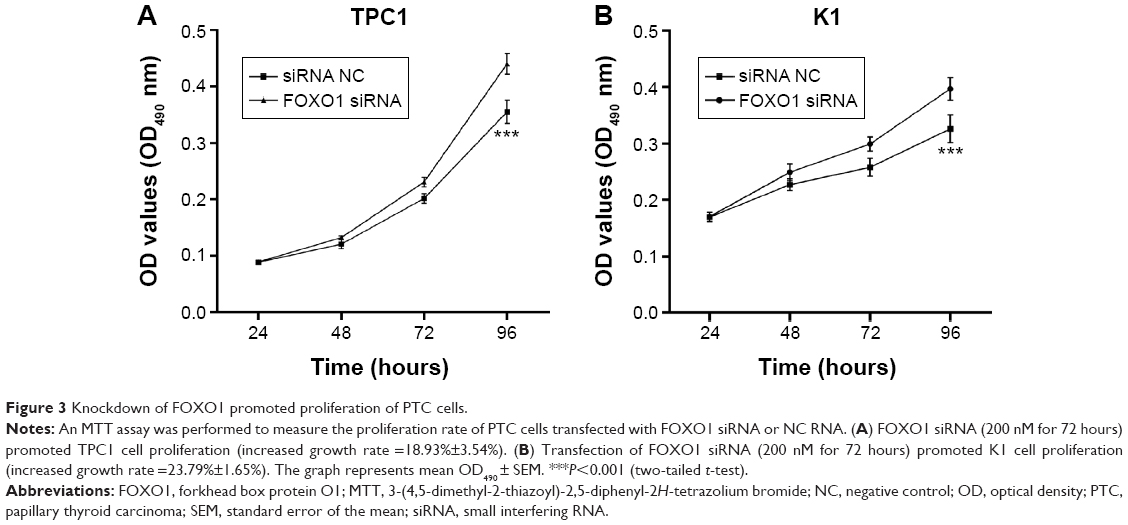 | Figure 3 Knockdown of FOXO1 promoted proliferation of PTC cells. |
Colony formation by PTC cells was promoted by the FOXO1 siRNA
As shown in Figure 4, FOXO1 siRNA-transfected cells exhibited more colonies than NC-transfected cells in colony formation assays. The colony formation rate in FOXO1 siRNA-transfected TPC1 cells was significantly higher than in NC cells (135±9.82 colonies versus 96.33±4.06 colonies, respectively; Figure 4A, P<0.05). Similarly, colony formation in FOXO1 siRNA-transfected K1 cells was significantly greater compared with NC cells (113.7±6.89 colonies versus 62.67±5.55 colonies, respectively; Figure 4B, P<0.05). Taken together, these data indicate that FOXO1 depletion promotes clonogenesis of PTC cells (Figure 4C).
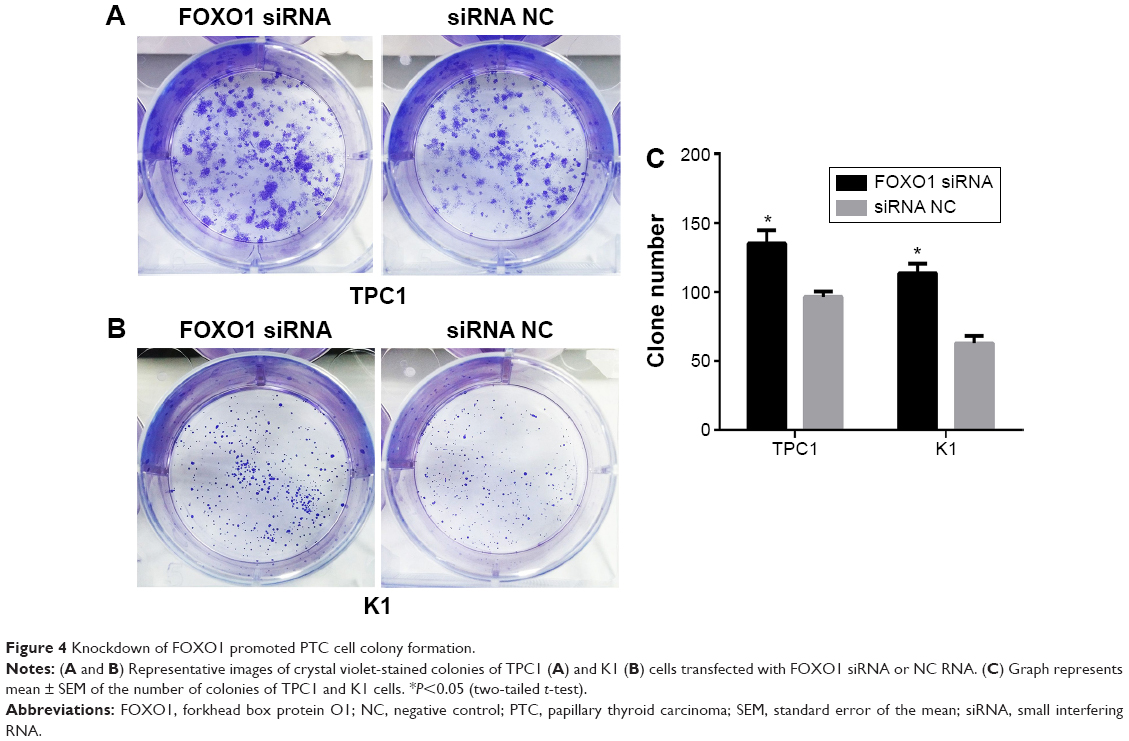 | Figure 4 Knockdown of FOXO1 promoted PTC cell colony formation. |
Downregulation of FOXO1 decreases apoptosis in PTC cell lines
The role of FOXO1 in apoptosis was validated by transfecting TPC1 and K1 cells with siRNA oligonucleotides targeting FOXO1. Flow cytometry data indicated that downregulation of FOXO1 decreased apoptosis of K1 and TPC1 cells compared with their respective NC cells (Figure 5). The percentage of apoptotic cells in FOXO1 siRNA-transfected TPC1 cells was markedly decreased compared with NC cells (12.30%±0.72% versus 18.20%±0.38%, respectively; Figure 5A, P<0.05). A similar result was obtained in FOXO1 siRNA-transfected K1 cells compared with NC cells (10.60%±0.43% versus 17.97%±1.09%, respectively; Figure 5B, P<0.05). Thus, downregulation of FOXO1 can decrease apoptosis of both TPC1 and K1 cells in vitro (Figure 5C).
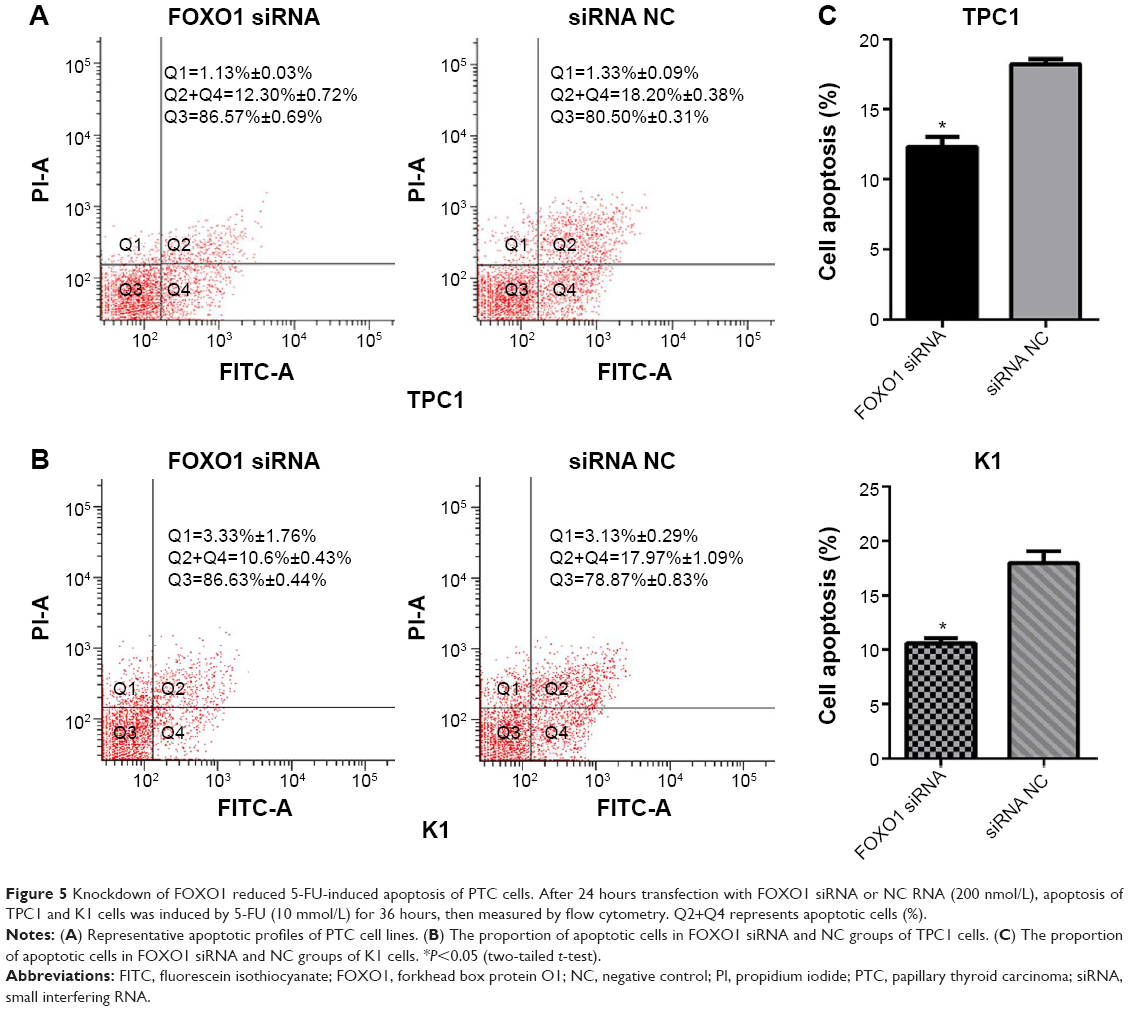 | Figure 5 Knockdown of FOXO1 reduced 5-FU-induced apoptosis of PTC cells. After 24 hours transfection with FOXO1 siRNA or NC RNA (200 nmol/L), apoptosis of TPC1 and K1 cells was induced by 5-FU (10 mmol/L) for 36 hours, then measured by flow cytometry. Q2+Q4 represents apoptotic cells (%). |
The effect of downregulation of FOXO1 on cell cycle regulation in PTC cells
To determine the effect of FOXO1 on cell cycle regulation, the percentage of TPC1 and K1 cells in G0/G1, S, or G2/M phase was assessed by flow cytometry following transfection with FOXO1, siRNA, or NC RNA. As shown in Figure 6A, the majority of TPC1 cells were in G0/G1 (siRNA group: 41.22%±0.70%; NC group: 40.95%±1.08%) and G2/M (siRNA group: 43.76%±0.89%; NC group: 41.38%±0.54%), with smaller fractions in S-phase (siRNA group: 15.02%±0.41%; NC group: 17.68%±0.65%). Except for a slightly higher proportion of TPC1 cells in G2/M phase following transfection with FOXO1 siRNA compared with controls, there was no significant difference in cell cycle distribution of TPC1 cells in G0/G1 and S phase. In K1 cells, there was also no significant difference in cell cycle distribution comparing FOXO1 siRNA-transfected cells with NC cells. The percentage of K1 cells in each phase was as follows (Figure 6B): G0/G1 (siRNA group: 43.01%±0.74%, NC group: 44.15%±0.48%); S (siRNA group: 35.14%±4.43%, NC group: 34.77%±3.68%), and G2/M (siRNA group: 21.84%±4.50%, NC group: 21.09%±3.73%).
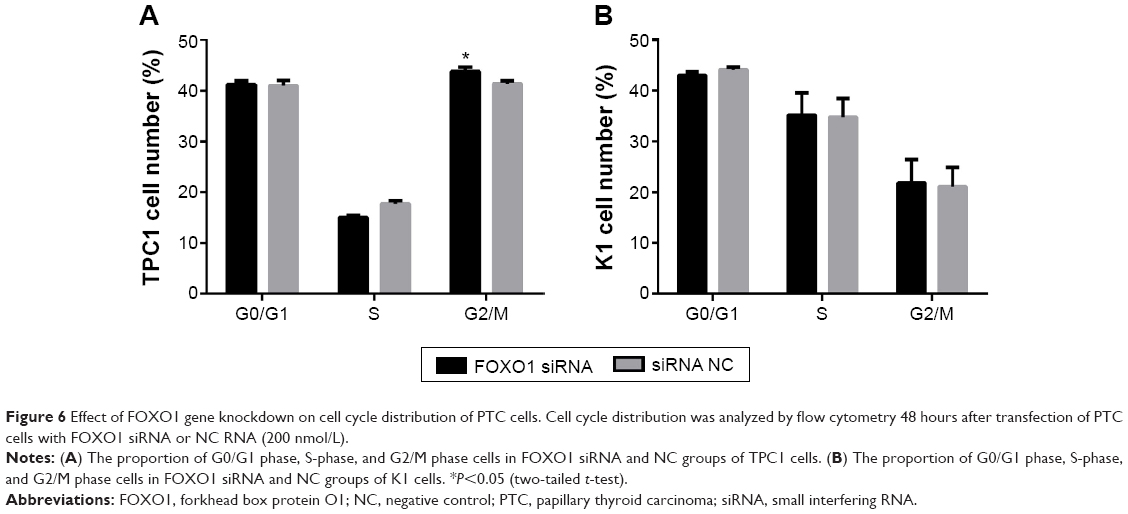 | Figure 6 Effect of FOXO1 gene knockdown on cell cycle distribution of PTC cells. Cell cycle distribution was analyzed by flow cytometry 48 hours after transfection of PTC cells with FOXO1 siRNA or NC RNA (200 nmol/L). |
FOXO1 mediates Bim expression in response to FOXO1 siRNA treatment
To confirm whether there is a causal relationship between the decrease of FOXO1 following FOXO1 siRNA treatment and expression of Bim, a downstream target of FOXO1 signaling in the Akt/FOXO1 pathway, we used qRT-PCR to monitor the expression of FOXO1 and Bim mRNA. Following downregulation of FOXO1 mRNA, expression of Bim mRNA was significantly decreased in TPC1 and K1 cells (Figure 1B, P<0.05). In addition, the expression of Bim protein was also significantly reduced in FOXO1 siRNA-transfected TPC1 and K1 cells compared with NC RNA-transfected cells (Figure 2A and C, TPC1: P<0.05; K1: P<0.01). These results indicate that loss of Bim expression in PTC cells in vitro correlates with decreased expression of FOXO1.
Discussion
Thyroid carcinoma is the most common malignancy of the endocrine system and is prone to cervical lymph node metastasis. Currently, surgical excision is the main treatment for PTC. Genetic alterations are a driving force for the development and progression of thyroid cancer. The genetic alterations involved in PTCs are rearrangement of the RET proto-oncogene (the RET/PTC rearrangement23), mutations of RAS and B-Raf proto-oncogene, serine/threonine kinase (BRAF23,24), and overexpression of the ephrin receptors EphB2 and EphrinB4, as well as epidermal growth factor receptor.25 Clinical studies have shown important associations between BRAF mutation status and clinical parameters in PTC, including progression, invasion, and recurrence.26 Patients would benefit from the identification of novel targets involved in the development and progression of PTC, which may serve as diagnostic and prognostic biomarkers and provide therapeutic options for treating PTC.
Previous evidence indicates that FOXO1 is differentially expressed in normal and tumor tissues in many human malignancies, including PTC.27 In addition, FOXO1 protein levels were markedly reduced in the TPC cell line PCCl3 compared with normal human thyroid tissues.27 FOXO1 plays a vital role in inhibiting cervical cancer development by inducing cell-cycle arrest and apoptosis.28 However, the role of FOXO1 in tumorigenesis of human PTC is still unclear. In this study, we reveal a previously unknown role for FOXO1 in PTC cell proliferation and apoptosis.
To investigate the potential effects induced by the loss of FOXO1 on PTC, a FOXO1-interfering siRNA oligonucleotide was constructed and transfected into the PTC cell lines TPC1 and K1. Our results indicated that silencing FOXO1 by siRNA significantly decreased expression of FOXO1 at both the mRNA and protein level compared with cells transfected with NC RNA. Downregulation of FOXO1 was associated with increased growth and proliferation of TPC1 and K1 cells and a significantly reduced number of apoptotic cells. In previous studies, FOXO1 interference in PCCl3 cells (a continuous line of thyroid follicular cells derived from Fischer rats) was shown to increase their proliferation.27 Ectopic expression of a constitutively active FOXO1-induced apoptosis in classical Hodgkin’s lymphoma cell lines and blocked proliferation, accompanied by cell-cycle arrest in the G0/G1 phase.9 However, in our study, apart from a slight increase in G2/M phase cells in FOXO1 siRNA-transfected TPC1 cells, depletion of FOXO1 had no significant impact on the cell cycle distribution of either cell line, suggesting that the enhanced proliferation of PTC cells might be due to decreased apoptosis.
According to previous reports, FOXO1 activity was negatively regulated by PI3-K/Akt.15 TPC1 cells treated with the Akt inhibitor Akt-i-VIII for 24 hours showed a slight increase in FOXO1 protein levels, suggesting that PI3K activation in PTC cells decreased FOXO1 protein levels.27 Bim is a downstream target in the Akt/FOXO1 signaling pathway. We performed RT-qPCR to determine whether depletion of Bim was the result of transcriptional regulation in TPC1 cells induced by downregulation of FOXO1 and showed that Bim mRNA was clearly decreased after FOXO1 siRNA treatment. Western blot analysis also showed that expression of Bim protein in TPC1 cells was decreased by exogenous downregulation of FOXO1. These results were further confirmed by our observation that K1 cells transiently transfected with siRNA against FOXO1 also showed decreased expression of Bim mRNA and protein. These results indicated that expression of Bim at both protein and mRNA levels was downregulated by exogenous silencing of the FOXO1 gene in PTC cell lines.
There are still some limitations in this study. Only two PTC cell lines, TPC1 and K1, have been evaluated the function of FOXO1 in PTC; however, other PTC cell lines and primary PTC cells have not been used. In addition, we also need to measure the effectiveness of FOXO1 depletion in vivo. Therefore, we will do further studies to confirm the findings in the future.
Conclusion
Our results indicate that downregulation of FOXO1 may play an essential role in promoting PTC cell proliferation, growth, and survival through inactivation of the AKT/FOXO1/Bim pathway. These findings suggest that FOXO1 may be a novel therapeutic target in the pathogenesis, diagnosis, and treatment of PTC.
Acknowledgment
This work was supported by grants from National Natural Science Foundation of China (grant number: 82172240).
Disclosure
The authors report no conflicts of interest in this work.
References
Lloyd RV, Buehler D, Khanafshar E. Papillary thyroid carcinoma variants. Head Neck Pathol. 2011;5(1):51–56. | ||
Davies L, Welch HG. Current thyroid cancer trends in the United States. JAMA Otolaryngol Head Neck Surg. 2014;140(4):317–322. | ||
Maiese K, Chong ZZ, Shang YC, Hou J. A “FOXO” in sight: targeting Foxo proteins from conception to cancer. Med Res Rev. 2009;29(3):395–418. | ||
Lu H, Huang H. FOXO1: a potential target for human diseases. Curr Drug Targets. 2011;12(9):1235–1244. | ||
Accili D, Arden KC. FoxOs at the crossroads of cellular metabolism, differentiation, and transformation. Cell. 2004;117(4):421–426. | ||
Guttilla IK, White BA. Coordinate regulation of FOXO1 by miR-27a, miR-96, and miR-182 in breast cancer cells. J Biol Chem. 2009;284(35):23204–23216. | ||
Haflidadottir BS, Larne O, Martin M, et al. Upregulation of miR-96 enhances cellular proliferation of prostate cancer cells through FOXO1. PLoS One. 2013;8(8):e72400. | ||
Myatt SS, Wang J, Monteiro LJ, et al. Definition of microRNAs that repress expression of the tumor suppressor gene FOXO1 in endometrial cancer. Cancer Res. 2010;70(1):367–377. | ||
Xie L, Ushmorov A, Leithauser F, et al. FOXO1 is a tumor suppressor in classical Hodgkin lymphoma. Blood. 2012;119(15):3503–3511. | ||
Shinohara M, Chung YJ, Saji M, Ringel MD. AKT in thyroid tumorigenesis and progression. Endocrinology. 2007;148(3):942–947. | ||
Huang H, Tindall DJ. Dynamic FoxO transcription factors. J Cell Sci. 2007;120(Pt 15):2479–2487. | ||
Greer EL, Brunet A. FOXO transcription factors at the interface between longevity and tumor suppression. Oncogene. 2005;24(50):7410–7425. | ||
Paik JH, Kollipara R, Chu G, et al. FoxOs are lineage-restricted redundant tumor suppressors and regulate endothelial cell homeostasis. Cell. 2007;128(2):309–323. | ||
Brunet A, Bonni A, Zigmond MJ, et al. Akt promotes cell survival by phosphorylating and inhibiting a Forkhead transcription factor. Cell. 1999;96(6):857–868. | ||
Yang Y, Zhao Y, Liao W, et al. Acetylation of FoxO1 activates Bim expression to induce apoptosis in response to histone deacetylase inhibitor depsipeptide treatment. Neoplasia. 2009;11(4):313–324. | ||
Li R, Moudgil T, Ross HJ, Hu HM. Apoptosis of non-small-cell lung cancer cell lines after paclitaxel treatment involves the BH3-only proapoptotic protein Bim. Cell Death Different. 2005;12(3):292–303. | ||
Willis SN, Adams JM. Life in the balance: how BH3-only proteins induce apoptosis. Curr Opin Cell Biol. 2005;17(6):617–625. | ||
Kim H, Rafiuddin-Shah M, Tu HC, et al. Hierarchical regulation of mitochondrion-dependent apoptosis by BCL-2 subfamilies. Nat Cell Biol. 2006;8(12):1348–1358. | ||
Bouillet P, Purton JF, Godfrey DI, et al. BH3-only Bcl-2 family member Bim is required for apoptosis of autoreactive thymocytes. Nature. 2002;415(6874):922–926. | ||
O’Connor L, Strasser A, O’Reilly LA, et al. Bim: a novel member of the Bcl-2 family that promotes apoptosis. EMBO J. 1998;17(2):384–395. | ||
Green DR. Fas Bim boom! Immunity. 2008;28(2):141–143. | ||
Wei C, Song H, Sun X, et al. miR-183 regulates biological behavior in papillary thyroid carcinoma by targeting the programmed cell death 4. Oncol Rep. 2015;34(1):211–220. | ||
Sargent R, LiVolsi V, Murphy J, Mantha G, Hunt JL. BRAF mutation is unusual in chronic lymphocytic thyroiditis-associated papillary thyroid carcinomas and absent in non-neoplastic nuclear atypia of thyroiditis. Endocr Pathol. 2006;17(3):235–241. | ||
Zou M, Baitei EY, Alzahrani AS, et al. Concomitant RAS, RET/PTC, or BRAF mutations in advanced stage of papillary thyroid carcinoma. Thyroid. 2014;24(8):1256–1266. | ||
Sharma GK, Dhillon VK, Masood R, Maceri DR. Overexpression of EphB4, EphrinB2, and epidermal growth factor receptor in papillary thyroid carcinoma: a pilot study. Head Neck. 2015;37(7):964–969. | ||
Chakraborty A, Narkar A, Mukhopadhyaya R, Kane S, D’Cruz A, Rajan MG. BRAF V600E mutation in papillary thyroid carcinoma: significant association with node metastases and extra thyroidal invasion. Endocr Pathol. 2012;23(2):83–93. | ||
Zaballos MA, Santisteban P. FOXO1 controls thyroid cell proliferation in response to TSH and IGF-I and is involved in thyroid tumorigenesis. Mol Endocrinol. 2013;27(1):50–62. | ||
Zhang B, Gui LS, Zhao XL, Zhu LL, Li QW. FOXO1 is a tumor suppressor in cervical cancer. Genet Mol Res. 2015;14(2):6605–6616. |
 © 2015 The Author(s). This work is published and licensed by Dove Medical Press Limited. The full terms of this license are available at https://www.dovepress.com/terms.php and incorporate the Creative Commons Attribution - Non Commercial (unported, v3.0) License.
By accessing the work you hereby accept the Terms. Non-commercial uses of the work are permitted without any further permission from Dove Medical Press Limited, provided the work is properly attributed. For permission for commercial use of this work, please see paragraphs 4.2 and 5 of our Terms.
© 2015 The Author(s). This work is published and licensed by Dove Medical Press Limited. The full terms of this license are available at https://www.dovepress.com/terms.php and incorporate the Creative Commons Attribution - Non Commercial (unported, v3.0) License.
By accessing the work you hereby accept the Terms. Non-commercial uses of the work are permitted without any further permission from Dove Medical Press Limited, provided the work is properly attributed. For permission for commercial use of this work, please see paragraphs 4.2 and 5 of our Terms.