")
Back to Journals » International Journal of Nanomedicine » Volume 11
Inhibition of autophagy contributes to the toxicity of cadmium telluride quantum dots in Saccharomyces cerevisiae
Authors Fan J, Shao M, Lai L, Liu Y, Xie Z
Received 16 March 2016
Accepted for publication 24 May 2016
Published 25 July 2016 Volume 2016:11 Pages 3371—3383
DOI https://doi.org/10.2147/IJN.S108636
Checked for plagiarism Yes
Review by Single anonymous peer review
Peer reviewer comments 2
Editor who approved publication: Professor Lei Yang
Junpeng Fan,1–4 Ming Shao,1–4 Lu Lai,3–5 Yi Liu,3–5 Zhixiong Xie1–4,6
1College of Life Sciences, Wuhan University, 2Hubei Provincial Cooperative Innovation Center of Industrial Fermentation,3State Key Laboratory of Virology, 4Key Laboratory of Analytical Chemistry for Biology and Medicine (MOE), 5College of Chemistry and Molecular Sciences, Wuhan University, Wuhan, 6School of Life Science and Technology, Hubei Engineering University, Xiaogan, People’s Republic of China
Abstract: Cadmium telluride quantum dots (CdTe QDs) are used as near-infrared probes in biologic and medical applications, but their cytological effects and mechanism of potential toxicity are still unclear. In this study, we evaluated the toxicity of CdTe QDs of different sizes and investigated their mechanism of toxicity in the yeast Saccharomyces cerevisiae. A growth inhibition assay revealed that orange-emitting CdTe (O-CdTe) QDs (half inhibitory concentration [IC50] =59.44±12.02 nmol/L) were more toxic than green-emitting CdTe QDs (IC50 =186.61±19.74 nmol/L) to S. cerevisiae. Further studies on toxicity mechanisms using a transmission electron microscope and green fluorescent protein tagged Atg8 processing assay revealed that O-CdTe QDs could partially inhibit autophagy at a late stage, which differs from the results reported in mammalian cells. Moreover, autophagy inhibited at a late stage by O-CdTe QDs could be partially recovered by enhancing autophagy with rapamycin (an autophagy activator), combined with an increased number of living cells. These results indicate that inhibition of autophagy acts as a toxicity mechanism of CdTe QDs in S. cerevisiae. This work reports a novel toxicity mechanism of CdTe QDs in yeast and provides valuable information on the effect of CdTe QDs on the processes of living cells.
Keywords: CdTe quantum dots, Saccharomyces cerevisiae, toxicity, autophagy
Introduction
Quantum dots (QDs) are a class of nanoparticles of a few nanometers in diameter. As a result of their unique optical properties, such as photostability, narrow emissions, and broad excitation ranges,1,2 QDs have been used as fluorescent probes for imaging both in vivo and in vitro.3,4 Recently, the focus on imaging QDs has shifted from cadmium selenide-based QDs to cadmium telluride (CdTe)-based QDs, due to their capacity for near-infrared imaging and the requirement for less cadmium at the same emission wavelength.5 CdTe QDs have potential in terms of biologic and medical applications, thus likely increasing their exposure to human beings and the environment. Therefore, there is an urgent need to investigate their toxicity to the environment and living beings and the mechanisms of any such toxicity.
Previous studies have demonstrated the toxicity of CdTe QDs in mammalian cells6–8 and revealed that this toxicity is dependent on their physicochemical properties, such as size, charge, concentration, and outer coating.9 It has been suggested that the toxicity of CdTe QDs is related to oxidative stress, which can lead to lysosome enlargement,8 mitochondrial network fragmentation,7 and activation of autophagy.10 The toxicity and related mechanisms of CdTe QDs have been well studied at the cellular level in mammals, but relatively little is known with respect to other organisms. Saccharomyces cerevisiae, one of the most studied model fungal organisms, shares many similarities in cellular structure and functional organization with plants and animals. Therefore, toxicity studies with S. cerevisiae can be useful to understand the impact of substances on fungal populations in the environment and the basic cellular mechanisms of toxicity in higher eukaryotic organisms.11 Recently, Han et al12 investigated the toxic effects of CdTe QDs of different sizes in S. cerevisiae, with the results suggesting size-dependent toxicity characterized by cell wall breakage and cytoplasm blebbing. The current study focuses on the lethal mechanism of CdTe QDs and ignores any effects on the processes of living cells. This is a common practice in toxicity research on QDs.
It has been demonstrated that CdTe QDs can activate autophagy in PC12 cells.10 Autophagy is an evolutionarily conserved process that occurs in living organisms ranging from yeast to humans, by which cytoplasmic cargo sequestered inside double-membrane vesicles is delivered to the lysosome or vacuole for degradation and recycling.13 It has been suggested that this process is particularly important for maintaining cellular homeostasis and surviving under certain environmental stress conditions.14 Several studies have reported that QDs can activate autophagy in mammalian cells, and researchers have speculated that autophagy is a common response to nanomaterial.15,16 However, it has also been reported that gold nanoparticles can induce autophagosome accumulation by blocking autophagy flux.17 Whether QDs can induce or inhibit autophagy is still unclear, as is the relationship between the toxicity of QDs and autophagy. Autophagy was first identified in mammalian cells and has been further studied in S. cerevisiae18 and is a conserved process from yeast to humans. Therefore, exploring the effect of QDs on autophagy in S. cerevisiae can help us to understand the relationship between autophagy and QDs-induced toxicity in other organisms.
In the present study, we investigated the toxicity of CdTe QDs, green-emitting CdTe (G-CdTe) QDs and orange-emitting CdTe (O-CdTe) QDs, and explored the role of autophagy in toxicity caused by CdTe QDs in S. cerevisiae. The results indicate that the toxicity of CdTe QDs is dependent on dose and size. Most importantly, we found that O-CdTe QDs can inhibit autophagy at a late stage, which differs from the findings in mammalian cells and acts as a toxicity mechanism for O-CdTe QDs.
Materials and methods
Cells and reagents
S. cerevisiae BY4742 was purchased from EUROSCARF (Bad Homburg, Germany). Yeast expressing green fluorescent protein tagged Atg8 (GFP-Atg8) was conducted by transforming pRS316 GFP-Atg819 into S. cerevisiae BY4742 using standard protocols.20 Rapamycin and propidium iodide were obtained from Sigma-Aldrich Co. (St Louis, MO, USA). Phenylmethanesulfonyl fluoride was obtained from Amresco (Solon, OH, USA). Unless otherwise indicated, other reagents were obtained from the Sinopharm Chemical Reagent Co. (Shanghai, People’s Republic of China). CdTe QDs used in this study were from our previous work.12
Cultivation of yeast and growth inhibition testing
Yeast cells were cultured in synthetic glucose supplemented with casamino acid (SD + CA) medium (0.17% yeast nitrogen base without amino acid [Difco, Sparks, MD, USA], 0.5% casamino acid [Sigma-Aldrich], and 2% glucose), supplemented with 0.002% uracil (Amresco, Solon, OH, USA) if necessary by shaking at 200 rpm at 30°C. For treatment, cells were grown in appropriate medium overnight, then diluted to an optical density (OD)600 of 0.2 with fresh SD + CA medium and regrown to mid-log phase (OD600 =0.8). At that time, cells were collected by centrifuging at 3,000 g for 5 minutes, washed with sterile water twice, and resuspended in medium supplemented with different treatments.
To measure the half inhibitory concentration (IC50), cells were treated with CdTe QDs at a series of different concentrations for 16 hours. For O-CdTe QDs, the concentrations were 25.94 nmol/L, 51.88 nmol/L, 103.75 nmol/L, 207.5 nmol/L, and 415 nmol/L. For G-CdTe QDs, the concentrations were 54.2 nmol/L, 108.4 nmol/L, 216.8 nmol/L, 433.6 nmol/L, and 867.2 nmol/L. Appropriate dilutions were plated on yeast extract peptone dextrose agar plates (1% yeast extract, 2% peptone, and 2% glucose), and colony-forming units (CFU) were counted after 3 days of incubation at 30°C in the dark. The inhibitory ratio was calculated using the following formula:
|
|
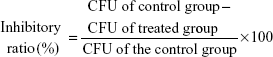
The value of IC50 is the concentration of the inhibitor when the inhibitory rate is equal to 50%.
For measuring cell growth curves, cells were treated with 50 nmol/L CdTe QDs, and the OD600 of the cells was measured eight times in 22 hours. The resulting growth curve represents the average OD of the yeast cells in three independent experiments.
Cell cycle analysis
Approximately 1 OD600 unit (1 mL of cells at OD600 =1.0) of cultured cells was harvested, washed with water, and fixed in 70% (v/v) ethanol overnight at 4°C. Samples were washed with water, resuspended in 0.5 mL of 50 mmol/L sodium citrate (pH 7.0) containing 8 μL of 10 mg/mL RNase A (TaKaRa, Dalian, People’s Republic of China), and incubated for 1 hour at 50°C. They were then collected and resuspended in 0.5 mL of 50 mmol/L sodium citrate containing 25 μL of 10 mg/mL proteinase K (TaKaRa). After incubation for 1 hour at 50°C, cells were collected by centrifugation and then resuspended in 50 mmol/L sodium citrate (pH 7.0) containing 20 μg/mL propidium iodide. Samples were incubated at 4°C for 1 hour in the dark and then analyzed using a BD FACSAria flow cytometer (BD Biosciences, San Jose, CA, USA). The raw data were analyzed using ModFit software (Verity Software House, Topsham, ME, USA).
Methylene blue stain
Cultured cells (1 mL) were collected and stained with 0.025% methylene blue (Sigma-Aldrich) for 5 minutes. Samples (10 μL) were then placed on a hemocytometer and viewed using an Olympus (Tokyo, Japan) 1×51 inverted fluorescence microscope equipped with U-MWU filters (330–385/400/420 nm). Dead cells were stained, while alive cells remained completely unstained.
Microscopy
For fluorescence microscopy, 500 μL of cultured cells were removed from the flask at the desired time points, centrifuged for 3 minutes at 5,000× g, and resuspended in an appropriate volume of water. A total of 4 μL of each sample was spotted on a microscope slide and viewed using an Olympus 1×51 inverted fluorescence microscope.
For transmission electron microscopy (TEM), samples were observed under an FEI Tecnai G2 20 TWIN transmission electron microscope (FEI, Eindhoven, the Netherlands).
Protein extraction and immunoblot analysis
For protein extraction, 2.0 OD600 units of cultured cells were removed from the flask at the desired time points, centrifuged for 5 minutes at 3,000× g, resuspended in 1 mL of water, and added to a 100 μL mixture of 3.5% β-mercaptoethanol (Amresco, Solon, OH, USA) in 2 mol/L NaOH in plastic 1.7 mL microcentrifuge tubes. After incubation for 15 minutes on ice, proteins were precipitated by adding 100 μL of 3 mol/L trichloroacetic acid for 15 minutes on ice. After centrifugation for 10 minutes at 10,000 g, the pellet was washed with 0.2 mL of acetone, dried, and resolubilized in 60 μL of 5% sodium dodecyl sulfate (SDS) plus 60 μL of Laemmli sample buffer. Protein extracts equivalent to 0.2 OD600 units of cells were separated using a 12% sodium dodecyl sulfate polyacrylamide gel electrophoresis and transferred to a 0.22 μm nitrocellulose membrane. The membrane was blocked with 5% skimmed milk overnight at 4°C and probed with primary rabbit polyclonal anti-GFP antibody (Sigma-Aldrich) and primary rabbit polyclonal antiactin antibody (Cwbio, Beijing, People’s Republic of China) for 1 hour. For the secondary antibody, the incubation was performed with horseradish peroxidase-conjugated rabbit antimouse IgG (Proteintech, Wuhan, People’s Republic of China) for 1 hour. Blots were developed using a chemiluminescent horseradish peroxidase substrate (Merck Millipore, Billerica, MA, USA). Each Western blot was analyzed using ImageJ software (National Institutes of Health, Bethesda, MD, USA).
Statistical analysis
Each experiment was performed in three replicates, and the values shown represent the mean ± standard deviation. Significant differences between the treatments were determined by Student’s t-test using SigmaPlot Version 12.5 (Systat Software, San Jose, CA, USA).
Results
Toxicity of CdTe QDs in S. cerevisiae is dependent on dose and size
To study the toxicity of CdTe QDs, we evaluated their effect on cell growth in S. cerevisiae. G-CdTe QDs (2r =4.1±0.152 nm) and O-CdTe QDs (2r =5.8±0.152 nm) were chosen to conduct the study. First, the inhibitory curves of CdTe QDs were determined. As illustrated in Figure 1A, both G-CdTe and O-CdTe QDs showed dose-dependent effects on cell inhibition. Moreover, by calculating the value of IC50, which is the concentration of the inhibitor when the inhibitory rate is equal to 50%, we found that the IC50 of O-CdTe QDs (59.44±12.02 nmol/L) was lower than that of G-CdTe QDs (186.61±19.74 nmol/L). This indicates that O-CdTe QDs are more toxic than G-CdTe QDs to yeast at the same concentration.
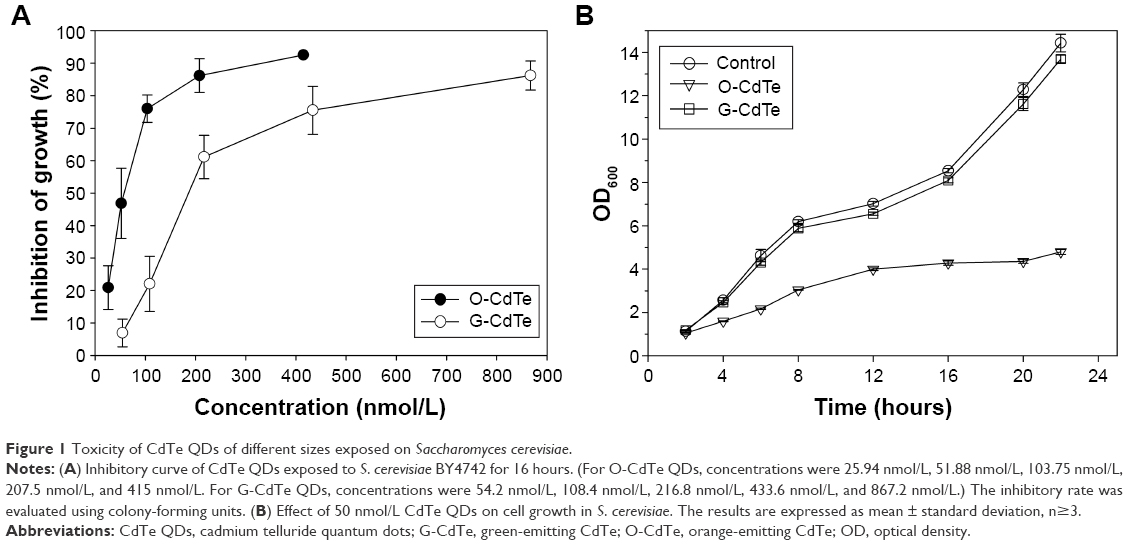 | Figure 1 Toxicity of CdTe QDs of different sizes exposed on Saccharomyces cerevisiae. |
We also compared the effects of G-CdTe and O-CdTe QDs on cell growth curves at the same dose, which is around the IC50 of O-CdTe QDs (Figure 1B). The results indicate that O-CdTe QDs have a more negative effect on cell growth than G-CdTe QDs, confirming that O-CdTe QDs are more toxic to yeast.
Toxicity of CdTe QDs has a correlation with their effects on autophagy
To study the growth inhibition mechanism of CdTe QDs, the morphology of yeast cells treated with 50 nmol/L CdTe QDs for 16 hours was observed by TEM. As shown in Figure 2, the control cells (Figure 2A and B) and cells treated with G-CdTe QDs (Figure 2C and D) stayed in good condition and few vesicles remained in the vacuole, indicating low toxicity of G-CdTe QDs. This is consistent with the effect of G-CdTe QDs on cell growth. Cells treated with O-CdTe QDs are shown in Figure 2E and F, with large numbers of vesicles accumulating in the vacuole. From the TEM images, it can be suggested that the greater toxicity of O-CdTe QDs to yeast is due to their effect on vesicle accumulation within the vacuole.
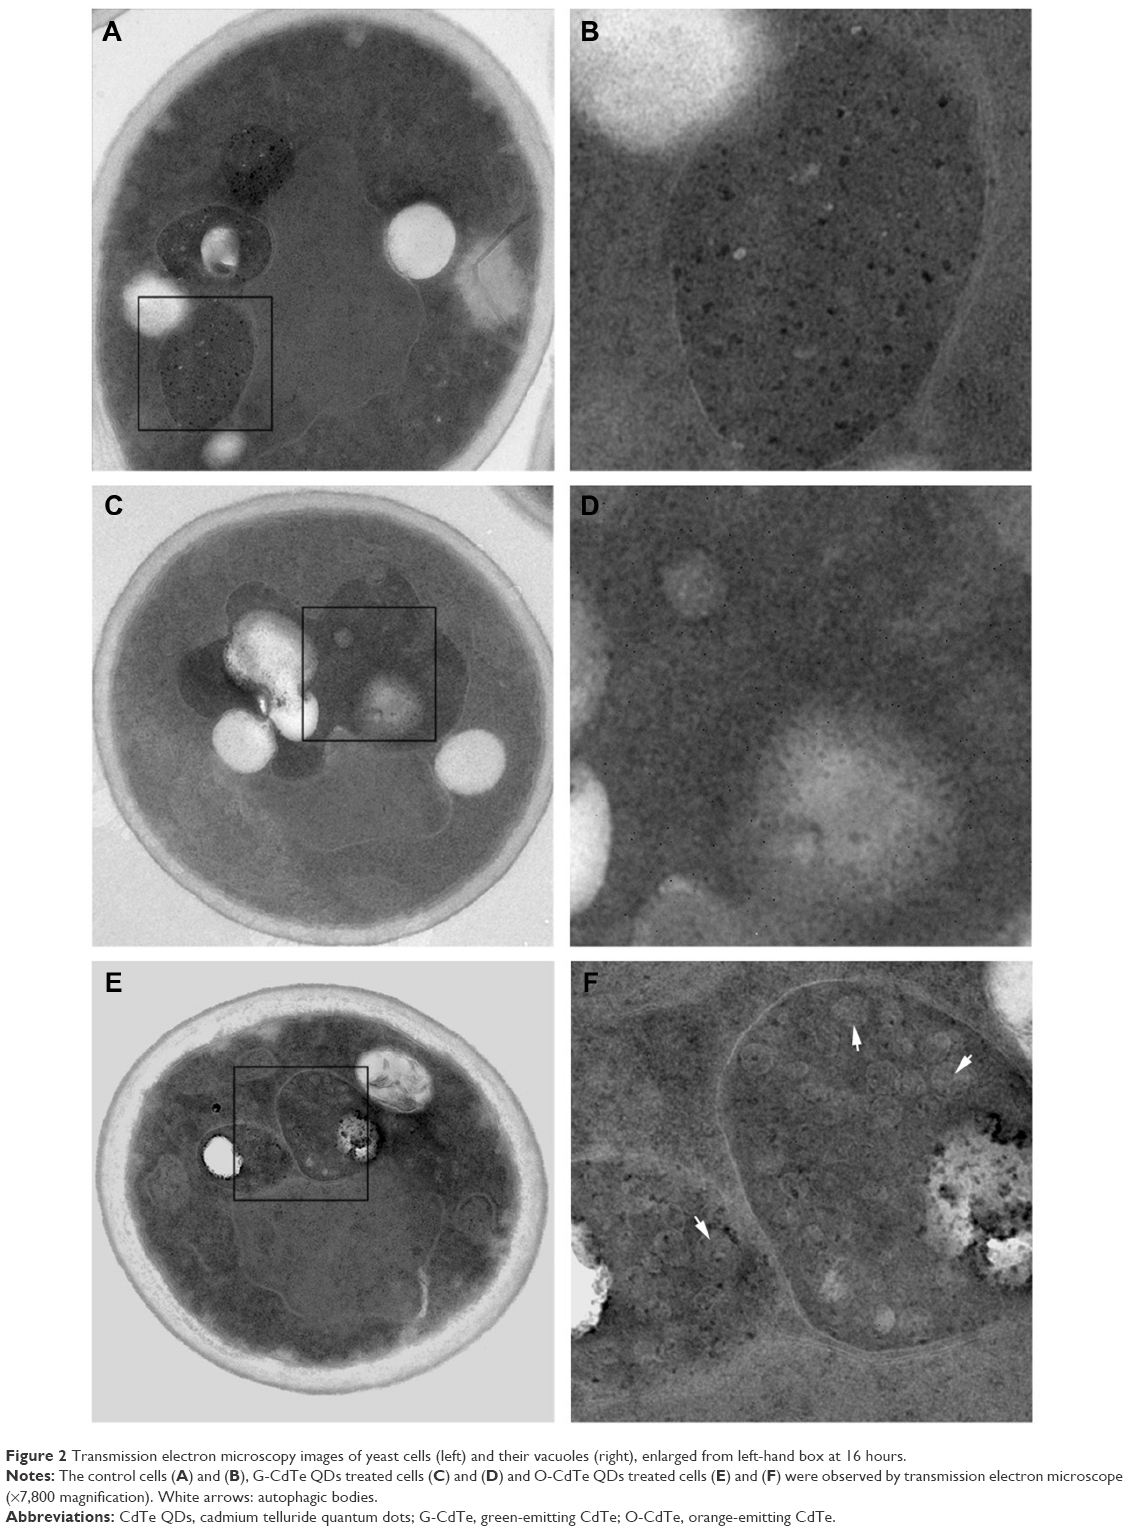 | Figure 2 Transmission electron microscopy images of yeast cells (left) and their vacuoles (right), enlarged from left-hand box at 16 hours. |
As observed by Baba,21 the accumulated vesicles may be autophagic bodies. Accumulation of autophagic bodies in the vacuole can be the result of excessive autophagy induction or inhibition of autophagy at a late stage, both of which have a negative impact on cell growth. Taking this into account, we examined autophagy in yeast cells treated with CdTe QDs. To observe autophagy, plasmid pRS316 GFP-Atg8, which produces GFP-tagged Atg8, was transformed into S. cerevisiae BY4742. If autophagy is induced then GFP-tagged Atg8 in the cytoplasm is recruited to autophagosomes and delivered to the vacuole; the GFP removed from Atg8 remains relatively stable from vacuolar hydrolysis in the vacuole, whereas Atg8 is rapidly degraded.22
Cells have a baseline level of autophagy that is required for cellular homeostasis, and GFP-Atg8 is gradually delivered from the cytoplasm to the vacuole. In this experiment, baseline autophagy led to an increased number of cells with fluorescent vacuoles at 16 hours (Figure 3, control group). This process was accelerated by rapamycin, which is used as an autophagic activator (Figure 3, rapamycin group). Yeast cells with a fluorescence tag were exposed to 50 nmol/L O-CdTe or G-CdTe QDs for different times, and autophagy was examined by fluorescence microscopy. We found that CdTe QDs did not activate autophagy in a similar manner to rapamycin in yeast, as demonstrated by the similar distribution of fluorescence between cells treated with CdTe QDs and control cells at 4 hours and 8 hours (Figure 3). This indicates that O-CdTe QDs caused accumulation of autophagic bodies in vacuoles through inhibition of autophagy at a late stage, rather than through excessive induction of autophagy. O-CdTe QDs did not induce obvious accumulation of autophagic bodies at 4 hours and 8 hours, which may be a result of low levels of autophagy induction. When treated for 16 hours, some cells treated with O-CdTe QDs displayed similar fluorescent phenotypes of dark vacuoles with fluorescent dots accumulated in the vacuole or dark vacuoles with intensely glowing vesicles docked close to the vacuole, with cells treated with phenylmethanesulfonyl fluoride, which inhibits the late stage of autophagy. This indicates that O-CdTe QDs may inhibit autophagy at a late stage. In comparison, most of the cells treated with G-CdTe QDs and control cells displayed homogeneous light vacuoles surrounded by dark cytoplasm, indicating normal levels of baseline autophagy. Moreover, the distribution of fluorescence phenotypes of O-CdTe QDs-treated cells was different from that of G-CdTe QDs-treated cells (Figure S1). These results indicate that CdTe QDs inhibit autophagy in yeast at 16 hours in a size-dependent manner. Moreover, there was a decrease in the number of cells with fluorescent vacuoles and an increase in number of cells with abnormal morphology following treatment with O-CdTe QDs for 42 hours. This indicates that baseline autophagy is intensely inhibited by O-CdTe QDs, which may result in cell death at 42 hours.
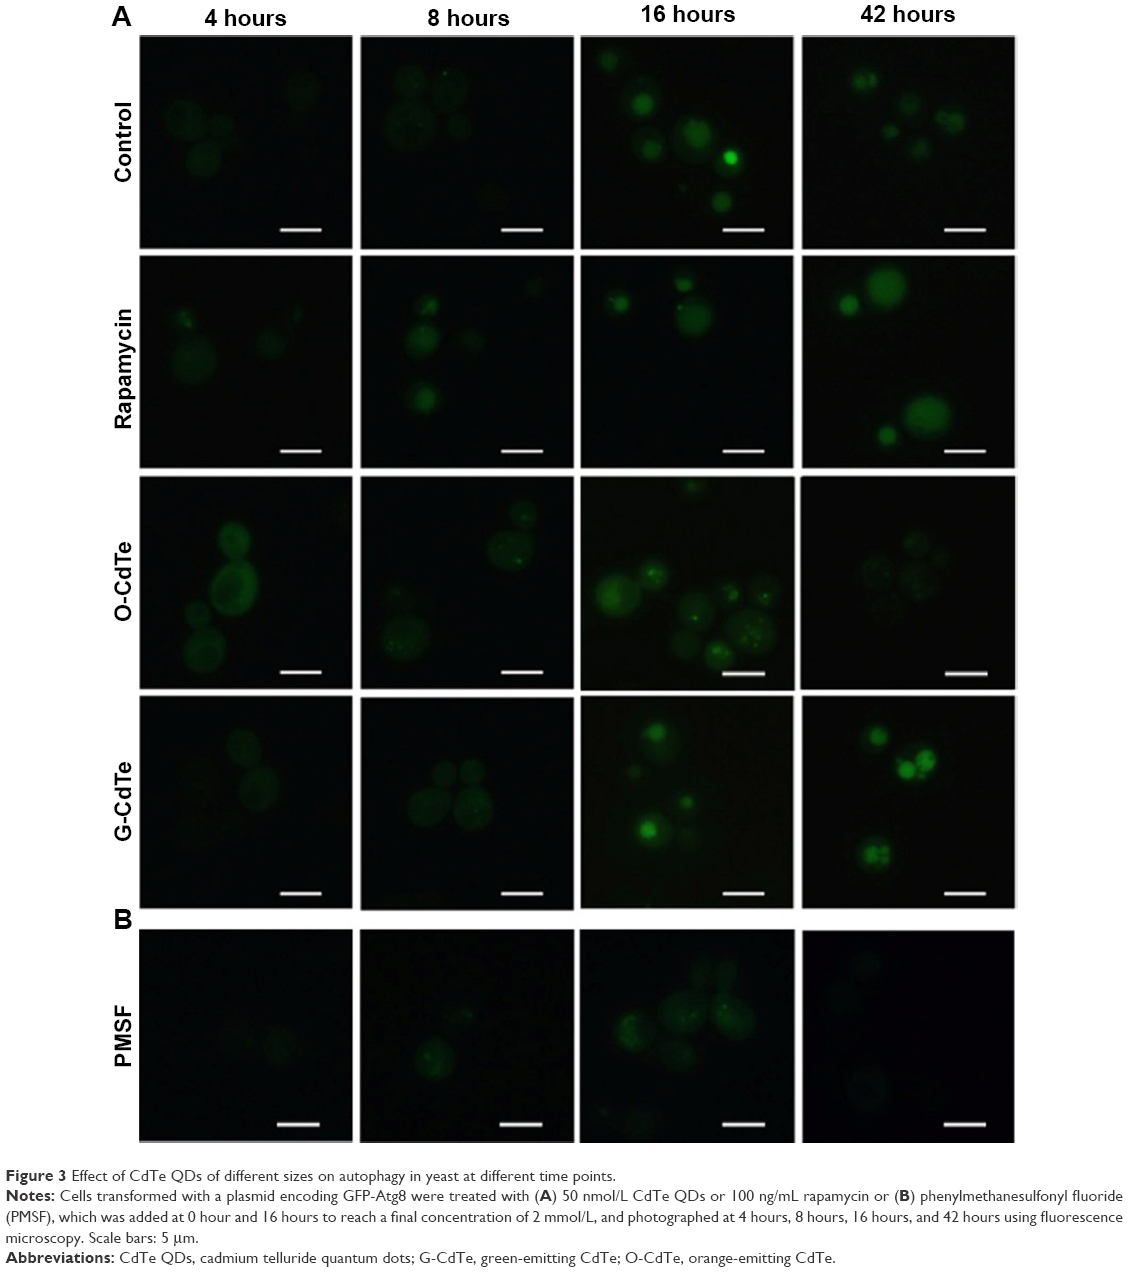 | Figure 3 Effect of CdTe QDs of different sizes on autophagy in yeast at different time points. |
These studies indicate that both the toxicity and autophagy inhibition caused by O-CdTe QDs occur in a size-dependent manner. Furthermore, we counted cells with completed autophagy (homogeneous fluorescent vacuoles surrounded by dark cytoplasm) and those with inhibited autophagy (dark vacuoles surrounded by fluorescent cytoplasm) following treatment with a series of O-CdTe QD concentrations (Figure 4). The results show that the O-CdTe QDs-related inhibition of autophagy was dose-dependent. It is clear that there is a positive correlation between autophagy inhibition caused by O-CdTe QDs and toxicity.
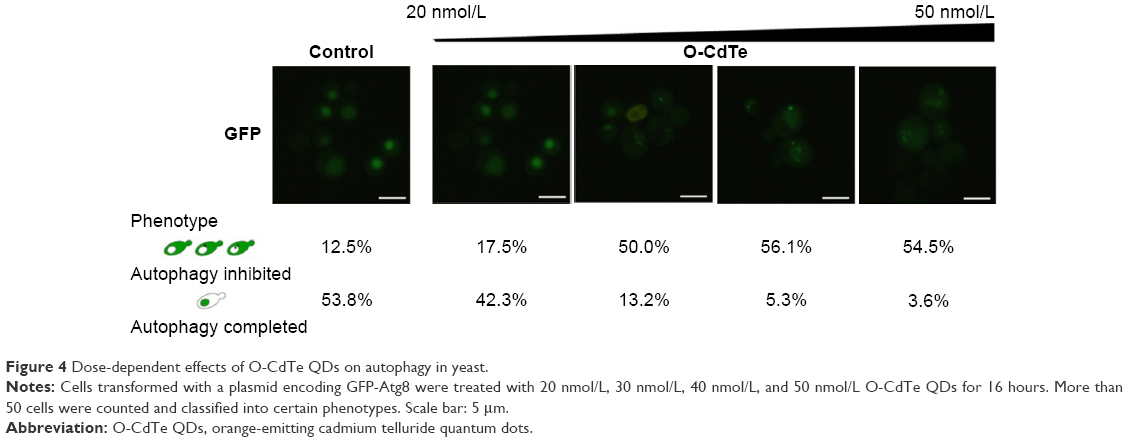 | Figure 4 Dose-dependent effects of O-CdTe QDs on autophagy in yeast. |
O-CdTe QDs partially inhibited autophagy at a late stage
We further confirmed the inhibition of autophagy in cells treated with O-CdTe QDs using a GFP-Atg8 processing assay23 at 16 hours. Compared with the control group, there was a decrease in the percentage of cells with fluorescence vacuoles (from 53% to 3.3%) and an increase in the percentage with inhibited autophagy (from 7.6% to 45%) in the group treated with O-CdTe QDs at 16 hours (Figure 5A). In addition, cells treated with O-CdTe QDs had an increased amount of GFP-Atg8 (Figure 5B) and a significant decrease in the ratio of GFP/GFP-Atg8 compared with the control group (P<0.01, Figure 5C). The results clearly show that O-CdTe QDs partially inhibited autophagy at a late stage in yeast at 16 hours, so that the fluorescence reporter was left in the cytoplasm or accumulated in the vacuoles instead of being degraded.
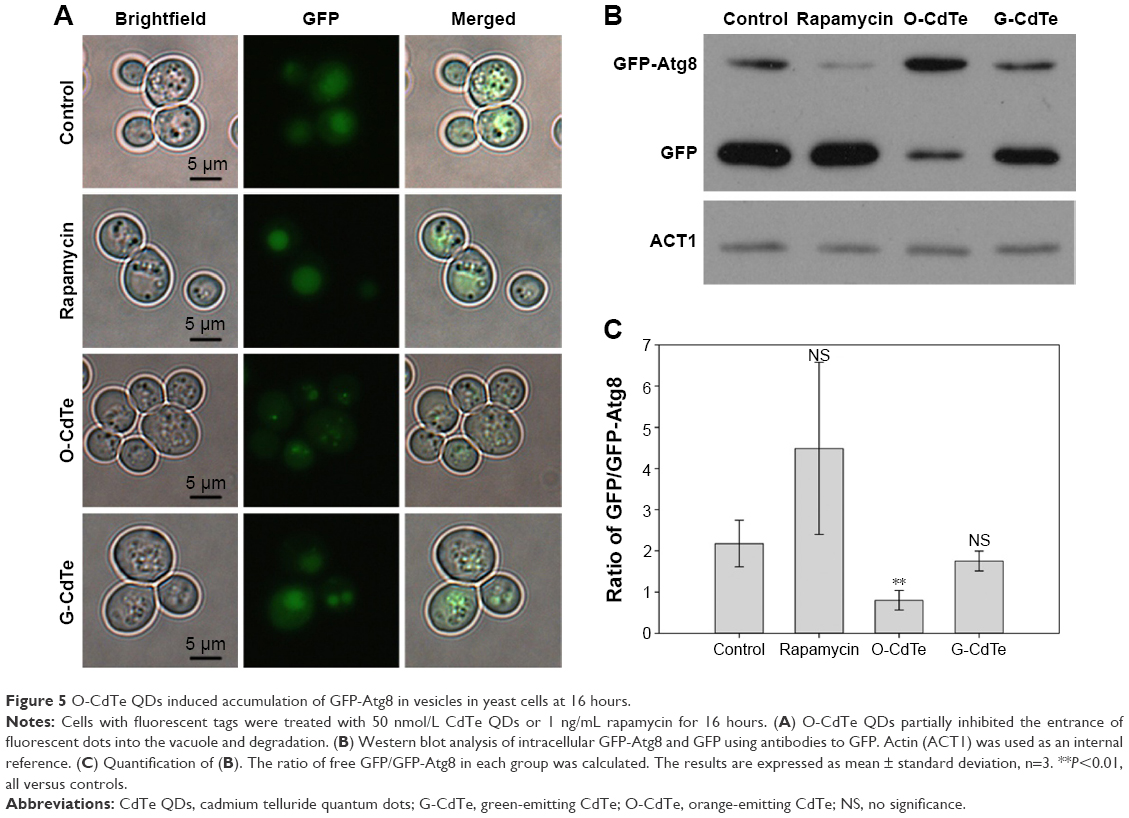 | Figure 5 O-CdTe QDs induced accumulation of GFP-Atg8 in vesicles in yeast cells at 16 hours. |
The same fluorescence distribution between cells treated with O-CdTe QDs and control cells does not suggest that O-CdTe QDs do not inhibit autophagy at 8 hours. To demonstrate this, we treated cells with O-CdTe QDs and low-dose rapamycin (1 ng/mL), which caused little inhibition of cell growth but was able to induce autophagy. We found that cells treated with rapamycin had fluorescent vacuoles and more free GFP in vacuoles, indicating that autophagy was induced. Cells treated with rapamycin and O-CdTe QDs had more fluorescent dots in or close to vacuoles (Figure 6A), similar levels of GFP-Atg8 processing to cells treated with O-CdTe QDs (Figure 6B), and a significant decrease in the ratio of GFP/GFP-Atg8 compared with rapamycin-treated cells (P<0.01, Figure 6C). The results indicate that O-CdTe QDs inhibited autophagy induced by low-dose rapamycin at 8 hours.
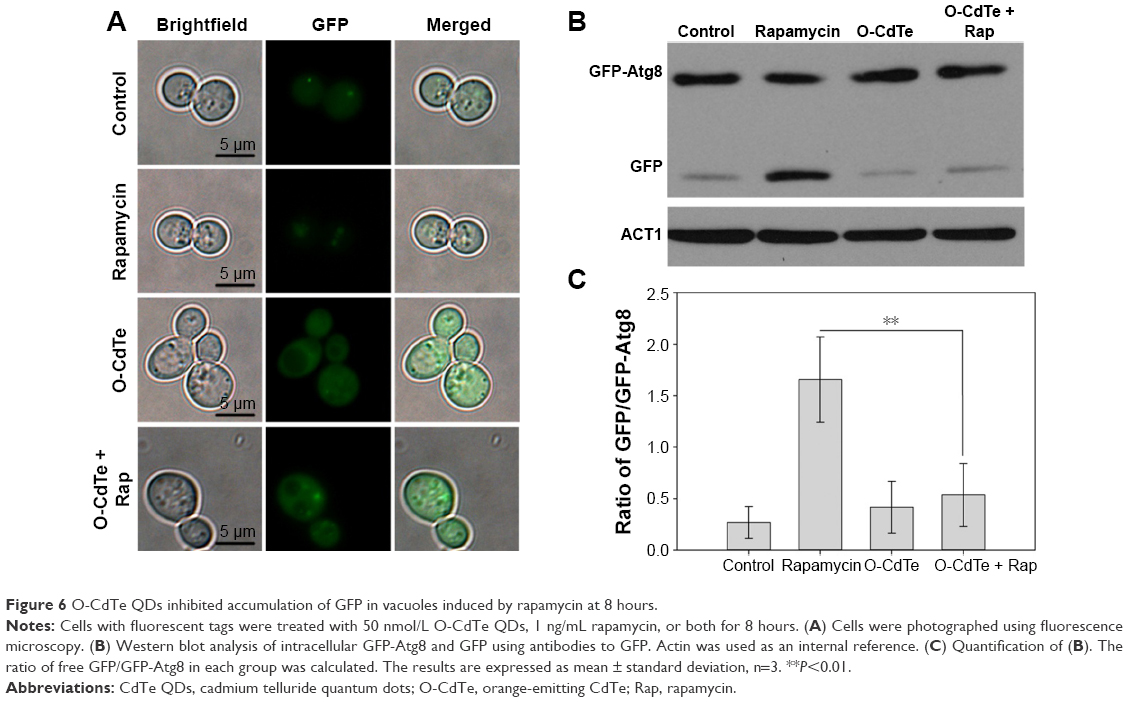 | Figure 6 O-CdTe QDs inhibited accumulation of GFP in vacuoles induced by rapamycin at 8 hours. |
The results mentioned above clearly show that O-CdTe QDs partially inhibit autophagy at a late stage in yeast. Together with the positive correlation between autophagy inhibition caused by O-CdTe QDs and toxicity, this indicates that the toxicity of O-CdTe QDs is due to autophagy inhibition.
Inhibition of autophagy contributes to the toxicity of O-CdTe QDs
In order to confirm our hypothesis that the toxicity of O-CdTe QDs is due to autophagy inhibition, we evaluated the concentrations of cells treated with low dose of rapamycin, O-CdTe QDs, and both at 8 hours. As shown in Figure 7A, rapamycin had no significant effect on cell concentrations, but the concentrations of cells treated with O-CdTe QDs could be significantly increased (P<0.05) by adding rapamycin. The results indicate that rapamycin can decrease the toxicity of O-CdTe QDs to yeast cells. Moreover, we examined autophagy by measuring GFP-Atg8 and free GFP. Compared with cells treated with O-CdTe QDs, the amount of GFP was increased slightly at 8 hours by the addition of rapamycin (Figure 6B), and this increase was further enhanced at 16 hours (Figure 7B and C). These results indicate that autophagy inhibited at a late stage by O-CdTe QDs can be partially recovered by enhancing autophagy with rapamycin. Taken together, these results show that inhibition of autophagy contributes to the toxicity of O-CdTe QDs in yeast.
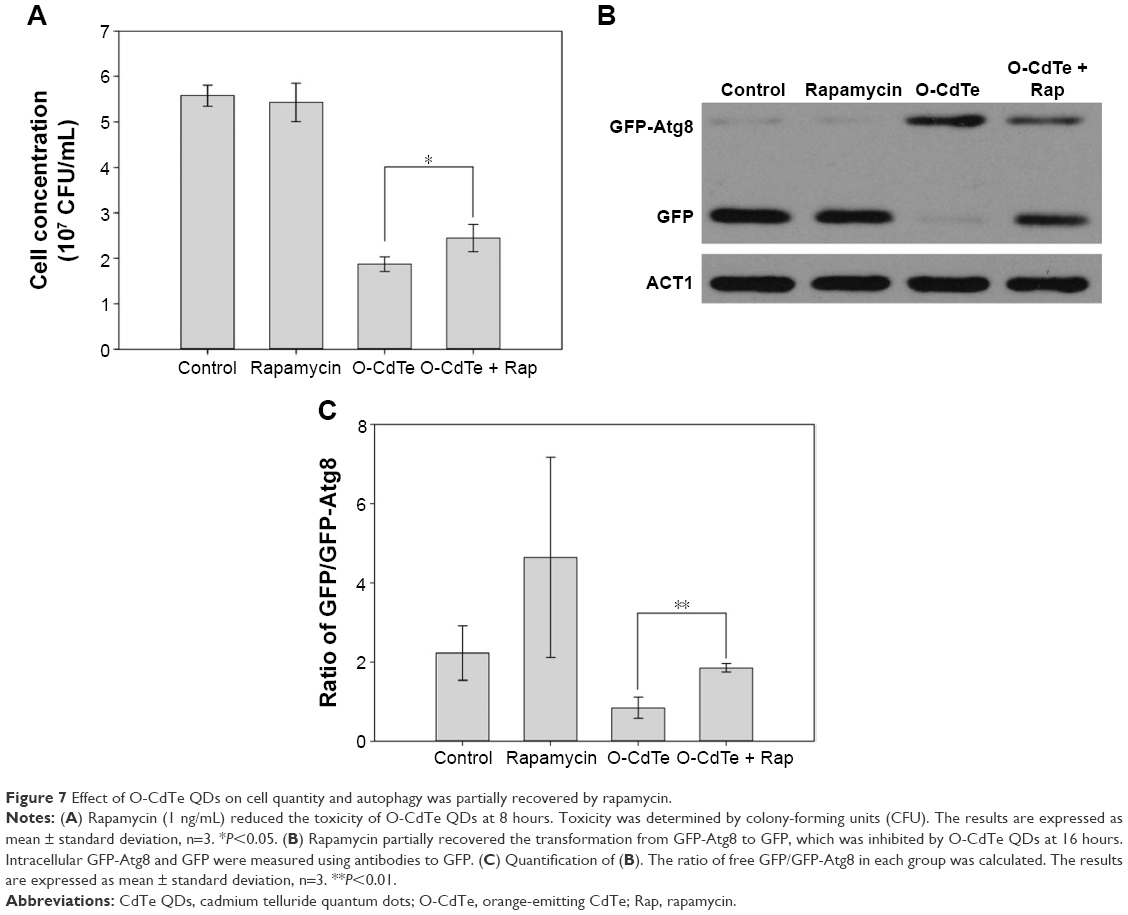 | Figure 7 Effect of O-CdTe QDs on cell quantity and autophagy was partially recovered by rapamycin. |
Discussion
In this study, we have demonstrated that inhibition of autophagy is a novel toxicity mechanism of CdTe QDs in yeast.
Relationship between CdTe QDs causes toxicity and autophagy in yeast
A previous study has demonstrated that the toxicity of cadmium-based QDs is associated with the induction of autophagy in mammalian cells, which acts as a protective pathway.24 A more recent study reported that the toxicity of cadmium selenium QDs could not be attributed to autophagy in yeast.25 It therefore seems that the relationship between the toxicity of cadmium-based QDs and autophagy remains unclear.
In the current study, we found that the toxicity of CdTe QDs occurred in a dose- and size-dependent manner in yeast, which is consistent with a previous study.12 By observing the morphology of cells treated with CdTe QDs using TEM, we found that O-CdTe QDs, which were more toxic to yeast cells than G-CdTe QDs, induced the accumulation of autophagic bodies in vacuoles. Further experiments demonstrated that the accumulation of autophagic bodies in vacuoles caused by O-CdTe QDs was due to autophagy inhibition at a late stage. Moreover, autophagy inhibited at a late stage in cells treated with O-CdTe QDs could be partially recovered by enhancing autophagy with rapamycin and so as the number of living cells, and it had been reported that rapamycin did not inhibit endocytosis in yeast.26,27 This implies that the toxicity of O-CdTe QDs was reduced by inducing autophagy rather than inhibiting endocytosis. These results indicate that inhibition of autophagy acts as a toxicity mechanism of O-CdTe QDs.
Size effect on autophagy inhibition caused by CdTe QDs contributes to their toxicity
Previous studies have shown a size effect on the toxicity of CdTe QDs in yeast12 and mammalian cells.28 In the current study, we found that CdTe QDs with a larger size (O-CdTe QDs) were more toxic to yeast cells, combined with autophagy inhibition. It has previously been demonstrated that CdTe QDs can be internalized into yeast cells and decomposed.12 The cadmium ions (Cd2+) released from decomposed CdTe QDs are believed to be responsible for the toxicity of CdTe QDs.29 Size-dependent cellular uptake of nanoparticles has been reported, and nanoparticles with a larger size are more likely to be internalized.30 Therefore, the size-dependent toxicity of CdTe QDs can be explained as a result of a greater number of internalized CdTe QDs with larger size and more Cd2+ released. The Cd2+ in cytoplasm is detoxified by being sequestered into vacuoles by vacuolar membrane transports in yeast,31 but excessive Cd2+ can interfere with the degradation of the contents of vacuoles, which will inhibit autophagy at a late stage. This can explain why CdTe QDs cause size-dependent autophagy inhibition in yeast.
An appropriate level of autophagy is necessary for maintaining cellular homeostasis and surviving under certain environmental stress conditions,14 so inhibition of autophagy can have a negative effect on cell proliferation and survival in certain circumstances. It has been reported that the autophagic inhibitor chloroquine can inhibit cell growth correlated with G2/M cell arrest in human breast cancer cells.32 The results mentioned above show that O-CdTe QDs can inhibit autophagy and cell growth in a similar manner to chloroquine. We therefore examined the cell cycle in cells treated with CdTe QDs and found an increased proportion of cells staying in the G2/M phase (from 31.38% to 49.98%, Figure 8A and Figure S2), confirming that O-CdTe QDs can induce cell cycle arrest at G2/M. Blockade of autophagy flux will result in either apoptosis or autophagic cell death,33 which may inhibit cell growth. We detected the dead cells by methylene blue staining and found that both O-CdTe and G-CdTe QDs increased the cell death rate compared with the control, but the difference between O-CdTe QDs- and G-CdTe QDs-treated cells was not significant (Figure 8B). This suggests that inducing cell death is not the main growth inhibition mechanism of O-CdTe QDs. According to these results, we can infer that inhibition of autophagy by O-CdTe QDs may play a role in inducing cell cycle arrest at G2/M, leading to cell growth inhibition.
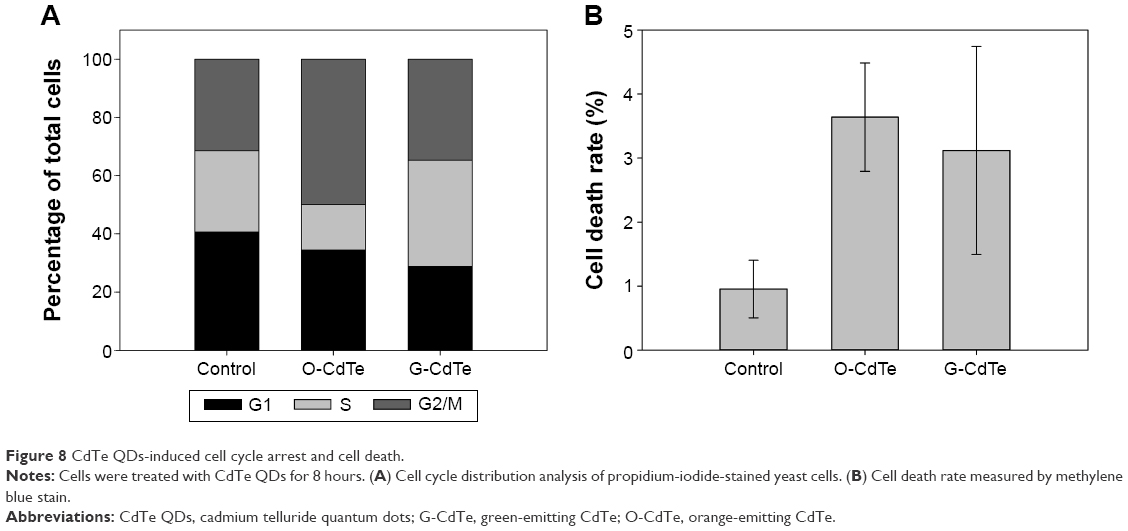 | Figure 8 CdTe QDs-induced cell cycle arrest and cell death. |
Inhibition of autophagy, an undiscovered phenomenon in cells treated with cadmium-based QDs
Activation of autophagy by cadmium-based QDs has been demonstrated in many studies performed in mammalian cells.10,16,24,34 In the present study, we found that O-CdTe QDs can partially inhibit autophagy at a late stage in yeast. To our knowledge, this is the first report of cadmium-based QDs inhibiting autophagy. The contrasting results in mammalian cells might be due to the different cell model used, but there is another reasonable explanation. Autophagosome accumulation and increasing transformation from LC3-I to LC3-II can be the result of either autophagy induction or blockade of autophagy flux in mammalian cells.35 It has been reported that nanoparticles can induce autophagosome accumulation by blockade of autophagy flux,17,36 which is consistent with our results. Therefore, it is necessary to distinguish between these two possibilities in mammalian cells by performing autophagy flux assays.35 As far as we know, research into autophagy induced by QDs in mammalian cells has not focused on distinguishing between autophagy induction and blockade of autophagy flux. Further studies in mammalian cells are therefore needed to confirm our hypothesis.
Conclusion
In this study, we investigated the toxicity of CdTe QDs in S. cerevisiae and found dose- and size-dependent toxicity, with larger-sized CdTe QDs (O-CdTe QDs) inhibiting cell growth. In addition, experiments using TEM found that O-CdTe QDs cause accumulation of autophagic bodies in the vacuoles of yeast cells. Further studies showed that the accumulation of autophagic bodies in the vacuole by O-CdTe QDs was the result of autophagy inhibition at a late stage and that there was a correlation between toxicity and autophagy inhibition. Furthermore, autophagy inhibited at a late stage by O-CdTe QDs could be partially recovered by rapamycin, as could cell numbers. These data show that inhibition of autophagy contributes to the toxicity of O-CdTe QDs in yeast. This is a novel toxicity mechanism of QDs.
Acknowledgments
This work was supported by the National Basic Research Program of China (973 Program, no 2013CB933904) and the National Natural Science Foundation of China (21272182, 21225313, and 31570090). This project is partially supported by the Chinese 111 Project Grant B06018, the National Fund for Fostering Talents in Basic Sciences (J1103513), and the Laboratory (Innovative) Research Fund of Wuhan University.
Disclosure
The authors report no conflicts of interest in this work.
References
Leutwyler WK, Bürgi SL, Burgl H. Semiconductor clusters, nanocrystals, and quantum dots. Science. 1996;271(5251):933–937. | ||
Michalet X, Pinaud FF, Bentolila LA, et al. Quantum dots for live cells, in vivo imaging, and diagnostics. Science. 2005;307(5709):538–544. | ||
Medintz IL, Uyeda HT, Goldman ER, Mattoussi H. Quantum dot bioconjugates for imaging, labelling and sensing. Nat Mater. 2005;4(6):435–446. | ||
Chan WC, Nie S. Quantum dot bioconjugates for ultrasensitive nonisotopic detection. Science. 1998;281(5385):2016–2018. | ||
Cai W, Shin DW, Chen K, et al. Peptide-labeled near-infrared quantum dots for imaging tumor vasculature in living subjects. Nano Lett. 2006;6(4):669–676. | ||
Nguyen KC, Willmore WG, Tayabali AF. Cadmium telluride quantum dots cause oxidative stress leading to extrinsic and intrinsic apoptosis in hepatocellular carcinoma HepG2 cells. Toxicology. 2013;306:114–123. | ||
Yan M, Zhang Y, Xu K, Fu T, Qin H, Zheng X. An in vitro study of vascular endothelial toxicity of CdTe quantum dots. Toxicology. 2011;282(3):94–103. | ||
Cho SJ, Maysinger D, Jain M, Roder B, Hackbarth S, Winnik FM. Long-term exposure to CdTe quantum dots causes functional impairments in live cells. Langmuir. 2007;23(4):1974–1980. | ||
Hardman R. A toxicologic review of quantum dots: toxicity depends on physicochemical and environmental factors. Environ Health Perspect. 2006;114(2):165–172. | ||
Li X, Chen N, Su Y, et al. Autophagy-sensitized cytotoxicity of quantum dots in PC12 cells. Adv Healthc Mater. 2014;3(3):354–359. | ||
Buschini A, Poli P, Rossi C. Saccharomyces cerevisiae as an eukaryotic cell model to assess cytotoxicity and genotoxicity of three anticancer anthraquinones. Mutagenesis. 2003;18(1):25–36. | ||
Han X, Lai L, Tian F, et al. Toxicity of CdTe quantum dots on yeast Saccharomyces cerevisiae. Small. 2012;8(17):2680–2689. | ||
Yang Z, Klionsky DJ. Eaten alive: a history of macroautophagy. Nat Cell Biol. 2010;12(9):814–822. | ||
Klionsky DJ, Emr SD. Autophagy as a regulated pathway of cellular degradation. Science. 2000;290(5497):1717–1721. | ||
Stern ST, Zolnik BS, McLeland CB, Clogston J, Zheng J, McNeil SE. Induction of autophagy in porcine kidney cells by quantum dots: a common cellular response to nanomaterials? Toxicol Sci. 2008;106(1):140–152. | ||
Zabirnyk O, Yezhelyev M, Seleverstov O. Nanoparticles as a novel class of autophagy activators. Autophagy. 2007;3(3):278–281. | ||
Ma X, Wu Y, Jin S, et al. Gold nanoparticles induce autophagosome accumulation through size-dependent nanoparticle uptake and lysosome impairment. ACS Nano. 2011;5(11):8629–8639. | ||
Klionsky DJ. Autophagy: from phenomenology to molecular understanding in less than a decade. Nat Rev Mol Cell Biol. 2007;8(11):931–937. | ||
Suzuki K, Kirisako T, Kamada Y, Mizushima N, Noda T, Ohsumi Y. The pre-autophagosomal structure organized by concerted functions of APG genes is essential for autophagosome formation. EMBO J. 2001;20(21):5971–5981. | ||
Gietz RD, Schiestl RH. High-efficiency yeast transformation using the LiAc/SS carrier DNA/PEG method. Nat Protoc. 2007;2(1):31–34. | ||
Baba M. Electron microscopy in yeast. Methods Enzymol. 2008;451:133–149. | ||
Cheong H, Klionsky DJ. Biochemical methods to monitor autophagy-related processes in yeast. Methods Enzymol. 2008;451:1–26. | ||
Klionsky DJ, Abdalla FC, Abeliovich H, et al. Guidelines for the use and interpretation of assays for monitoring autophagy. Autophagy. 2012;8(4):445–544. | ||
Luo YH, Wu SB, Wei YH, et al. Cadmium-based quantum dot induced autophagy formation for cell survival via oxidative stress. Chem Res Toxicol. 2013;26(5):662–673. | ||
Sun M, Yu Q, Liu M, et al. A novel toxicity mechanism of CdSe nanoparticles to Saccharomyces cerevisiae: enhancement of vacuolar membrane permeabilization (VMP). Chem Biol Interact. 2014;220:208–213. | ||
deHart AK, Schnell JD, Allen DA, Tsai JY, Hicke L. Receptor internalization in yeast requires the Tor2-Rho1 signaling pathway. Mol Biol Cell. 2003;14(11):4676–4684. | ||
Dulic V, Egerton M, Elguindi I, Raths S, Singer B, Riezman H. Yeast endocytosis assays. Methods Enzymol. 1991;194:697–710. | ||
Lovric J, Bazzi HS, Cuie Y, Fortin GR, Winnik FM, Maysinger D. Differences in subcellular distribution and toxicity of green and red emitting CdTe quantum dots. J Mol Med (Berl). 2005;83(5):377–385. | ||
Su Y, Hu M, Fan C, et al. The cytotoxicity of CdTe quantum dots and the relative contributions from released cadmium ions and nanoparticle properties. Biomaterials. 2010;31(18):4829–4834. | ||
Oh N, Park JH. Endocytosis and exocytosis of nanoparticles in mammalian cells. Int J Nanomedicine. 2014;9(suppl 1):51–63. | ||
Wemmie JA, Szczypka MS, Thiele DJ, Moye-Rowley WS. Cadmium tolerance mediated by the yeast AP-1 protein requires the presence of an ATP-binding cassette transporter-encoding gene, YCF1. J Biol Chem. 1994;269(51):32592–32597. | ||
Jiang PD, Zhao YL, Shi W, et al. Cell growth inhibition, G2/M cell cycle arrest, and apoptosis induced by chloroquine in human breast cancer cell line Bcap-37. Cell Physiol Biochem. 2008;22(5–6):431–440. | ||
Kroemer G, Jaattela M. Lysosomes and autophagy in cell death control. Nat Rev Cancer. 2005;5(11):886–897. | ||
Seleverstov O, Zabirnyk O, Zscharnack M, et al. Quantum dots for human mesenchymal stem cells labeling. A size-dependent autophagy activation. Nano Lett. 2006;6(12):2826–2832. | ||
Mizushima N, Yoshimori T, Levine B. Methods in mammalian autophagy research. Cell. 2010;140(3):313–326. | ||
Johnson-Lyles DN, Peifley K, Lockett S, et al. Fullerenol cytotoxicity in kidney cells is associated with cytoskeleton disruption, autophagic vacuole accumulation, and mitochondrial dysfunction. Toxicol Appl Pharmacol. 2010;248(3):249–258. |
Supplementary materials
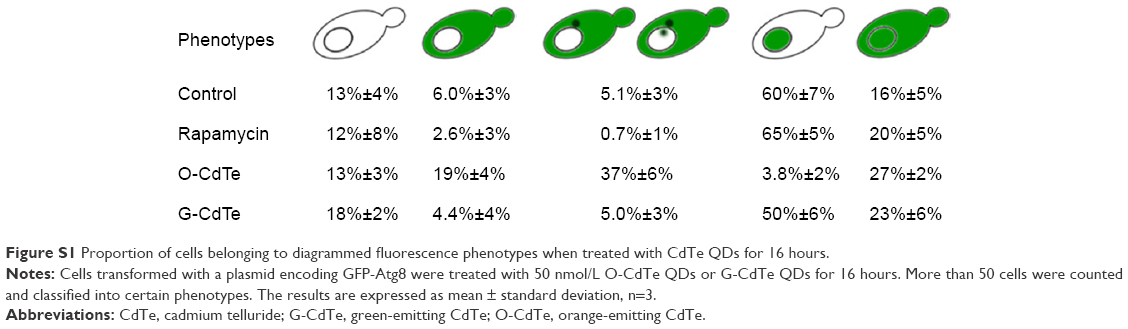 | Figure S1 Proportion of cells belonging to diagrammed fluorescence phenotypes when treated with CdTe QDs for 16 hours. |
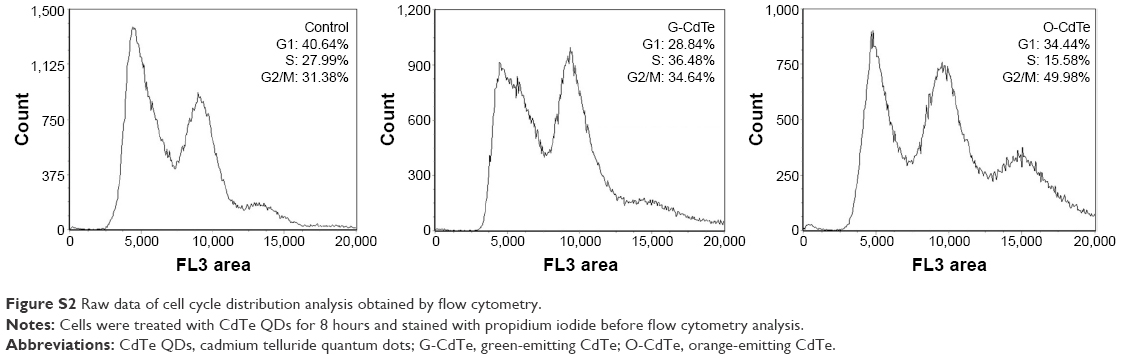 | Figure S2 Raw data of cell cycle distribution analysis obtained by flow cytometry. |
 © 2016 The Author(s). This work is published and licensed by Dove Medical Press Limited. The full terms of this license are available at https://www.dovepress.com/terms.php and incorporate the Creative Commons Attribution - Non Commercial (unported, v3.0) License.
By accessing the work you hereby accept the Terms. Non-commercial uses of the work are permitted without any further permission from Dove Medical Press Limited, provided the work is properly attributed. For permission for commercial use of this work, please see paragraphs 4.2 and 5 of our Terms.
© 2016 The Author(s). This work is published and licensed by Dove Medical Press Limited. The full terms of this license are available at https://www.dovepress.com/terms.php and incorporate the Creative Commons Attribution - Non Commercial (unported, v3.0) License.
By accessing the work you hereby accept the Terms. Non-commercial uses of the work are permitted without any further permission from Dove Medical Press Limited, provided the work is properly attributed. For permission for commercial use of this work, please see paragraphs 4.2 and 5 of our Terms.