")
Back to Journals » Journal of Hepatocellular Carcinoma » Volume 10
Inhibition of Annexin A10 Contributes to ZNF281 Mediated Aggressiveness of Hepatocellular Carcinoma
Authors Zhang X, Zhang C , Zhao Q, Wang S, Wang L, Si Y, Su Q, Cheng S, Ding W
Received 10 December 2022
Accepted for publication 15 March 2023
Published 5 April 2023 Volume 2023:10 Pages 553—571
DOI https://doi.org/10.2147/JHC.S400989
Checked for plagiarism Yes
Review by Single anonymous peer review
Peer reviewer comments 2
Editor who approved publication: Dr Ahmed Kaseb
Xialu Zhang,1,* Chenguang Zhang,1,2,* Qingfang Zhao,1 Shanshan Wang,3 Liyong Wang,4 Yang Si,1 Qiang Su,5 Shan Cheng,1 Wei Ding1
1School of Basic Medical Sciences, Capital Medical University, Beijing, People’s Republic of China; 2Beijing Key Laboratory for Cancer Invasion and Metastasis Mechanism Research, Capital Medical University, Beijing, People’s Republic of China; 3Beijing Institute of Hepatology, Beijing You’An Hospital, Capital Medical University, Beijing, People’s Republic of China; 4Core Facilities for Molecular Biology, Capital Medical University, Beijing, People’s Republic of China; 5Department of Oncology, Beijing Friendship Hospital, Capital Medical University, Beijing, People’s Republic of China
*These authors contributed equally to this work
Correspondence: Chenguang Zhang; Wei Ding, Email [email protected]; [email protected]
Objective: To investigate the involvement and transcriptional targets of zinc finger protein 281 (ZNF281) in the progression of hepatocellular carcinoma (HCC).
Methods: The expression of ZNF281 in HCC was detected in tissue microarray and cell lines. The role of ZNF281 in aggressiveness of HCC was examined using wound healing, matrigel transwell, pulmonary metastasis model and assays for expression of EMT markers. RNA-seq was used to find potential target gene of ZNF281. Chromatin immunoprecipitation (ChIP) assay and co-immunoprecipitation (Co-IP) were employed to uncover the mechanism of the transcriptional regulation of ZNF281 on the target gene.
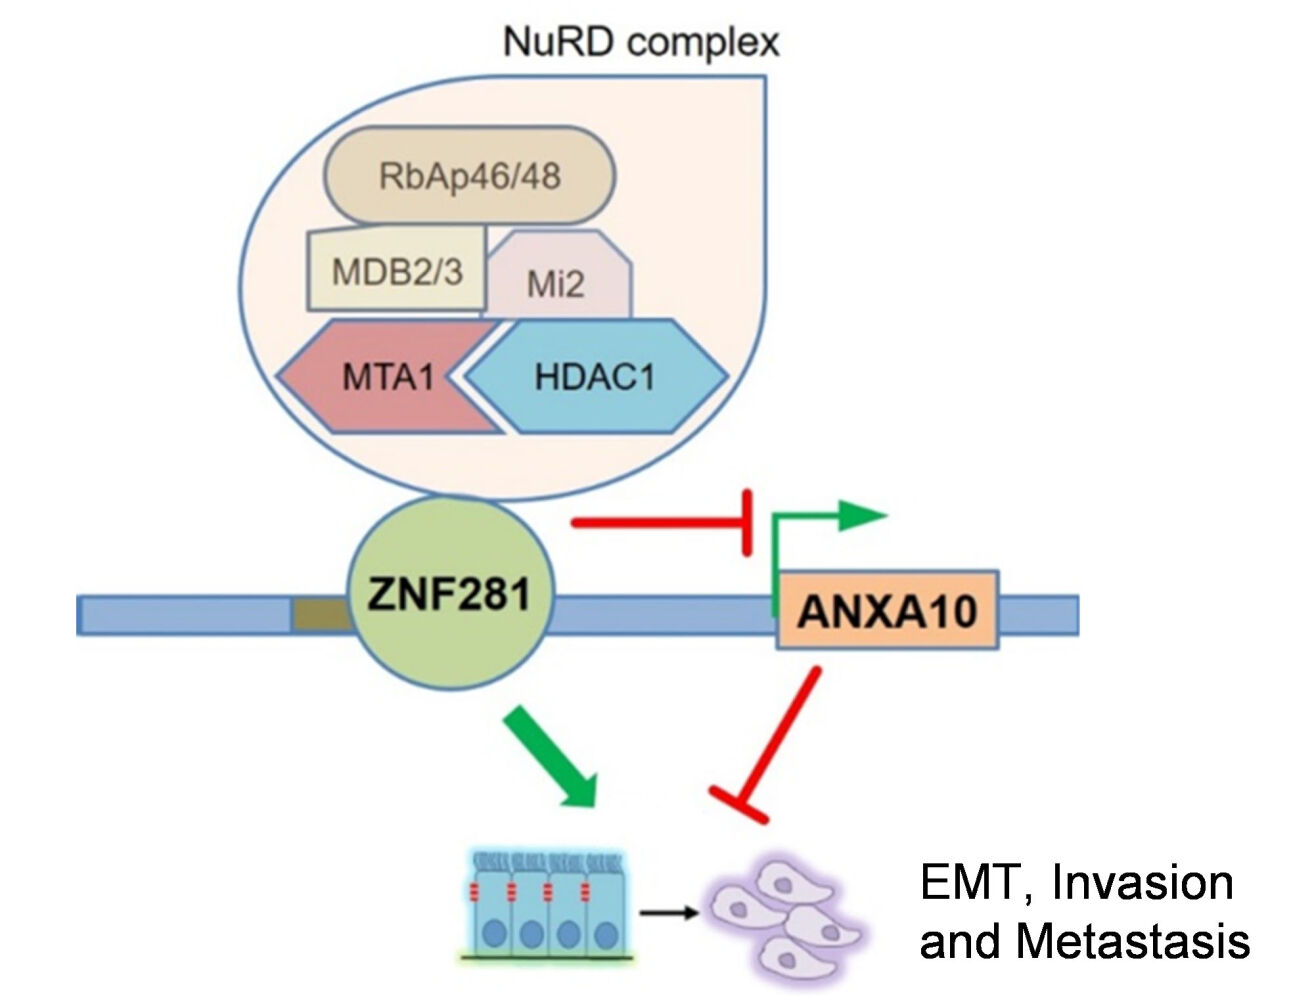
Results: ZNF281 was increased in tumor tissues and positively correlated with vascular invasion in HCC. Knockdown of ZNF281 suppressed the migration and invasion with significant alteration of EMT marker expression in HLE and Huh7 HCC cell lines. RNA-seq screening showed that the tumor suppressor gene Annexin A10 (ANXA10) was a most up-regulated gene in response to ZNF281 depletion and responsible for the attenuation of aggressiveness. Mechanistically, ZNF281 interacted with the ANXA10 promoter region harboring ZNF281 recognition sites, and recruited components of nucleosome remodeling and deacetylation (NuRD) complex. By knocking down such components like HDAC1 or MTA1, ANXA10 was released from transcriptional repression by ZNF281/NuRD, and in turn reversed the EMT, invasion and metastasis driven by ZNF281.
Conclusion: ZNF281 drives invasion and metastasis of HCC partially through transcriptional repression of tumor suppressor gene ANXA10 by recruiting NuRD complex.
Keywords: zinc finger protein 281, Annexin A10, nucleosome remodeling and deacetylation complex, hepatocellular carcinoma, invasion and metastasis, transcription
Graphical Abstract:
Introduction
Hepatocellular carcinoma (HCC) is the most common malignancy in the liver and the third leading cause of cancer-related death worldwide.1 A number of genetic or epigenetic alterations have been identified contributing to the initiation and progression of HCC.2 The current principal strategies for HCC treatment include surgical resection, radio- or chemotherapies, liver transplantation, or administration of targeting drugs of sorafenib or regorafenib. Nevertheless, the patient outcome of HCC remained to be far from satisfactory.3 One of the main reasons is the invasion and early metastasis of HCC.4
One hallmark of aggressiveness for cancer is epithelial-mesenchymal transition (EMT), through which malignant cells acquire mesenchymal features, including decreased cell–cell contacts, increased motility. EMT helps cancer cells spread into surrounding tissues and plays critical roles in invasion and early metastasis of HCC.5 Aberrant EMT was usually activated by dysregulated EMT-related transcription factors (EMT-TF) in cancer, including the SNAI family members of Snail (SNAI1) and Slug (SNAI2), Twist family members of Twist1 and Twist2, and the ZEB family members of ZEB1 and ZEB2, all of which were suggested to promote EMT and metastasis of HCC.6 Negative regulators of EMT suppress this process usually by direct or indirect inhibition of EMT-TFs. TP53 was identified to elicit the expression of miR-200 and miR-192 to target ZEB1 and ZEB2 for the repression of EMT in HCC.7 Chromatin remodeling factor ARID2 repressed EMT of HCC cells by inhibiting Snail transcription through recruiting DNMT1.8 Therefore, positive and negative regulators of EMT were intertwined to constitute regulatory networks. Dysfunction of the regulations, either through overactivation of the positive, or silence of the negative regulators, contributed to EMT, invasion and metastasis of HCC.
ZNF281 is a member of the zinc finger family of transcription factors that contains four Krüppel-type C2H2 zinc finger motifs,9 which binds to GC-rich DNA sequences on the promoters or enhancers of target genes. ZNF281 can either activate or repress gene transcription largely dependent on the cofactors. ZNF281 interacts with Nanog, Oct4 and Sox2 to regulate stemness of mouse embryonic stem cells.10 It also regulates the auto-regulation of Nanog expression by recruiting the nucleosome remodeling and deacetylation (NuRD) complex.11 Through interaction with c-myc, ZNF281 regulates transcription initiation and elongation.12 ZNF281 was recently identified as an important positive regulator of EMT in colon and breast cancer.13,14 It also promotes the progression of pancreatic cancer and neuroblastoma.15,16 Although its mRNA up-regulation, or copy number amplification in HCC appeared to be mostly occurred over other cancer types,16 its functions and transcriptional targets in HCC have not been addressed.
Annexin A10 (ANXA10) belongs to the annexin protein superfamily, of which the members bind negatively charged phospholipid in a Ca2+-dependent manner.17 ANXA10 harbors only one Ca2+ binding site and manifests as a unique member for its nuclear localization.18 ANXA10 is expressed specifically in normal epithelial tissues, predominantly in gastrointestinal tract and liver.19 Either homozygous somatic deletion of the ANXA10 gene or down-regulation of its mRNA associated with poor survival rate in both gastric and bladder cancers, implicating its tumor suppressing function.20,21 In HCC, high frequency loss of chromosome 4q is observed, where ANXA10 localizes.2 Meanwhile, down-regulation of ANXA10 was found in 9 out of 15 independent HCC datasets22, which was associated with vascular invasion and early recurrence of HCC.19 Besides somatic deletion, the mechanism for decreased ANXA10 expression in HCC is largely unknown.
In the present study, we investigated the major functions of ZNF281 in HCC. We found that ZNF281 promoted EMT-associated invasion metastasis of HCC, and further identified ANXA10 was a novel repression target of ZNF281 that exerted potent activity to suppress aggressiveness of HCC.
Materials and Methods
Cell Culture
The human liver cancer cell lines of Huh7, and HepG2 were purchased from the Cell Resource Center, Peking Union Medical College. The normal human liver cell line LO2 and HCC cell line HLE were kindly provided by Dr. Dexi Chen at Beijing Institute of Hepatology. Cells were maintained in Dulbecco’s modified Eagle medium (DMEM, for Huh7, HLE and LO2), or Minimum Essential Medium (MEM, for HepG2) supplemented with 10% fetal bovine serum (FBS, Gibco, New York, NY, USA) and 1% Penicillin/Streptavidin (KeyGene, MD, USA) in Corning (New York, NY, USA) dishes at 37°C in a humidified incubator with 5% CO2. The identity of the cell lines was confirmed with its suppliers, continuing culture in suggested conditions and observation under microscopy for cell morphology as well as growth rate.
Plasmid or Interfering RNA Transfection
ZNF281 overexpression plasmid in GV141 backbone was purchased from Shanghai Genechem Co. Ltd. (Shanghai, China). Cells were transfected with plasmid using Lipofectamine 2000 (Invitrogen, Carlsbad, CA, USA) according to the manufacturer’s protocol. The siRNAs targeting ZNF281 were purchased from Beijing Syngen Tech Co. Ltd. (Beijing, China). The oligos used for knockdown of ZNF281 and ANXA10 are listed in Table 1. Specific siRNAs of HDAC1 (Cat#:sc-29343) and MTA1 (Cat#: sc-35981) were purchased from Santa Cruz (CA, USA). Cells were transfected with siRNAs (50 nM in final concentration) using Lipofectamine RNAIMAX (Invitrogen, Carlsbad, CA, USA) following the manufacturer’s instructions.
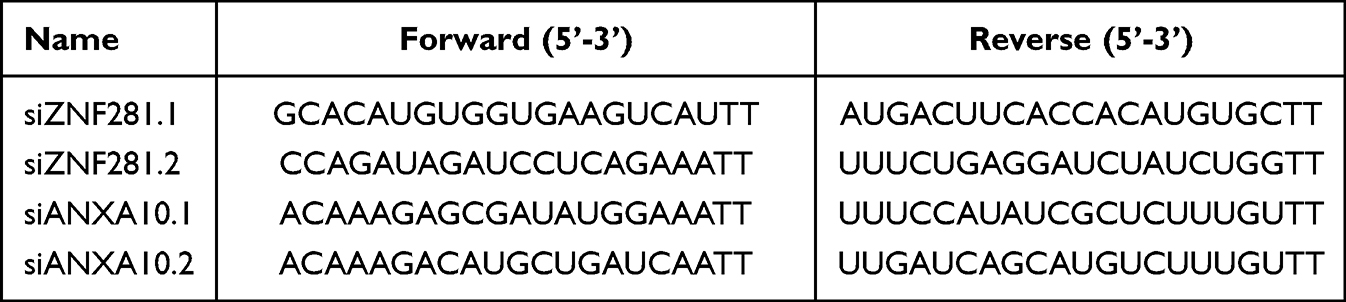 |
Table 1 siRNAs Targeting ZNF281 and ANXA10 |
shRNAs in Lentivirus vectors (pHS-ASR-LW007 (control), pHS-ASR-LW125 (ZNF281.kd1) or pHS-ASR-LW126 (ZNF281.kd2)) were purchased from Beijing Syngen Tech Co. Ltd. (Beijing, China) and used to establish ZNF281stable knockdown cell lines, which were named as Con, ZNF281.kd1, and ZNF281.kd2, respectively.
Reverse Transcription and Quantitative Real-Time PCR (RT-qPCR)
Total RNAs were extracted using an RNeasy Mini Kit (Yishan, Shanghai, China) according to the manufacturer’s protocol. One microgram of total RNA was subjected to reverse transcription assays using the Reverse Transcription Kit (Takara, Dalian, China). The RT-qPCR primers for the detected genes are shown in Table 2. The qPCR assays were performed using SYBR Green (Novoprotein, Shanghai, China) with a Rocgene Archimed X6 Real-Time PCR Detection System. 18S RNAs were used as internal control. The fold changes were calculated with the 2−ΔΔCt method.
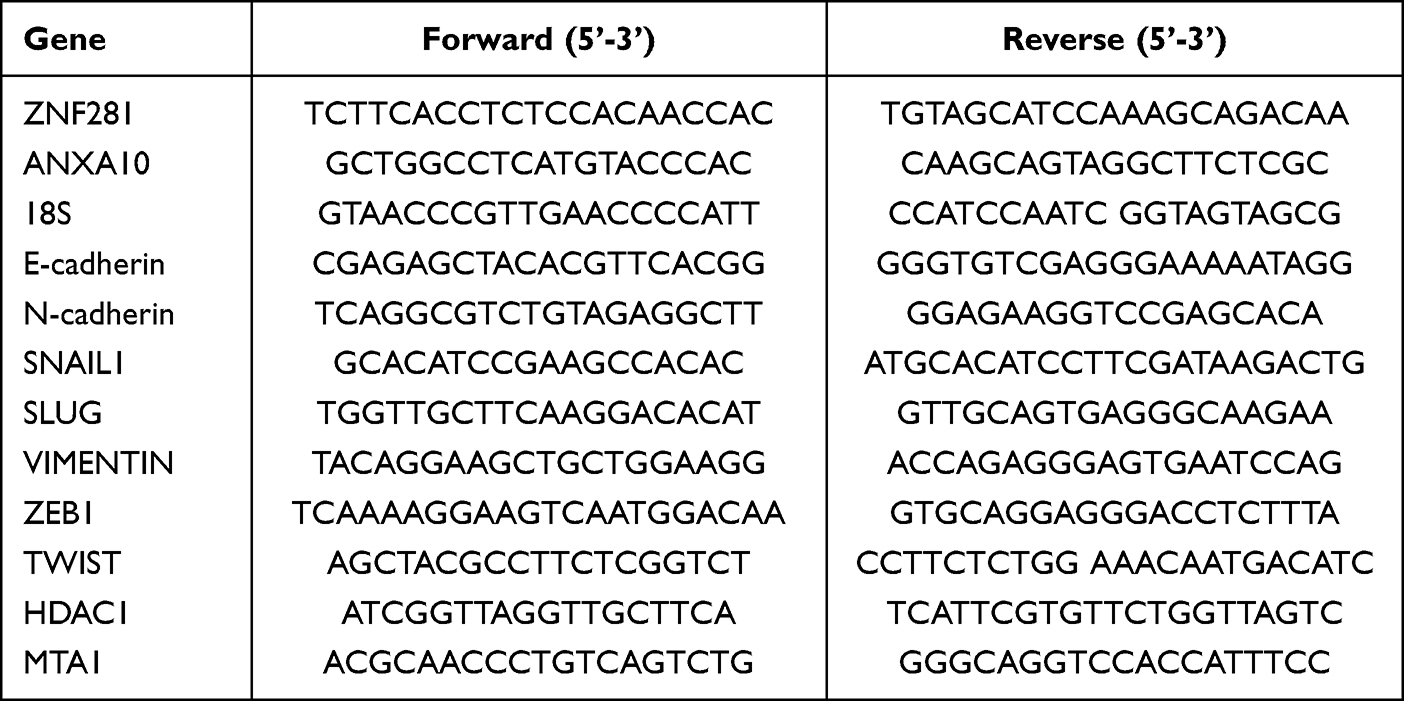 |
Table 2 Primers Used for RT-qPCR Reaction |
Western Blot and Co-Immunoprecipitation Assay
Total protein was extracted with RIPA cell lysis buffer containing a cocktail of proteolytic inhibitors, and the protein concentration was quantified using a BCA Protein Assay Kit (Novagen, Billerica, MA, USA). The loading of 12 μg protein per sample was subjected to the separation in a 10% SDS–PAGE gel and then electrotransferred to polyvinylidene fluoride (PVDF) filters (Merck Millipore, Darmstadt, Germany). The filters were blocked for 1 h in 1.5% BSA in TBST (pH 8.0) and incubated with the corresponding primary antibodies overnight at 4°C. The primary antibodies used included anti-ZFP281 (1:1000, Abcam, Cambridge, MA, USA), anti-ANXA10 (1:1000, Abcam, Cambridge, MA, USA), anti-HDAC1 (1:500, Invitrogen Carlsbad, CA, USA), anti-MTA1 (1:1000, Abcam, Cambridge, MA, USA), anti-MTA3 (1:1000, Abcam, Cambridge, MA, USA), anti-MBD2/3(1:1000, Abcam, Cambridge, MA, USA), anti-Mi2 (1:500, Santa Cruz, CA, USA) and β-actin (1:10,000, Abclonal, Wuhan, China). Following incubation with Goat anti-Mouse/Rabbit IgG Secondary Antibody HRP conjugated (SAB, MD, USA) at room temperature for 1 h; the detected bands were imaged using a MiniChemi™ Chemiluminescence instrument. In co-immunoprecipitation assays, the protein extracted from HLE cells using RIPA buffer (50 mM Tris-Cl (pH 7.5), 150 mM NaCl, 0.2mM EDTA and 2% NP-40) was incubated with primary anti-ZNF281 (1 μg, Abcam, Cambridge, MA, USA) or control IgG (1 μg, Applygen, Beijing, China), and with Protein A/G PLUS-Agarose (Santa Cruz, CA, USA) at 4°C overnight. The collected samples were washed extensively with RIPA buffer prior to immunoblotting procedures.
Matrigel Transwell Assay
Costar 24-well transwell plates of 8 μm in pore size were used. The filters were coated with Matrigel (BD Biosciences, CA, USA) at a concentration of 1:30 in DMEM without FBS. Then, 2×10⁴ cells were seeded on the Matrigel in the upper chamber. The lower chamber was filled with DMEM with 20% FBS. The plates were maintained in cultures for 48 h, and then the cells remained in the upper chamber on the filter were removed. Cells invaded to the lower chamber were fixed with 1% paraformaldehyde for 30 min and then stained with 0.5% Crystal Violet Dyes for 15 min. The air-dried filters were imaged under a microscope. Six different fields per condition were counted.
Animal Experiments
Animal experiments were consistent with ARRIVE guidelines. Experimental protocols followed the Guidelines for Welfare of Animals in Experimental Neoplasia and were approved by the Institutional Animal Care and Use Committee of Capital Medical University.
For pulmonary metastasis assay, fifteen male 5-week-old BALB/c nude mice were randomized into three groups (n = 5 each group), HLE cells (1×10⁶) stably transfected with shRNAs against ZNF281 together with or without shRNAs for ANXA10 were injected into the tail veins to establish lung metastasis model. Mice were sacrificed 6 weeks post injection, and the lungs were resected, stained with 5% picric acid. The pulmonary metastatic foci were counted, and detected through hematoxylin and eosin (HE) staining.
Immunohistochemistry for ZNF281 in Tissue Section Array Samples
The study concerning tissue array was performed in compliance with the Helsinki Declaration, and approved by the Ethic Committee of You’An hospital affiliated to Capital Medical University (#LL-2021-163-K). A tissue microarray including 90 HCC and paired para-tumor sections was constructed from patients who underwent surgical resection at You’An hospital affiliated to Capital Medical University and informed consents were obtained. The tissue sections were deparaffinized in an oven at 60°C for 1 h and then processed with the Leica Bond-Max instrument (Wetzlar, Germany) by the following steps: rehydration through an ethanol grade and in distilled water and subjected to the treatment with 3% H2O2 for 6 min for blocking the endogenous peroxidase. After extensive washing, the tissue microarray was incubated with anti-ZFP281 for 20 min, washed in PBS for three times, and then incubated with secondary antibodies. The tissues were stained with DAB for 10 min, counterstained using haematoxylin for 5 min, and then dehydrated through 5 rounds of ethanol (70%, 85%, 90%, 100% and 100%) for 5 min each. Finally, the processed tissue microarray was cleared in xylene twice of 5 min each, and then mounted in Neutral balsam (Solarbio, Beijing, China). The stained IHC samples were examined under a microscope and scored from 1 to 5 based on ZNF281 staining intensity. The average scores from the evaluation of 4 independent investigators were used for statistical analyses.
RNA-Sequencing
Total RNA was extracted from HLE stable cells (Con, ZNF281.kd1 and ZNF281.kd2) in duplicate and purified to construct SE50 RNA-Seq libraries. RNA-Seq was performed using the BGISEQ-500 sequencer at the BGI (ShenZhen, China). Approximately 40 million reads per sample were mapped to human GRCh38.p11 (hg38) genome using Bowtie2 with default parameters. The expression level of a specific gene was calculated for the number of fragments per kilobase of exon per million fragments mapped (FPKM) reads using the RSEM software with default parameters. Differentially expressed genes were identified using the DEseq2 package. To exclude the off-target effect, only DEGs with consistent trend of alteration (up or downregulation in both ZNF281.kd1 and ZNF281.kd2) and with FPKM >1 were included. RNA-seq data from this study have been deposited to Gene Expression Omnibus (GSE146496).
Chromatin Immunoprecipitation (ChIP) Assay
A ChIP Assay Kit (Beyotime, Shanghai, China) was used following the manufacturer’s instructions. The DNA-bound protein was immunoprecipitated using either anti-ZFP281 or rabbit IgG (Applygen, Beijing, China). Co-precipitated DNAs were subjected to PCR amplification employing primers surrounding a 221 bp region (site1), and a 185 bp region (site2) of ANXA10 promoter (Site1 forward: 5′-GGGCCAAGGACCCAAAGA-3′; reverse: 5′- TTCCCATGAACAGAACACCAG −3′; Site2 forward: 5′-AAGTGATCTGCCTGCCTTAGCC-3′; reverse: 5′-GTGCTCCAGCCCTAGTTTCCTATC-3′). The enrichment ratio was determined according to the following formula: (% IP/INPUT = 2[(Ct (x% input) – log (x %) /log2) – Ct (IP)] × 100).
Statistical Analyses
Data were presented as mean ± SEM. Statistical significance was calculated using the unpaired Student t test using p < 0.05 as the threshold for significance. For immunohistochemical analysis, the Pearson χ2 test was used and p < 0.05 was considered significant.
Results
ZNF281 Was Increased in HCC Tissue and Correlated with Vascular Invasion
We first performed immunohistochemistry to determine the protein expression of ZNF281 in HCC tissue microarray. Higher expression of ZNF281 was observed in cancerous than in para-cancerous tissues (Figure 1A and B). Clinicopathological characteristics analyses of the patients indicated that ZNF281 was positively correlated with vascular invasion and tumor size (Table 3). Up-regulation at the mRNA level of ZNF281 was also observed in cancerous than in para-cancerous tissues of HCC patients (Figure 1C), and in other public HCC cohorts (Figure 1D, E). We then examined the ZNF281 expression in HCC cell lines and normal liver cell line LO2. The results indicated that ZNF281 in Huh7, HLE and HepG2 cells was much higher than in LO2 cells (Figure 1F).
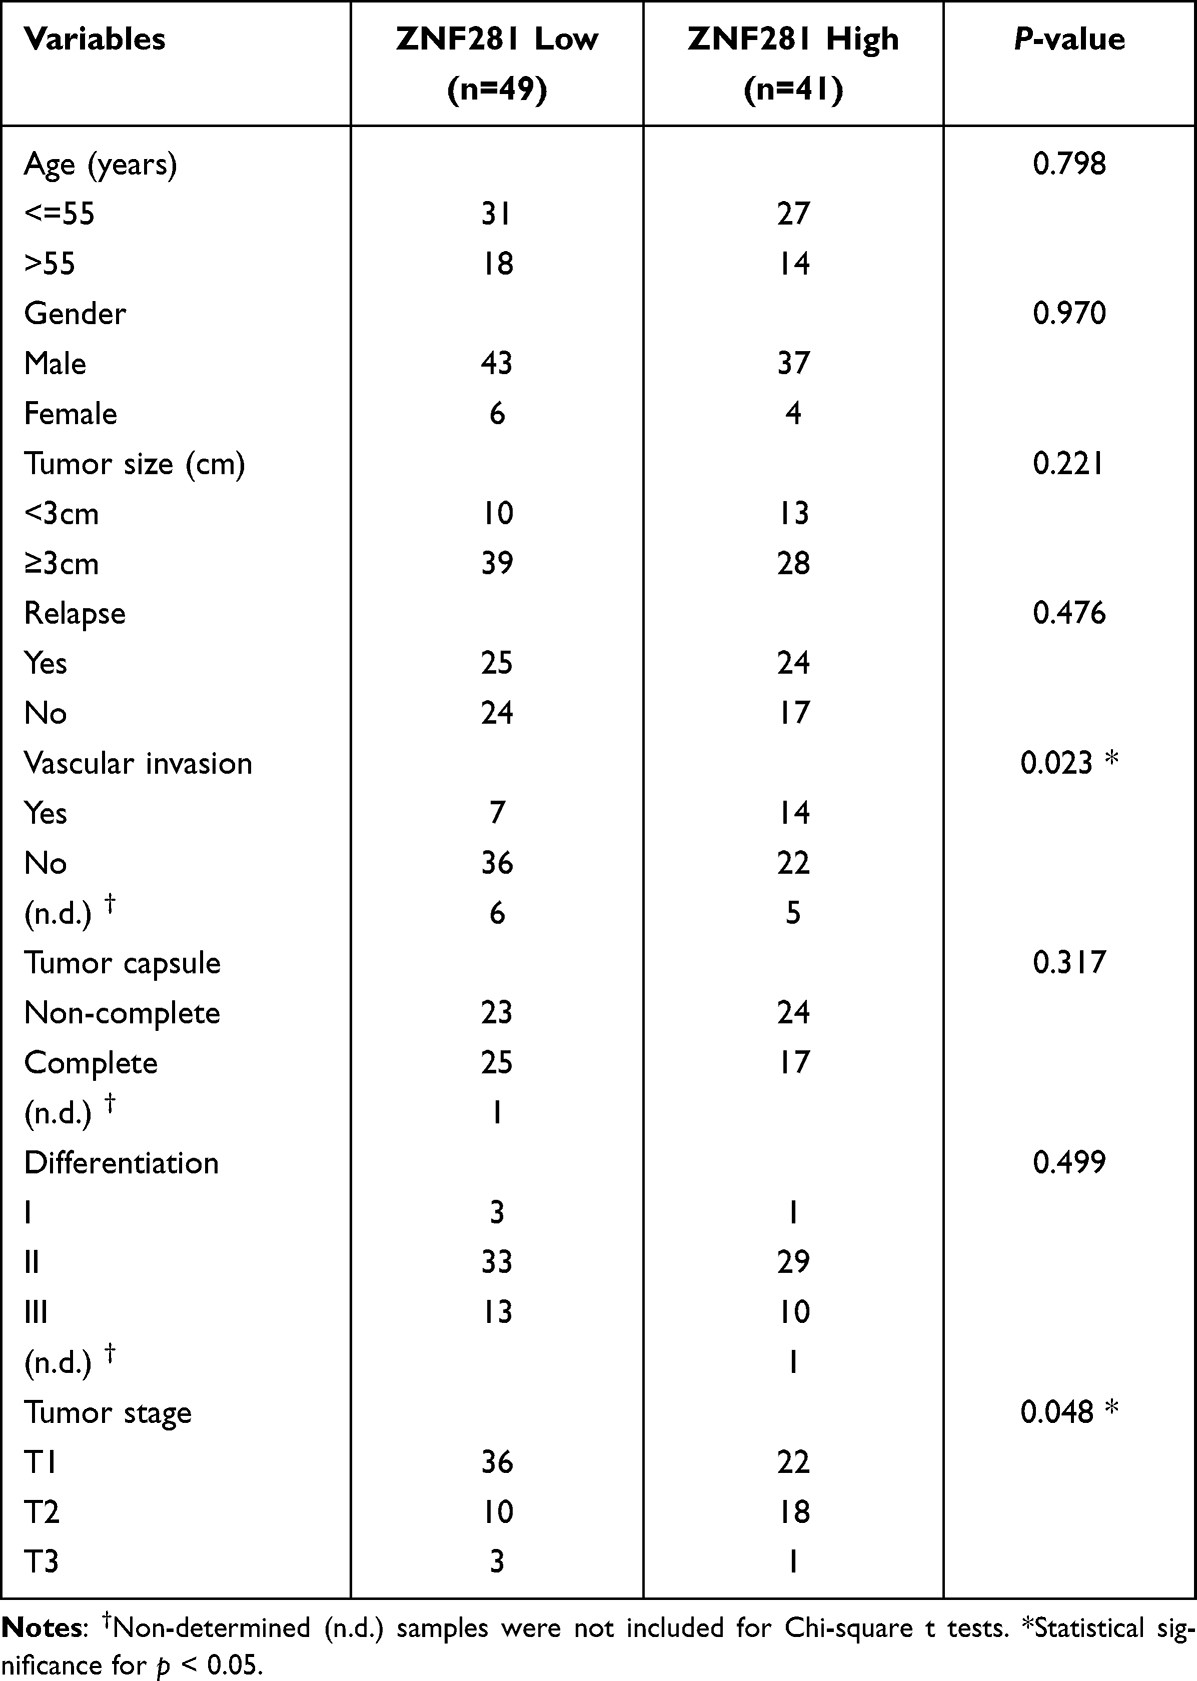 |
Table 3 The Correlation Between ZNF281 Expression and Clinicopathological Characteristics in HCC Tissue Microarray (90 Samples) |
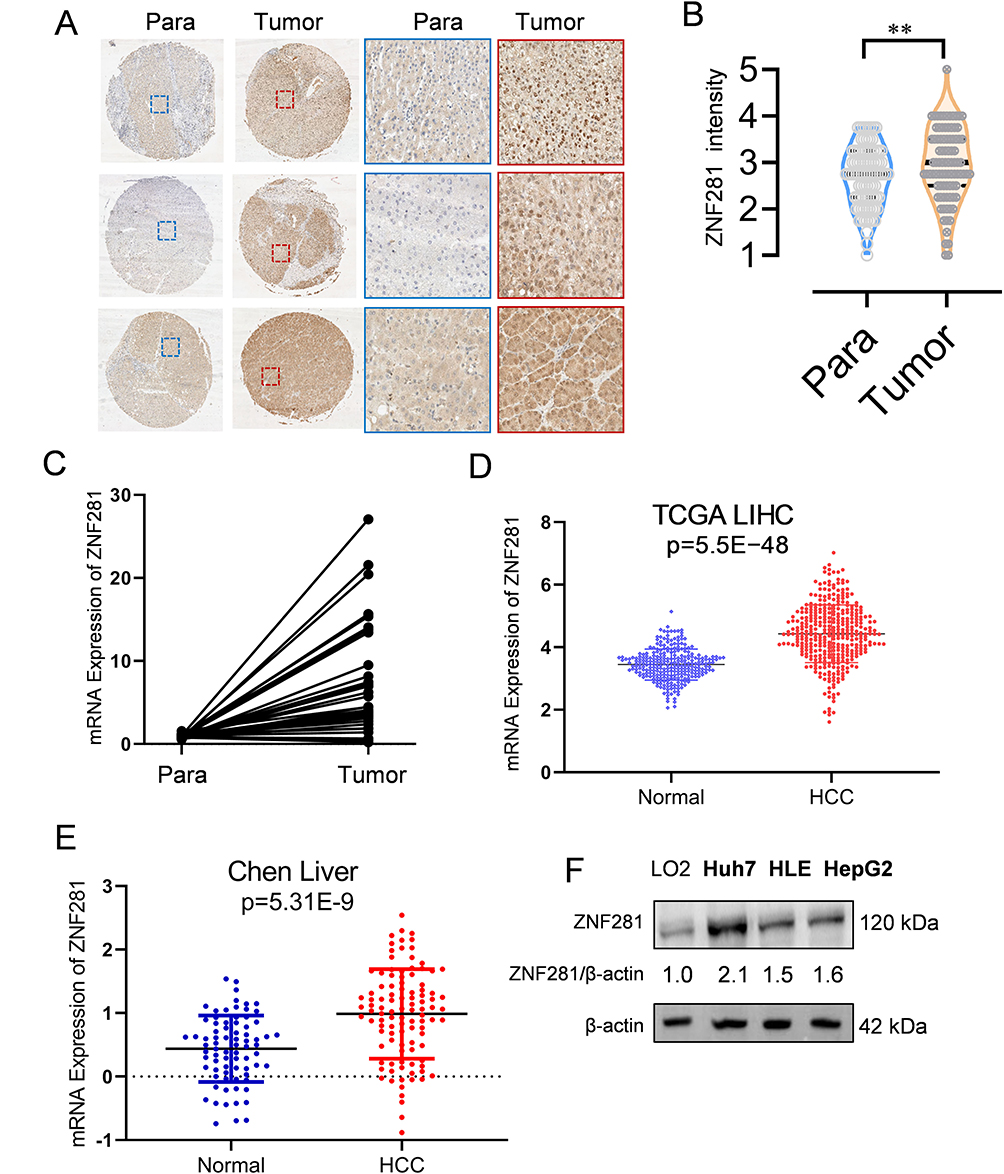 |
Figure 1 ZNF281 was increased expression in hepatocellular carcinoma (HCC). (A) Immunohistochemistry of ZNF281 in HCC tissues in comparison with corresponding paracancerous tissues (left: 4×, right: 20× objective). (B) Quantification from A (n=3; **p < 0.01). (C) Comparison of mRNA level of ZNF281 from HCC and corresponding paracancerous tissues of 14 HCC patients. (D) Comparison of ZNF281 mRNA level between HCC patients and the non-cancer control in the TCGA liver cancer and the GTEx datasets. (E) Comparison of ZNF281 mRNA level between HCC patients and normal control of Chen’s liver in the Oncomine database. (F) Protein level of ZNF281 in commonly used normal liver or HCC cell lines. |
Knockdown of ZNF281 Suppressed the Invasiveness of HCC Cells and Altered the EMT Phenotype
We next took RNAi approach and constructed two shRNAs in lentivirus vectors targeting different regions of ZNF281. As HLE and Huh7 have been shown to possess higher invasive and metastatic potentials,23,24 we conducted subsequent experiments mainly in HLE and Huh7. By infection of HLE or Huh7 cells and selection, we obtained stable cells with significantly reduced ZNF281 expression (ZNF281.kd1 and ZNF281.kd2) in both cell types (Figure 2A). ZNF281 knockdown cells from both HLE and Huh7 background significantly reduced the capacities for migration as shown in wound healing (Figure 2B and C with quantification in Figure 2D and E), and invasion shown with matrigel transwell assays (Figure 2F and G with quantification in Figure 2H and I). The obtained cells also showed decreased proliferation as measured in colony formation assays (Figure S1A and S1B with quantification in Figure S1C and S1D) and cell cycle analyses (Figure S1E and S1F). As the effect of ZNF281 knockdown on invasion was more obvious than on cell proliferation (Figure 2F-I vs Figure S1E-F), and ZNF281 was shown to be an important EMT regulator in other cancer types [13], the following studies mainly focused on the regulation of ZNF281 on EMT associated invasion and metastasis in HCC.
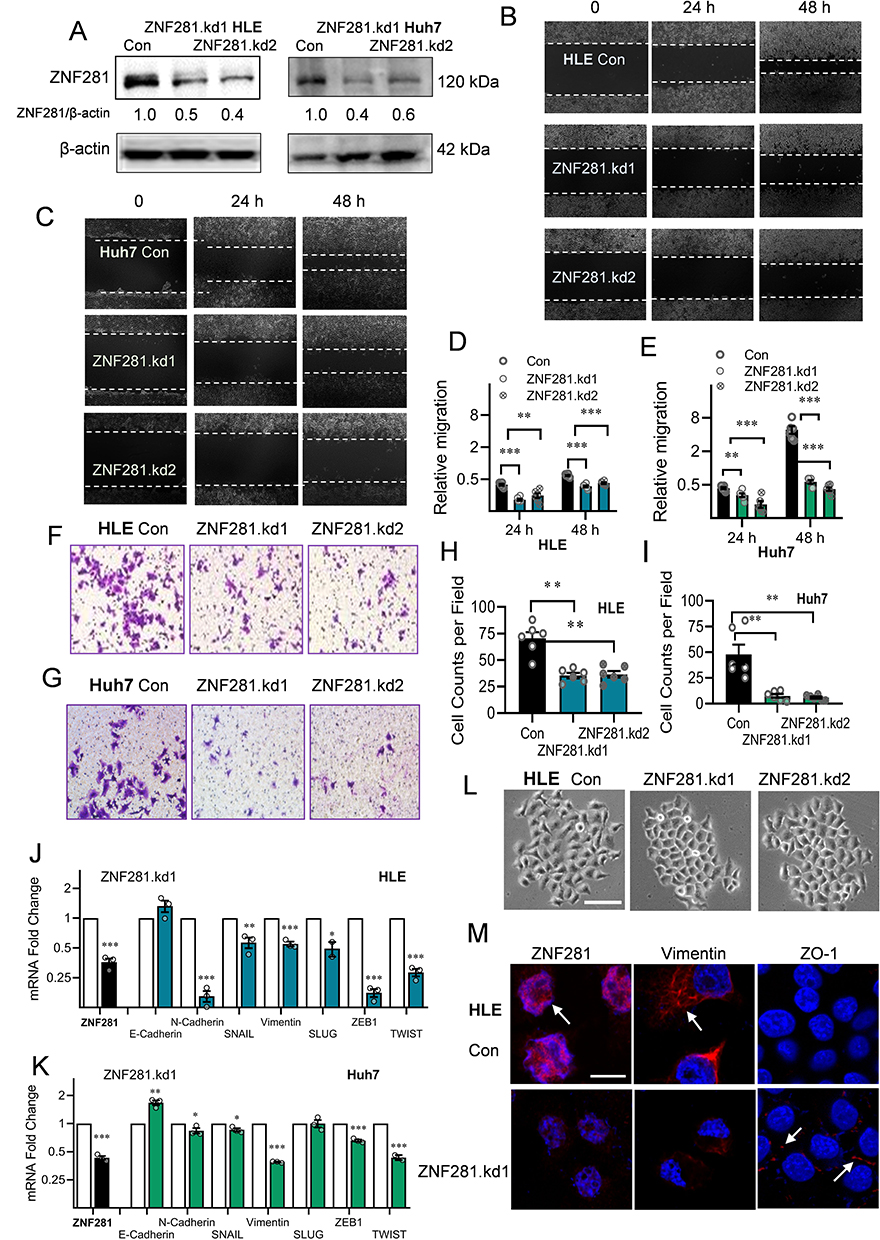 |
Figure 2 Knockdown of ZNF281 inhibited migration and invasion in HCC cells with retardation of EMT. (A) Western blot of ZNF281 in shRNA (ZNF281.kd1 or ZNF281.kd2) stably infected HLE or Huh7 cells. (B and C) Wound healing assays (10×) in ZNF281 knockdown HLE or Huh7 cells. (D and E) Quantification from (B) and (C) were shown in mean ± SEM (n=3; **p < 0.01, and ***p < 0.001). (F and G) Matrigel transwell assays (20×) in ZNF281 knockdown HLE and Huh7 stable cells. (H and I) Quantification (n=3; **p < 0.01) from (F and G). (J and K) The mRNA levels of EMT markers were determined by RT-qPCR (n=3; *p < 0.05, **p < 0.01 and ***p < 0.001). (L) Representative phase contrast (P/C) pictures of HLE cells transfected with shRNAs against ZNF281. Bar= 100 μm. (M) Immunofluorescence observed under confocal microscopy of mesenchymal marker Vimentin and epithelial marker ZO-1 in HLE cells following ZNF281 depletion with ZNF281.kd1. (bar=10 μm). |
We further detected the changes in mRNA expression of common EMT markers (Figure 2J and K) and observed significant alteration in the expression of most EMT associated molecules, especially reduced Vimentin, N-cadherin and up-regulation of E-cadherin. We noticed that EMT-TFs ZEB1, Snail, TWIST were all downregulated in both ZNF281 knockdown HLE and Huh7 cells. Furthermore, ZNF281 depletion resulted in significant morphological alteration of HLE cells, from mesenchymal spindle-like shape, to epithelial cuboid shape with obvious cell–cell adhesion (Figure 2L). Immunofluorescence showed that ZNF281 knockdown reduced the level mesenchymal marker Vimentin while increased the level of ZO-1, an epithelial marker (Figure 2M). These results suggested that ZNF281 was also a positive regulator of EMT in HCC, which was also verified by ZNF281 ovepression experiments in both HLE and Huh7 cells (Figure S1G and S1H).
ANXA10 Was a Repression Target of ZNF281 from RNA-Seq Screening
In searching for novel ZNF281 targets, RNA-seq was performed using the obtained stable cells of Con, ZNF281.kd1 and ZNF281.kd2 in HLE background. The criteria of log2 FC (fold change) >1.5 and q value <0.001 was set for calling differentially expressed genes (DEGs). To minimize the off-target effect of single shRNA, only DEGs that show consistent trend of alteration were selected. A list of 223 DEGs (140 down-regulated and 83 up-regulated) was finally identified (Supplementary Table 1 and Figure S2A and S2B). Bioinformatic analyses with Metascape25 indicated that down-regulated DEGs were involved in a list of biological processes, including the item “positive regulation of cell motility” consistent with impaired cell migration and invasion (Figure 3A). Several known positive regulators of EMT, such as SAA1, Cadherin 5 (CDH5) and FZD2 were among the down-regulated DEGs. On the other hand, up-regulated DEGs were enriched in GO items including “epithelial differentation”, “hepatocyte differentiation” etc, indicating a reversal of “dedifferentiation” nature of malignant cells, especially for HCC cells (Figure 3B). Known tumor suppressor genes (TSGs) in HCC, ANXA10 and PTPN11 were among the most up-regulated DEGs with ZNF281 knockdown, particularly ANXA10, which was top ranked in both ZNF281 knockdown cell lines (Figure 3C). The increment scale of ANXA10 prompted us to investigate the transcriptional regulation of ZNF281 on this gene, as the silencing mechanism for ANXA10 in HCC remains largely unknown. We verified the expression alteration of ANXA10 and several other DEGs by RT-qPCR in both HLE and Huh7 cells (Figure 3D and E), and ANXA10 was indeed one of the most upregulated transcripts upon ZNF281 knockdown. We also verified ANXA10 expression at the protein level in ZNF281 knockdown HLE cells with both Western blot and cellular immunofluorescence (Figure 3F and G). Meanwhile, immunofluorescence also indicated intense staining of ANXA10 in the nuclei as previously reported, especially upon ZNF281 depletion (Figure 3G).18
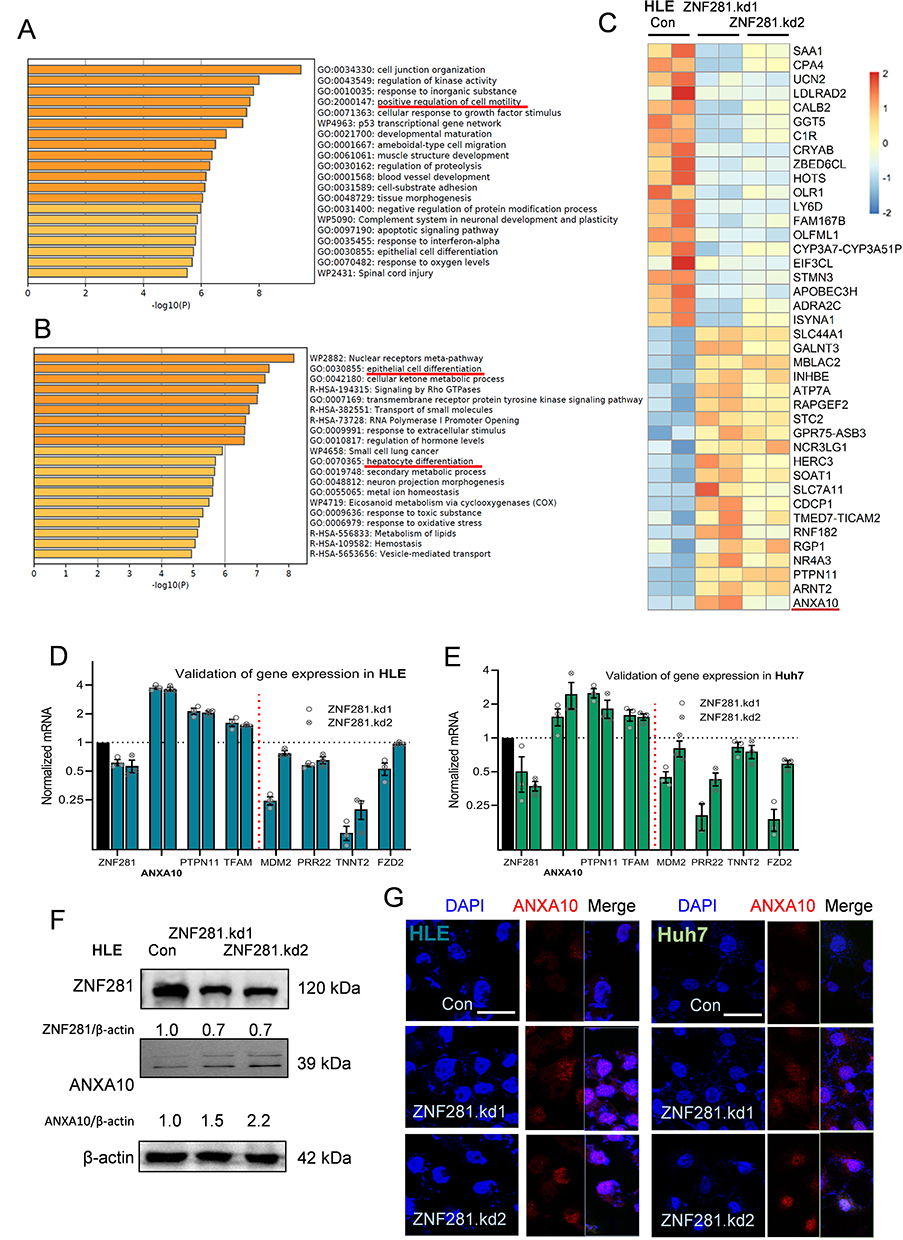 |
Figure 3 RNA-seq screening for potential targets of ZNF281 in HCC cells. (A and B) Bioinformatic analyses of down-regulated (B) or up-regulated (C) genes upon ZNF281 with Metascape online tools. (C) Identification of ANXA10 from the heatmap including top 40 DEGs. (D and E) Validation by RT-qPCR of selected DEGs in stable shZNF281 expressing HLE or Huh7 cells. (F) Western blotting confirmation of ZNF281 and ANXA10 expression in HLE cells with stable depletion of ZNF281. (G) Immunofluorescence for ZNF281 and ANXA10in HLE or Huh7 cells following ZNF281 depletion (bar=25 μm). |
ZNF281 Repressed Expression of ANXA10 Involving Recruitment of NuRD Complex
We next explored the mechanism that ZNF281 repressed the transcription of ANXA10. In silico analysis with JASPAR indicated two potential ZNF281 binding motif upstream the transcription start site (TSS) of ANXA10 (Figure 4A). Results from ChIP-qPCR showed that ZNF281 was enriched in the region surrounding the potential motif, which indicated direct regulation of ZNF281 on ANXA10 (Figure 4B and C). We next wonder if ZNF281 represses transcription of ANXA10 through recruiting epigenetic corepressor complexes. Known interacting partners of ZNF281 include components of NuRD complex like CHD4 (Mi-2β), HDAC1/2, etc. and components of Polycomb Repressive Complex 2 like EZH2, SUZ12 and EED.26 Co-immunoprecipitation experiments in HLE cells indicated that ZNF281 interacted with components of NuRD complex, including HDAC1, MTA1, MBD2/3, CHD4 and RbAp46/48 (Figure 4D). ZNF281 also showed much weaker interaction with MTA3 (Figure 4D), but not with PRC2 components (data not shown). Meanwhile, cellular immunofluorescence showed obvious co-localization of ZNF281 with HDAC1 and MTA1, representative components of NuRD, in both HLE and Huh7 cells (Figure 4E and F). We thus hypothesize that ZNF281 might transcriptionally repress ANXA10 through interaction with MTA1/HDAC1 NuRD complex in HCC. Supporting this hypothesis, knockdown of HDAC1 in HLE cells, and MTA1 in Huh7 cells showed robust increase of Annexin A10 protein (Figure 4G, H, and Figure S3A and 3B). At the mRNA level, ablation of HDAC1 not only up-regulated ANXA10, but also decreased ZNF281 and MTA1. Similarly, knockdown of MTA1 results in up-regulation of ANXA10 and decrement of ZNF281 and HDAC1 (Figure 4I and J), suggesting reciprocal regulations among those partners.
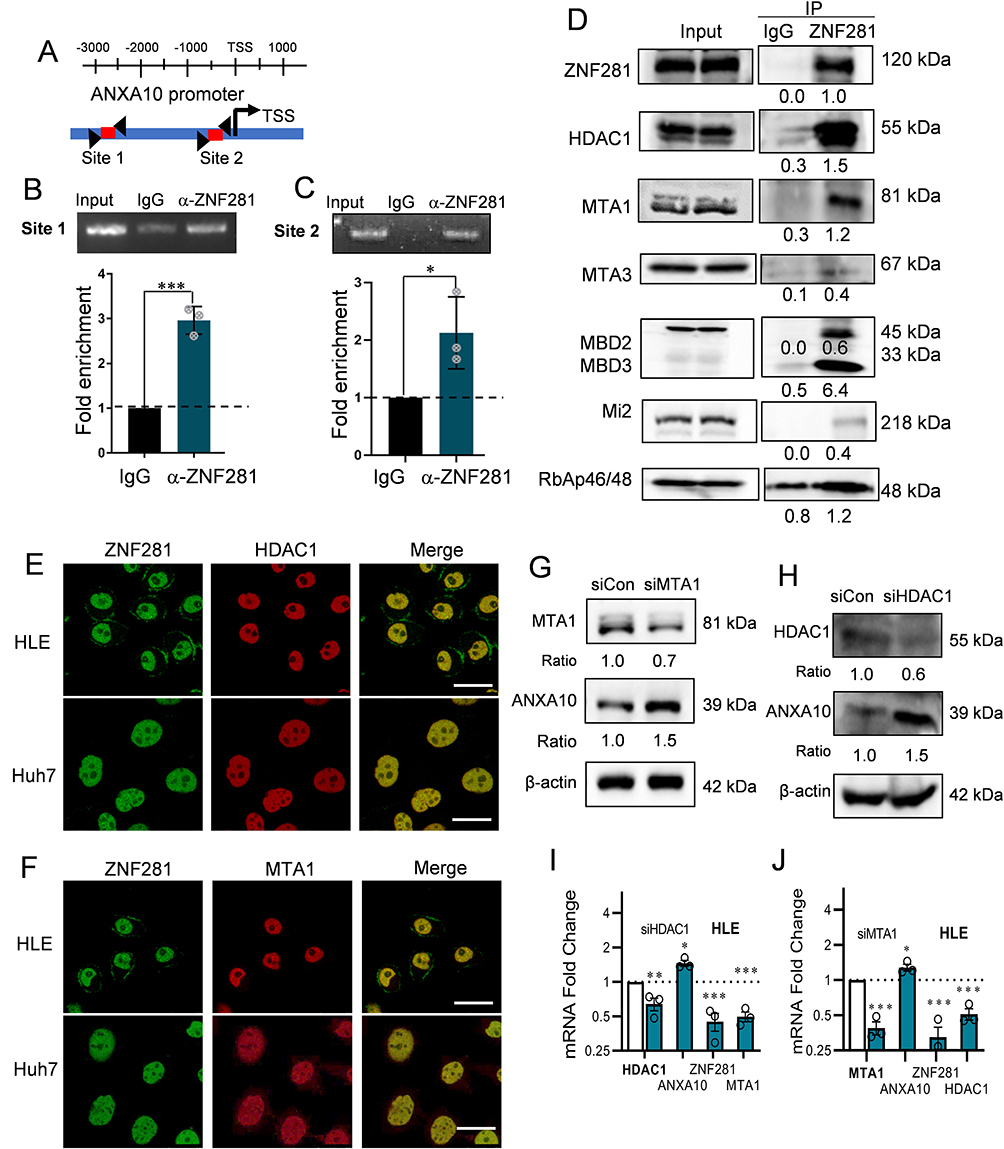 |
Figure 4 ZNF281 directly regulated ANXA10 transcription involving the recruitment of NuRD complex. (A) Illustration of ANXA10 promoter region containing implicated ZNF281 binding site for ChIP analyses. Primers for the target region are indicated by triangular arrows. Red line represents the PCR amplified product. (B and C) upper panels: ChIP assays followed with agarose electrophoresis to show specific binding of ZNF281 on ANXA10 promoter as indicated in (A). M: marker; lower panels: Quantitative ChIP-PCR demonstrating the enrichment of ZNF281 at ANXA10 promoter in Huh7 cells. *p < 0.05, ***p < 0.001. (D) Co-IP for the interaction of ZNF281 with indicated components of NuRD complex in HLE cells. (E and F) Immunofluorescence for colocalization of ZNF281 with HDAC1 (E) and MTA1 (F) in HCC cells. Bar=25μm. (G) Western blotting for ANXA10 following HDAC1 siRNA transfection in HLE cells. (H) Effect of MTA1 RNAi on ANXA10 at the protein level in Huh7 cells. (I and J) RT-qPCR analyses of ANXA10, ZNF281, HDAC1 and MTA1 in HDAC1 (I) or MTA1 (J) knockdown HLE cells (n=3; *p < 0.05, **p < 0.01 and ***p < 0.001). |
ANXA10 Antagonized ZNF281 Mediated Aggressiveness of HCC
We then asked whether upregulated ANXA10 was functional to the altered aggression in ZNF281 knockdown HCC cells. We transfected siRNAs against ANXA10 into ZNF281.kd1 HLE or Huh7 cells (Figure 5A). Remarkable recovery in cell migration was found from wound healing (Figure 5B and C with quantification in Figure 5D and E), as well as the invasion ability from matrigel transwell assays (Figure 5F and G). More importantly, ZNF281 depletion induced in prominent retardation pulmonary metastasis of HCC cells in mice, which was largely attenuated by co-knockdown of ANXA10 (Figure 5H-M). Thus, ANXA10 antagonized ZNF281 mediated migration, invasion and metastasis of HCC.
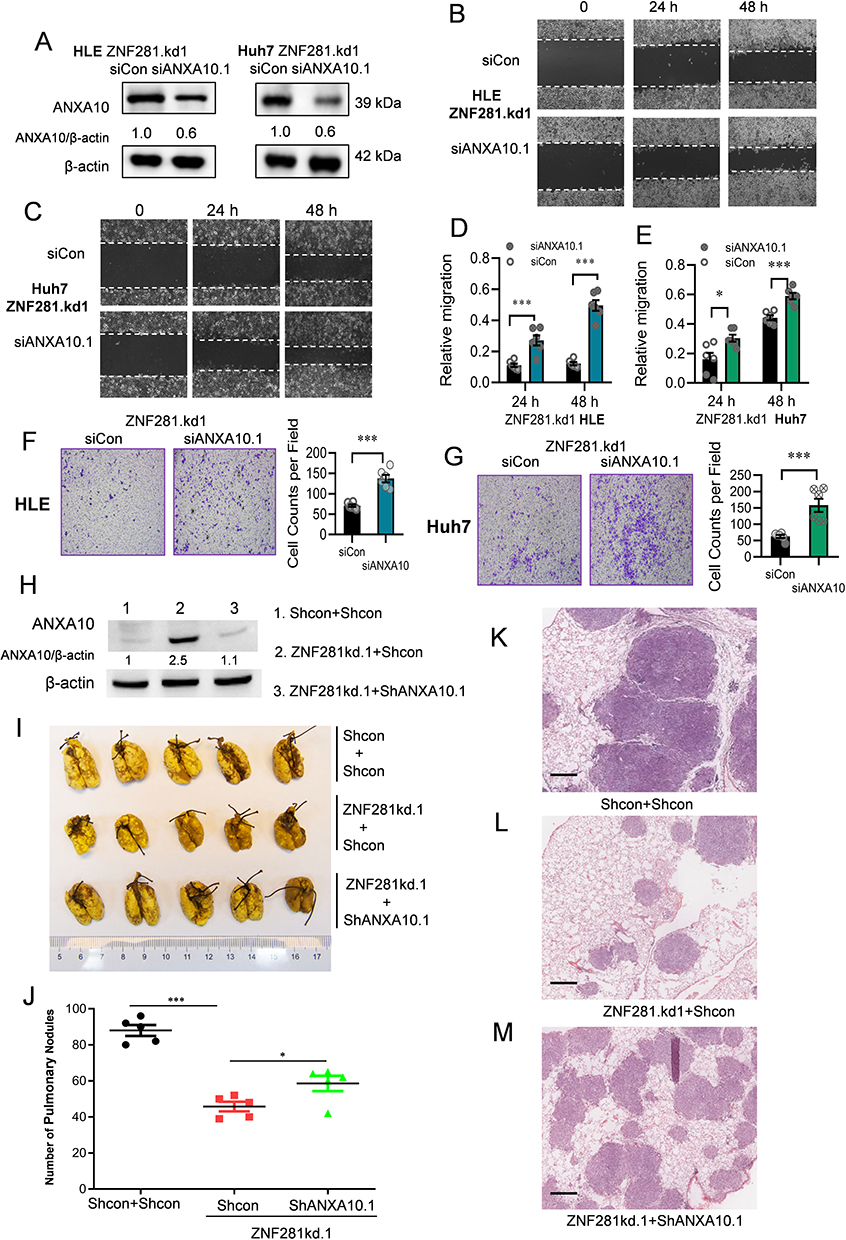 |
Figure 5 Knockdown of ANXA10 attenuated the effect of ZNF281 depletion on inhibiting migration, invasion and metastasis of HCC cells. (A) Western blot for ANXA10 expression upon ANXA10 depletion in ZNF281kd.1 HCC cells. (B and C) Wound healing assays (10×) in ZNF281kd.1 HLE or Huh7 cells subjected to ANXA10 siRNA. (D and E) Quantification of (B and C) as mean ± SEM (n=3; *p < 0.05, ***p < 0.001). (F and G) Matrigel transwell assays (4×) in ZNF281 knockdown HLE and Huh7 cells transfected with scramble control or ANXA10 siRNA. The quantification was shown in the right panel (n=3; ***p < 0.001). (H) Expression of ANXA10 in HLE cells with different shRNA transfection as indicated. (I) Resected lungs for indicated groups. Arrows indicated the pulmonary metastatic nodules with macroscopic observation. (J) Statistical analysis of the pulmonary nodules in different groups as indicated (*p < 0.05, ***p < 0.001). (K and M) Representative images of HE staining for the resected lungs. Scale bars: 500 μm. |
ANXA10 Sufficiently Suppressed Aggressiveness of HCC Cells
To better understand the function of ANXA10, we performed experiment with ANXA10 knockdown and overexpression in native HCC cells (Figure 6A). Knockdown of the low level ANXA10 in native HLE cells with two different siRNAs significantly increased cell migration and invasion of the cells (Figure 6B and F, with quantification in Figure 6D and H, respectively). Accordingly, epithelial marker E-cadherin was decreased, while mesenchymal markers N-cadherin and Vimentin were increased upon ANXA10 knockdown (Figure 6J). Overexpression of ANXA10 in native HLE cells showed opposite effects (Figure 6C and G with quantification in Figure 6E and I, respectively, and Figure 6K and L). Thus, ANXA10 functions as an important negative regulator of EMT in HCC. Of clinical importance, the mRNA level of ANXA10 was much lower in HCC tissues; with even lower in high tumor stages in the TCGA liver dataset analyzed with Gene Expression Profiling Interactive Analysis (GEPIA).27 Moreover, HCC patients with high ANXA10 showed better prognosis than those with low ANXA10 expression (Figure S4).
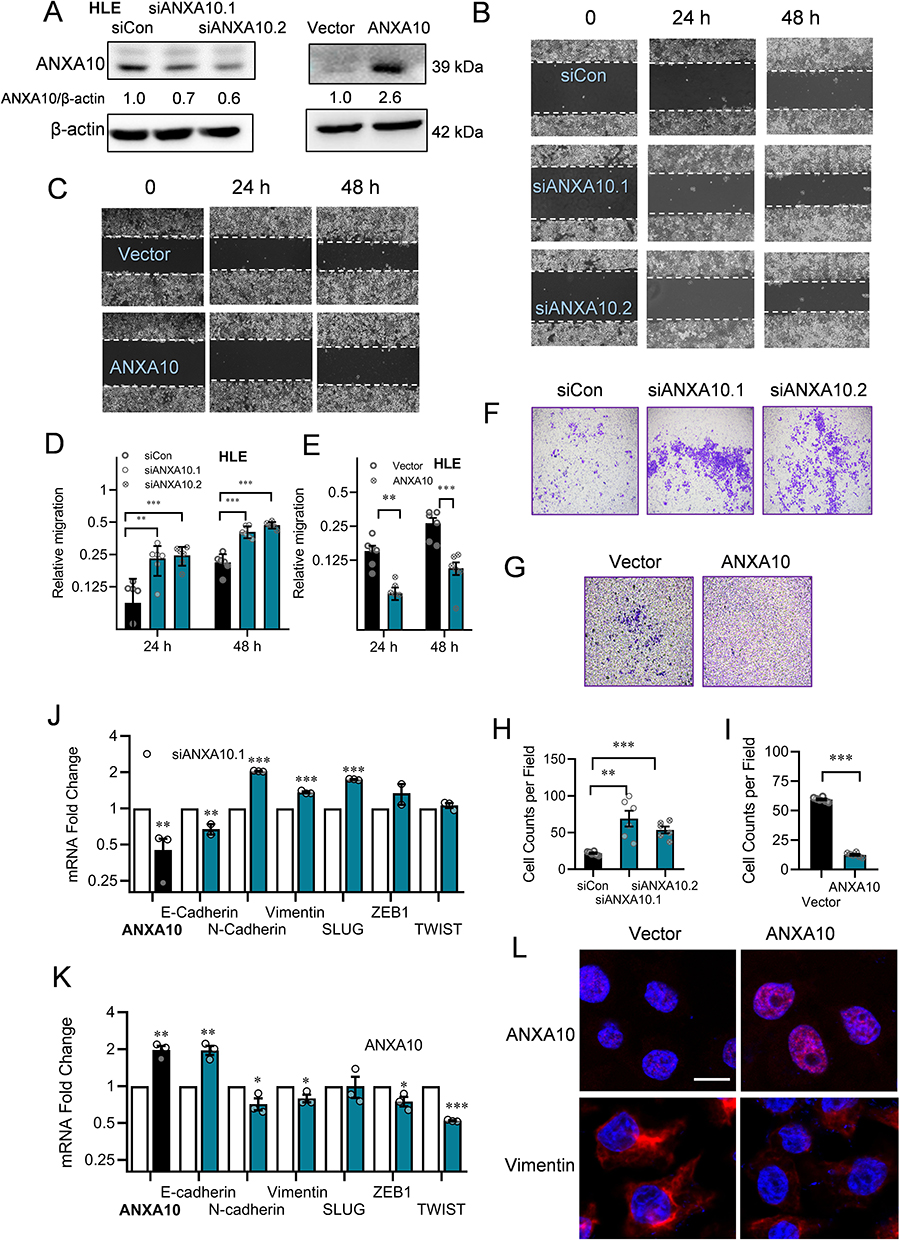 |
Figure 6 ANXA10 inhibited the migration and invasion with suppressed expression of EMT markers in HCC cells. (A) ANXA10 protein levels in HLE cells transfected with siRNAs against ANXA10 (siANXA10.1 and siANXA10.2) or ANXA10 overexpression plasmid. (B and C) Microscopic fields (10×) from wound healing assays in ANXA10 knockdown or ANXA10 overexpression HLE cells. (D and E) Quantification of (B and C) plotted as mean ± SEM (n=3; **p < 0.01 and ***p < 0.001). (F and G) Matrigel transwell assays (4×) in HLE cells with ANXA10 knockdown or overexpression. (H and I) Quantification of (F) and (G) (n=3; **p < 0.01, and ***p < 0.001). (J and K) Normalized mRNA levels of EMT markers in ANXA10 knockdown or overexpression HLE cells by RT-qPCR (n=3; *p < 0.05, **p < 0.01, and ***p < 0.001). (l) Immunofluorescence of Vimentin in HLE with ANXA10 overexpression (bar=10 μm). |
As ZNF281 was a positive EMT regulator (Figure 2) and ANXA10 negatively regulated EMT in HCC (Figures 5 and 6). We wonder if ANXA10 also regulated ZNF281. Intriguing results showed that knockdown of ANXA10 in HLE cells robustly increased expression ZNF281 at both the mRNA and protein level (Figure S5A and S5B). On the contrary, overexpression of ANXA10 significantly decreased ZNF281 at the transcription level (Figure S5C). More interestingly, besides ZNF281, knockdown of ANXA10 in HLE cells also further increased the level of HDAC1and MTA1, while overexpression of ANXA10 inhibited their expression (Figure S5A and S5C). These results suggested the existence of a reciprocal negative regulation loop between ZNF281/NuRD and ANXA10, which needs further investigation.
Expression of ZNF281/MTA1/NuRD Negatively Correlates with That of ANXA10 in HCC Tissues
We hypothesized that the expression of ZNF281 may negatively correlate with that of ANAXA10. With the online tool GEPIA, we first analyzed the expression correlation at the mRNA level between ZNF281 and ANXA10 in the TCGA liver cancer dataset. Unfortunately, they did not exhibit obvious negative correlation (data not shown). However, ZNF281 showed strong positive correlation of mRNA expression with that of the MTA1/NuRD gene signature that includes MTA1, HDAC1, CHD4, MBD2, MBD3 and HDAC2 (Figure 7A and B), supporting complex formation between ZNF281 and MTA1/NuRD as described in Figure 4. ZNF281 was thus taken into this gene set to form a new signature of ZNF281/MTA1/NuRD, and ANXA10 showed negative correlation with this new signature on mRNA expression (Figure 7C and D), suggesting negative regulation between ZNF281/MTA1/NuRD and ANXA10. Interestingly, higher expression of ZNF281/MTA1/NuRD signature predicted poorer overall survival of HCC patients in the TCGA liver cancer dataset (Figure 7E), in contrary to that of ANXA10 (Figure S4), indicating clinical importance of these genes.
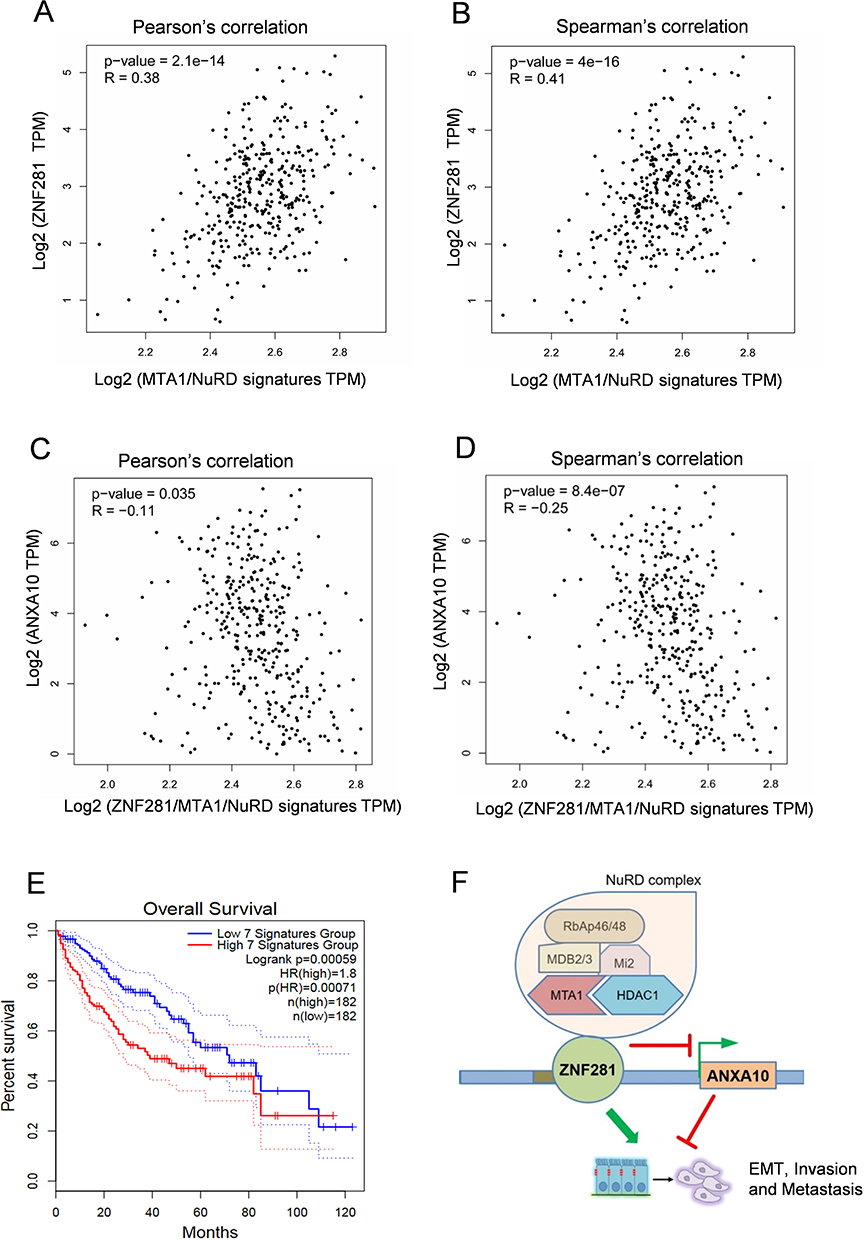 |
Figure 7 Expression of ANXA10 showed negative correlation with that of ZNF281/MTA1/NuRD complex. (A and B) Correlation of mRNA expression between ZNF281 and MTA1/NuRD signature that includes MTA1, HDAC1, CHD4, MBD2, MBD3 and HDAC2 in TCGA liver cancer database. (C and D) Correlation of mRNA expression between ANXA10 with ZNF281/MTA1/NuRD signature that includes ZNF281, MTA1, HDAC1, CHD4, MBD2, MBD3 and HDAC2 in TCGA liver cancer database. (E) Overall survival analysis with high and low expression of ZNF281/MTA1/NuRD signature in the TCGA liver cancer database. The 7 signatures mean the ZNF281/MTA1/NuRD signature mentioned above. (F) Proposed model demonstrating the regulation of ZNF281/MTA1/NuRD complex and ANXA10 on aggressiveness in HCC. |
In addition, of the 25 HCC cell lines recorded in the CCLE (Broad Institute Cancer Cell Line Encyclopedia) dataset, 16 lines showed high levels for ZNF281, but low levels of ANXA10, including Huh7, HLE and HepG2 we used, also supporting negative regulation between them (Figure S6).
Discussion
In the present study, we explored the role of ZNF281 for the aggressiveness in HCC. We discovered an important TSG, ANXA10, was repressed by ZNF281 for its transcription, which involves recruitment of NuRD repressor complex (Figure 7F). Knockdown of either ZNF281 or NuRD complex components resulted in release ANXA10 from repression and suppress EMT associated migration, invasion and metastasis of HCC cells. Together with the importance of ANXA10 in HCC suppression,21 our study not only revealed the function of ZNF281 on HCC aggression, identified a novel target, but also uncovered a new silencing mechanism for ANXA10 in the progression of HCC.
ZNF281 has been demonstrated to promote EMT via transcriptional regulation of different sets of targets. One typical set was EMT markers and EMT-TFs.14 ZNF281 enhanced the expression of Snail while repressed the expression of epithelial markers CDH1and OCLN.14 Other ZNF281 targets included key molecules of EMT-related signaling. For example, ZNF281 transcriptionally repressed Axin2, a negative regulator of Wnt/β-catenin, resulting in augmentation of Wnt/β-catenin signaling and promotion of EMT.14,16 In our study, ANXA10 was identified as a potent EMT negative regulator, like Axin2, which could be repressed by ZNF281. However, the downstream of ANXA10 was barely understood. A report indicated that ANXA10 co-localized with SFPQ and PSPC1 at paraspeckles inside the nuclei of HeLa cells and inhibited their expression.19 Meanwhile, PSPC1 was recently found to mediate TGF-β autocrine signaling and Smad2/3 target switching to promote EMT and metastasis.28 Together with our results, it is plausible that ANXA10 potently interfere with TGF-β signaling through inhibition of PSPC1 to retard EMT and metastasis in HCC. A regulatory loop of ZNF281-ANXA10-TGFβ may exist, the dysfunction of which potentiates EMT, invasion and metastasis in HCC.
Negative regulators of EMT often exert their functions through modulating EMT-TFs: TP53 was found to inhibit ZEB1 and ZEB2 in HCC cells through miR-200 and miR-192;7 ARID2 repressed EMT of HCC cells by inhibiting Snail.8 Interestingly, our results not only identified ANXA10 as a novel repression target of ZNF281 during EMT of HCC cells, but also suggested negative regulation of ANXA10 on EMT positive regulators, including ZNF281 itself (Figure S5), thus forming a feedback loop. Similar reciprocal negative regulation was reported earlier where GATA3 (tumor suppressor gene) and ZEB2 (EMT-TF) were mutually suppressed by recruiting differential corepressor complexes to drive the metastasis of breast cancer.29 The reciprocal feedback regulation among those EMT regulators might help to maintain the stable transition between epithelial and mesenchymal phenotype in a progressive long period of time.
A panel of other potential targets of ZNF281 was also discovered in HCC cells. In the down-regulated genes, some are closely related to cancer EMT and metastasis, including FZD2, SAA1, S100A, CDH5, MMP24, etc. (Supplementary Table 1). FZD2, together with its ligand Wnt5a/b, elicits a non-canonical pathway that includes Fyn and STAT3 to drive EMT and metastasis in HCC;30 serum amyloid A1 (SAA1) was able to enhance lymphatic invasion of breast cancer, but its role in HCC remains elusive.31 In up-regulated genes, PTPN11 was another interesting candidate that has been shown to play controversial roles in HCC. It inhibited tumor initiation, but promote liver cancer stem cell expansion in established tumors by augmenting β-catenin signaling.32,33 Meanwhile, indifferent from other cancer types, our results indicated that ZNF281 was also able to drive cell cycle progression and clone formation of HCC cells. Consistently, several genes implicated in cell cycle progression, like CDK1A (p21) and MDM2 were also dysregulated upon ZNF281 knockdown as evidenced by RNA-seq (Supplementary Table 1), all these results suggested the involvement of ZNF281 in cancer cell proliferation that is worth further investigation.
ZNF281 could complex with NuRD to mediate Nanog auto-repression and inhibit somatic cell reprogramming,11 and to suppress gene expression of inflammatory signaling to promote cardiac reprogramming of fibroblasts.34 NuRD complex is comprised of multiple components, including Mi2 (α/β), HDACs (1 and 2), RbAp46 and/or RbAp48, MBD2/3 and one of the metastasis-associated (MTA) family members, MTA1, MTA2 or MTA3.35 Mi2 possessed ATPase activity and HDACs harbor histone deacetylase activity, which contribute to generation of densely packed, hypoacetylated nucleosomes for gene silencing. Each MTA member defines the functional specificity of the NuRD complexes. MTA1 was expressed at high levels in metastatic cancer cells and its ectopic expression induced mammary tumorigenesis.36 In contrast, MTA3 represses the transcription of invasion associated genes such as Snail.37 Our data suggested that ZNF281 mainly recruited MTA1 but not MTA3 containing NuRD complex to the ANXA10 promoter for gene repression. The findings were correlated with the high expression of MTA1 as an aggressive feature of HCC.38 Our results also hold therapeutic implications that blockade of the enzymatic component of NuRD complex seems more rational when the level of ZNF281 was taken into consideration.
Discrepancy still exists in the expression correlation analyses. ZNF281 did not show prominent negative correlation with ANXA10 in the TCGA liver cancer dataset, while showing an overt positive correlation with NuRD components. The discrepancy may be explained as the following: (1) the stability or post-translational modification of ZNF281 protein might affect the correlation at the mRNA level. We notice that although the mRNA expression of ZNF281 was up-regulated in a panel of cancer datasets, the fold change was not as high as that of ANXA10, which showed robust down-regulation in most datasets. Thus, the correlation between ZNF281 protein and ANXA10 mRNA or the protein versus protein correlation may be a better choice; (2) other transcription factors might participate in the recruitment of NuRD complex and repression of ANXA10 cooperatively with ZNF281. Transcription factors that have been reported or implicated to interact with ZNF281 include c-myc,12 GATA434 and glucocorticoid receptor (GR);39 further experiments are needed to address these issues.
Conclusions
ZNF281 drives EMT associated invasion and metastasis of HCC partially through transcriptional repression of tumor suppressor gene ANXA10 by recruiting NuRD complex.
Abbreviations
HCC, hepatocellular carcinoma; ZNF281, zinc finger protein 281; EMT, epithelial to mesenchymal transition; NuRD, nucleosome remodeling and deacetylation; Co-IP, co-immunoprecipitation; ChIP, chromatin immunoprecipitation; RNA-seq, RNA-sequencing; TSG, tumor suppressor gene; EMT-TF, EMT-related transcription factors; ANXA10, Annexin A10; RT-qPCR, Reverse transcription and Quantitative real-time PCR; DEGs, differentially expressed genes.
Data Sharing Statement
The data supporting the findings and conclusion of the study are included in this manuscript, and raw data are available upon request from the corresponding author.
Author Contributions
All authors made a significant contribution to the work reported, whether that is in the conception, study design, execution, acquisition of data, analysis and interpretation, or in all these areas; took part in drafting, revising or critically reviewing the article; gave final approval of the version to be published; have agreed on the journal to which the article has been submitted; and agree to be accountable for all aspects of the work.
Funding
This work was supported by the National Natural Science Foundation of China (the SINO-GERMAN MOBILITY PROGRAMM, M-0200 to Shanshan Wang and No.82071235 to Shan Cheng, respectively), Beijing Natural Science Foundation Program and Scientific Research Key Program of Beijing Municipal Commission of Education (KZ202010025047 to Qiang Su), Beijing Natural Science Foundation Program (7222001, to Wei Ding), the Cultivation Program of Scientific Research of Capital Medical University (PYZ20066 to Chenguang Zhang) and the Beijing Hospitals Authority Youth Programme (QML20211701 to Shanshan Wang).
Disclosure
The authors declared no competing interests in this work.
References
1. Ferlay J, Soerjomataram I, Dikshit R, et al. Cancer incidence and mortality worldwide: sources, methods and major patterns in GLOBOCAN 2012. Int J Cancer. 2015;136:E359–86.
2. Cancer Genome Atlas Research Network. Electronic address wbe, Cancer Genome Atlas Research N: comprehensive and integrative genomic characterization of hepatocellular carcinoma. Cell. 2017;169:1327–41e23.
3. Forner A, Reig M, Bruix J. Hepatocellular carcinoma. Lancet. 2018;391:1301–1314.
4. Roessler S, Jia HL, Budhu A, et al. A unique metastasis gene signature enables prediction of tumor relapse in early-stage hepatocellular carcinoma patients. Cancer Res. 2010;70:10202–10212.
5. Giannelli G, Koudelkova P, Dituri F, Mikulits W. Role of epithelial to mesenchymal transition in hepatocellular carcinoma. J Hepatol. 2016;65:798–808.
6. Lamouille S, Xu J, Derynck R. Molecular mechanisms of epithelial-mesenchymal transition. Nat Rev Mol Cell Biol. 2014;15:178–196.
7. Kim T, Veronese A, Pichiorri F, et al. p53 regulates epithelial-mesenchymal transition through microRNAs targeting ZEB1 and ZEB2. J Exp Med. 2011;208:875–883.
8. Jiang H, Cao HJ, Ma N, et al. Chromatin remodeling factor ARID2 suppresses hepatocellular carcinoma metastasis via DNMT1-Snail axis. Proc Natl Acad Sci U S A. 2020;117:4770–4780.
9. Lisowsky T, Polosa PL, Sagliano A, Roberti M, Gadaleta MN, Cantatore P. Identification of human GC-box-binding zinc finger protein, a new Kruppel-like zinc finger protein, by the yeast one-hybrid screening with a GC-rich target sequence. FEBS Lett. 1999;453:369–374.
10. Wang ZX, Teh CH, Chan CM, et al. The transcription factor Zfp281 controls embryonic stem cell pluripotency by direct activation and repression of target genes. Stem Cells. 2008;26:2791–2799.
11. Fidalgo M, Faiola F, Pereira CF, et al. Zfp281 mediates Nanog autorepression through recruitment of the NuRD complex and inhibits somatic cell reprogramming. Proc Natl Acad Sci U S A. 2012;109:16202–16207.
12. Luo Z, Liu X, Xie H, Wang Y, Lin C. ZFP281 recruits MYC to active promoters in regulating transcriptional initiation and elongation. Mol Cell Biol. 2019;34:39.
13. Ji W, Mu Q, Liu XY, Cao XC, Yu Y. ZNF281-miR-543 feedback loop regulates transforming growth factor-beta-induced breast cancer metastasis. Mol Ther Nucleic Acids. 2020;21:98–107.
14. Hahn S, Jackstadt R, Siemens H, Hunten S, Hermeking H. SNAIL and miR-34a feed-forward regulation of ZNF281/ZBP99 promotes epithelial-mesenchymal transition. EMBO J. 2013;32:3079–3095.
15. Pieraccioli M, Nicolai S, Pitolli C, et al. ZNF281 inhibits neuronal differentiation and is a prognostic marker for neuroblastoma. Proc Natl Acad Sci U S A. 2018;115:7356–7361.
16. Qian Y, Li J, Xia S. ZNF281 promotes growth and invasion of pancreatic cancer cells by activating Wnt/beta-catenin signaling. Dig Dis Sci. 2017;62:2011–2020.
17. Gerke V, Creutz CE, Moss SE. Annexins: linking Ca2+ signalling to membrane dynamics. Nat Rev Mol Cell Biol. 2005;6:449–461.
18. Quiskamp N, Poeter M, Raabe CA, et al. The tumor suppressor annexin A10 is a novel component of nuclear paraspeckles. Cell Mol Life Sci. 2014;71:311–329.
19. Liu SH, Lin CY, Peng SY, et al. Down-regulation of annexin A10 in hepatocellular carcinoma is associated with vascular invasion, early recurrence, and poor prognosis in synergy with p53 mutation. Am J Pathol. 2002;160:1831–1837.
20. Munksgaard PP, Mansilla F, Brems Eskildsen AS, et al. Low ANXA10 expression is associated with disease aggressiveness in bladder cancer. Br J Cancer. 2011;105:1379–1387.
21. Kim J, Kim MA, Jee CD, Jung EJ, Kim WH. Reduced expression and homozygous deletion of annexin A10 in gastric carcinoma. Int j Cancer. 2009;125:1842–1850.
22. Allain C, Angenard G, Clement B, Coulouarn C. Integrative genomic analysis identifies the core transcriptional hallmarks of human hepatocellular carcinoma. Cancer Res. 2016;76:6374–6381.
23. Peng JM, Bera R, Chiou CY, et al. Actin cytoskeleton remodeling drives epithelial-mesenchymal transition for hepatoma invasion and metastasis in mice. Hepatology. 2018;67:2226–2243.
24. Nwosu ZC, Battello N, Rothley M, et al. Liver cancer cell lines distinctly mimic the metabolic gene expression pattern of the corresponding human tumours. J Exp Clin Cancer Res. 2018;37:211.
25. Zhou Y, Zhou B, Pache L, et al. Metascape provides a biologist-oriented resource for the analysis of systems-level datasets. Nat Commun. 2019;10:1523.
26. Huang X, Balmer S, Yang F, et al. Zfp281 is essential for mouse epiblast maturation through transcriptional and epigenetic control of Nodal signaling. eLife. 2017;6:556.
27. Tang Z, Li C, Kang B, Gao G, Li C, Zhang Z. GEPIA: a web server for cancer and normal gene expression profiling and interactive analyses. Nucleic Acids Res. 2017;45:W98–W102.
28. Yeh HW, Hsu EC, Lee SS, et al. PSPC1 mediates TGF-beta1 autocrine signalling and Smad2/3 target switching to promote EMT, stemness and metastasis. Nat Cell Biol. 2018;20:479–491.
29. Si W, Huang W, Zheng Y, et al. Dysfunction of the reciprocal feedback loop between GATA3- and ZEB2-nucleated repression programs contributes to breast cancer metastasis. Cancer Cell. 2015;27:822–836.
30. Gujral TS, Chan M, Peshkin L, Sorger PK, Kirschner MW, MacBeath G. A noncanonical Frizzled2 pathway regulates epithelial-mesenchymal transition and metastasis. Cell. 2014;159:844–856.
31. Chen JY, Lai YS, Chu PY, Chan SH, Wang LH, Hung WC. Cancer-derived VEGF-C increases chemokine production in lymphatic endothelial cells to promote CXCR2-dependent cancer invasion and MDSC recruitment. Cancers. 2019;11:68.
32. Han T, Xiang DM, Sun W, et al. PTPN11/Shp2 overexpression enhances liver cancer progression and predicts poor prognosis of patients. J Hepatol. 2015;63:651–660.
33. Bard-Chapeau EA, Li S, Ding J, et al. Ptpn11/Shp2 acts as a tumor suppressor in hepatocellular carcinogenesis. Cancer Cell. 2011;19:629–639.
34. Zhou H, Morales MG, Hashimoto H, et al. ZNF281 enhances cardiac reprogramming by modulating cardiac and inflammatory gene expression. Genes Dev. 2017;31:1770–1783.
35. Denslow SA, Wade PA. The human Mi-2/NuRD complex and gene regulation. Oncogene. 2007;26:5433–5438.
36. Toh Y, Nicolson GL. The role of the MTA family and their encoded proteins in human cancers: molecular functions and clinical implications. Clin Exp Metastasis. 2009;26:215–227.
37. Fujita N, Jaye DL, Kajita M, Geigerman C, Moreno CS, Wade PA. MTA3, a Mi-2/NuRD complex subunit, regulates an invasive growth pathway in breast cancer. Cell. 2003;113:207–219.
38. Li YT, Wu HL, Kao JH, et al. Expression of metastatic tumor antigen 1 splice variant correlates with early recurrence and aggressive features of hepatitis B virus-associated hepatocellular carcinoma. Hepatology. 2019;70:184–197.
39. Polman JA, Welten JE, Bosch DS, et al. A genome-wide signature of glucocorticoid receptor binding in neuronal PC12 cells. BMC Neurosci. 2012;13:118.
 © 2023 The Author(s). This work is published and licensed by Dove Medical Press Limited. The full terms of this license are available at https://www.dovepress.com/terms.php and incorporate the Creative Commons Attribution - Non Commercial (unported, v3.0) License.
By accessing the work you hereby accept the Terms. Non-commercial uses of the work are permitted without any further permission from Dove Medical Press Limited, provided the work is properly attributed. For permission for commercial use of this work, please see paragraphs 4.2 and 5 of our Terms.
© 2023 The Author(s). This work is published and licensed by Dove Medical Press Limited. The full terms of this license are available at https://www.dovepress.com/terms.php and incorporate the Creative Commons Attribution - Non Commercial (unported, v3.0) License.
By accessing the work you hereby accept the Terms. Non-commercial uses of the work are permitted without any further permission from Dove Medical Press Limited, provided the work is properly attributed. For permission for commercial use of this work, please see paragraphs 4.2 and 5 of our Terms.