")
Back to Journals » Cancer Management and Research » Volume 10
Inhibiting GIT1 reduces the growth, invasion, and angiogenesis of osteosarcoma
Authors Zhang Z, Hu P, Xiong J, Wang S
Received 22 July 2018
Accepted for publication 21 October 2018
Published 29 November 2018 Volume 2018:10 Pages 6445—6455
DOI https://doi.org/10.2147/CMAR.S181066
Checked for plagiarism Yes
Review by Single anonymous peer review
Peer reviewer comments 2
Editor who approved publication: Dr Rituraj Purohit
Zitao Zhang,1 Polu Hu,2 Jin Xiong,1 Shoufeng Wang1
1Department of Orthopedics, The Affiliated Drum Tower Hospital of Nanjing University Medical School, Nanjing 210008, China; 2Nanjing Red Cross Blood Center, Nanjing 210003, China
Background: GIT1, a scaffold protein with ubiquitous multi-domain, is involved in many cellular processes. In recent years, it was proved that GIT1 participated in various tumors’ growth or metastasis. However, the biological function of GIT1 in osteosarcoma is still unclear. In this study, we aimed to investigate the role and mechanism of GIT1 in osteosarcoma.
Materials and methods: Human osteosarcoma tissues were obtained to investigate the distribution of GIT1. Adequate osteosarcoma cells were stably infected with lentivirus to knockdown GIT1 level and then was used to carry out cell invasion and vascular endothelial growth factor (VEGF) assay in vitro. Orthotopic femoral osteosarcoma model was constructed to investigate the growth, invasion, and angiogenesis in vivo. Western blot was used to detect extracellular signal-regulated kinase (ERK1/2) activation and hypoxia-inducible factor-1 (HIF-1α) expression.
Results: In this study, we found that GIT1 was distributed in human osteosarcoma tissues and highly expressed in osteosarcoma (OS) cells. Knockdown of GIT1 inhibited cell invasion and VEGF release in vitro and suppressed tumor growth, invasion, and angiogenesis in vivo. Furthermore, knockdown of GIT1 substantially downregulated the protein levels of p-ERK and HIF-1α in OST cells and inhibition of p-ERK by PD98059 could significantly decrease the expression of HIF-1α and concentration of VEGF in GIT1-shRNA-treated cells.
Conclusion: GIT1 knockdown can effectively inhibit the growth, invasion, and angiogenesis of osteosarcoma. Thus, GIT1 might act as an oncogenic factor in osteosarcoma and could be a potential molecular target for osteosarcoma gene therapy.
Keywords: GIT1, osteosarcoma, angiogenesis, orthotopic femoral osteosarcoma model, ERK1/2, HIF-1α
Introduction
Osteosarcoma (OS), also known as osteogenic sarcoma, is the most common primary malignancy of bone in children and adolescents.1 Globally, the incidence rate of OS in those younger than 20 years is estimated to be 4 million/year.2 Although an average 5-year survival rate has been greatly improved to ~80% after adjuvant and neoadjuvant chemotherapy, which was introduced from 1980s, most of osteosarcoma patients die of metastasis or local recurrence eventually.3 It is generally acknowledged that numerous genes and corresponding pathways are associated with the pathogenesis and clinical progression of osteosarcoma. Therefore, exploring the molecular mechanisms as new therapy targets and approaches for osteosarcoma is important and urgent.
GIT1 is a scaffold protein with several functional domains. It has been investigated that GIT1 participates in synapse formation and function, cell motility, angiogenesis, and so on.4–7 Especially in the skeletal system, GIT1 is widely expression in osteoblasts and chondrocytes and regulates their proliferation, apoptosis, and migration.8–10 Recently, the function of GIT1 has been reported in various tumors including breast cancer, lung cancer, and hepatocellular carcinoma.11–13 However, until now, there is no relevant study of GIT1 in osteosarcoma. Therefore, we investigated the role of GIT1 in osteosarcoma and the underlying mechanisms. We found that GIT1 was differently distributed in human OS tissues and knockdown of GIT1 inhibited osteosarcoma cell invasion and vascular endothelial growth factor (VEGF) release in vitro. Tumor growth, invasion, and angiogenesis could also be suppressed in GIT1-shRNA-treated mice. GIT1 might participate in VEGF release by ERK1/2/HIF-1α signaling pathway. Thus, our results indicated that GIT1 might represent a new potential therapeutic target for the treatment of osteosarcoma.
Materials and methods
Human tissues and immunohistochemistry
The collection of clinical specimens and all protocols or experiments was undertaken with the written informed consent of patients and approval for experiments from the ethics committee of the Affiliated Drum Tower Hospital, Nanjing University Medical School. Our studies were conducted in compliance with the Declaration of Helsinki.
From January 1, 2017, to December 31, 2017, a total of 18 new OS patients were admitted to our department. Needle biopsy was carried out to obtain osteosarcoma tissues before any treatments. Considering the subsequent resection, the approach for biopsy was defined by Jin Xiong, a senior expert with 20 years of clinical experience in bone and soft tissue tumors. The biopsy site was sterilized and anesthetized, and then, the percutaneous biopsy was radiologically guided by either X-ray or computed tomography and was carried out using a 14-gage core needle by Shoufeng Wang, a senior expert with 10 years of clinical experience in bone and soft tissue tumors. Three to five passes were taken to obtain multiple samples throughout the tumor without breaking the far wall. The obtained tissue was stored on ice and immediately transferred to our pathological institute for further analysis. A total of 14 patients agreed to participate in this study, among which three had lung metastasis, two had pathological fractures, and three patients’ pathological diagnosis was not typical. Eventually, only six cases of confirmed conventional high-grade OS were selected with an age range from 12 to 56 years. Briefly, according to Graziano et al,14 immunohistochemistry using the standard streptavidin–biotin labeling technique was carried out as follows. Sections derived from paraffin-embedded specimens were deparaffinized in xylene for 15 minutes, rehydrated, and treated with 3% H2O2 for 10 minutes. Deparaffinized sections were incubated with anti-GIT1 antibodies (Abcam, Cambridge, MA, USA). All sections were pretreated with citrate buffer (pH 6.0) and exposed to radiation in a microwave oven. Then, 10 mg/mL of ovalbumin in PBS was used to reduce the commonly seen nonspecific immunoreactivity, followed by 0.2% biotin in PBS, each for 15 minutes at room temperature. Bound antibody was revealed by incubation with 3,3′-diaminobenzidine (DAB; Sigma-Aldrich Co., St Louis, MO, USA) in 0.01% H2O2 for 15 minutes at room temperature. Sections were then counterstained with hematoxylin, dehydrated, and mounted.
Cell culture
Three kinds of human OS cell lines (HOS, 143B, and OST cells) were obtained from American Type Culture Collection (ATCC; Manassas, VA, USA). All the cell lines were grown in Roswell Park Memorial Institute (RPMI)-1640 medium (Thermo Fisher Scientific, Waltham, MA, USA) with 10% FBS (Thermo Fisher Scientific) and 100 U/mL antibiotic (penicillin/streptomycin; Thermo Fisher Scientific) in a humidified 37°C incubator with 5% CO2. For hypoxic treatment, cells were cultured in a modular incubator chamber that was infused with 2% O2, 5% CO2, and 93% N2 for 12 hours.15
Reverse transcription and real-time PCR
Total RNA was extracted using TRIzol Reagent (Thermo Fisher Scientific) according to the manufacturer`s instructions. One microgram of total RNA was reverse transcribed using cDNA synthesis kit (Thermo Fisher Scientific). The quantitative real-time PCR (qPCR) was performed using a standard SYBR Green PCR Kit (Thermo Fisher Scientific) protocol on ABI 7300 (Thermo Fisher Scientific) thermal cycler. GAPDH was served as an internal control. The primers used are list as follows: GIT1 (forward [F]: 5′-AGGACGACG CCATCTATTCA-3′; reverse [R]: 5′-CCCACTTTGCGTGTTCTCAT-3′) and GAPDH (F: 5′-CACCCACTCC TCCACCTTTG-3′; R: 5′-CCACCACCCTGTTGCTGTAG-3′). The qPCR was repeated three times, and data were analyzed by the 2-ΔΔCt method.
Western blot
Osteosarcoma tissues or cells were homogenized and lysed with RIPA lysis buffer. Cell lysis was centrifuged at 13,000 rpm for 10 minutes at 4°C. The protein concentration was then determined using the Bradford method. A total of 30 µg of protein was separated by SDS-PAGE and transferred onto polyvinylidene difluoride membranes (EMD Millipore, Billerica, MA, USA). The blots were blocked with 5% BSA, followed by incubation with antibodies against ERK1/2, p-ERK1/2, HIF-1α, GIT1, and GAPDH (Cell Signaling Technology, Danvers, MA, USA) overnight at 4°C. Subsequently, the membrane was incubated with horseradish peroxidase-conjugated secondary antibody (Cell Signaling Technology). The target protein was visualized by enhanced chemiluminescence (Pierce, Rockford, IL, USA). PD98059 (25 µM; Abcam) was added to the medium 30 minutes prior to hypoxia. Three repeated Western blots were carried out for each protein.
Lentivirus-mediated GIT1 interference
PL-SHRNA-EF1a-F and packing vectors were purchased from Origin Biosciences (Nanjing, China). Three shRNAs targeting human GIT1 mRNA (GIT1-Ri-1: CACCGCTGGTTGAGTGCCAATATG ACGAATCATATTGGCACTCAACCAGC; GIT1-Ri-2: CACCGGATCACAAGAATGGGCATTA CGAATAATGCCCATTCTTGTGATCC; GIT1-Ri-3: CACCGCTGGAAGGGAAGAGGTTTCTC GAAAGAAACCTCTTCCCTTCCAGC) were cloned into a lentiviral vector PL-SHRNA-EF1a-F. A nonspecific scramble shRNA sequence (TTCTCCGAACGTGTCACFT) was used as a negative control (NC). The constructs were then transfected into HEK293T cells with lentiviral packaging vectors by using Lipofectamine 2000 (Thermo Fisher Scientific) according to the manufacturer’s instruction. Viruses were collected 48 hours after transfection and used to infect human OS cells. After 48 hours, the cells were processed for real-time PCR. Cells stably expressing GIT1-shRNA were selected with puromycin.
ELISA assay of VEGF
Human osteosarcoma cells (OST-NC and OST-GIT1) were cultured in six-well plates. After reaching confluence, the culture medium was extracted and examined immediately. A VEGF (colorimetric ELISA) assay kit (ExCell Biological Products Co., Ltd., Shanghai, China) was used to determine the VEGF content in the culture medium according to the manufacturer’s protocol.
In vitro invasion assay
Human OS cell invasion following GIT1 knockdown was assessed by transwell invasion chamber assay. The upper well of the transwell (Corning Incorporated, Corning, NY, USA) was coated with Matrigel (BD Biosciences, San Jose, CA, USA) at 37°C in a 5% CO2 incubator for 1 hour. Indicated cells were serum starved for 24 hours, and then, 1×10⁵ cells cultured in 200 µL of serum-free RPMI-1640 medium were seeded in the upper chamber of the transwell invasion system, while 600 µL RPMI-1640 medium with 10% FBS was added into the lower chamber. The plates were incubated for 12 and 24 hours. At the end of the incubation, the cells on the upper surface of the filter were completely removed by wiping with a cotton swab. Cells that migrated into the lower well were washed with PBS, fixed in 4% paraformaldehyde, and stained by 0.2% crystal violet. The invading cells were observed under the microscope at 400× magnification. Three fields were randomly selected for observation. The results are presented as the mean±SD, with three repeated experiments for each group.
Orthotopic femoral osteosarcoma model
The treatment and use of animals during the study were in accordance with the regulations of the Guide for the Care and Use of Laboratory Animal of the National Institutes of Health (GB14925-2010). All animal studies were approved by the Animal Care Committee of the Affiliated Drum Tower Hospital, Nanjing University Medical School. Sixteen 6-week-old nude mice (BALB/c strain) were obtained from the Comparative Medicine Center of Yangzhou University (Jiangsu, China) and divided equally into OST-GIT1 and OST-NC groups. All mice were anesthetized by ketamine via subcutaneous injection. The leg was sterilized by 75% alcohol and an ~2 mm middle skin incision was made above the keen joint to expose the femoral intercondylar. For each group, OST-GIT1 or OST-NC (1×10⁶ cells) in Matrigel (5 µL) were injected per mouse into the intramedullary cavity of the left femur with a latex-free insulin syringe (0.5 mL 31 G; Suyun Health Group LP, Lianyungang, Jiangsu, China). The skin was closed with a 6-0 suture. One of eight mice for each group died of anesthesia intolerance at the beginning of experiments. During the observation, mice were sacrificed if the obvious cachexia developed. One mouse in the NC-shRNA group was sacrificed in post-implantation 38 days and 44 days, respectively. The remaining five mice in the NC-shRNA group and seven mice in the GIT1-shRAN group were sacrificed in post-implantation 50 days, the experimental end point. The tumors were collected to carry out the tumor microvascular density (MVD) analysis when the mice were killed.
Tumor MVD detection
The tumor tissue was collected and fixed in 10% buffered formalin and paraffin embedded at the end of the study for immunohistochemistry analysis. The sections were incubated with primary antibodies against CD34 (Cell Signaling Technology) overnight at 4°C after permeabilization with a solution of 0.1% sodium citrate and 0.1% Triton X-100 and blocking with 10 ng/mL ovalbumin. After washing in PBS, the slices were incubated with horseradish peroxidase-labeled secondary antibody (1:200; Beyotime Biotechnology, Shanghai, China) for 30 minutes at room temperature. After color development using DAB for 10 minutes, the slices were counterstained with hematoxylin. The slides were viewed at 400× magnification, and positive cells were recognized by the appearance of brown-stained cells. Expression levels were quantified by the average optical density (AOD) of the positive cells in five random fields/sample using Image-Pro Plus 6.0 software (Media Cybernetics, Silver Springs, MD, USA).
Mice observation and whole-body fluorescent imaging after osteosarcoma cell implantation
The health status and weight were recorded every 3 days. The orthotopic tumor length (L, average distance in the proximal–distal plane) and width (W, distance in the medial–lateral plane) were measured by fluorescent imaging system every 3 days. The orthotopic tumor volume was calculated using the following equation: volume (mm3)=L×W2/2. Fifty days after implantation, all remaining mice were sacrificed and the lung metastasis of osteosarcoma was calculated by the fluorescent imaging system.
Statistical analyses
Statistical analyses were performed using the SPSS software (version 16.0; SPSS Inc., Chicago, IL, USA). All experiments were repeated at least three times to calculate the mean and SD. The independent Student’s t-test for comparison of two groups or one-way ANOVA for multiple comparisons was conducted. Chi-squared test or Fisher’s exact test was used for comparisons between dichotomous variables. Two-tailed tests were used for all hypothesis tests in the present study. A value of P<0.05 was considered to indicate statistical significance.
Results
GIT1 distribution in human osteosarcoma tissues
Six cases of conventional high-grade osteosarcoma were screened to verify GIT1 expression and the protein was expressed exclusively in four cases. Immunostaining was obtained by using GIT1 antibody and it was almost restricted to cytoplasm of neoplastic cells (Figure 1). Data of the 6 patients were shown in Table 1.
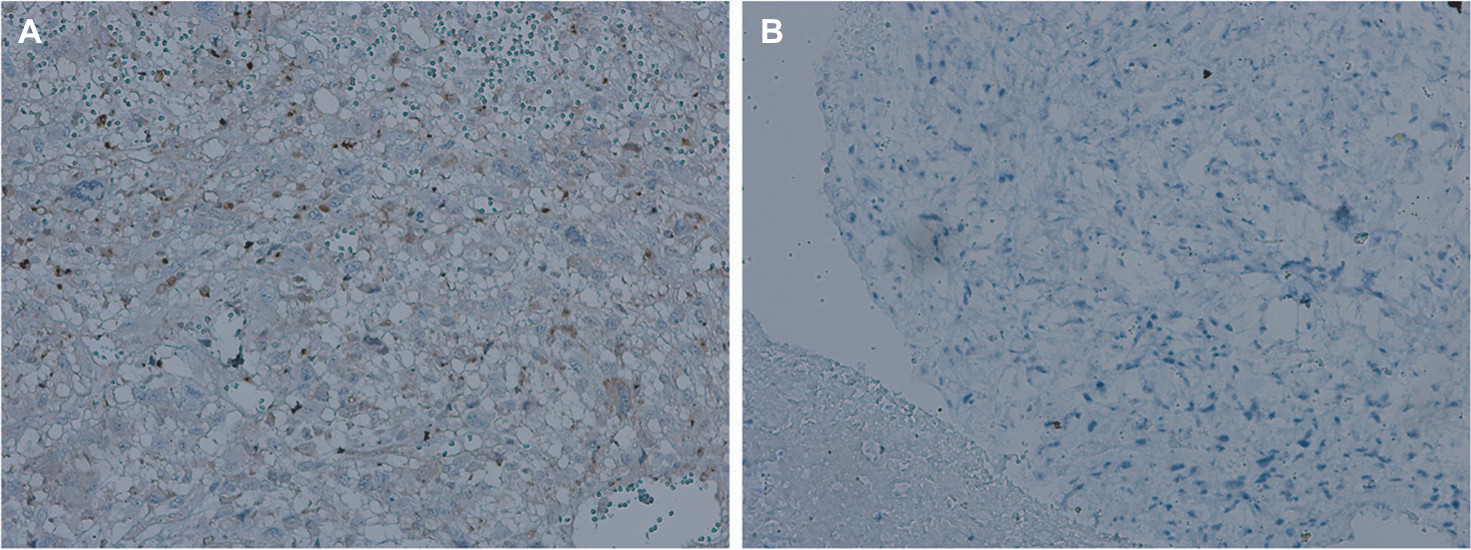 | Figure 1 GIT1 expression in human osteosarcoma tissues. Notes: Two typical cases of primary osteosarcoma. In (A) there is a diffuse cytoplasmic staining, while no immunoreactivity can be detected in (B). No nuclear staining for GIT1 has been obtained (original magnification: ×400). |
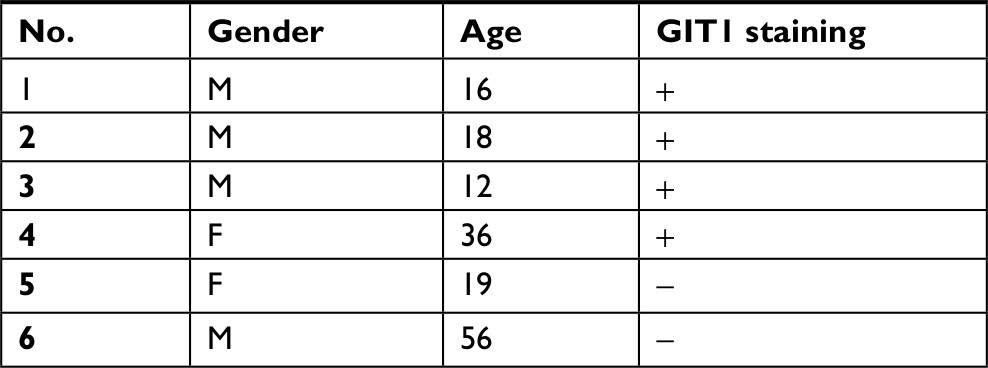 | Table 1 Immunohistochemical staining of GIT1 in all patient-derived OS tissues Abbreviations: +, the staining of GIT1 was founded; -, no staining of GIT1 was founded; F, Female; M, Male. |
GIT1 expression in osteosarcoma cell lines
In order to assure the quality of orthotopic femoral osteosarcoma model, RT-PCR and western blotting was used to identify which had the highest level of GIT1 among three commercially available human OS cell lines: HOS, 143B and OST cells. The results showed that OST cells had the highest expression level (Figure 2A, C). Therefore, it was selected to study the effect of GIT1 and knockdown of GIT1 was conducted in OST cells. Subsequently, mRNA and protein level of GIT1 in OST after lentiviral infection was analyzed. GIT1 mRNA and protein expression was significantly downregulated in OST after treatment with GIT1-shRNA compared to that in NC-shRNA groups (Figure 2B, D). As shown in Figure 2E, over 90% of osteosarcoma cells were red fluorescence protein (RFP) positive, indicating that the infection efficacy was satisfying. Taken together, the lentivirus constructed in this study has satisfactory efficacy.
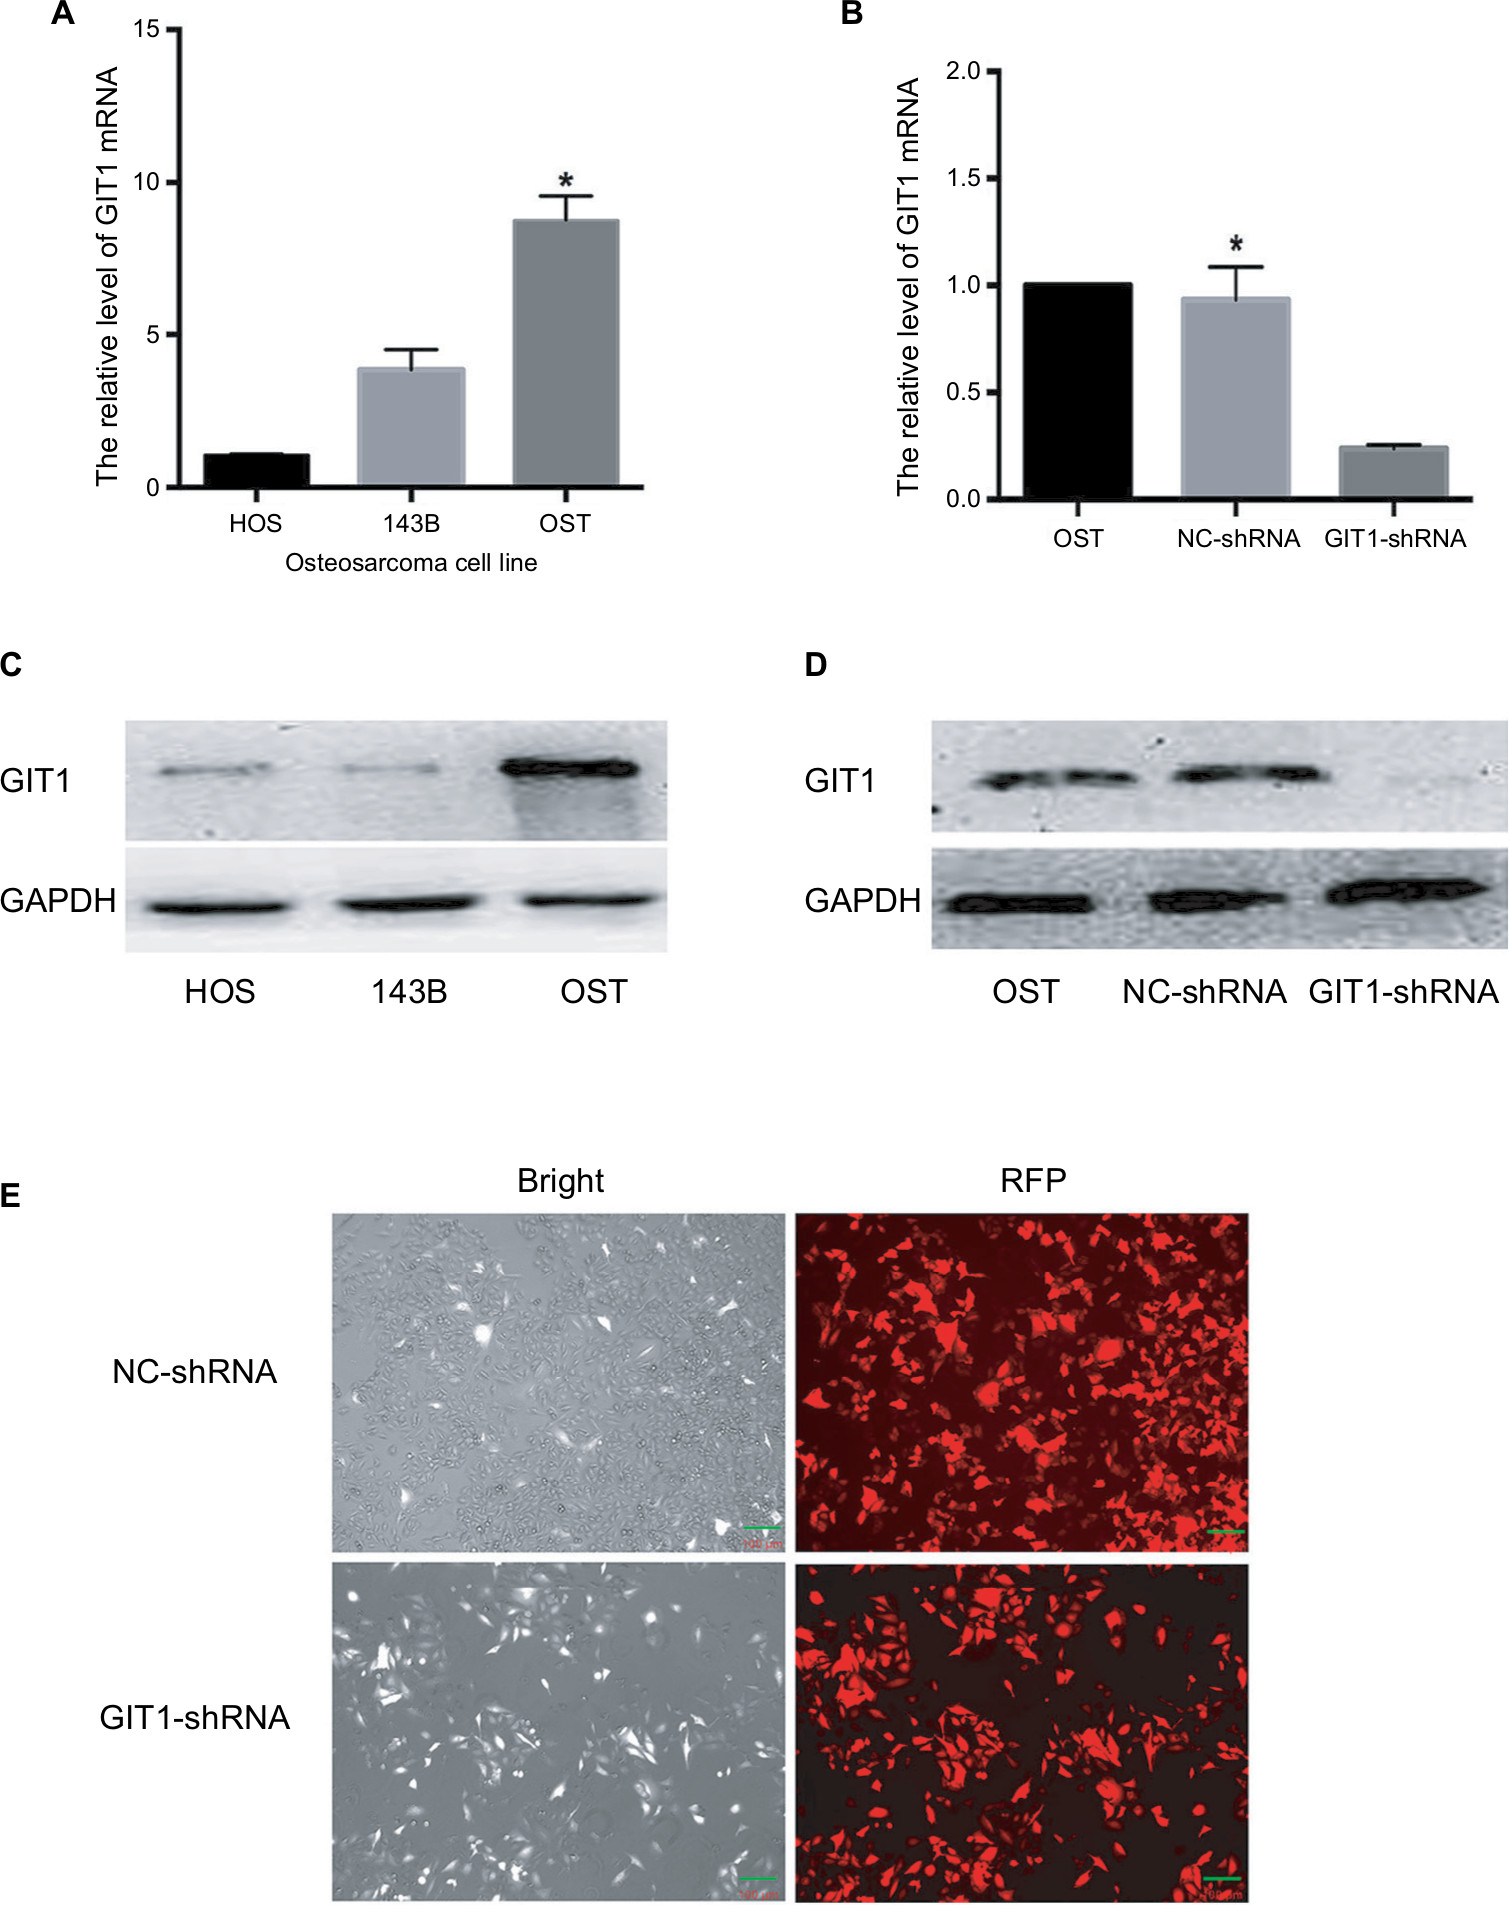 | Figure 2 Knockdown efficacy of GIT1. Notes: (A) The relative transcription of GIT1 mRNA in three kinds of osteosarcoma cell lines (HOS, 143B and OST) detected by qRT-PCR. (B) The knockdown efficacy by GIT1-shRNA in OST cells detected by real-time RT-PCR. (C) The relative expression of GIT1 protein in three kinds of osteosarcoma cell lines (HOS, 143B and OST) detected by Western Blotting. (D) The knockdown efficacy by GIT1-shRNA in OST cells detected by Western Blotting. (E) Microscopic images of OST infected with lentivirus. One-way ANOVA for comparing GIT1 mRNA among HOS, 143B and OST cells or among blank, NC-shRNA and GIT1-shRNA groups was conducted respectively (scale bar: 100 µm; *P<0.05). |
Knockdown of GIT1 remarkably inhibited the cell invasion of osteosarcoma cells
Transwell invasion assay was used to evaluate the invasive ability of OST cell. At 12 hour, there were no significantly differences among three groups, while at 24 hour, the crystal violet staining results showed that the number of OST cells invading the Matrigel membrane was remarkably decreased in the GIT1-shRNA transfected group compared with the control group as well as the blank group (P<0.01) (Figure 3). The results showed that the down-regulation of GIT1 protein was closely associated with the decreased invasive ability of OST cells.
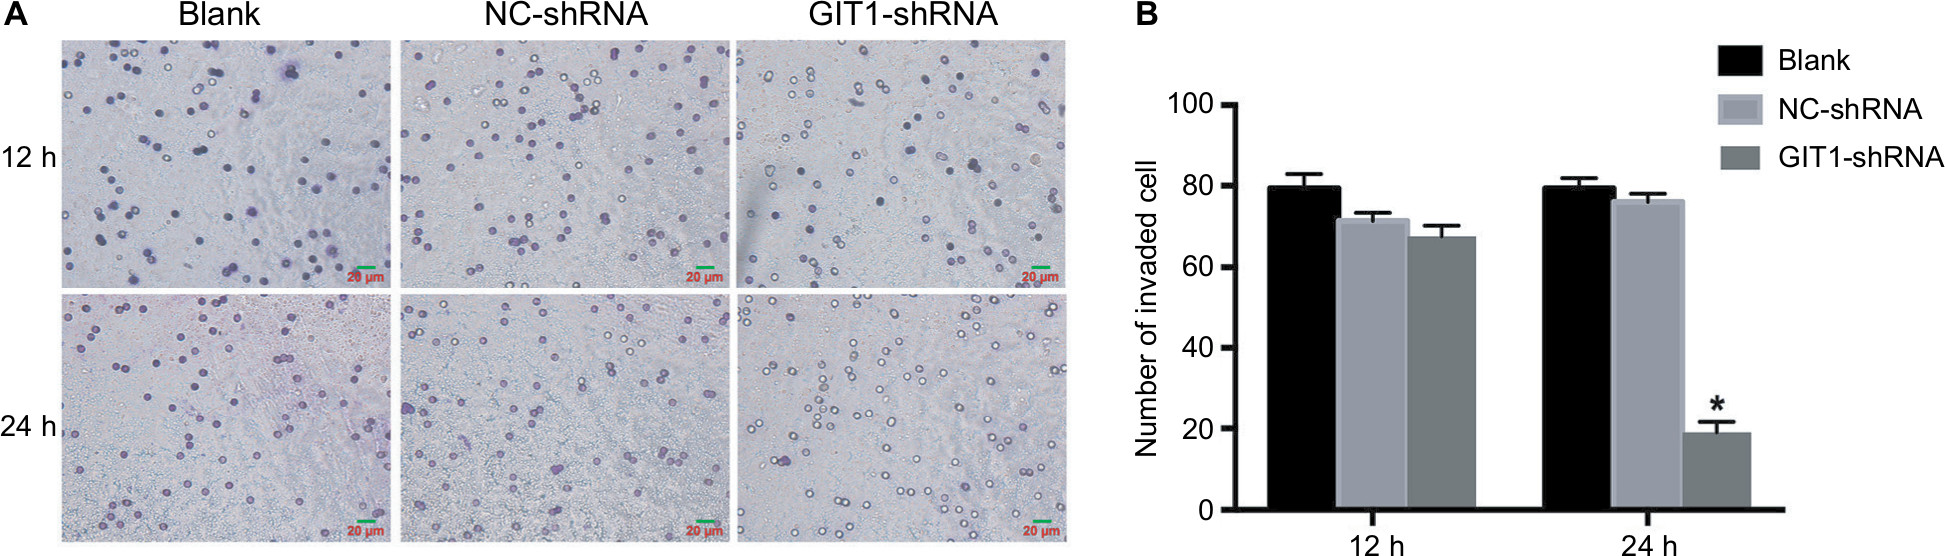 | Figure 3 Knockdown of GIT1 inhibited invasion of osteosarcoma cells. Notes: OST cells were infected with GIT1-shRNA, NC-shRNA or blank control for 24 and 48 hours respectively. Cell invasion was evaluated by the transwell migration assay. (A) The representative images of three groups. (B) Quantitative results of cell invasion assay. One-way ANOVA for comparing the number of invade cells among blank, NC-shRNA and GIT1-shRNA group was conducted (scale bar: 20 µm; *P<0.05). |
Knockdown of GIT1 remarkably inhibited angiogenesis of osteosarcoma
To further elucidate the association between GIT1 and osteosarcoma, we revealed its effect on angiogenesis, which played a pivotal role in osteosarcoma growth and metastasis. First, ELISA was used to detect the VEGF concentration in serum released by OST cells. As shown in Figure 4A, GIT1-shRNA significantly decreased VEGF release from OST cells compared with NC-shRNA treated group (167.40±7.19 vs 155.63±1.34 pg/mL, P=0.047). Second, immunohistochemical staining of CD34 was carried out to evaluate MVD. The gray intensity analysis demonstrated that CD34 stains were markedly reduced in GIT1-shRNA group compared to NC-shRNA group (Figure 4B, C, P<0.05).
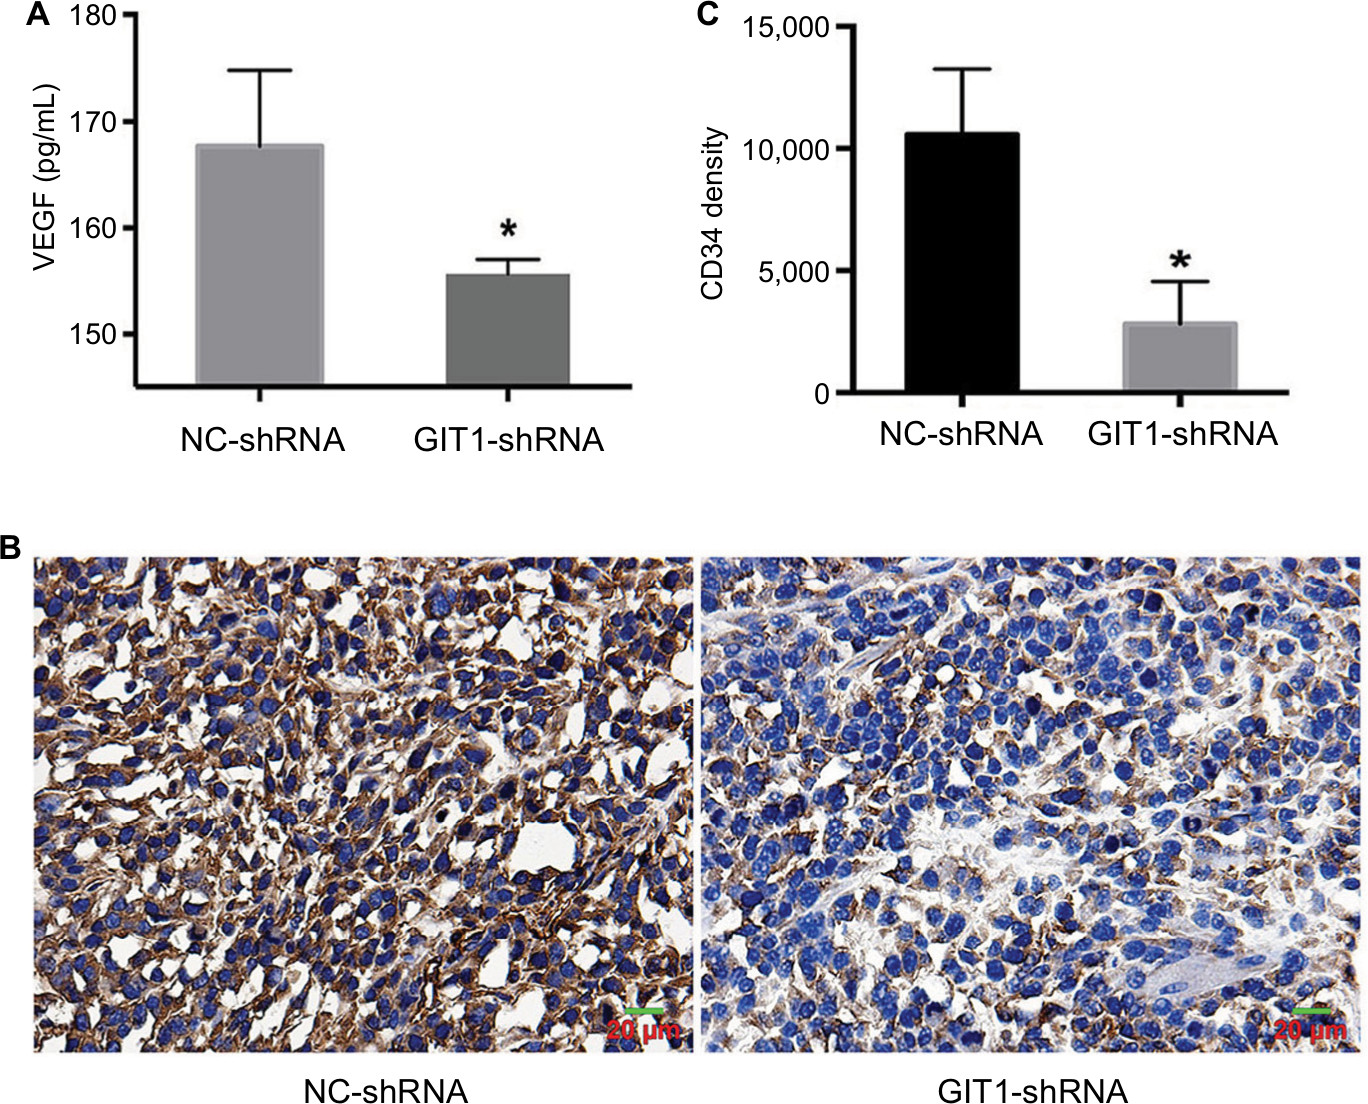 | Figure 4 Knockdown of GIT1 inhibited angiogenesis of osteosarcoma. Notes: (A) The ELISA results of VEGF concentration released from OST cells infected with GIT1-shRNA or NC-shRNA. (B) The representative images of immunohistochemistry of CD34 (a marker of tumor MVD) in vivo. (C) The statistical analysis of B. The independent Student’s t-test for comparing VEGF concentration or CD34 expression level between the two groups was conducted respectively (Scale bar: 20 µm; *P<0.05). |
Effect of GIT1 on primary osteosarcoma growth and lung metastasis in the orthotopic model
One of eight mice for each group died of anesthesia intolerance at the beginning of experiments. The weight and tumor volume was measured every 3 days. From the beginning to the end point, there was no difference in weight between GIT1-shRNA and NC-shRNA treated group (data not shown). As shown in Figure 5A, the GIT1-shRNA treated tumors grew slower than the control tumors in mice. From post-implantation 30 days, the significant difference in tumor volume between two groups was found (453.48±85.63 vs 986.70±475.92 mm3, P=0.037). The significance lasted for about 1 week, and the statistical analysis between GIT1-shRNA and NC-shRNA treated group was 930.33±522.13 vs 2049.24±749.41 mm3 (P=0.025) and 1324.16±834.08 vs 2821.82±650.76 mm3 in post-implantation 36 days (P=0.022), respectively. These data suggested that knockdown of GIT1 inhibited tumor growth in nude mice (Figure 5B). When the mice were sacrificed, the lung metastasis was also recorded. The incidence of lung metastasis in two groups had no difference, while the number of lung metastatic nodules in NC-shRNA group was significantly higher than those in GIT1-shRNA group (Table 2 and Figure 5C).
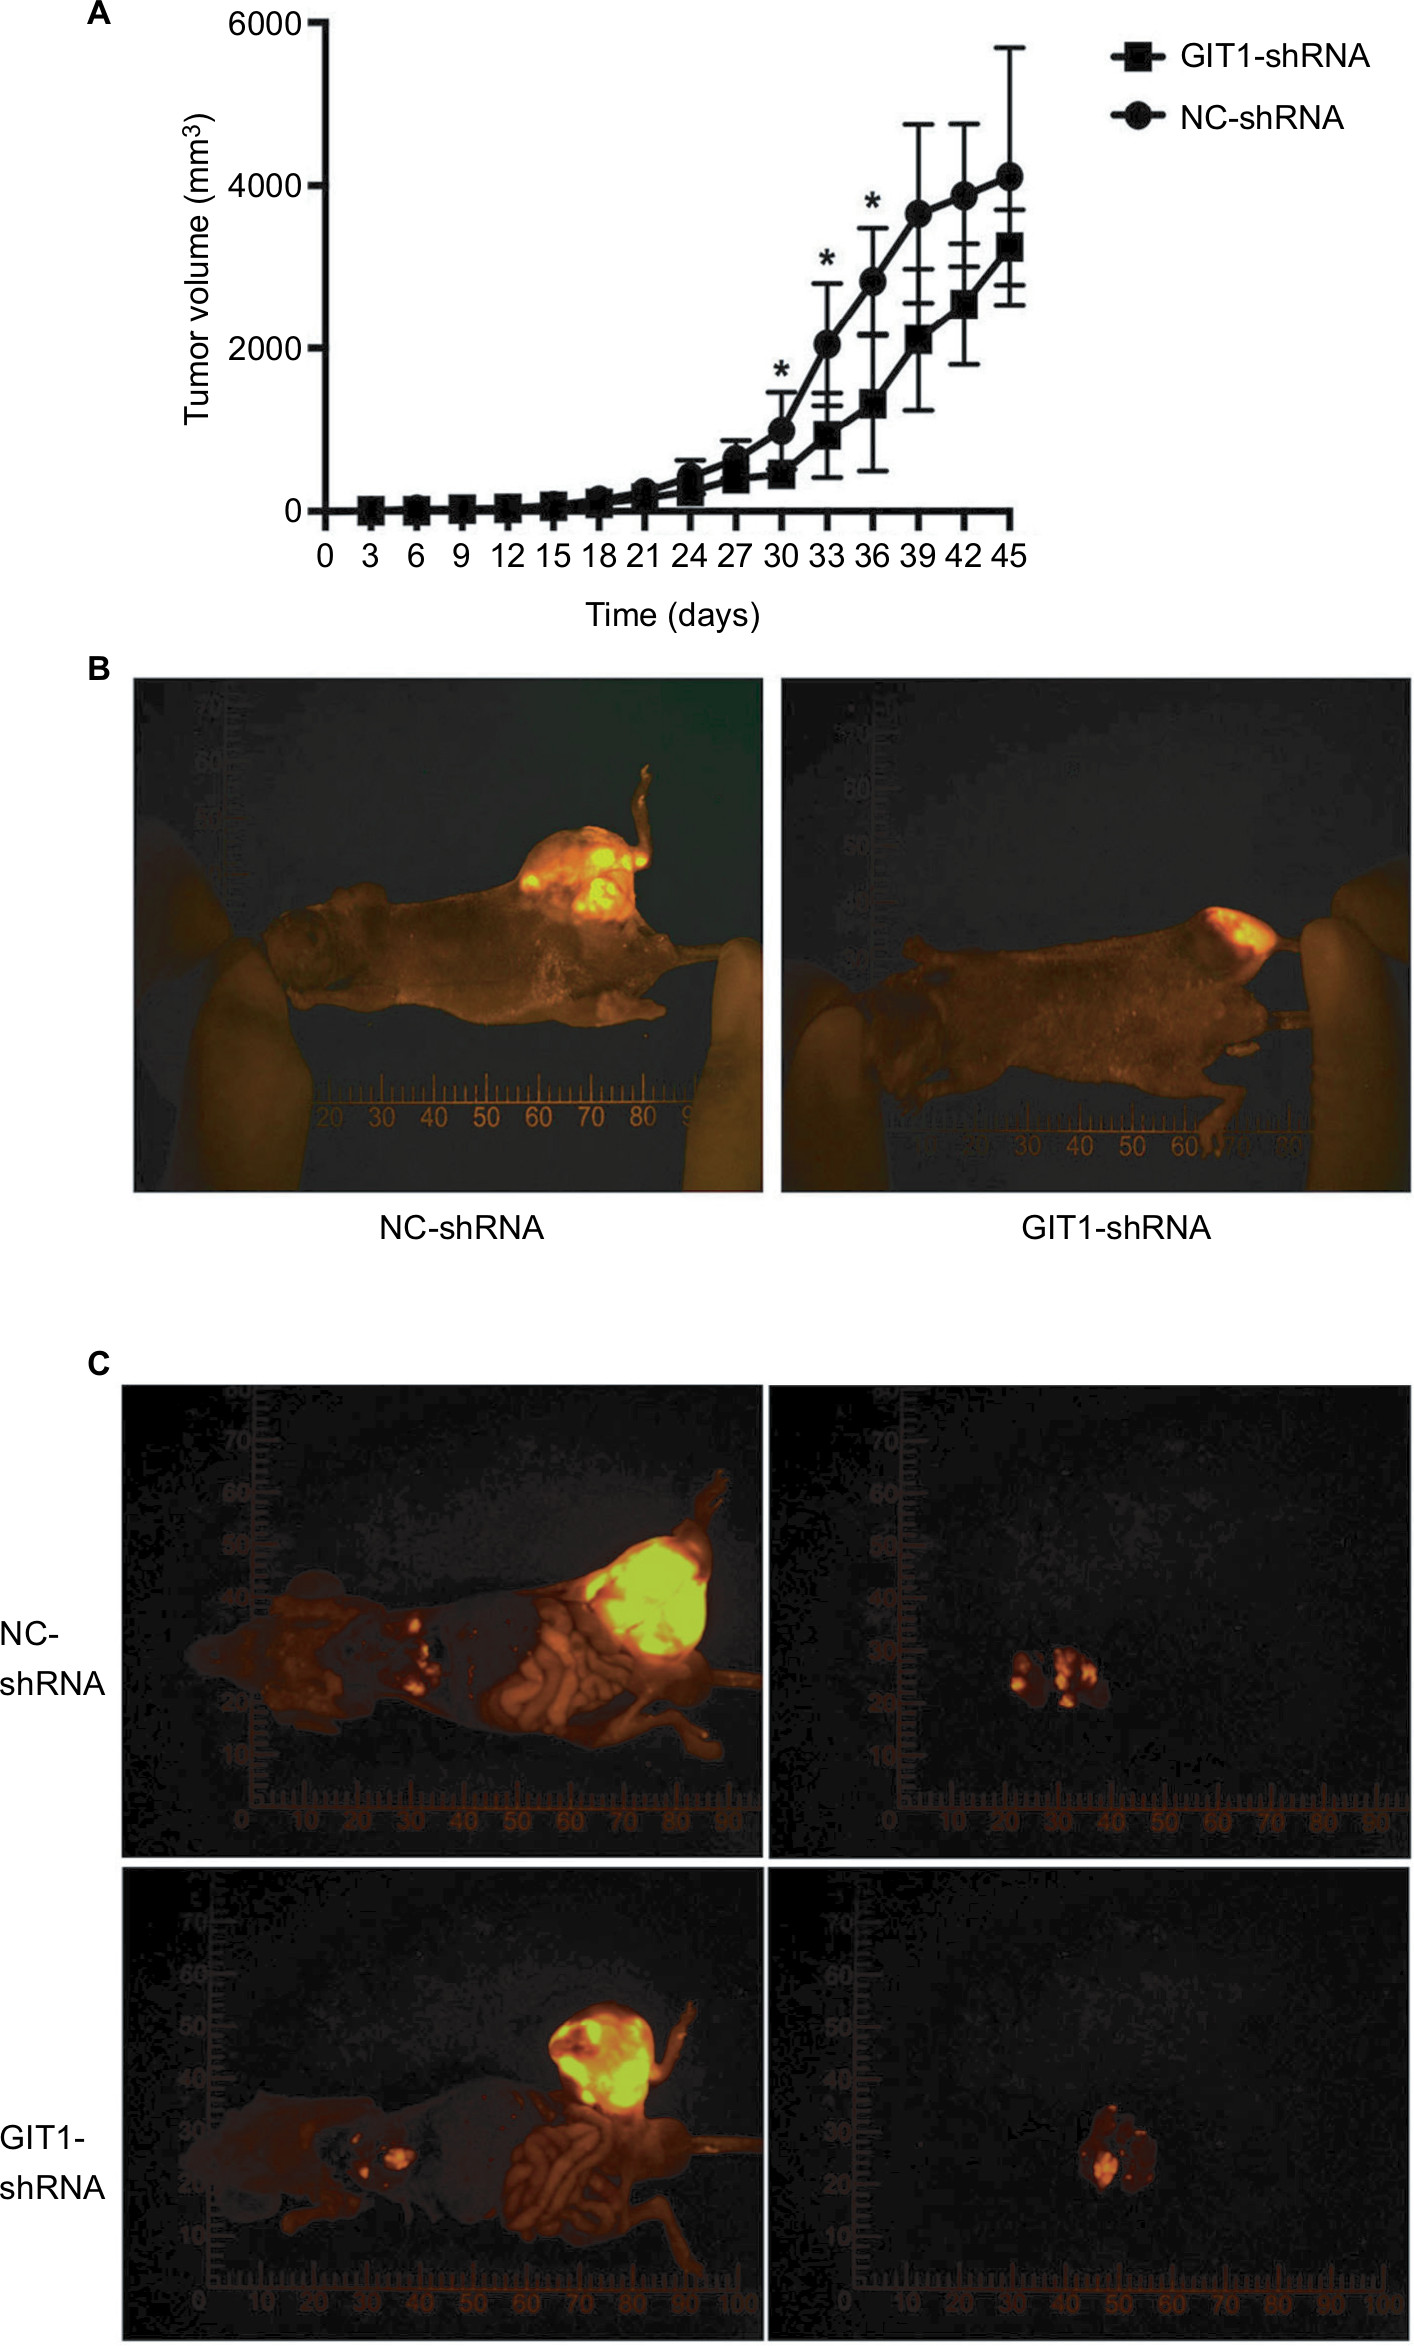 | Figure 5 Effect of GIT1 on primary osteosarcoma growth and lung metastasis in the orthotopic model. Notes: OST cells infected with GIT1-shRNA or NC-shRNA were orthotopically transplanted into the distal femur of nude mice and allowed to form tumors. (A) Tumor diameter was evaluated for 45 days. (B) The representative fluorescence imaging of orthotopic tumor in two groups. The independent Student’s t-test for comparing tumor volume between NC-shRNA and GIT1-shRNA group was conducted in different post-implantation days. (C) The representative fluorescence imaging of lung metastasis in two groups. Left column: the images of whole mice; right column: the images of lung metastasis (*P<0.05). |
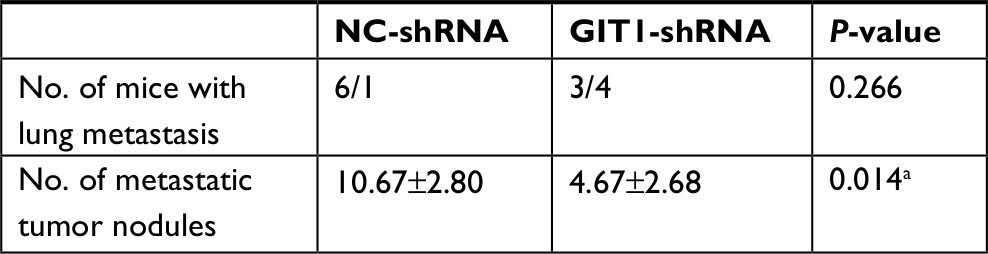 | Table 2 Data of lung metastasis Note: aP<0.05. |
Inactivation of ERK1/2 and down-regulation of HIF-1α was involved in VEGF decrease of GIT1-shRNA treated OST cells
To investigate the underlying mechanism by which GIT1 regulated OST cell VEGF release, we detected the effect of GIT1 on ERK1/2 and HIF-1α signaling. Proteins were extracted from orthotopic tumor tissues in sacrificed mice. The result showed the phosphorylation of ERK1/2 and the expression of HIF-1α was markedly attenuated in GIT1-shRNA treated group (P<0.05, Figure 6A–D). Next, we detected whether GIT1 affected HIF-1α expression in OST cells induced by hypoxia. As expected, the expression level of HIF-1α in GIT1-shRNA infected OST cells was decreased significantly (P<0.05, Figure 6E, F). In addition, inhibition of p-ERK1/2 by its specific inhibitor (PD98059) could significantly decrease HIF-1α expression and VEGF concentration (P<0.05, Figure 6E–G). So the underlying mechanism of GIT1 in regulating VEGF expression may be through ERK1/2/HIF-1α pathway.
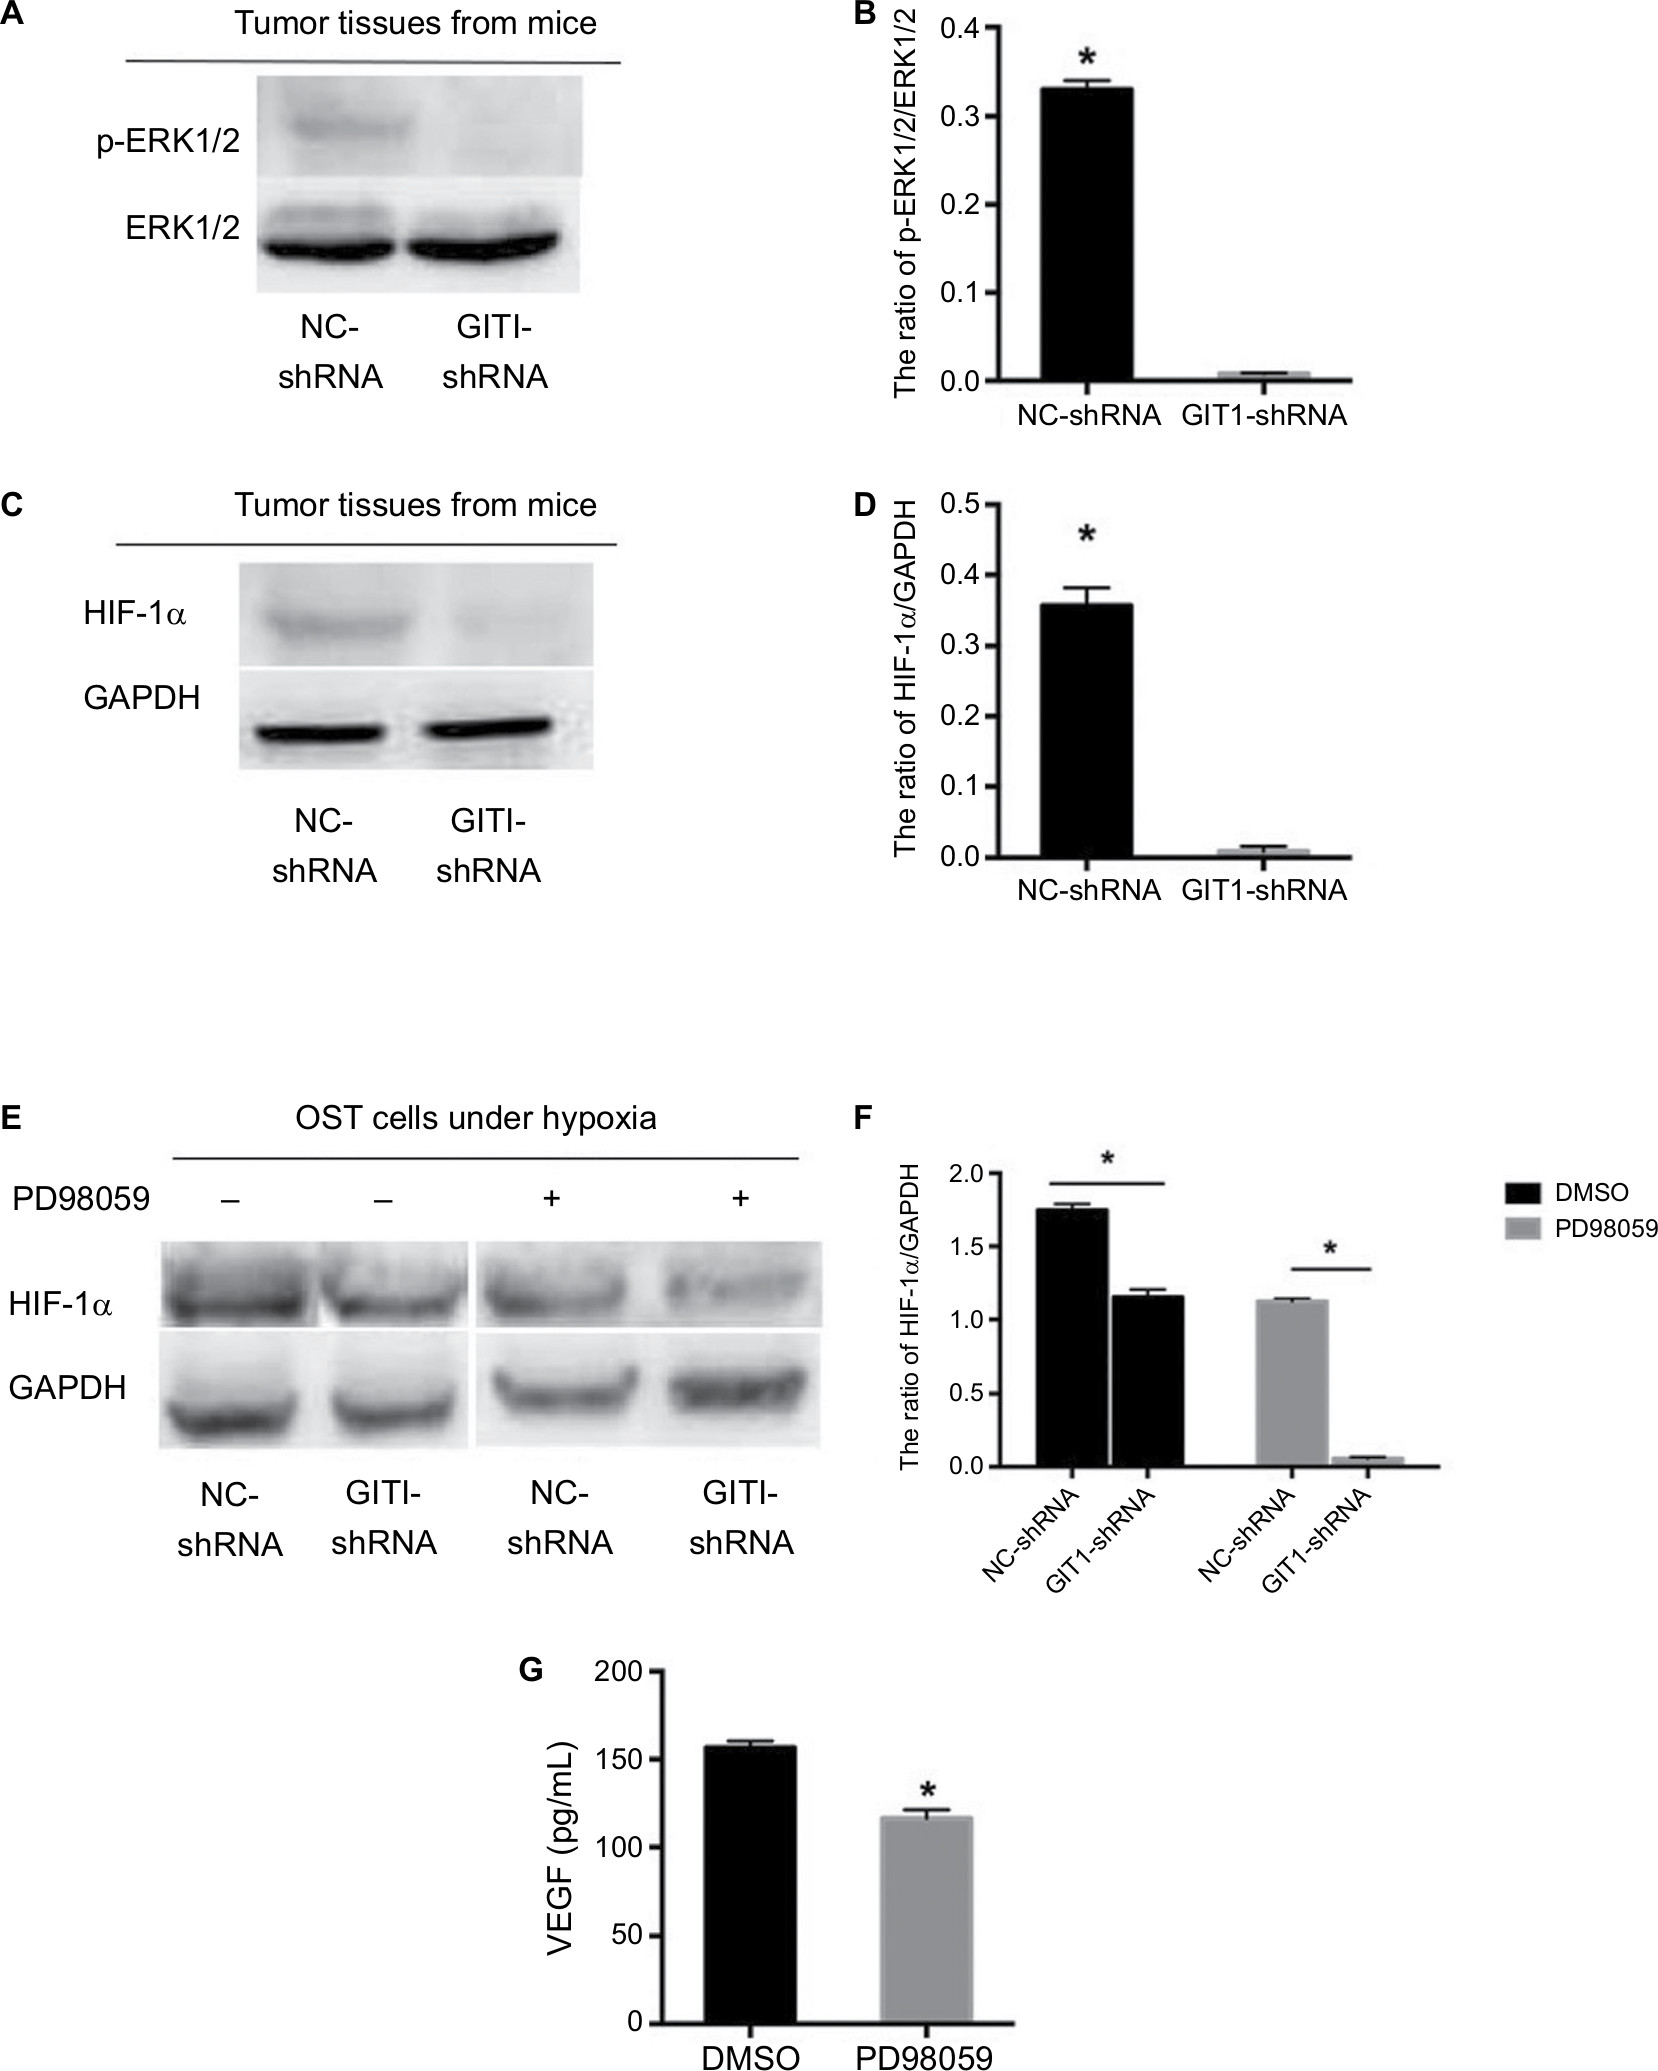 | Figure 6 ERK1/2/HIF-1α pathway participated in GIT1-regulated VEGF release. Notes: (A) The activation of ERK1/2 in tumor tissues from two groups’ mice. (B) The statistical analysis of A. (C) The expression of HIF-1α in tumor tissues from two groups` mice. (D) The statistical analysis of C. (E) In order to induce HIF-1α expression, OST cells of two groups were cultured in hypoxia for 12 hours with or without PD98059 pretreated. The expression of HIF-1α under different conditions was detected by Western blotting. (F) The statistical analysis of C. (G) The ELISA results of VEGF concentration released from OST cells infected with GIT1-shRNA with or without PD98059 pretreated. The independent Student’s t-test for comparing p-EKR1/2 or HIF-1α protein level between NC-shRNA and GIT1-shRNA group was conducted, respectively (*P<0.05). |
Discussion
In the present study, we first revealed that GIT1 was distributed in more than half of human osteosarcoma tissues, suggesting it may play an important role in osteosarcoma growth or metastasis. Then, experiments in vitro showed that knockdown of GIT1 by lentivirus shRNA strongly inhibited the invasion ability and VEGF release of OST cells. The in vivo experiments by fluorescent orthotopic model demonstrated that tumor growth, lung metastasis, and angiogenesis were strongly retrained in GIT1-shRNA treated mice. Furthermore, we revealed that GIT1 may regulate VEGF release mainly by influencing ERK1/2 activation and HIF-1α expression. Above all, these data indicated that GIT1 might serve as a useful potential target for the treatment of osteosarcoma.
GIT1, a multifunctional scaffold protein, was involved in diverse cellular process including cell migration, synapse formation, angiogenesis, and apoptosis.4,16 In skeletal system, GIT1 was widely expressed in osteoblasts, osteoclasts, and chondrocytes, thus participating in fracture healing, cartilage repair, and bone mass balance.9,17 Recently, some studies revealed its overexpression in multiple tumor cells such as breast, lung and hepatocellular cancer.11–13,18 However, to our knowledge, the distribution and role of GIT1 in osteosarcoma has not been studied. In consistent with the above researches, our present study first showed GIT1 was distributed in osteosarcoma tissues (Table 1), and it was almost located in cytoplasm, which was in coincidence with its scaffold protein characteristics (Figure 1). But in this study, we only observed the distribution of GIT1 in six OS patients without control tissues. At the beginning, we wanted to make the comparison of GIT1 expression between osteosarcoma and adjacent normal tissues. However, tumor tissues were all obtained by needle biopsy before any treatments in our research. Hence, it was impossible to obtain adjacent normal tissues unless extended resection was carried out before diagnosis and new adjuvant chemotherapy. To investigate the growth and metastasis, the orthotopic mice osteosarcoma model was introduced. The knockdown of GIT1 could significantly inhibit tumor growth from day 30–36 after implantation. With the purpose of elucidating the effects of GIT1 on osteosarcoma thoroughly, we extended the observation time to more than 6 weeks after tumor implantation. However, no significant difference of tumor volume between two groups after day 39 was founded. Mice would be sacrificed if the obvious cachexia developed, and due to that reason, one mouse in NC-shRNA group was sacrificed in post-implantation 38 and 44 days, respectively. Considering the small mice number of both groups and the largest tumor volume of two sacrificed ones in NC-shRNA group, the differences of tumor volume might be influenced and no significance could not be founded after day 39.
Cancer cell invasion is the critical step for tumor invasion. Regulating cell invasion is a major function of GIT1.16 In our research, the transwell invasive chamber experiment first demonstrated that the invasion ability of OST cells was significantly inhibited in the GIT1 knockdown group. Then, the orthotopic model also confirmed that the number of lung nodules were obviously lower in the GIT1 knockdown group. These findings indicated that GIT1 might affect osteosarcoma invasion or metastasis. GIT1 overexpression has a significant role in tumor progression, especially the migration of tumor cells.12,13,18 In lung cancer cells, GIT1-shRNA significantly reduced GIT1 protein with a concomitant inhibition of migration and invasion of approximately 85%–90%.12 Knockdown of GIT1 suppressed invasion of hepatocellular carcinoma cells.18 Silencing of GIT1 significantly reduced cellular metastatic ability in breast cancer cells.13 Not only in normal cells such as osteoblasts and vascular smooth muscle cells but also in tumor cells such as lung and breast cancer cells, GIT1 regulated invasion by diverse mechanisms. Although GIT1 has similar effects on tumor cell migration and invasion, the regulatory mechanisms are not identical. In the present study, we only uncovered the effect of GIT1 in osteosarcoma cell invasion. Hence, the specific mechanism should be further studied.
Angiogenesis is well known for osteosarcoma growth, progression, and metastasis and has been recognized as a potential therapeutic target for osteosarcoma treatment.19 Recent studies gradually revealed the important role of GIT1 in angiogenesis.7,17 In GIT1-knockout mice, melanoma tumor angiogenesis and melanoma tumor growth were obviously reduced.7 During fracture healing, vascular microcomputed tomography analysis of callus samples revealed decreased blood vessel volume, number, and connection density in GIT1-knockout mice.6 In our study, CD34 immunostaining was used to calculate MVD in osteosarcoma tissues and the results were similar to the above mentioned researches. VEGF, a member of a family of angiogenic factors, plays an important role in tumor angiogenesis. Next, ELISA was used to detect the release of VEGF from OST cells, and the analysis suggested that GIT1 influenced angiogenesis in osteosarcoma mainly through regulating its VEGF release.
Due to the key role of VEGF-mediated angiogenesis in osteosarcoma, our work further investigated the possible underlying mechanism of GIT1 in regulating VEGF release. ERK1/2 was thought to play an important role in GIT1-mediated VEGF secretion and angiogenesis.20,21 In addition, HIF-1α is acknowledged to be a major transcription factor in regulating VEGF expression.15 Here, the activation of ERK1/2 and the expression of HIF-1α were found in osteosarcoma tissue while GIT1 knockdown could significantly decrease p-ERK1/2 and HIF-1α level. Then in vitro to induce HIF-1α expression, OST cells were cultured under hypoxia condition.15 In hypoxia, the expression of HIF-1α could be detected and GIT1 knockdown could significantly decrease its expression. Therefore, it was suggested that ERK1/2 and HIF-1α participated in GIT1 regulated VEGF release. Next, PD98059 was used to inhibit ERK1/2 activation. Not only HIF-1α expression but also VEGF concentration decreased. Above all, we speculated that the underlying mechanism of GIT1 in regulating VEGF expression might be through ERK1/2/HIF-1α pathway. However, the exact signaling pathway among ERK1/2, HIF-1α, and GIT1 needed to be further studied.
Conclusion
We found that GIT1 was expressed in osteosarcoma. Thus, inhibition of GIT1 in tumor tissues might provide a therapeutic strategy. Our study provides for the first time that GIT1 played a key role in the growth, invasion, and angiogenesis of osteosarcoma. A further research on GIT1 might be beneficial to uncover the potential molecular mechanism and develop targeted drugs for osteosarcoma.
Acknowledgment
This work was supported by the Nanjing Key Program of Medical Science and Technology Development (Grant no. ZKX14021 and JQX16021).
Author contributions
Zitao Zhang and Polu Hu are co-first authors. All authors contributed toward data analysis, drafting and revising the paper, gave approval of the final version to be published and agree to be accountable for all aspects of the work.
Disclosure
The authors report no conflicts of interest in this work.
References
Damron TA, Ward WG, Stewart A, Osteosarcoma SA. Osteosarcoma, chondrosarcoma, and Ewing’s sarcoma: National Cancer Data Base Report. Clin Orthop Relat Res. 2007;459:40–47. | ||
Mirabello L, Troisi RJ, Savage SA. International osteosarcoma incidence patterns in children and adolescents, middle ages and elderly persons. Int J Cancer. 2009;125(1):229–234. | ||
Jaffe N. Osteosarcoma: review of the past, impact on the future. The American experience. Cancer Treat Res. 2009;152:239–262. | ||
Zhang Z, Zhou W, Fan J, Ren Y, Yin G. G-protein-coupled receptor kinase interactor-1 serine 419 accelerates premature synapse formation in cortical neurons by interacting with Ca(2+)/calmodulin-dependent protein kinase IIβ. Brain Res Bull. 2013;95:70–77. | ||
Zhang Z, Fan J, Ren Y, Zhou W, Yin G. The release of glutamate from cortical neurons regulated by BDNF via the TrkB/Src/PLC-γ1 pathway. J Cell Biochem. 2013;114(1):144–151. | ||
Yin G, Sheu TJ, Menon P, et al. Impaired angiogenesis during fracture healing in GPCR kinase 2 interacting protein-1 (GIT1) knock out mice. PLoS One. 2014;9(2):e89127. | ||
Majumder S, Sowden MP, Gerber SA, et al. G-protein-coupled receptor-2-interacting protein-1 is required for endothelial cell directional migration and tumor angiogenesis via cortactin-dependent lamellipodia formation. Arterioscler Thromb Vasc Biol. 2014;34(2):419–426. | ||
Gu YL, Rong XX, Wen LT, Zhu GX, Qian MQ. miR-195 inhibits the proliferation and migration of chondrocytes by targeting GIT1. Mol Med Rep. 2017;15(1):194–200. | ||
Chen P, Gu WL, Gong MZ, Wang J, Li DQ. GIT1 gene deletion delays chondrocyte differentiation and healing of tibial plateau fracture through suppressing proliferation and apoptosis of chondrocyte. BMC Musculoskelet Disord. 2017;18(1):320. | ||
Tu XM, Gu YL, Ren GQ, Xm T, Yl G. miR-125a-3p targetedly regulates GIT1 expression to inhibit osteoblastic proliferation and differentiation. Exp Ther Med. 2016;12(6):4099–4106. | ||
Peng H, Dara L, Li TW, et al. MAT2B-GIT1 interplay activates MEK1/ERK 1 and 2 to induce growth in human liver and colon cancer. Hepatology. 2013;57(6):2299–2313. | ||
Chang JS, Su CY, Yu WH, et al. GIT1 promotes lung cancer cell metastasis through modulating Rac1/Cdc42 activity and is associated with poor prognosis. Oncotarget. 2015;6(34):36278–36291. | ||
Tao WY, Wang CY, Sun YH, Su YH, Pang D, Zhang GQ. MicroRNA-34c suppresses breast cancer migration and invasion by targeting GIT1. J Cancer. 2016;7(12):1653–1662. | ||
Graziano AC, Cardile V, Avola R, et al. Wilms’ tumor gene 1 silencing inhibits proliferation of human osteosarcoma MG-63 cell line by cell cycle arrest and apoptosis activation. Oncotarget. 2017;8(8):13917–13931. | ||
Lv F, du R, Shang W, Suo S, Yu D, Zhang J. HIF-1α silencing inhibits the growth of osteosarcoma cells by inducing apoptosis. Ann Clin Lab Sci. 2016;46(2):140–146. | ||
Hoefen RJ, Berk BC. The multifunctional GIT family of proteins. J Cell Sci. 2006;119(Pt 8):1469–1475. | ||
Menon P, Yin G, Smolock EM, Zuscik MJ, Yan C, Berk BC. GPCR kinase 2 interacting protein 1 (GIT1) regulates osteoclast function and bone mass. J Cell Physiol. 2010;225(3):777–785. | ||
Chen J, Yang P, Yang J, Wen Z, Zhang B, Zheng X. GIT1 is a novel prognostic biomarker and facilitates tumor progression via activating ERK/MMP9 signaling in hepatocellular carcinoma. Onco Targets Ther. 2015;8:3731–3742. | ||
Zhou W, Hao M, du X, Chen K, Wang G, Yang J. Advances in targeted therapy for osteosarcoma. Discov Med. 2014;17(96):301–307. | ||
Pang J, Hoefen R, Pryhuber GS, et al. G-protein-coupled receptor kinase interacting protein-1 is required for pulmonary vascular development. Circulation. 2009;119(11):1524–1532. | ||
Rui Z, Li X, Fan J, et al. GIT1Y321 phosphorylation is required for ERK1/2- and PDGF-dependent VEGF secretion from osteoblasts to promote angiogenesis and bone healing. Int J Mol Med. 2012;30(4):819–825. |
 © 2018 The Author(s). This work is published and licensed by Dove Medical Press Limited. The full terms of this license are available at https://www.dovepress.com/terms.php and incorporate the Creative Commons Attribution - Non Commercial (unported, v3.0) License.
By accessing the work you hereby accept the Terms. Non-commercial uses of the work are permitted without any further permission from Dove Medical Press Limited, provided the work is properly attributed. For permission for commercial use of this work, please see paragraphs 4.2 and 5 of our Terms.
© 2018 The Author(s). This work is published and licensed by Dove Medical Press Limited. The full terms of this license are available at https://www.dovepress.com/terms.php and incorporate the Creative Commons Attribution - Non Commercial (unported, v3.0) License.
By accessing the work you hereby accept the Terms. Non-commercial uses of the work are permitted without any further permission from Dove Medical Press Limited, provided the work is properly attributed. For permission for commercial use of this work, please see paragraphs 4.2 and 5 of our Terms.