")
Back to Journals » International Journal of Women's Health » Volume 7
Influences of peers’ and family members’ body shapes on perception of body image and desire for thinness in Japanese female students
Authors Mase T, Ohara K, Miyawaki C, Kouda K, Nakamura H
Received 4 February 2015
Accepted for publication 17 April 2015
Published 24 June 2015 Volume 2015:7 Pages 625—633
DOI https://doi.org/10.2147/IJWH.S82193
Checked for plagiarism Yes
Review by Single anonymous peer review
Peer reviewer comments 3
Editor who approved publication: Professor Elie Al-Chaer
Tomoki Mase,1 Kumiko Ohara,2,3 Chiemi Miyawaki,4 Katsuyasu Kouda,5 Harunobu Nakamura2
1Department of Childhood Education, Kyoto Seibo College, Kyoto, Japan; 2Graduate School of Human Development and Environment, Kobe University, Kobe, Japan; 3Research Fellow of Japan Society for the Promotion of Science, Tokyo, Japan; 4Department of Early Childhood Education, Heian Jogakuin (St Agnes’) College, Kyoto, Japan; 5Department of Public Health, Kinki University Faculty of Medicine, Osakasayama, Japan
Purpose: The present study investigated the influence of peers’ and family members’ body shapes on the perception of body image and desire for thinness in Japanese female students.
Methods: The study included 342 female, Japanese university students between the ages of 18 years and 22 years. They completed an anonymous questionnaire, which included questions related to anthropometry and body perception. Eating behavior was assessed by the Japanese version of the Eating Attitude Test-26.
Results: Many students overestimated their body shape (81.2% of underweight students and 74.6% of normal students) and had a desire for thinness (41.0% of underweight students, 88.2% of normal students, and 100% of overweight students). One of the main reasons for the overestimation of their body shape was comparison with others. Participants who were interested in a friend’s body shape were almost three times more likely to have a desire for thinness than those who were not interested in a female friend’s body shape (odds ratio: 3.06, P=0.014).
Conclusion: The results indicate a possibility that a female Japanese student’s young female friends’ body shapes, influences her desire for thinness or her perception of her own body shape.
Keywords: body perception, body shape, desire for thinness, female students
Introduction
Body image is a person’s body-related self-perception, which includes perception, attitudes, thoughts, and behaviors.1 However, approximately 20%–40% of females with a normal body mass index (BMI) perceive themselves as being overweight.2–4 An urge to be thin or a false body image has been observed even in teens in various countries.5–8 In addition, research in various countries has shown that females have a desire for thinness.9 A desire for thinness does not always lead to healthy behavior. For example, Brug et al reported that the threat of obesity may induce unnecessary weight loss behavior among Dutch females with a strong desire for thinness.10 Mendes et al reported that weight loss behavior involved only dietary restriction in Portuguese adolescents who had an urge to be thin.11 Inadequate dietary restrictions can result in undernutrition, which can lead to anemia, menstrual abnormalities, and osteoporosis.12–14 Underweight females are potentially at a high risk for malnutrition, and, in particular, underweight people who drastically reduce their body weight are at a high risk for undernourishment.15 There is also a risk that these individuals will develop eating disorders through repetitive dieting.16
Similar behavior has been observed in Japan. In Japan, the prevalence of underweight females has been observed to increase each year.17 The proportion of underweight females (BMI <18.5 kg/m2) was 11.4% in 2012, whereas that of obese or overweight females (BMI ≥25.0 kg/m2) was 19.4%.17 These findings are in contrast with those observed in Western countries such as the United States, where the proportion of underweight people was 1.7% and that of overweight or obese people was 74.1%.18 Particularly, among Japanese females in their 20s, the proportion of underweight women was 21.8% in 2012.17 It has also been reported that young Japanese females tend to have a desire for thinness.19,20 In fact, in Japan, even if young females are not obese, they do not correctly recognize their proper body shape and tend to lose weight based on their desire for thinness.21 Ikeda reported that 81.2% of Japanese female students had a desire for thinness and 66.4% had a false body image.22 Mase et al reported that 51.7% of underweight Japanese female students had a desire for thinness.23
The mechanism underlying a false body image may include social comparison. The concept of social comparison was derived from the social comparison theory.24 To be precise, upward comparisons are those in which an individual compares oneself with someone believed to be better off, and downward comparisons are those in which an individual compares oneself with someone believed to be worse off. Women compare their bodies with others’ as a guide for how to look, and to evaluate their worth.25 In addition, many studies have shown that the influence of peers or family members is important for body image.26–31 Moreover, studies have shown that women are more likely to compare themselves with friends and family members than with more dissimilar images, such as those portrayed in the mass media.32 Furthermore, dieting behavior is influenced by peers’ desire for thinness.33,34 Thus, in the present study, we focused mainly on the influence of friends and family members rather than that of the mass media. On the other hand, in Japan, it has been reported that most female students tend to emphasize their outward appearance.23 Thus, we hypothesized that the appearance of other people has an association with a desire for thinness or the perception of body shape in Japanese women. However, sufficient evidence has not been accumulated.
Therefore, in the present study, we investigated the influence of close acquaintances on the perception of body image and desire for thinness in Japanese female students.
Material and methods
Participants
The study included 400 Japanese female university students between the ages of 18 years and 22 years. An anonymous, self-administered questionnaire survey was conducted during a class between December 2010 and January 2012. The collection rate was 100%, and the valid response rate was 85.5% (n=342). The participants were classified into three groups according to WHO criteria: 1) overweight (BMI ≥25.0 kg/m2), 2) normal-weight (18.5≤ BMI <25 kg/m2), and 3) underweight (BMI <18.5 kg/m2).
All participants provided informed consent, and the study received the approval of the Human Ethics Committee of Graduate School of Human Development and Environment, Kobe University.
Questionnaires
The questionnaire clarified the participants’ physical status, perception of body shape, ideal body shape, and body shape of a person close to the subject.
Physical status included seven items: age (years), height (cm), weight (kg), ideal weight (kg), percent body fat, body fat mass (kg), and lean body mass (kg). With regard to height and weight, we asked the participants to write down their self-reported height and weight, according to the methods reported previously.35–37 Weight (kg), percent body fat, body fat mass (kg), and lean body mass (kg) were measured by a body composition analyzer (innerScan BC-701, Tanita Co., Ltd., Tokyo, Japan). BMI (kg/m2) was calculated as weight in kilograms divided by the square of the height in meters. The ideal BMI was similarly calculated using the ideal weight and height. The weight difference was calculated as the ideal value minus the current value.
Perception of body shape and ideal body shape were investigated using the Contour Drawing Rating Scale (CDRS) developed by Thompson and Gray.38 The CDRS consists of nine drawings of a female or male figure depending on the sex of the respondent. Each drawing increases in size from “extremely thin” (1) to “very obese” (9). The participants were asked to rate their current shape and ideal body shape. Then, those whose ideal weights were lower than their current weights were assigned to the desire group, and the others were assigned to the non-desire group. The evidence of validity and test–retest reliability in male and female undergraduates and early adolescent girls has been reported previously.30
We also asked the participants, “How do you perceive your own body shape?”. The responses included “slim”, “a little slim”, “normal”, “a little obese”, and “obese”. For this analysis, we categorized the “slim” and “a little slim” responses into the “slim” category, and the “obese” and “a little obese” responses into the “obese” category. To verify the association between body image and body shape, those who responded as “obese” or “a little obese” were also asked the reason why they considered themselves as obese. The response options included “comparison with previous body shape”, “based on current body weight or body fat”, and “comparison with others”. We also asked about the desire for a body shape, and the responses included “become fat”, “maintain the current shape”, or “become thin”. We then asked the participants who selected the response “become thin” about their reasons for the desire to be thin. The available responses included “for health”, “for beauty”, “influence of the mass media”, “influence of other diet behavior”, and “for participation in sports”. The participants were asked about the period when they began to strive for thinness, and the responses included “early elementary school years”, “higher grade at elementary school”, “in junior high school”, “in high school”, and “after entering university”.
We asked the participants whether they were interested in the body shapes of their mother, sister, female friend, father, brother, or male friend. The response options included “interested” or “not interested”. In addition, the participants were asked whether the body shape of a person close to them influenced their perception of their body shape, and the response options included “has an influence” or “does not have an influence”.
The eating behavior was assessed by the Japanese version of the Eating Attitude Test-26 (EAT-26), whose validity and responsibility have been validated in previous studies.39,40 EAT-26 is a 26-item self-rated questionnaire that is divided into three subscales: dieting (13 items), bulimia and food preoccupation (six items), and oral control (seven items).41 The items are rated on a six-point Likert scale: never, rarely, sometimes, often, usually, and always. Responses were quantified by assigning a score of 0 for never, rarely, or sometimes; 1 for often; 2 for usually; and 3 for always, according to the original study by Garner et al.41 Participants with a total EAT-26 score of ≥20 were designated as seriously disturbed.
Data analysis
The Wilcoxon signed-rank test was used to evaluate the difference between the perception of body shape and ideal body shape in the underweight, normal-weight, and overweight groups. One-way analysis of variance was used to assess the differences among the underweight, normal-weight, and overweight groups. The Bonferroni test was used for multiple comparisons. Student’s t-test was used to evaluate the differences in the total EAT-26 scores and the factor scores between the desire and non-desire groups. The chi-square test was used to test the response rate in a cross-tabulation. Logistic regression analysis was used to obtain the odds ratio and 95% confidence intervals of the factors related to a desire for thinness. The statistical level for significance was established at 0.05. Statistical analyses were performed using SPSS® 15.0 J for Windows (SPSS Inc., Tokyo, Japan).
Results
Descriptive characteristics of the participants
The physical characteristics of the participants are shown in Table 1. A comparison of the physical characteristics of the participants is shown in Table 2. Body weight, BMI, percent body fat, body fat mass, lean body mass, ideal body weight, difference in body weight, and ideal BMI were significantly different among the underweight, normal-weight, and overweight groups. A post hoc test found that body weight, BMI, percent body fat, body fat mass, lean body mass, ideal body weight, and ideal BMI were significantly higher in the normal-weight group than in the underweight group (P<0.05) and significantly higher in the overweight group than in the normal-weight or underweight groups (P<0.05). The negative value of the difference in body weight was significantly greater in the normal-weight group than in the underweight group (P<0.05) as well as in the overweight group than in the normal-weight or underweight groups (P<0.05).
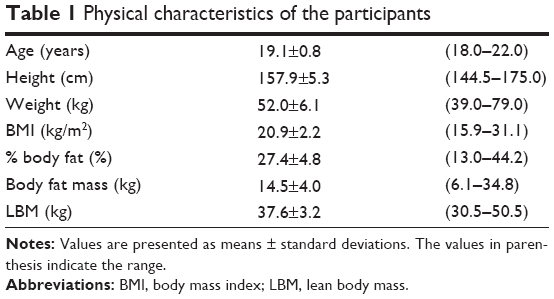 | Table 1 Physical characteristics of the participants |
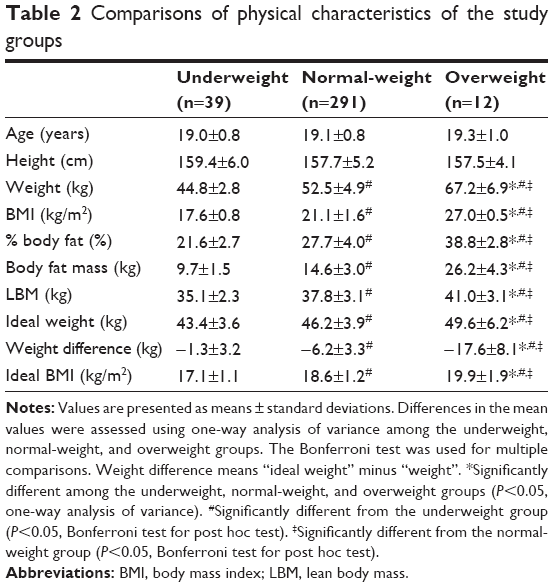 | Table 2 Comparisons of physical characteristics of the study groups |
Body perception and desire for thinness
The results of the CDRS study are shown in Table 3. There was a significant difference in the current body shape on the CDRS among the underweight, normal-weight, and overweight groups (P<0.001). The CDRS scores of the overweight group were higher than those of the normal-weight and underweight groups by the post hoc test (P<0.001 for both). The CDRS scores of the normal-weight group were also higher than those of the underweight group (P<0.001). In addition, the difference between the current and ideal body shapes was significantly different among the underweight, normal-weight, and overweight groups (P<0.001). The CDRS scores of the overweight group were higher than those of the normal-weight and underweight groups by the post hoc test (P<0.001 for both). The CDRS scores of the normal-weight group were also higher than those of the underweight group (P<0.001). The most common responses for the current body shape on the CDRS in the underweight, normal-weight, and overweight groups were numbers 4, 6, and 8, respectively. The most common responses for the ideal body shape on the CDRS in the underweight, normal-weight, and overweight groups were numbers 4, 4, and 5, respectively. In addition, the number of participants whose ideal body shape was smaller than their current body shape in the underweight, normal-weight, and overweight groups were 10 (4.7%), 191 (90.1%), and 11 (5.2%), respectively (total: 212). The number of participants whose ideal body shape was equal to or larger than their current body shape in the underweight, normal-weight, and overweight groups were 29 (22.3%), 100 (76.9%), and 1 (0.8%), respectively (total: 130).
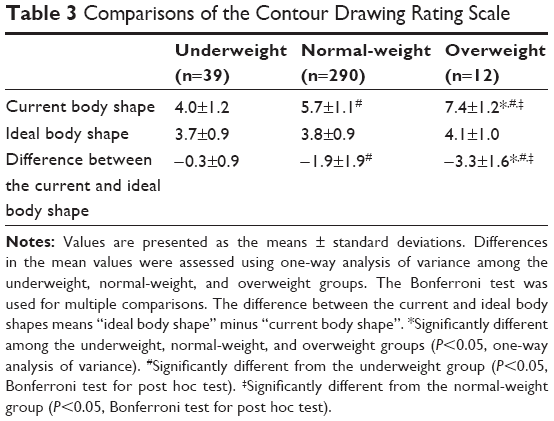 | Table 3 Comparisons of the Contour Drawing Rating Scale |
The mean and standard deviations of the total EAT-26 scores of all participants were 6.9±6.9. The total EAT-26 score of the desire group was significantly higher than that of the non-desire group (Table 4). A comparison of factor scores showed that the score of the first factor (dieting) was significantly higher in the desire group than in the non-desire group. Moreover, there were no significant differences in the scores of the second (bulimia and food preoccupation) and third (oral control) factors between the desire and non-desire groups.
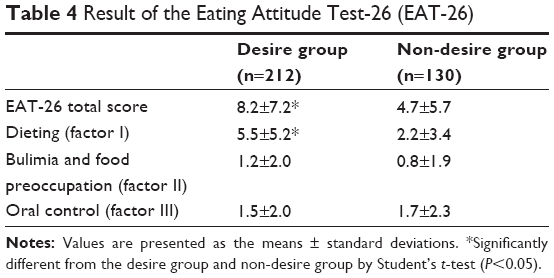 | Table 4 Result of the Eating Attitude Test-26 (EAT-26) |
Body type showed a significant relationship with the perception of body shape, reason for perception of obesity, and desire for a body shape (P<0.05 for all) (Table 5). Regarding the perception of body shape, most of the participants in the underweight, normal-weight, and overweight groups believed themselves to be overweight. As the reason for perception of obesity, most of the participants in the underweight group stated comparison with their past selves, whereas most of the participants in the overweight group stated comparison with others. Regarding the desire for a body shape, many participants in the underweight group still desired to become thin or to maintain their current shape.
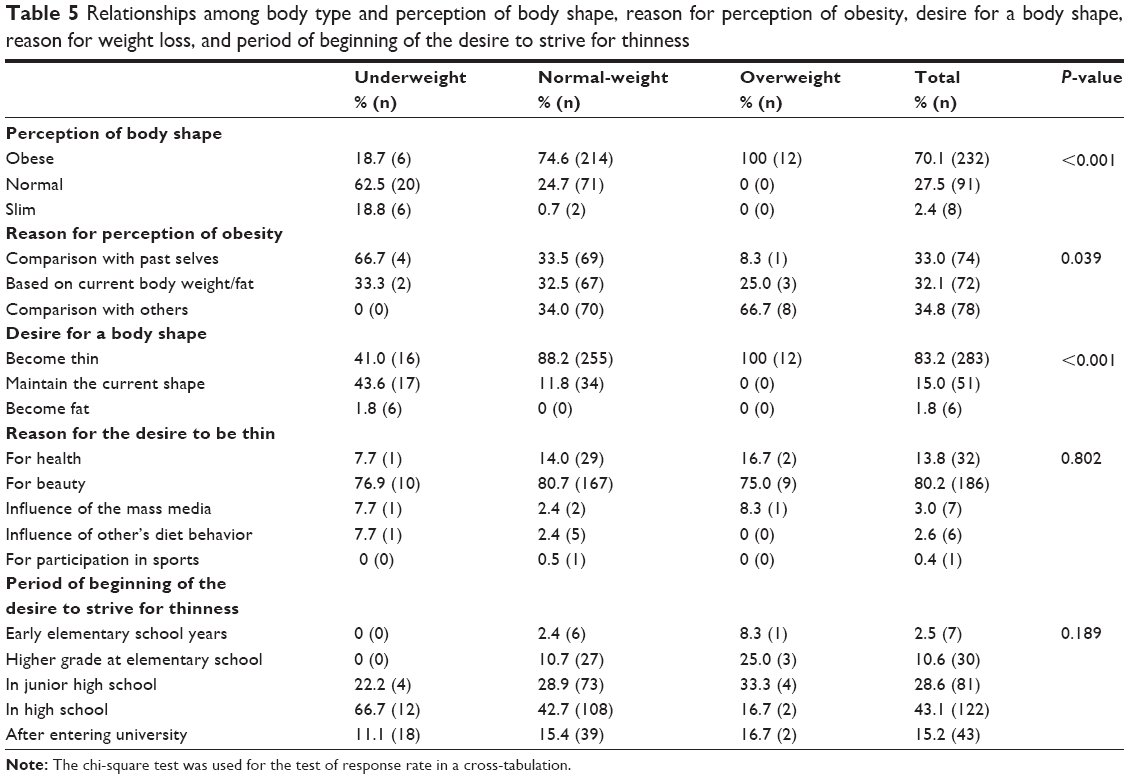 | Table 5 Relationships among body type and perception of body shape, reason for perception of obesity, desire for a body shape, reason for weight loss, and period of beginning of the desire to strive for thinness |
Influence of perception of others’ body shapes on own body perception and desire for thinness
Body type showed a significant relationship with an interest in sister’s body shape, interest in a female friend’s body shape, and influence of brother’s body shape (Table 6).
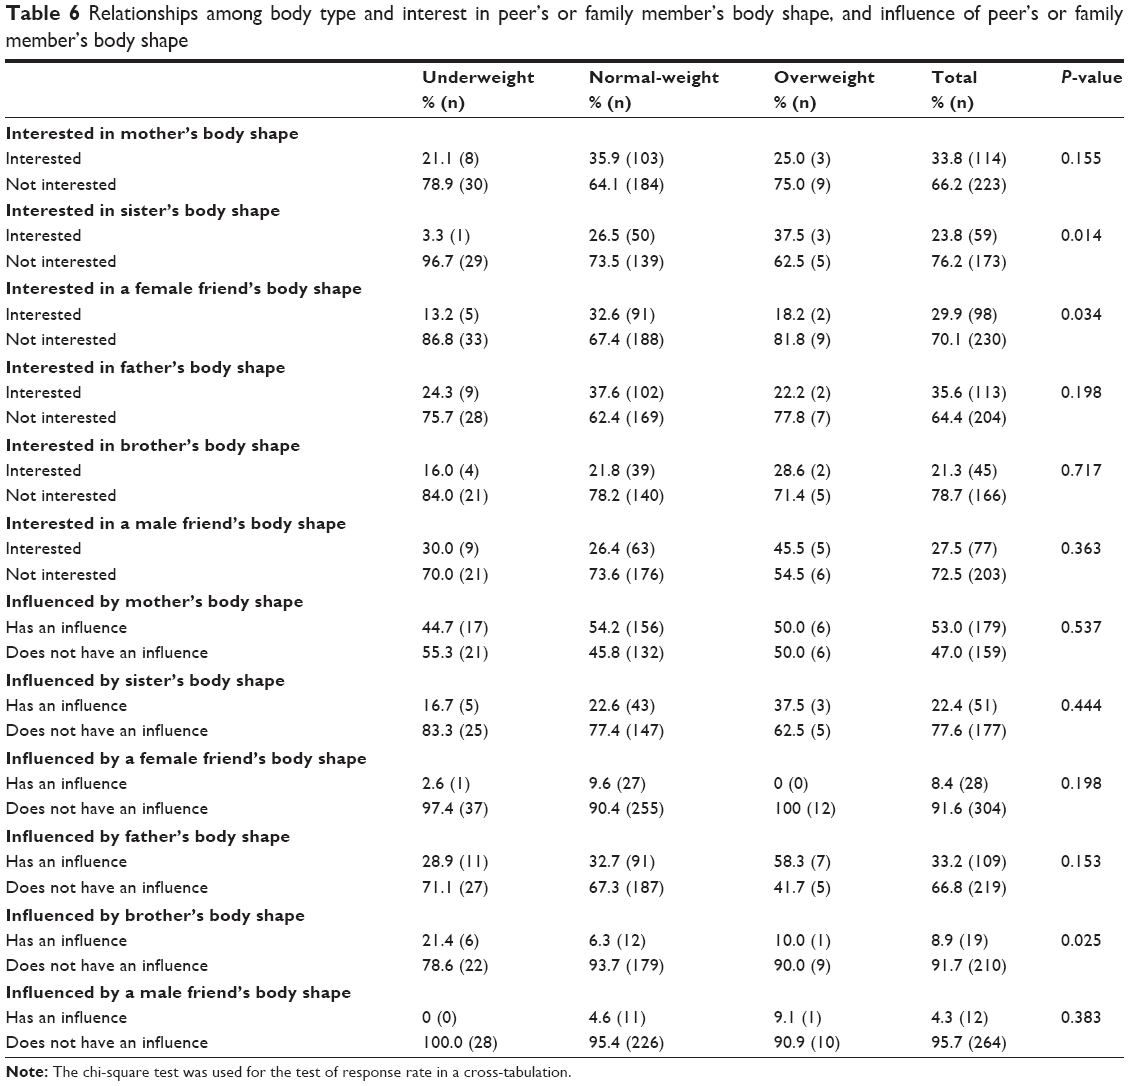 | Table 6 Relationships among body type and interest in peer’s or family member’s body shape, and influence of peer’s or family member’s body shape |
The logistic regression model, which was used to explore the association between a desire for thinness and interest in sister’s body shape, interest in a female friend’s body shape, and influence of brother’s body shape, is presented in Table 7. Participants who were interested in a female friend’s body shape were almost three times more likely to have a desire for thinness than those who were not interested in a female friend’s body shape (odds ratio: 3.06, P=0.014).
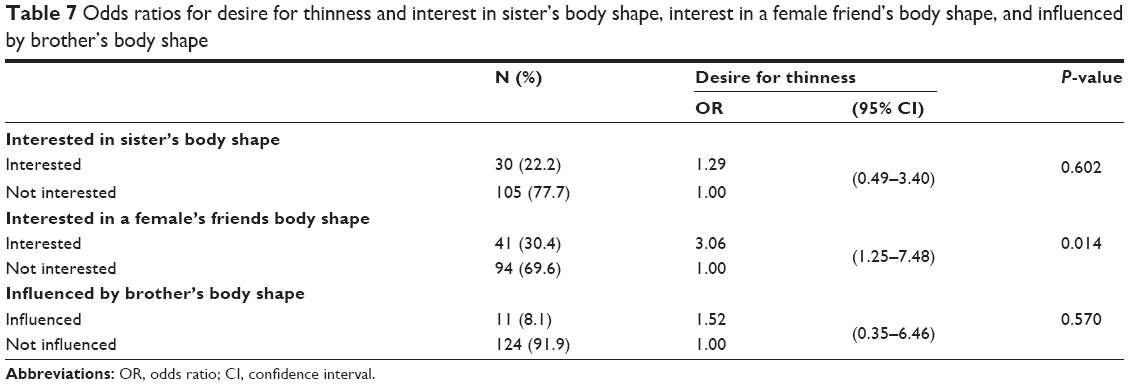 | Table 7 Odds ratios for desire for thinness and interest in sister’s body shape, interest in a female friend’s body shape, and influenced by brother’s body shape |
Discussion
The present study investigated the relationship between Japanese female students’ desire for thinness and the body shape of people close to them, such as family members or friends. The main findings demonstrated that many participants overestimated their body shapes and had a desire for thinness. One of the main reasons for this overestimation was comparison with themselves and others. The results of the logistic regression analysis showed that the interest in a female friend’s body shape was positively associated with a desire for thinness.
In the present study, most of the underweight and normal-weight participants considered themselves fat. In a previous study, Nakai et al showed that 20.7% of underweight students, 76.4% of normal-weight students, and 100% of fat students considered themselves fat.7 Mase et al also reported similar results.23 Thus, the present results are consistent with previous results. In addition, in the present study, the reason why the participants believed that they were obese was mainly comparison with their past selves and with others, and not their actual body weight or percent body fat. This result indicated that absolute numbers, such as body weight or percent body fat, were not always useful information for young females in deciding whether they were obese. Therefore, the present study indicated that many participants misunderstood their body shape.
In addition, the ideal body weight in this study was lower than the current body weight in the normal-weight or overweight participants and was not different from the current body weight in the underweight participants. This result indicated that the normal-weight or overweight participants had a desire for thinness and that the underweight participants had a desire to stay thin. Previous studies have shown similar results.7 It has been reported that the desire for thinness in young females is due to their misunderstanding about their own body shape.19,42 Indeed, the results of the present study indicated that many of the participants had a false impression regarding their body shape. In addition, with respect to the reason for the desire for thinness, most participants responded for beauty and the responses were similar among body types. Thus, participants of any body type had a desire for thinness or to stay thin, mainly for reasons of beauty. Few previous studies have evaluated whether beauty is the primary reason for Japanese females desire for thinness. However, it has been shown that females feel the pressure to meet the thin-ideal standard of beauty,43,44 which may have some association with the present results.
The ideal body weights in the underweight, normal-weight, and overweight participants were 43.4 kg, 46.2 kg, and 49.6 kg, respectively. In a previous study, Nakai et al indicated that the ideal body weights were 43.0 kg in the underweight participants, 47.2 kg in the normal-weight participants, and 50.4 kg in the overweight participants,7 which are consistent with our results. Furthermore, these results suggested that the ideal body weight varied according to the current body weight. The ideal BMI was also different among the groups in the present study (17.1 kg/m2 in the underweight, 18.6 kg/m2 in the normal-weight, and 19.9 kg/m2 in the overweight participants). Previous studies have shown similar results.19 These results indicate that the extent of thinness depends on the individual’s current weight. The reason for this is unclear; however, those who considered themselves obese judged this by comparing their present selves with their past selves or with others, and not by evaluating their own body weight or percent body fat. Therefore, those who have a desire for thinness may have their own goals in accordance with their body weights, which may be appropriate for them.
The present study revealed that most of the participants had a desire for thinness or to stay thin and that most of them judged their body shape by comparison with their past selves or with others. In addition, the total score and the first factor (dieting) score of the EAT-26 were higher in the desire group than in the non-desire group. These results indicate that a desire for thinness is linked to dieting behavior and are consistent with those of a previous study.7 Moreover, a major reason for a desire to be thin was for beauty, which may imply that the participants were concerned about what other people think of their physical appearance. Therefore, other people’s body shapes can have an influence on a female’s perception of her body shape or her desire for thinness. This possibility is not inconsistent with the findings of previous studies, which reported that women compare their bodies with other women’s bodies as a guide for how to look and to evaluate their worth.25 Logistic regression analysis showed that interest in a female friend’s body shape was associated with a desire for thinness. This result suggests that the desire for thinness in young females is influenced by the body shapes of their close female friends. There is little evidence that friends have an influence on the desire for thinness. However, it has been reported that a friend’s desire for thinness is associated with dieting behaviors.33,34 Berge et al have also demonstrated that young adult women may benefit from the support of others regarding weight and weight-related health behaviors.45 From these results, it is possible that the perception of body shape or the desire for thinness in university-aged females can be influenced by a friend’s body shape.
Limitations
The limitations of this study should be noted. First, the present study had a cross-sectional design, which did not allow for conclusions to be drawn about any cause-and-effect relationship. Second, the samples were collected from a limited area (all of the female students attended universities or colleges in Kyoto Prefecture, Japan). Future studies will need to gather samples from a wider area and to employ a longitudinal design for an estimation of any cause-and-effect relationship. Third, the present participants were Japanese students. Generally, Japanese individuals are considerably thinner and shorter than age-matched North American and European individuals. Therefore, it may be difficult to generalize the present results. Fourth, some self-reported questionnaires used in the present study have not been sufficiently validated.
Conclusion
This study investigated the relationship between a desire for thinness and the body shapes of people close to university-aged females, such as family members or friends. The main findings demonstrated that many female students overestimated their body shape and had a desire for thinness. The reason for overestimation was comparison with their past selves or with others. The results of logistic regression analysis indicated that the interest in a female friend’s body shape was positively associated with a desire for thinness. These results indicate a possibility that close friends have an influence on the desire for thinness or the perception of body shape.
Acknowledgments
The authors thank the participants of the study. A part of the research study was supported by Grant-in-Aid for Scientific Research (c) No 26440267 and by Grant-in-Aid for JSPS Fellows No 13J02216.
Disclosure
The authors report no conflicts of interest in this work.
References
Cash TF. Body image: past, present, and future. Body Image. 2004;1(1): 1–5. | ||
Kaplan SL, Busner J, Pollack S. Perceived weight, actual weight, and depressive symptoms in a general adolescent sample. Int J Eat Disord. 1988;7(1):107–113. | ||
ter Bogt TF, van Dorsselaer SA, Monshouwer K, Verdurmen JE, Engels RC, Vollebergh WA. Body mass index and body weight perception as risk factors for internalizing and externalizing problem behavior among adolescents. J Adolesc Health. 2006;39(1):27–34. | ||
Park E. Overestimation and underestimation: adolescents’ weight perception in comparison to BMI-based weight status and how it varies across socio-demographic factors. J Sch Health. 2011;81(2):57–64. | ||
Evans EH, Tovee MJ, Boothroyd LG, Drewett RF. Body dissatisfaction and disordered eating attitudes in 7- to 11-year-old girls: testing a sociocultural model. Body Image. 2013;10(1):8–15. | ||
Kaneko K, Kiriike N, Ikenaga K, Miyawaki D, Yamagami S. Weight and shape concerns and dieting behaviours among pre-adolescents and adolescents in Japan. Psychiatry Clin Neurosci. 1999;53(3): 365–371. | ||
Nakai Y, Sato M, Tamura K, Sugiura M, Hayashi J. Change of eating disorders among female college students during past 20 years. Clin Psychiatry. 2003;45:1319–1322. | ||
Rohde P, Stice E, Marti CN. Development and predictive effects of eating disorder risk factors during adolescence: implications for prevention efforts. Int J Eat Disord. 2015;48(2):187–198. | ||
Wardle J, Haase AM, Steptoe A. Body image and weight control in young adults: international comparisons in university students from 22 countries. Int J Obes (Lond). 2006;30(4):644–651. | ||
Brug J, Wammes B, Kremers S, Giskes K, Oenema A. Underestimation and overestimation of personal weight status: associations with socio-demographic characteristics and weight maintenance intentions. J Hum Nutr Diet. 2006;19(4):253–262. | ||
Mendes V, Araujo J, Lopes C, Ramos E. Determinants of weight loss dieting among adolescents: a longitudinal analysis. J Adolesc Health. 2014;54(3):360–363. | ||
Grinspoon S, Thomas E, Pitts S, et al. Prevalence and predictive factors for regional osteopenia in women with anorexia nervosa. Ann Intern Med. 2000;133(10):790–794. | ||
Selzer R, Caust J, Hibbert M, Bowes G, Patton G. The association between secondary amenorrhea and common eating disordered weight control practices in an adolescent population. J Adolesc Health. 1996;19(1): 56–61. | ||
Slupik RI. Managing adolescents with eating disorders. Int J Fertil Womens Med. 1999;44(3):125–130. | ||
Nishida T, Sakakibara H. Association between underweight and low lymphocyte count as an indicator of malnutrition in Japanese women. J Womens Health. 2010;19(7):1377–1383. | ||
Muro-Sans P, Amador-Campos JA. Prevalence of eating disorders in a Spanish community adolescent sample. Eat Weight Disord. 2007; 12(1):e1–e6. | ||
Ministry of Health Law. Results of year 2012 National Health and Nutrition Survey. 2012. Available from: http://www.mhlw.go.jp/bunya/kenkou/eiyou/h22-houkoku.html. Accessed December 31, 2014. | ||
Fryar CD, Carroll MD, Ogden CL. Prevalence of overweight, obesity, and extreme obesity among adults: United States, 1960–1962 through 2011–2012. NCHS Health E-Stat. Available from: http://www.cancer-pain.org/. Accessed April 1, 2015. | ||
Hayashi F, Takimoto H, Yoshita K, Yoshiike N. Perceived body size and desire for thinness of young Japanese women: a population-based survey. Br J Nutr. 2006;96(6):1154–1162. | ||
Nishizawa Y, Kida K, Nishizawa K, Hashiba S, Saito K, Mita R. Perception of self-physique and eating behavior of high school students in Japan. Psychiatry Clin Neurosci. 2003;57(2):189–196. | ||
Ohara K, Kato Y, Mase T, et al. Eating behavior and perception of body shape in Japanese university students. Eat Weight Disord. 2014; 19(4):461–468. | ||
Ikeda J. Desire for slenderness in adolescent women: transition during 14 years in dietetic students of a junior college. Jpn J Public Health. 2008;55(11):777–785. | ||
Mase T, Miyawaki C, Kouda K, Fujita Y, Ohara K, Nakamura H. Relationship of a desire of thinness and eating behavior among Japanese underweight female students. Eat Weight Disord. 2013;18(2): 125–132. | ||
Festinger L. A theory of social comparison processes. Human Relations. 1954;7(2):117–140. | ||
Tylka T, Sabik N. Integrating social comparison theory and self-esteem within objectification theory to predict women’s disordered eating. Sex Roles. 2010;63(1–2):18–31. | ||
Keery H, van den Berg P, Thompson JK. An evaluation of the Tripartite Influence Model of body dissatisfaction and eating disturbance with adolescent girls. Body Image. 2004;1(3):237–251. | ||
van den Berg P, Thompson JK. Self-schema and social comparison explanations of body dissatisfaction: a laboratory investigation. Body Image. 2007;4(1):29–38. | ||
Schwartz DJ, Phares V, Tantleff-Dunn S, Thompson JK. Body image, psychological functioning, and parental feedback regarding physical appearance. Int J Eat Disord. 1999;25(3):339–343. | ||
Ata R, Ludden A, Lally M. The effects of gender and family, friend, and media influences on eating behaviors and body image during adolescence. J Youth Adolescence. 2007;36(8):1024–1037. | ||
Wertheim EH, Paxton SJ, Schutz HK, Muir SL. Why do adolescent girls watch their weight? An interview study examining sociocultural pressures to be thin. J Psychosom Res. 1997;42(4):345–355. | ||
Britton LE, Martz DM, Bazzini DG, Curtin LA, Leashomb A. Fat talk and self-presentation of body image: is there a social norm for women to self-degrade? Body Image. 2006;3(3):247–254. | ||
Bosveld W, Koomen W, van der Pligt J. Selective exposure and the false consensus effect: the availability of similar and dissimilar others. Br J Soc Psychol. 1994;33(4):457–466. | ||
Crandall CS. Social contagion of binge eating. J Pers Soc Psychol. 1988;55(4):588–598. | ||
Watts WD, Ellis AM. Drug abuse and eating disorders: prevention implications. J Drug Educ. 1992;22(3):223–240. | ||
Murakami K, Sasaki S, Okubo H, Takahashi Y. Neighborhood socioeconomic status in relation to dietary intake and body mass index in female Japanese dietetic students. Nutrition. 2009;25(7–8):745–752. | ||
Murakami K, Sasaki S, Okubo H, Takahashi Y, Hosoi Y, Itabashi M. Monetary costs of dietary energy reported by young Japanese women: association with food and nutrient intake and body mass index. Public Health Nutr. 2007;10(12):1430–1439. | ||
Okubo H, Sasaki S, Murakami K, et al; Freshmen in Dietetic Courses Study II Group. Dietary patterns associated with functional constipation among Japanese women aged 18 to 20 years: a cross-sectional study. Nutr Sci Vitaminol. 2007;53(3):232–238. | ||
Thompson MA, Gray JJ. Development and validation of a new body-image assessment scale. J Pers Assess. 1995;64(2):258–269. | ||
Mukai T, Crago M, Shisslak CM. Eating attitudes and weight preoccupation among female high school students in Japan. J Child Psychol Psychiatry. 1994;35(4):677–688. | ||
Mukai T, Kambara A, Sasaki Y. Body dissatisfaction, need for social approval, and eating disturbances among Japanese and American college women. Sex Roles. 1998;39(9–10):751–763. | ||
Garner DM, Olmsted MP, Bohr Y, Garfinkel PE. The eating attitudes test: psychometric features and clinical correlates. Psychol Med. 1982;12(4):871–878. | ||
Sano A, Le DS, Tran MH, et al. Study on factors of body image in Japanese and Vietnamese adolescents. J Nutr Sci Vitaminol. 2008; 54(2):169–175. | ||
Phan T, Tylka TL. Exploring a model and moderators of disordered eating with Asian American college women. J Couns Psychol. 2006; 53(1):36–47. | ||
Stice E, Schupak-Neuberg E, Shaw HE, Stein RI. Relation of media exposure to eating disorder symptomatology: an examination of mediating mechanisms. J Abnorm Psychol. 1994;103(4):836–840. | ||
Berge JM, MacLehose R, Eisenberg ME, Laska MN, Neumark-Sztainer D. How significant is the ‘significant other’? Associations between significant others’ health behaviors and attitudes and young adults’ health outcomes. Int J Behav Nutr Phys Act. 2012;9:35. |
 © 2015 The Author(s). This work is published and licensed by Dove Medical Press Limited. The full terms of this license are available at https://www.dovepress.com/terms.php and incorporate the Creative Commons Attribution - Non Commercial (unported, v3.0) License.
By accessing the work you hereby accept the Terms. Non-commercial uses of the work are permitted without any further permission from Dove Medical Press Limited, provided the work is properly attributed. For permission for commercial use of this work, please see paragraphs 4.2 and 5 of our Terms.
© 2015 The Author(s). This work is published and licensed by Dove Medical Press Limited. The full terms of this license are available at https://www.dovepress.com/terms.php and incorporate the Creative Commons Attribution - Non Commercial (unported, v3.0) License.
By accessing the work you hereby accept the Terms. Non-commercial uses of the work are permitted without any further permission from Dove Medical Press Limited, provided the work is properly attributed. For permission for commercial use of this work, please see paragraphs 4.2 and 5 of our Terms.