")
Back to Journals » Clinical Ophthalmology » Volume 16
Influence of the Size of the Foveal Avascular Zone on Functional and Morphological Parameters in Patients with Early-Stage Diabetic Retinopathy
Authors Storch MW , Zinser G, Lauermann P , Khattab MH, Nguyen-Höhl A, Raddatz D, Gollisch K, Callizo J, Hoerauf H, Feltgen N
Received 26 January 2022
Accepted for publication 28 March 2022
Published 21 April 2022 Volume 2022:16 Pages 1207—1213
DOI https://doi.org/10.2147/OPTH.S358467
Checked for plagiarism Yes
Review by Single anonymous peer review
Peer reviewer comments 4
Editor who approved publication: Dr Scott Fraser
Marcus Werner Storch,1 Greta Zinser,1 Peer Lauermann,1 Mohammed Haitham Khattab,1 Anna Nguyen-Höhl,1 Dirk Raddatz,2 Katja Gollisch,2 Josep Callizo,1 Hans Hoerauf,1 Nicolas Feltgen1
1Department of Ophthalmology, University of Göttingen, Göttingen, Niedersachsen, Germany; 2Department of Gastroenterology, Gastrointestinal Oncology and Endocrinology, University of Göttingen, Göttingen, Niedersachsen, Germany
Correspondence: Marcus Werner Storch, Department of Ophthalmology, University of Göttingen, Robert-Koch-Str. 40, Göttingen, 37075, Germany, Tel +49-551-39-63580, Fax +49-551-39-63582, Email [email protected]
Purpose: To correlate functional and morphological parameters with foveal avascular zone’s (FAZ) size in diabetic patients with mild to moderate stage nonproliferative diabetic retinopathy.
Methods: Monocentric and prospective study of a consecutive case series of diabetic patients. Medical history, best corrected visual acuity (BCVA), best corrected high/low contrast visual acuity (BChcVA/BClcVA), mean sensitivity (MS) and mean defect (MD) in central visual field testing, and FAZ size in fluorescein-angiography (FAG) were recorded. Macular thickness (central point thickness CPT, central subfield thickness CST) and volume measurements (central subfield volume CSV, total macular volume) were taken from SD-OCT (6x6mm ETDRS-grid). Groups were categorised as presenting FAZ sizes smaller (G1) or larger (G2) than 0.35mm2. Smallest (Q1) and largest quartiles (Q3) were also compared.
Results: Thirty-six of 40 patients were included. MS differed significantly between G1 (n = 6) and G2 (n = 30), and BChcVA/BClcVA as well as TMV correlated significantly with FAZ size in correlation analysis. Mean HbA1c tended to be lower in G1 than G2. Patients in G1 were slightly older than in G2. Treatment period with insulin was shorter in G1/Q1 than in G2/Q3. CPT and TMV were lower in G1/Q1 than in G2/Q3. Our analysis of the FAZ in terms of patient age, HbA1c, disease duration and insulin therapy duration revealed no significance. That lack of significance also applies to BCVA, MS, MD, CPT, CST and CSV.
Conclusion: As significantly associated, contrast sensitivity, central visual field parameters and potentially retinal thickness or volume seem to be suitable to detect early macular ischaemia. However, we failed to establish any correlation between FAZ and BCVA.
Keywords: foveal avascular zone, contrast vision, visual acuity, fluorescein angiography, diabetic retinopathy, ischemia
Introduction
Diabetic maculopathy (DMP) with or without macular edema associated with diabetic retinopathy (DR) is one if the main causes of visual impairment among patients with diabetes mellitus (DM). Due to the worldwide increasing diabetic prevalence, DR is a frequent ocular condition with an estimated incidence of over 30% among diabetic patients.1
Although diabetic maculopathy may be hardly clinically visible, macular oedema can be detected via optical coherence tomography (OCT). Besides, fluorescein angiography (FAG) allows the detection of characteristic diabetic retinal findings such as microaneurysms, vascular abnormalities, vascular leakage, macular ischaemia and changes of the foveal avascular zone (FAZ). An ischaemic maculopathy presenting with substantial increase of the FAZ usually correlates with a loss of visual function.2–5 However, it is not uncommon in the clinical practice to angiographically detect an enlarged FAZ in patients without severe symptoms. We therefore attempted to correlate central visual function parameters with the extent of FAZ enlargement, and sought any other morphological changes that might indicate an enlarged FAZ for early detection.
Methods
This study was designed as a consecutive case series of patients recruited between November 2015 and June 2016 from both our ophthalmological and diabetes outpatient clinic. This enabled a cohort amounting 40 patients. The study was approved by the local ethics committee (DOK_318_2015). The eye with better BCVA of each patient was included in the study. The inclusion criteria were as follows: written informed consent, clear optical media with no impact on macular function or fundus visibility, no allergy to fluorescein dye, no detectable macular oedema in OCT, no other (ophthalmological) diseases affecting macular function (eg, retinal vein occlusion, epiretinal membranes or macular hole, glaucoma, uveitis). Patients with signs of severe non-proliferative or proliferative disease were excluded according to criteria by ETDRS-severity-grading.
A complete dataset including the patients’ entire medical history was created for every participant. BCVA was tested with ETDRS charts (Precision Vision, Illinois, USA) and best-corrected high and low contrast visual acuity (BCcVA) was tested with the Bailey-Lovie chart set (Swiss Version, A. Schweizer GmbH, Forchheim, Switzerland). Central visual field was examined with the Octopus 900 perimeter using the central 10 degrees program M2x (Haag-Streit, Wedel, Germany). Spectral-domain optical coherence tomography (SD-OCT) images were acquired with Heidelberg Spectralis SD-OCT (6x6mm ETDRS; Heidelberg Engineering, Heidelberg, Germany). Fundus photography and FAG images were acquired with the Zeiss FF450 plus IR (Carl Zeiss meditec, Oberkochen, Germany). An index line was generated with the Zeiss software to enable distance measurements in all images (automatically calculated by Zeiss software). The FAZ perimeter was delineated independently by two experienced retina specialists (NF, JC). The FAZ area was then calculated with ImageJ (https://imagej.nih.gov/ij/). Results of both raters were averaged. The patients also underwent thorough ophthalmological examination of the anterior and posterior segment in mydriasis.
For statistical analysis, threshold FAZ was defined as lower or equal to (G1) and as greater than (G2) 0.35mm2. This value was set as a mean of those in literature, which differ widely but mostly between 0.2 and 0.5 mm2.6–14 We also ranked all the FAZ values and opposed the lowest (Q1) and highest (Q3) quartiles. Statistical Analysis Software SAS was used (Cary, North Carolina, USA). Group-independent regression was analyzed via Pearson correlation coefficient (PCC). For statistical significance a score of less than or equal to 0.05 was defined as significant.
Results
Thirty-six eyes of 36 patients met our inclusion criteria and yielded a full set of evaluable data. Mean age was 61.4 years (standard deviation SD ± 15.2), 12 left eyes and 24 right eyes were included. Six patients suffered from type 1 diabetes, 24 from type 2, 1 after pancreatectomy. We had no data on the type of DM in 5 patients.
Mean HbA1c was 7.6% (SD ± 1.5); it did not differ significantly between G1/G2 (p = 0.2) or Q1/Q2 (p = 0.44). Mean time since diagnosis of DM was longer in type 1 than in type 2 participants. Of 36 patients, 24 had been taking insulin for 16.8 years (SD ± 9.8), the rest was on oral medication or diet. The duration of insulin therapy in type 1 DM patients was much longer than in type 2 DM. The complete demographics including spherical equivalents and DM-related data are found in Table 1.
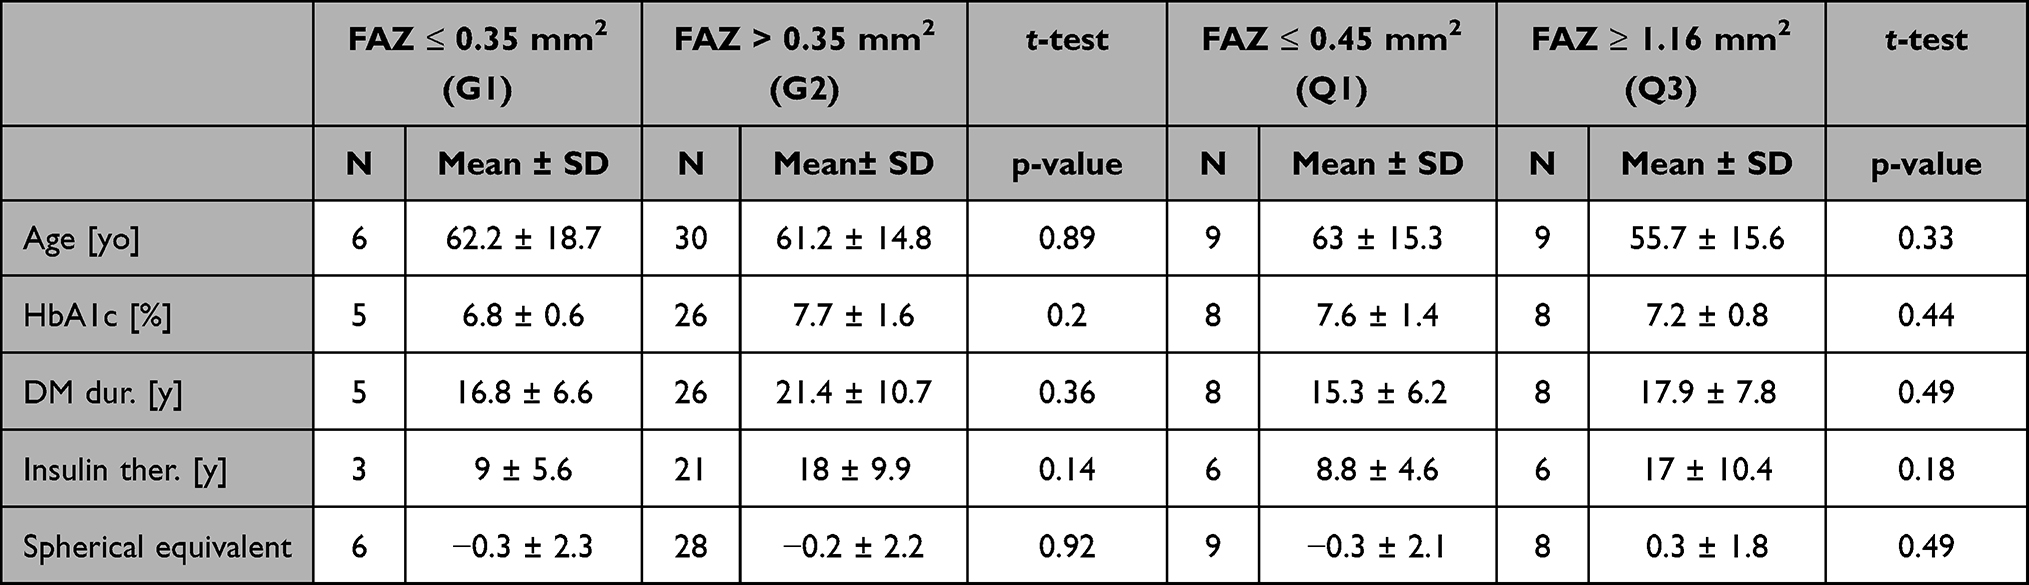 |
Table 1 Demographic and Diabetes Related Data per Group (G1/G2) and Quartile (Q1/Q3) |
BCVA revealed no statistical relevance (p-values in Table 2). Mean VA (LogMAR) was 0.04 for G1 and Q2 respectively 0.12 for G2 and Q3. BCVA distribution is shown in Table 2 along with best corrected high (BChcVA) and low (BClcVA) contrast visual acuity scores, mean sensitivity (MS) and mean defect (MD) in perimetry and all data from SD-OCT (central point thickness (CPT), central subfield thickness (CST), central subfield volume (CSV), total macular volume (TMV)). The only parameter that reached statistical significance was the mean sensitivity (MS) in the group analysis of G1 vs G2 (p = 0.04).
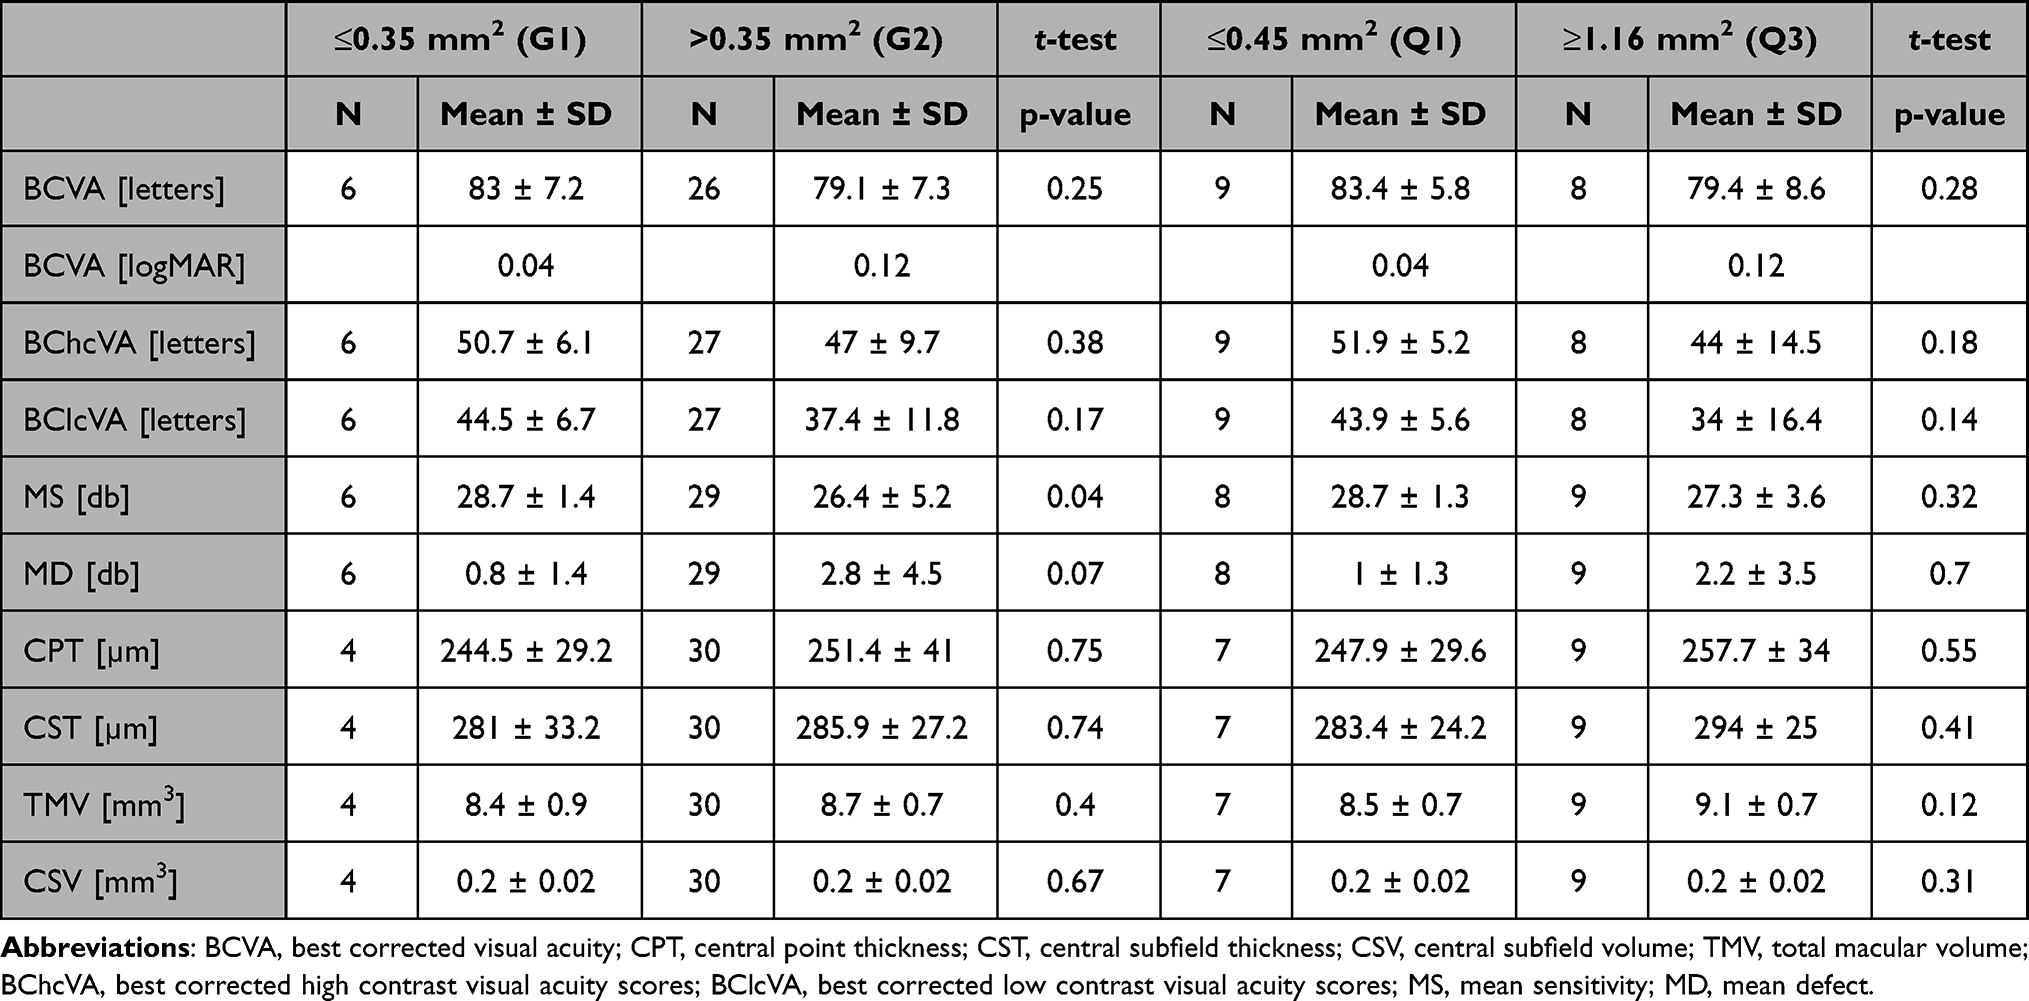 |
Table 2 Functional and Morphological Data per Group (G1/G2) and Quartile (Q1/Q3) |
We also checked for false-positives (fp) and false-negatives (fn) to ensure the test quality of perimetry. If there were more than 5 out of 15 fp or fn per run (33,3%) that perimetry was not included in the analysis.
The inter-rater-correlation for FAZ measurements was excellent (Pearson’s correlation coefficient 0.94; p < 0.0001). FAZ size was 0.896 mm2 on average with a SD of ± 0.598 mm2 (min. 0.305 mm2, max. 2.497 mm2).
Correlation analysis of FAZ versus age, HbA1c, duration of DM, duration of therapy with insulin, BCVA, MS, MD, CPT, CST and CSV were all insignificant. All those correlation coefficients and p-values are displayed in Table 3.
 |
Table 3 Pearson’s Correlation Coefficient PCC and p-values for Regression Analysis |
We identified statistically significant correlations of the FAZ size with BChcVA (PCC −0.38; p = 0.03) and BClcVA (PCC −0.41; p = 0.02) contrast scores as well as with TMV (PCC 0.35; p = 0.04) (Figures 1–3).
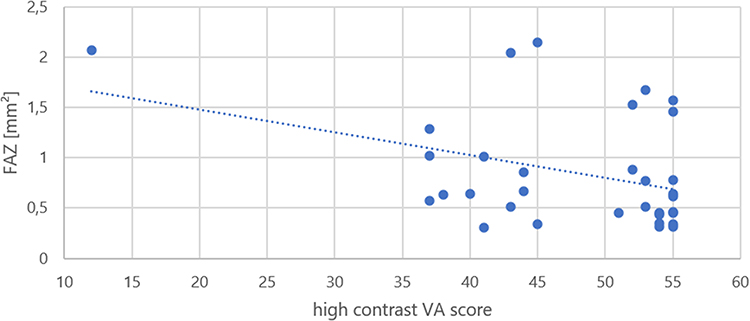 |
Figure 1 Mean FAZ versus high contrast visual acuity score (Pearson’s correlation coefficient −0.38; p=0.03). |
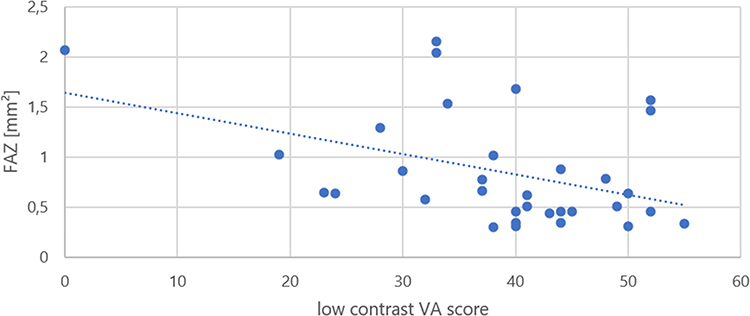 |
Figure 2 Mean FAZ versus low contrast visual acuity score (Pearson’s correlation coefficient −0.41; p=0.02). |
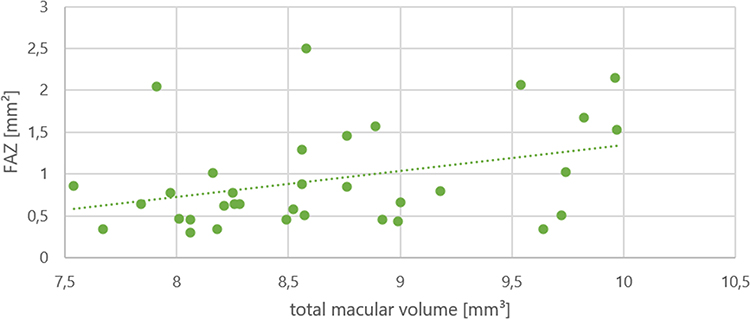 |
Figure 3 Mean FAZ versus total macular volume [mm3] (Pearson’s correlation coefficient 0.35; p=0.04). |
Discussion
Our study population was largely representative in terms of age and type of diabetes when compared to the distribution in the general population.15 We had a few more type 1 diabetes patients than usual, which we attribute to our recruitment process and the small sample size. That factor yielded no statistically significant influence, but it must be taken into account when interpreting the data. Also, one must be aware that G2 included much more patients than G1 due to recruitment of diabetic patients (in respect of the assumption that FAZ is bigger in diabetics).
One main aim of this study was to determine whether FAZ enlargement affects BCVA or not. In our cohort with early-stage diabetes, we observed a tendency towards better BCVA coinciding with smaller FAZ size. We detected a mean difference of 4 ETDRS letters between G1 and G2. This applied also to our quartile analysis, but both correlations were insignificant. A larger FAZ correlates with reduced BCVA in the literature,5 which seems to apply not just to diabetic patients, but also to patients with retinal vein occlusion and even to microvascular structure after macula-off retinal detachments. On the other hand, mildly increased FAZ areas do not seem to influence BCVA. We failed to identify any significant correlation in our study, which may be attributable to our patients’ smaller FAZ areas.
Although visual acuity itself did not suffer, we detected a significant correlation between reduced BChcVA and BClcVA with increasing FAZ size. There is evidence that contrast sensitivity testing is a strong indicator for early-stage diabetic anomalies while visual acuity remains intact and funduscopic evidence of DR lacks.16 As early as 1982, Ghafour et al showed a loss of CS between patients with DR and controls without DM. The subgroup analysis of their diabetic patients showed that this loss of function was already evident in none-to-mild cases of DR, but it became even worse in patients in later stages of DR.17 Since many ocular pathologies can influence CS (cataract, optical factors like aberrations or scatter or diffraction, ocular hypertension, glaucoma, optic nerve diseases, Parkinson’s disease, etc.)18,19 we excluded patients with any of these diseases.
That DR influences visual field was observed quite early, too. In 1984 Federman et al proved that perfusion deficits lead to focal defects in static visual field testing in diabetic patients. This was especially relevant for patients suffering from moderate to severe diabetic retinopathy. Visual field defects were usually located in the central midperiphery between 20 and 45 degrees from the center, and always congruent with areas of retinal nonperfusion in FAG.20 Several other studies have shown the impact of early-stage diabetic retinopathy on visual field testing results.21–23 Similarly, we also detected significant correlations between an enlarged FAZ and mean sensitivity in the central visual field among our patients.
A statistically significant correlation between FAZ and HbA1c or the duration of DM in our patients in early stages of DR was not identified. However, there was a tendency towards higher HbA1c and longer-lasting DM in patients with a larger FAZ. Other studies have demonstrated significant correlations between HbA1c and diabetic retinopathy,24 and with diabetic cataract, diabetic nephropathy, diabetic neuropathy, and diabetic cardiomyopathy.25 Since blood glucose values only represent a snapshot and the HbA1c is also considered an average value from the last 2–3 months, the current value does not necessarily reflect previous glucose levels. It is therefore not always possible to draw conclusions about the integrity of retinal function or morphology from a patient’s current HbA1c.
Individually however, the variability of both size and morphology of the FAZ represents a problem when it comes to providing a threshold above which further enlargement might be an indicator for functional loss or morphological anomalies (and in the indication for intravitreal drug therapy when macular edema is associated with ischaemia). Furthermore, an enlarged FAZ size might not be the only problem, as impaired perfusion in a formally (angiographically) still-vascularized perifoveal network could influence vision as well. Although preserved yet inadequate blood flow and the ensuing insufficient oxygen supply might not be visible in imaging, they can still affect function.
Other challenges associated with measuring the FAZ include the lack of age and gender standardisation11 as well as differences between manufacturers applying the same technical concept.10 Different groups have described the FAZ area employing different values depending on how the images are obtained (FAG, OCT-angiography (OCTA), scanning-laser-ophthalmoscopy) and if the FAZ was delineated manually or automatically; nevertheless, some groups have reported similar findings when measuring the superficial capillary plexus in OCTA and FAG.6–13 Values mentioned for a normal FAZ size are mostly between 0.2 and 0.5 mm2, but larger values have also been described. John et al found FAZ sizes around 0.28 ± 0.07 mm2 to be normal. They also emphasised that it is essential to use adequate brightness and contrast settings to analyse images since darker images and lower contrast can cause the FAZ size to be overestimated.9 Our (diabetic) cohort revealed FAZ sizes of 0.9 (± 0.6) mm2 on average for early-stage DM. Only 6 patients had FAZ sizes below our cut-off (0.35mm2), 11 were below 0.5 mm2. Di et al compared eyes of patients with DM to a control group. They used OCT-A but found values of approximately 0.36 mm2 to be normal. In contrast, patients with DM (with or without signs of any DR stage) had FAZ sizes above 0.4 mm2 (up to 0.47 mm2 in proliferative stages).7 Some of these values are much lower than ours (especially in view of the severe stage), which might be due to the imaging technique and higher resolution or better visualisation of the smallest vessels with OCTA.
Furthermore, we found positive correlations between FAZ size and CPT, CST, and TMV (the larger, the thicker), in line with current knowledge.26 However, only our regression analysis of TMV proved to be statistically significant. We hypothesize that these correlations can only apply to the early to mild/moderate stages of DR, since its severe stages (involving the further enlargement of ischaemic areas) are characterised by retinal atrophy and thus reduced thickness12,27,28 - factors not addressed in this study. Another limitation of this study is the small study population.
Conclusion
There is evidence that longer-lasting and poorly controlled DM promotes the enlargement of the FAZ in diabetic retinopathy, but this does not always influence a patient’s visual function.29 As FAZ sizes vary physiologically so widely among individuals it is difficult to provide a threshold for visually-impairing FAZ enlargement in DR. In consequence, no clear limit can be specified beyond which FAZ enlargement is associated with an irreversible loss of function.
As a result of this study, we found no evidence that visual acuity functions as a reliable indicator for existence or worsening of an enlarged FAZ size in patients with early-stage DR. But contrast vision as another important visual function was a statistically significant associated parameter and correlated with ischaemic changes in our study, which may serve to clinically monitor a diabetic patient over time. A decrease of contrast sensitivity may act as an indicator for FAZ size enlargement where other causes are not clinically evident, as it shows an inverse correlation with the FAZ size. Also, when monitoring these patients, it might be helpful to consider TMV, as it proved to significantly correlate with FAZ size.
Ethics
Ethics vote is available. The study complies with Declaration of Helsinki.
Funding
There was no funding.
Disclosure
Prof. Dr. Nicolas Feltgen reports personal fees from Novartis, personal fees from Bayer, personal fees from Roche, personal fees from Allergan, personal fees from Heidelberg, personal fees from Alimera, outside the submitted work. The authors state that there are no other conflict of interests.
References
1. Yau JWY, Rogers SL, Kawasaki R, et al. Global prevalence and major risk factors of diabetic retinopathy. Diabetes Care. 2012;35(3):556–564. doi:10.2337/dc11-1909
2. Sakata K, Funatsu H, Harino S, Noma H, Hori S. Relationship of macular microcirculation and retinal thickness with visual acuity in diabetic macular edema. Ophthalmology. 2007;114(11):2061–2069. doi:10.1016/j.ophtha.2007.01.003
3. Tang F, Sun Z, Wong R, et al. Relationship of intercapillary area with visual acuity in diabetes mellitus: an optical coherence tomography angiography study. Br J Ophthalmol. 2018. doi:10.1136/bjophthalmol-2018-312010
4. Lynch G, Romo JSA, Linderman R, et al. Within-subject assessment of foveal avascular zone enlargement in different stages of diabetic retinopathy using en face OCT reflectance and OCT angiography. Biomed Opt Express. 2018;9(12):5982–5996. doi:10.1364/BOE.9.005982
5. Balaratnasingam C, Inoue M, Ahn S, et al. Visual acuity is correlated with the area of the foveal avascular zone in diabetic retinopathy and retinal vein occlusion. Ophthalmology. 2016;123(11):2352–2367. doi:10.1016/j.ophtha.2016.07.008
6. Chui TYP, VanNasdale DA, Elsner AE, Burns SA. The association between the foveal avascular zone and retinal thickness. Invest Ophthalmol Vis Sci. 2014;55(10):6870–6877. doi:10.1167/iovs.14-15446
7. Di G, Weihong Y, Xiao Z, et al. A morphological study of the foveal avascular zone in patients with diabetes mellitus using optical coherence tomography angiography. Graefes Arch Clin Exp Ophthalmol. 2016;254(5):873–879. doi:10.1007/s00417-015-3143-7
8. Carpineto P, Mastropasqua R, Marchini G, Toto L, Di Nicola M, Di Antonio L. Reproducibility and repeatability of foveal avascular zone measurements in healthy subjects by optical coherence tomography angiography. Br J Ophthalmol. 2016;100(5):671–676. doi:10.1136/bjophthalmol-2015-307330
9. John D, Kuriakose T, Devasahayam S, Braganza A. Dimensions of the foveal avascular zone using the Heidelberg retinal angiogram-2 in normal eyes. Indian J Ophthalmol. 2011;59(1):9–11. doi:10.4103/0301-4738.73706
10. Magrath GN, Say EAT, Sioufi K, Ferenczy S, Samara WA, Shields CL. Variability in foveal avascular zone and capillary density using optical coherence tomography angiography machines in healthy eyes. Retina. 2017;37(11):2102–2111. doi:10.1097/IAE.0000000000001458
11. Ghassemi F, Mirshahi R, Bazvand F, Fadakar K, Faghihi H, Sabour S. The quantitative measurements of foveal avascular zone using optical coherence tomography angiography in normal volunteers. J Curr Ophthalmol. 2017;29(4):293–299. doi:10.1016/j.joco.2017.06.004
12. Choi W, Waheed NK, Moult EM, et al. Ultrahigh speed OCT angiography of retinal and choriocapillaris alterations in diabetic patients with and without retinopathy using swept source optical coherence tomography. Retina. 2017;37(1):11–21. doi:10.1097/IAE.0000000000001250
13. Werner JU, Böhm F, Lang GE, Dreyhaupt J, Lang GK, Enders C. Comparison of foveal avascular zone between optical coherence tomography angiography and fluorescein angiography in patients with retinal vein occlusion. PLoS One. 2019;14(6):e0217849. doi:10.1371/journal.pone.0217849
14. Bresnick GH, Condit R, Syrjala S, Palta M, Groo A, Korth K. Abnormalities of the foveal avascular zone in diabetic retinopathy. Arch Ophthalmol. 1984;102(9):1286–1293. doi:10.1001/archopht.1984.01040031036019
15. Heidemann C, Du Y, Schubert I, Rathmann W, Scheidt-Nave C. Prävalenz und zeitliche Entwicklung des bekannten Diabetes mellitus: ergebnisse der Studie zur Gesundheit Erwachsener in Deutschland (DEGS1). Bundesgesundheitsblatt Gesundheitsforschung Gesundheitsschutz. 2013;56(5–6):668–677. doi:10.1007/s00103-012-1662-5
16. Sun T, Zhang M. Characters of contrast sensitivity in diabetic patients without diabetic retinopathy. Zhonghua Yan Ke Za Zhi. 2012;48(1):41–46.
17. Ghafour IM, Foulds WS, Allan D, McClure E. Contrast sensitivity in diabetic subjects with and without retinopathy. Br J Ophthalmol. 1982;66(8):492–495. doi:10.1136/bjo.66.8.492
18. Regan D, Neima D. Low-contrast letter charts in early diabetic retinopathy, ocular hypertension, glaucoma, and Parkinson’s disease. Br J Ophthalmol. 1984;68(12):885–889. doi:10.1136/bjo.68.12.885
19. Bach M, Wesemann W, Kolling G, Bühren J, Krastel H, Schiefer U. Photopisches Kontrastsehen. Ortliche Kontrastempfindlichkeit. Ophthalmologe. 2008;105(1):
20. Federman JL, Lloyd J. Automated static perimetry to evaluate diabetic retinopathy. Trans Am Ophthalmol Soc. 1984;82:358–370.
21. Bradvica M, Biuk D, Štenc Bradvica I, Vinković M, Cerovski B, Barać I. The role of frequency doubling technology perimetry in early detection of diabetic retinopathy. Acta Clin Croat. 2020;59(1):10–18. doi:10.20471/acc.2020.59.01.02
22. El‐Bradey M, Plummer DJ, Uwe‐Bartsch D, Freeman WR. Scanning laser entoptic perimetry for the detection of visual defects associated with diabetic retinopathy. Br J Ophthalmol. 2006;90(1):17–19. doi:10.1136/bjo.2005.075887
23. Zico OA, Aa-f E-S, Ahmed EEA-H. Short wavelength automated perimetry can detect visual field changes in diabetic patients without retinopathy. Indian J Ophthalmol. 2014;62(4):383–387. doi:10.4103/0301-4738.126986
24. Long M, Wang C, Liu D. Glycated hemoglobin A1C and vitamin D and their association with diabetic retinopathy severity. Nutr Diabetes. 2017;7(6):e281. doi:10.1038/nutd.2017.30
25. Singh VP, Bali A, Singh N, Jaggi AS. Advanced glycation end products and diabetic complications. Korean J Physiol Pharmacol. 2014;18(1):1–14. doi:10.4196/kjpp.2014.18.1.1
26. Bressler NM, Edwards AR, Antoszyk AN, et al. Retinal thickness on stratus optical coherence tomography™ in people with diabetes and minimal or no diabetic retinopathy. Am J Ophthalmol. 2008;145(5):894–901. doi:10.1016/j.ajo.2007.12.025
27. Byeon SH, Chu YK, Lee H, Lee SY, Kwon OW. Foveal ganglion cell layer damage in ischemic diabetic maculopathy: correlation of optical coherence tomographic and anatomic changes. Ophthalmology. 2009;116(10):1949–59.e8. doi:10.1016/j.ophtha.2009.06.066
28. van Dijk HW, Verbraak FD, Kok PHB, et al. Decreased retinal ganglion cell layer thickness in patients with type 1 diabetes. Invest Ophthalmol Vis Sci. 2010;51(7):3660–3665. doi:10.1167/iovs.09-5041
29. Takase N, Nozaki M, Kato A, Ozeki H, Yoshida M, Ogura Y. Enlargement of foveal avascular zone in diabetic eyes evaluated by en face optical coherence tomography angiography. Retina. 2015;35(11):2377–2383. doi:10.1097/IAE.0000000000000849
 © 2022 The Author(s). This work is published and licensed by Dove Medical Press Limited. The full terms of this license are available at https://www.dovepress.com/terms.php and incorporate the Creative Commons Attribution - Non Commercial (unported, v3.0) License.
By accessing the work you hereby accept the Terms. Non-commercial uses of the work are permitted without any further permission from Dove Medical Press Limited, provided the work is properly attributed. For permission for commercial use of this work, please see paragraphs 4.2 and 5 of our Terms.
© 2022 The Author(s). This work is published and licensed by Dove Medical Press Limited. The full terms of this license are available at https://www.dovepress.com/terms.php and incorporate the Creative Commons Attribution - Non Commercial (unported, v3.0) License.
By accessing the work you hereby accept the Terms. Non-commercial uses of the work are permitted without any further permission from Dove Medical Press Limited, provided the work is properly attributed. For permission for commercial use of this work, please see paragraphs 4.2 and 5 of our Terms.