")
Back to Journals » International Journal of General Medicine » Volume 7
Influence of salty food preference on daily salt intake in primary care
Authors Takamura K, Okayama M, Takeshima T, Fujiwara S, Harada M, Murakami J, Eto M, Kajii E
Received 18 January 2014
Accepted for publication 8 February 2014
Published 15 April 2014 Volume 2014:7 Pages 205—210
DOI https://doi.org/10.2147/IJGM.S60997
Checked for plagiarism Yes
Review by Single anonymous peer review
Peer reviewer comments 4
Kazuhiro Takamura,1 Masanobu Okayama,2 Taro Takeshima,2 Shinji Fujiwara,3 Masanori Harada,4 Junichi Murakami,5 Masahiko Eto,6 Eiji Kajii2
1Department of Community Medicine, Obstetrics and Gynecology, Miyazaki Prefectural Miyazaki Hospital, Miyazaki, Japan; 2Division of Community and Family Medicine, Center for Community Medicine, Jichi Medical University, Shimotsuke, Tochigi, Japan; 3Mima City National Health Insurance Koyadaira Clinic, Mima, Tokushima, Japan; 4Department of Support of Rural Health Care, Yamaguchi Grand Medical Center, Hofu, Yamaguchi, Japan; 5Division of Chest Surgery, Department of Surgery and Clinical Science, Yamaguchi University Graduate School of Medicine, Ube, Yamaguchi, Japan; 6Department of Internal Medicine, Wakuya Medical and Welfare Center, Wakuya, Miyagi, Japan
Purpose: A salt preference questionnaire may be a convenient and cost-effective method for predicting salt intake; however, the influence of salt preference on daily salt intake is unclear. This study aimed at revealing the effectiveness of the salt preference question in determining the daily salt intake in primary care outpatients.
Patients and methods: This cross-sectional study included 1,075 outpatients (men, n=436, 40.6%) at six primary care institutions in Japan. Primary outcomes included a salty food preference assessed by using one question and a daily salt intake, assessed using early morning second urine samples. Multivariate analyses determined the relationships between the salt intake and the two salt preference levels.
Results: The mean age was 67.6±14.6 years, and 594 (55.3%) preferred salty foods. The daily salt intake was 12.3±4.0 g per day and 11.4±3.7 g per day in the salt preference and nonsalt preference groups, respectively (P<0.001). A salt intake <10 g per day was consumed by 169 (28.5%) and 181 (37.6%) patients (P=0.001), respectively, and <6 g salt per day was consumed by 28 (4.7%) and 26 (5.4%) patients (P=0.606), respectively. The patients who preferred salty foods consumed a significantly larger amount of salt per day than those who did not prefer salty foods (β coefficient, 0.621; 95% confidence interval [CI], 0.146–1.095). There was no difference in the number of patients who consumed <10 g salt per day (adjusted odds ratio [ad-OR], 1.29; 95% CI, 0.99–1.69) or <6 g salt per day (ad-OR, 1.39; 0.90–1.69) between the groups.
Conclusion: Preference for salty foods was positively associated with daily salt intake. However, daily salt intake was not always appropriate, even in the patients who did not prefer salty foods. Behavioral interventions for salt restriction after an assessment of daily salt intake are necessary for primary care patients, regardless of their preference for salty foods.
Keywords: salt preference, daily salt intake, outpatients, primary care, salt restriction, spot urine method
Introduction
Hypertension is the most common disease among patients visiting primary care physicians.1,2 Hypertension is associated with a number of serious adverse effects;3 for example, usual blood pressure during middle age and older age is strongly and directly related to vascular mortality.4 The incidence of complications varies with blood pressure, and lower blood pressure can reduce the incidence of vascular disease and mortality.5 Therefore, the management of blood pressure in the hypertensive patient is one of the essential roles of the primary care physician.
A variety of risk factors, including excess sodium intake, excess alcohol intake, weight gain, and physical inactivity, have been associated with essential hypertension.3 High salt intake is related not only with high blood pressure but also with an increased risk of stroke and cardiovascular disease.6,7 Moderate dietary sodium restriction is recommended as part of the nonpharmacologic therapy of hypertension.8 A reduction in salt intake from the current level of 9–12 g per day in most countries to the recommended level of <5 g per day can lower blood pressure.9 In Japan, the mean salt intake in adults is 10.4 g per day (men, 11.4 g per day; women, 9.6 g per day).2 Target levels for salt intake in Japan have been set at <6 g per day and <10 g per day for hypertensive patients and the general population, respectively.10,11 Therefore, it is important to establish an effective approach to modifying salt intake in primary care clinics.
The reliable assessment of daily salt intake provides the basis for appropriate advice regarding salt restriction, especially for hypertensive patients. The use of 24-hour urine sampling or a nutritionist’s analysis of the diet is inconvenient and impractical for general use in primary care clinics.12 For reasons of convenience, a question regarding salt preference (“Do you prefer salty foods?”) has been used to estimate salt intake. This salt preference question may cost-effectively differentiate patients with a high salt intake who require further assessment.
However, only a few studies have evaluated the effectiveness of this question for identifying excessive salt consumers in healthy patients or those undergoing routine health check-ups.13–15 Moreover, the findings have been inconsistent, and the relationship between salt preference and daily salt intake remains unclear. This study is aimed at revealing the effectiveness of the salt preference question in determining daily salt intake in outpatients visiting primary care institutions.
Materials and methods
Study design
A cross-sectional study was conducted in a primary care setting. Approval for the study protocol was obtained from the Jichi Medical University Review Board. Written informed consent was obtained from each individual prior to his or her entry into this study.
Participants
We enrolled 1,075 outpatients over 20 years old who visited the primary care departments of four clinics and two small hospitals in Japan from August 2010–January 2011 and also in December 2012.
Measurements
Data were collected regarding age, sex, salt preference, body mass index, current lifestyle behaviors (smoking and drinking), office blood pressure, use of antihypertensive medication, and daily salt intake. Salt preference was documented using the question, “Do you prefer salty foods?” (“yes”, “relatively yes”, “relatively no”, or “no”). Office blood pressure was measured using a standard method with the right arm after at least 5 minutes of rest in a seated position. We measured weight and height to calculate body mass index. The use of antihypertensive medication was collected from the medical records. Using an early morning collection of second spot urine, the daily salt intake was estimated using a previously defined formula16,17 that includes the patient’s sex, age, body weight, height, and sodium and creatinine concentrations from early morning second urine samples (Table 1).
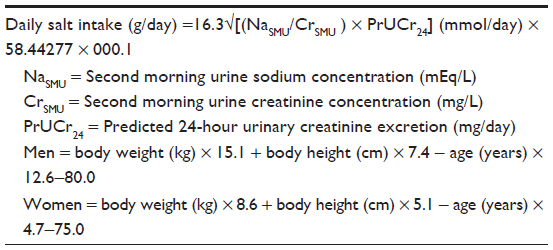 | Table 1 Formula for calculating daily salt intake on the basis of early morning spot urine sample |
Statistical analysis
Before performing the statistical analyses, the responses relating to preference for salty foods were dichotomized. “Yes” and “relatively yes” responses were combined into the salt preference group, and “no” and “relatively no” responses were combined into the nonsalt preference group. The use of antihypertensive medications was also dichotomized. Patients using antihypertensive medications were identified as hypertensive, while the remaining patients were classified as nonhypertensive. On the basis of the Japanese guidelines mentioned previously, the patients were categorized according to daily salt intake, <10 g per day and <6 g per day.
The continuous variables (age, body mass index, office blood pressure, and daily salt intake) are reported as mean ± standard deviation, and the categorical variables (sex, current lifestyle behaviors, antihypertensive medication use, and daily salt intake <10 g per day and <6 g per day) are reported as frequencies. Using independent Student’s t-tests or chi-square tests, as appropriate, we compared the differences in the variables based on salt preference. Pearson’s correlation coefficient and 95% confidence interval (CI) were used to assess the relationship between salt preference and daily salt intake. Using logistic regression analysis, crude odds ratios (ORs), and 95% CI for daily salt intake (<10 g per day and <6 g per day) of salt preference are reported. Multiple regression analysis was conducted to determine the relationship between salt preference and daily salt intake; the β coefficient and 95% CI are reported. Multiple logistic regression analysis was conducted to determine the relationship between salt preference and daily salt intake (<10 g per day and <6 g per day); the adjusted ORs and 95% CI are reported. The β coefficient (95% CI) and ORs (95% CI) were adjusted for age, sex, current lifestyle behaviors, antihypertensive medication use, and office diastolic blood pressure. Statistical analyses were performed using Stata/MP version 13.1 (Stata Corp LP, College Station, TX, USA). Analyses were two-sided, with statistical significance set at P<0.05.
Results
The mean age of the sample, which included 436 (40.6%) men and 639 (59.4%) women, was 67.6±14.6 years. Salty foods were preferred by 594 (55.3%) patients, and 481 (44.7%) patients did not prefer salty foods (Table 2). The mean daily salt intake was 11.9±3.9 g, and 350 (32.6%) and 54 (5.0%) patients had a daily salt intake of <10 g and <6 g, respectively.
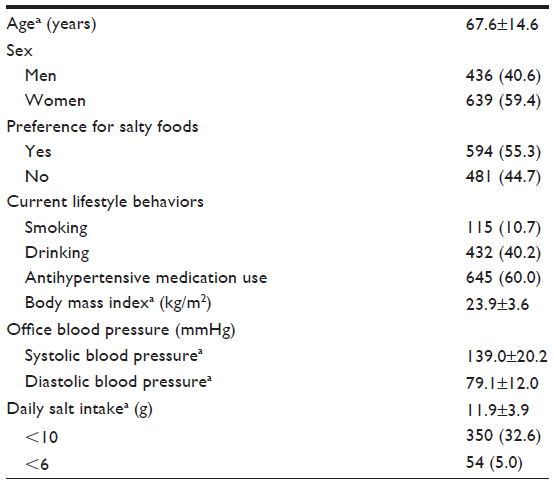 | Table 2 Demographic characteristics of the outpatients from primary care centers in Japan (n=1,075) |
There were significant differences in age and sex between the salt preference and nonsalt preference groups (P<0.001, respectively; Table 3). There were also significant differences between the two groups in daily salt intake (P<0.001) and the proportion of patients with a salt intake <10 g per day (P=0.001). The proportion of patients with a salt intake <6 g per day did not differ between the two groups.
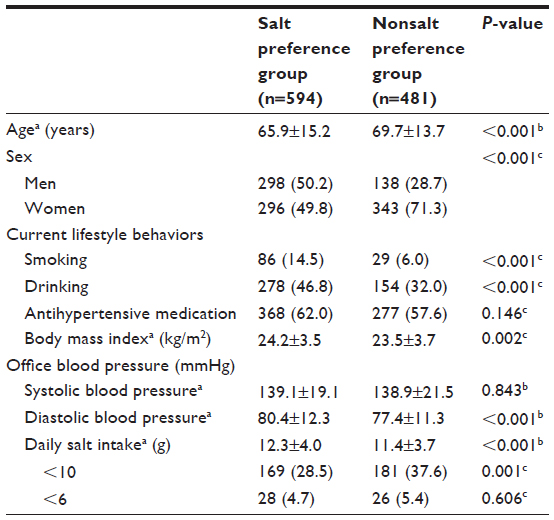 | Table 3 Comparison of characteristics according to salt preference in outpatients from primary care centers in Japan |
The multivariate analyses resulted in a significantly larger amount of salt consumed by the patients who preferred salty foods (β coefficient, 0.621; 95% CI, 0.146–1.095; Table 4). However, there was no difference in the proportion of the patients with a salt intake <10 g per day (adjusted OR, 1.29; 95% CI, 0.99–1.69) or <6 g per day (adjusted OR, 0.90; 95% CI, 0.51–1.59) between the salt preference and nonsalt preference groups.
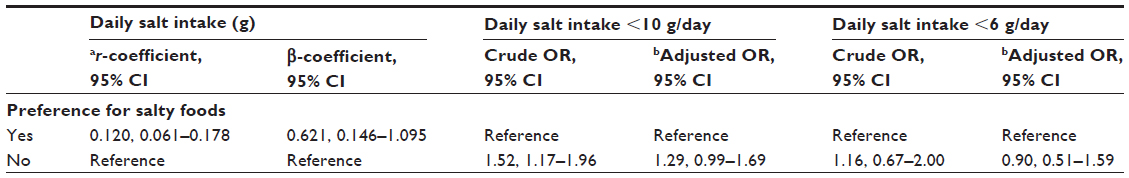 | Table 4 Results of multivariate analyses to determine the association between salt preference and daily salt intake |
Discussion
In the present study, the patients with a self-reported preference for salty foods consumed higher daily amounts of salt than those who did not report a preference for salty foods. Sensory responses to the taste, smell, and texture of foods help to determine food preferences and eating habits.18 Multiple links between taste or food preferences and the amount of food consumed have been reported such as a sweet taste preference and the consumption of added sugars,19 a preference for lipid-rich foods and related food intake,20 and a preference for tea and coffee and the consumption of tea and coffee.21 Similarly, the current findings suggest that a preference for salty foods may result in an increase in salt consumption, which also supports a previous report indicating that the salt taste perception is related to the frequency of discretionary salt use.22
We detected that the difference in the salt intake between the patients who preferred salty foods and those who did not was 0.9 g per day. A reduction of salt intake by 3 g per day lowers the blood pressure by 3.6–5.6/1.9–3.2 mmHg (systolic/diastolic) in hypertensive patients and 1.8–3.5/0.8–1.8 mmHg in normotensive individuals.23 The excessive salt intake caused by the salt preference may not have a biological significance. However, in Japan, public health campaigns aimed at reducing population-level daily salt intake are provided universally by public health nurses.24 To assist with meeting this goal, an effective approach may be to target the people who prefer salt and consume greater amounts of salt. The salt preference question may be a useful tool in this population-based approach to salt restriction.
Meanwhile, the proportion of patients consuming salt at a level below the recommended daily amount did not differ according to salt preference. These findings indicate that the salt preference question is not useful for detecting excessive salt intake. Instead, spot urine and 24-hour urinary measurements are preferred as accurate indicators of daily salt intake in primary care.14,17,25 However, a more convenient and cost-effective method for predicting salt intake is desired, and future studies should be conducted to determine such a method.
A behavioral approach to salt consumption is essential to prevent hypertension.8 A modest reduction in salt intake for ≥4 weeks decreases blood pressure in both hypertensive and normotensive individuals.26 In addition, a preference for salt is positively associated with mortality from stroke.27 Understanding the significance of behavioral modification plays a key role in motivating people to change inappropriate behaviors.28 This study demonstrated that a number of patients were excessive salt consumers regardless of their salt preference. Therefore, individual behavioral interventions aimed at salt intake may also be useful in patients who do not prefer salty foods. However, these patients may have difficulty understanding the significance of salt restriction, and influencing salt intake-related behaviors in these patients may be challenging.29 Therefore, educational programs regarding daily salt intake in primary care practice are necessary for all patients to promote behavioral modification.
This study presented several limitations. First, salt perception was not evaluated. Salt perception is associated with genetic factors and early childhood dietary experiences;30,31 however, it has little impact on salt intake.32 Second, daily salt intake was measured using the spot urine method; however, the reliability of this method has been established through comparisons with 24-hour urine specimens.14,25 Therefore, the use of spot urine should not influence the results of the present study. Third, the patients’ daily salt intakes change from day-to-day. Also, test results at office visits are not always representative of their usual daily salt intakes. These issues might influence the findings in the present study. Fourth, we did not determine the patients’ knowledge regarding the relationships between salt intake and blood pressure, which could affect salt intake and the answer for the salt preference questionnaire. However, it has been reported that patients who were aware that salt could increase blood pressure consumed larger daily amounts of salt than those who were not.33 Fifth, salt intake varies in different populations;7 therefore, the awareness of salt intake is likely to be different between nationalities. Future studies should address these limitations in addition to exploring the mechanisms underlying increased salt intake with a preference for salty foods.
Conclusion
A preference for salty foods was related to greater salt consumption. Public health campaigns aimed at reducing salt intake may be more effective when targeted at people who prefer salt. In this setting, the question, “Do you prefer salty food?” may assist with raising the awareness of a preference for salt and related salt intake. However, at the individual level, this question may not be as useful; excessive daily salt intake was also present in patients who did not report a preference for salt. Therefore, primary care physicians should assess salt intake in all patients and provide education regarding salt restriction for those with excessive salt intakes.
Acknowledgments
For their assistance with data collection, we thank: M Nagayama, MD; K Nakayasu, MD; M Ohhara, MD, PhD; T Ono, MD, PhD; S Ohguri; R Kobayashi; R Shiratori; and K Kawabata. This work received a Research Grant-in-Aid for Scientific Research (B) (number 21390168) from the Japan Society for the Promotion of Science.
Author contributions
KT contributed to the data acquisition, analysis, and interpretation of the data and to the drafting and revision of the article. MO contributed to the conception, design, data acquisition, analysis, and interpretation of data and to the drafting and revision of the article. TT contributed to the conception, design, analysis, interpretation of data and revision of the article. SF, MH, JM, and ME all contributed to the data acquisition, analysis, interpretation of data and revision of the article. EK contributed to the conception, design, and revision of the article. All authors approved the final version of the manuscript to be published and agreed to be accountable for all aspects of the work, in ensuring that questions related to the accuracy or integrity of any part of the work were appropriately investigated and resolved.
Disclosure
The authors report no conflicts of interest in this work.
References
Egan BM, Zhao Y, Axon RN. US trends in prevalence, awareness, treatment, and control of hypertension, 1988–2008. JAMA. 2010;303(20):2043–2050. | |
Ministry of Health Labour and Welfare. [National Health and Nutrition Examination Survey 2011]. Available from: http://www.mhlw.go.jp/stf/houdou/2r9852000002q1st-att/2r9852000002q1wo.pdf. Accessed January 17, 2014. Japanese. | |
Kaplan NM, Domino FJ. Overview of hypertension in adults. 2013. Available from: http://www.uptodate.com/contents/overview-of-hypertension-in-adults?source=search_result&search=hypertension&selectedTitle=1~150. Accessed January 23, 2014. | |
Lewington S, Clarke R, Qizilbash N, Peto R, Collins R; Prospective Studies Collaboration. Age-specific relevance of usual blood pressure to vascular mortality: a meta-analysis of individual data for one million adults in 61 prospective studies. Lancet. 2002;360(9349):1903–1913. | |
Ueshima H. Explanation for the Japanese paradox: prevention of increase in coronary heart disease and reduction in stroke. J Atheroscler Thromb. 2007;14(6):278–286. | |
Strazzullo P, D’Elia L, Kandala NB, Cappuccio FP. Salt intake, stroke, and cardiovascular disease: meta-analysis of prospective studies. BMJ. 2009;339:b4567. | |
Intersalt: an international study of electrolyte excretion and blood pressure. Results for 24 hour urinary sodium and potassium excretion. Intersalt Cooperative Research Group. BMJ. 1988;297(6644):319–328. | |
Kaplan NM. Salt intake, salt restriction, and primary (essential) hypertension. 2013. Available from: http://www.uptodate.com/contents/salt-intake-salt-restriction-and-primary-essential-hypertension?source= search_result&search=salt+intake&selectedTitle=1~150. Accessed January 17, 2014. | |
He FJ, Campbell NR, MacGregor GA. Reducing salt intake to prevent hypertension and cardiovascular disease. Rev Panam Salud Publica. 2012;32(4):293–300. | |
Ministry of Health Labour and Welfare. [The diet preventing development of hypertension]. Available from: http://www.mhlw.go.jp/topics/bukyoku/kenkou/seikatu/kouketuatu/meal.html. Accessed January 17, 2014. Japanese. | |
Ogihara T, Kikuchi K, Matsuoka H, et al; Japanese Society of Hypertension Committee. The Japanese Society of Hypertension Guidelines for the Management of Hypertension (JSH 2009). Hypertens Res. 2009;32(1):3–107. | |
Kawano Y, Tsuchihashi T, Matsuura H, Ando K, Fujita T, Ueshima H; Working Group for Dietary Salt Reduction of the Japanese Society of Hypertension. Report of the Working Group for Dietary Salt Reduction of the Japanese Society of Hypertension: (2) Assessment of salt intake in the management of hypertension. Hypertens Res. 2007;30(10):887–893. | |
Takachi R, Ishihara J, Iwasaki M, Ishii Y, Tsugane S. Self-reported taste preference can be a proxy for daily sodium intake in middle-aged Japanese adults. J Acad Nutr Diet. Epub October 19, 2013. | |
Hashimoto T, Yagami F, Owada M, Sugawara T, Kawamura M. Salt preference according to a questionnaire vs. dietary salt intake estimated by a spot urine method in participants at a health check-up center. Intern Med. 2008;47(5):399–403. | |
Kim HJ, Paik HY, Lee SY, Shim JE, Kim YS. Salt usage behaviors are related to urinary sodium excretion in normotensive Korean adults. Asia Pac J Clin Nutr. 2007;16(1):122–128. | |
Kawasaki T, Itoh K, Uezono K, Sasaki H. A simple method for estimating 24 h urinary sodium and potassium excretion from second morning voiding urine specimen in adults. Clin Exp Pharmacol Physiol. 1993;20(1):7–14. | |
Kawamura M, Ohmoto A, Hashimoto T, Yagami F, Owada M, Sugawara T. Second morning urine method is superior to the casual urine method for estimating daily salt intake in patients with hypertension. Hypertens Res. 2012;35(6):611–616. | |
Drewnowski A. Taste preferences and food intake. Annu Rev Nutr. 1997;17:237–253. | |
Drewnowski A, Mennella JA, Johnson SL, Bellisle F. Sweetness and food preference. J Nutr. 2012;142(6):1142S–1148S. | |
Gaillard D, Passilly-Degrace P, Besnard P. Molecular mechanisms of fat preference and overeating. Ann N Y Acad Sci. 2008;1141:163–175. | |
Luciano M, Kirk KM, Heath AC, Martin NG. The genetics of tea and coffee drinking and preference for source of caffeine in a large community sample of Australian twins. Addiction. 2005;100(10):1510–1517. | |
Fischer ME, Cruickshanks KJ, Pinto A, et al. Intensity of salt taste and prevalence of hypertension are not related in the beaver dam offspring study. Chemosens Percept. 2012;5(2):139–145. | |
He FJ, MacGregor GA. How far should salt intake be reduced? Hypertension. 2003;42(6):1093–1099. | |
Ministry of Health Labour and Welfare. [Basic policy of comprehensive approach Comprehensive approach to the promotion of nation’s health (Health Japan 21, 2nd term)]. Available from: http://www.mhlw.go.jp/bunya/kenkou/dl/kenkounippon21_01.pdf. Accessed January 17, 2014. Japanese. | |
Kang SS, Kang EH, Kim SO, Lee MS, Hong CD, Kim SB. Use of mean spot urine sodium concentrations to estimate daily sodium intake in patients with chronic kidney disease. Nutrition. 2012;28(3):256–261. | |
He FJ, Li J, Macgregor GA. Effect of longer term modest salt reduction on blood pressure: Cochrane systematic review and meta-analysis of randomised trials. BMJ. 2013;346:f1325. | |
Ikehara S, Iso H, Date C, et al; JACC Study Group. Salt preference and mortality from stroke and coronary heart disease for Japanese men and women: the JACC study. Prev Med. 2012;54(1):32–37. | |
Rollnick S, Mason P, Butler C. Health Behavior Change: A Guide for Practitioners. Edinburgh: Churchill Livingstone; 1999. | |
Takeshima T, Okayama M, Harada M, Ae R, Kajii E. Effects of disclosing hypothetical genetic test results for salt sensitivity on salt restriction behavior. Int J Gen Med. 2013;6:361–368. | |
Stein LJ, Cowart BJ, Beauchamp GK. The development of salty taste acceptance is related to dietary experience in human infants: a prospective study. Am J Clin Nutr. 2012;95(1):123–129. | |
Hayes JE, Sullivan BS, Duffy VB. Explaining variability in sodium intake through oral sensory phenotype, salt sensation and liking. Physiol Behav. 2010;100(4):369–380. | |
Pangborn RM, Pecore SD. Taste perception of sodium chloride in relation to dietary intake of salt. Am J Clin Nutr. 1982;35(3):510–520. | |
Buranakitjaroen P, Phoojaroenchanachai M. The prevalence of high sodium intake among hypertensive patients at hypertension clinic, Siriraj Hospital. J Med Assoc Thai. 2013;96 Suppl 2:S1–S8. |
 © 2014 The Author(s). This work is published and licensed by Dove Medical Press Limited. The full terms of this license are available at https://www.dovepress.com/terms.php and incorporate the Creative Commons Attribution - Non Commercial (unported, v3.0) License.
By accessing the work you hereby accept the Terms. Non-commercial uses of the work are permitted without any further permission from Dove Medical Press Limited, provided the work is properly attributed. For permission for commercial use of this work, please see paragraphs 4.2 and 5 of our Terms.
© 2014 The Author(s). This work is published and licensed by Dove Medical Press Limited. The full terms of this license are available at https://www.dovepress.com/terms.php and incorporate the Creative Commons Attribution - Non Commercial (unported, v3.0) License.
By accessing the work you hereby accept the Terms. Non-commercial uses of the work are permitted without any further permission from Dove Medical Press Limited, provided the work is properly attributed. For permission for commercial use of this work, please see paragraphs 4.2 and 5 of our Terms.