")
Back to Journals » International Journal of General Medicine » Volume 10
Influence of organizational culture on provider adherence to the diabetic clinical practice guideline: using the competing values framework in Palestinian Primary Healthcare Centers
Authors Radwan M , Akbari Sari A, Rashidian A, Takian A, Abou-Dagga S, Elsous A
Received 21 April 2017
Accepted for publication 20 June 2017
Published 11 August 2017 Volume 2017:10 Pages 239—247
DOI https://doi.org/10.2147/IJGM.S140140
Checked for plagiarism Yes
Review by Single anonymous peer review
Peer reviewer comments 2
Editor who approved publication: Dr Scott Fraser
Mahmoud Radwan,1 Ali Akbari Sari,1 Arash Rashidian,1 Amirhossein Takian,1 Sanaa Abou-Dagga,2 Aymen Elsous1
1Department of Health Management and Economics, School of Public Health, International Campus, Tehran University of Medical Sciences, Tehran, Iran; 2Department of Research Affairs and Graduates Studies, Islamic University of Gaza, Gaza Strip, Palestine
Background: Diabetes mellitus (DM) is a serious chronic disease and an important public health issue. This study aimed to identify the predominant culture within the Palestinian Primary Healthcare Centers of the Ministry of Health (PHC-MoH) and the Primary Healthcare Centers of the United Nations Relief and Works Agency for Palestine Refugees (PHC-UNRWA) by using the competing values framework (CVF) and examining its influence on the adherence to the Clinical Practice Guideline (CPG) for DM.
Methods: A cross-sectional design was employed with a census sample of all the Palestinian family doctors and nurses (n=323) who work within 71 PHC clinic. A cross-cultural adaptation framework was followed to develop the Arabic version of the CVF questionnaire.
Results: The overall adherence level to the diabetic guideline was disappointingly suboptimal (51.5%, p<0.001; 47.3% in the PHC-MoH and 55.5% in the PHC-UNRWA). In the PHC-MoH, the clan/group culture was the most predominant (mean =41.13; standard deviation [SD] =8.92), followed by hierarchical (mean =33.14; SD=5.96), while in the PHC-UNRWA, hierarchical was the prevailing culture (mean =48.43; SD =12.51), followed by clan/group (mean =29.73; SD =8.37). Although a positively significant association between the adherence to CPG and the rational culture and a negatively significant association with the developmental archetype were detected in the PHC-MoH, no significant associations were found in the PHC-UNRWA.
Conclusion: Our study demonstrates that the organizational culture has a marginal influence on the adherence to the diabetic guideline. Future research should preferably mix quantitative and qualitative approaches and explore the use of more sensitive instruments to measure such a complex construct and its effects on guideline adherence in small-sized clinics.
Keywords: organizational culture, clinical practice guideline, adherence, diabetes mellitus, competing values framework
Background
Diabetes mellitus (DM) is a serious chronic disease and an important public health issue. It is a major cause of blindness, kidney failure, heart attacks, stroke, and lower limb amputation.1 The World Health Organization (WHO) estimates that, worldwide, ~422 million people aged >18 years had diabetes in 2014 with a global prevalence of 8.5% in the adult population.1 The highest prevalence rate (13.7%) of DM is in the WHO–Eastern Mediterranean Region.1 It was the eighth leading cause of death among both sexes and the fifth leading cause of death in women in 2012.1 DM creates a huge economic burden on the global health care system. It has been estimated that the direct annual cost of DM to the world is >US$827 billion.2 In Palestine, it has been projected that the prevalence of DM among Palestinians is at 23.4% in 2030.3 In Gaza Strip, the MoH and the UNRWA are the main health care providers for diabetes primary health care, where the total number of clinics within the Palestinian Primary Healthcare Centers of the Ministry of Health (PHC-MoH) and the Primary Healthcare Centers of the United Nations Relief and Works Agency for Palestine Refugees (PHC-UNRWA) is 49 and 22, respectively. The Palestinian Clinical Practice Guideline (CPG) for DM was adapted from international guidelines and targeted the areas of screening, diagnosis, and treatment in order to standardize the care provided to the type 1 and type 2 diabetic patients.
Organizational culture (OC) is defined as “a set of beliefs, values, and assumptions that are shared by members of an organization.”4 The organization members depend on these values which can affect their behavior and decisions. Schein defined OC as “the pattern of basic assumptions that a given group has invented, discovered, or developed in learning to cope with its problems of external adaptation and internal integration, and to be taught to new members as the correct way to perceive, think, and feel.”4 The OC is not only shared beliefs, values, and perceptions, but also rather it provides the members of the organization with the rules for behavior and practice. Health care professionals such as doctors and nurses sought to have a dominant role in the organization after creating their own culture. Those professional groups may resist the organizational change in case it threatens their shared traditions and behaviors.5
The culture in the health care organizations has been recognized as essential for key organizational outcomes.6 Several empirical studies assessed the influence of OC in health care settings. Associations have been found between the OC and the greater implementation of quality improvement,7 the quality of patient care,8 job satisfaction,9 patient satisfaction,10 hospital performance,10 and the quality of diabetes care.11 Yet, other studies in health care settings showed no associations between OC and organizational performance.12 The present study aimed at identifying the predominant culture within the Palestinian PHC settings and testing its role in the adherence to CPG for DM.
Methods
Design and sample
A cross-sectional design was employed with a census sample of all the Palestinian family doctors and nurses (n=323) who work with chronic patients in 71 PHC clinics (49 in the MoH and 22 in the UNRWA) in Gaza Strip. The total numbers of eligible doctors and nurses working in the PHC-MoH were 124 and 51, respectively, while the total numbers of eligible doctors and nurses working in the PHC-UNRWA were 115 and 56, respectively. All officially working doctors and nurses with at least 1 year working experience were included.
Translation and validation of the questionnaire
The guideline of cross-cultural adaptation process was recruited in translation of the competing values framework (CVF) questionnaire13 following the steps of forward translation, back translation, review by a committee of experts, and pretesting (pilot study). Initially, the forward translation from English into Arabic language was independently done by two professional translators with Arabic mother tongue. Any discrepancies were resolved and agreed on one synthesized Arabic version. The back translation for the first draft was translated to English by two translators with English mother tongue. An expert committee reviewed all the translated versions, compared with the original questionnaire, and arrived at a consensual perfinal draft of Arabic version. In order to check face and content validity, the perfinal draft of the CVF Arabic questionnaire was independently validated by 10 experts (academics, health experts, endocrinologists, and family doctors). Content validity index (CVI) was calculated to rate the relevance of the questionnaire items.14 All the items were rated as relevant and the CVI was >0.93. Slight editorial changes in the wording of few items were made. Finally, the questionnaire was piloted among 30 of the eligible participants. Slight modifications in wording were made based on feedback from the pilot group. In the PHC-MoH, the internal consistency reliability for the four culture types, using Cronbach’s alpha, was 0.76 for group culture, 0.81 for developmental culture, 0.68 for hierarchical culture, and 0.82 for rational culture. In the PHC-UNRWA, the Cronbach’s alpha for the four culture types was 0.85 for group culture, 0.85 for developmental culture, 0.89 for hierarchical culture, and 0.83 for rational culture. Further psychometric properties were outside the targets of this study.
OC
The OC was assessed using CVF.15 CVF is one of the most frequently used methods to assess OC in health care and non-health care settings.10,16–18 “It was developed in response to the need for a broadly applicable model that would foster successful leadership, improve organizational effectiveness, and promote value creation.”15 It depicts the differences between OCs across two axes: structure and focus. The structure axis has two extremes: one emphasizes on flexibility, discretion, and dynamism and the other emphasizes on stability, order, and control. The focus axis also has two extremes: the first is internally orientated with a focus on integration, collaboration, and unity and the second extreme is externally orientated with a focus on differentiation and competition. The two axes classify the CVF into four quadrants (subcultures), namely clan/group, development, rational, and hierarchical culture.
Clan/group culture is described by high flexibility and internal focus. It emphasizes the values of cohesiveness, participation, collaboration, empowerment, human resources development, mentoring, and teamwork.
Developmental culture is described by high flexibility and external focus. This culture emphasizes mainly the adhocracy, creativity, risk taking, growth, and gaining new resources for the organization.
Rational culture is externally focused with an emphasis on control. This culture tends to focus on the values of competition, goal attainment, achievement, and productivity.
Hierarchical culture is internally focused with an emphasis on control. This culture focuses on the bureaucracy, uniformity, stability, predictability, internal efficiency, coordination, and strict rules and guidelines.
Generally, the organizations or subgroups within them are not characterized by one of these four cultures, but rather they have competing values, and therefore a less or more tendency toward one particular quadrant.15 The CVF questionnaire measures culture type through 20 items divided equally into five domains of OC, with four answer categories representing different archetypes. The five domains represent descriptions of clinic characteristics, leadership, cohesion, emphasis, and rewards. Within each domain, an ipsative scale is followed in which the respondents are asked to distribute 100 points “in rank order” between the four answer categories according to which answer best fits the current clinic. The mean score for each of the four cultural types was computed. The dominant culture type in both PHC-MoH and PHC-UNRWA was based on the highest average culture type score.
Adherence to CPG for DM
Ten key recommendations derived from the Palestinian CPG for DM were included to measure the adherence level. The key recommendations focused mainly on the screening, diagnosis, and treatment of DM. A 5-point Likert scale was used for response categories, with the rating scale of “always,” “often,” “sometimes,” “rarely,” and “never.”
Data collection
From June 2016 to August 2016, data were gathered by four data collectors after one full day of training about the study scope and objectives, questionnaire items, and the potential areas for misconception. The interview-based questionnaire was used as a method of data collection. We obtained three formal approvals for data collection: from the MoH, UNRWA, and the ethical committee in Gaza “The Palestinian Health Research Council.” Verbal informed consents were provided by all the participants.
Data analysis
Data analysis was carried out by using SPSS version 20. Descriptive statistics was used to describe the sample characteristics. Categorical variables were described using frequencies and percentages, whereas means and standard deviations (SDs) were used to represent continuous data. p-value of ≤0.05 was considered significant. Spearman’s correlation coefficient was used to test the association between the adherence to CPG for DM and the OC archetypes.
Results
Respondent characteristics
Of the 346 eligible participants, 323 responded to the interview-based questionnaires yielding a response rate of 93.3%. Of the respondents, 58.8% were male, while most of the respondents were aged between 35 and 44 years (41.5%). Among the respondents, 69.7% were doctors, 73.4% had a bachelor degree, and 57.6% had >5 years of work experience in diabetic clinics. Of the respondents, 159 (49.2%) were working in PHC-MoH and 164 (50.8%) were working in PHC-UNRWA. The respondent characteristics are summarized in Table 1.
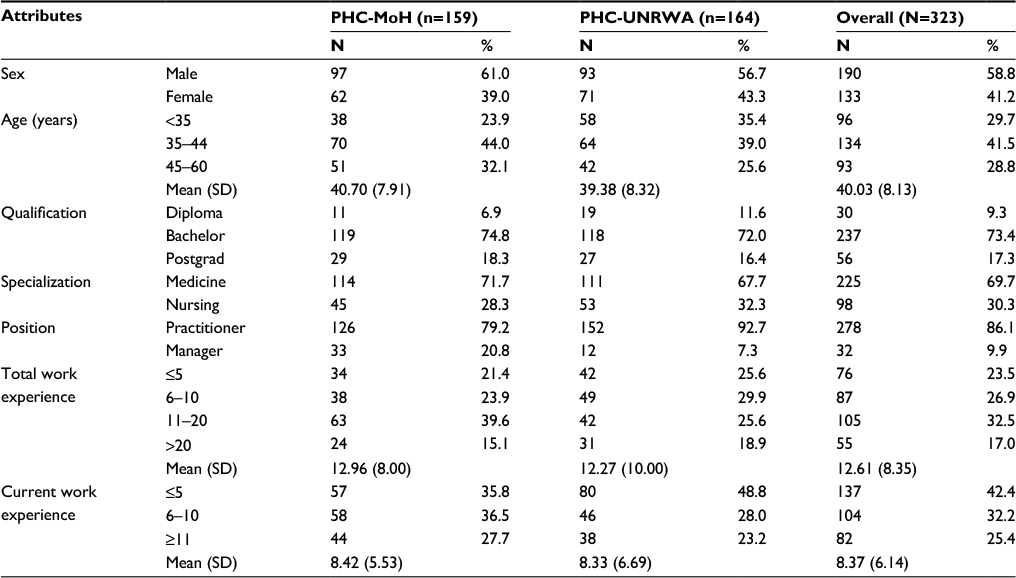 | Table 1 Respondent characteristics (n=323) Abbreviations: PHC-MoH, Palestinian Primary Healthcare Centers of the Ministry of Health; PHC-UNRWA, Primary Healthcare Centers of the United Nations Relief and Works Agency for Palestine Refugees; SD, standard deviation. |
Adherence to the diabetic guideline
Table 2 shows that the overall adherence mean score across the key recommendations was 51.5% (SD =7.3). Significantly higher total adherence was found in the PHC-UNRWA (55.5%, SD =5.7) compared to the PHC-MoH (47.3%, SD =6.3) (p<0.001). A small proportion of the respondents (11.5%; 1.3% in PHC-MoH and 21.3% in PHC-UNRWA) claimed that they were always or often adherents to implementing the key recommendations. The vast majority (84.2%; 89.9% in PHC-MoH and 78.7% in PHC-UNRWA) claimed that they were sometimes adherents to implementing the key recommendations. The least adherence was on the recommendation to perform screening for type 2 DM in all individuals at the age of ≥45 years (0.6% in PHC-MoH and 2.4% in PHC-UNRWA) followed by the prescription of angiotensin-converting enzyme inhibitor to normotensive type 2 DM patients if urine albumin/creatinine ratio is positive 3 months later (1.3% in PHC-MoH and 7.3% in PHC-UNRWA).
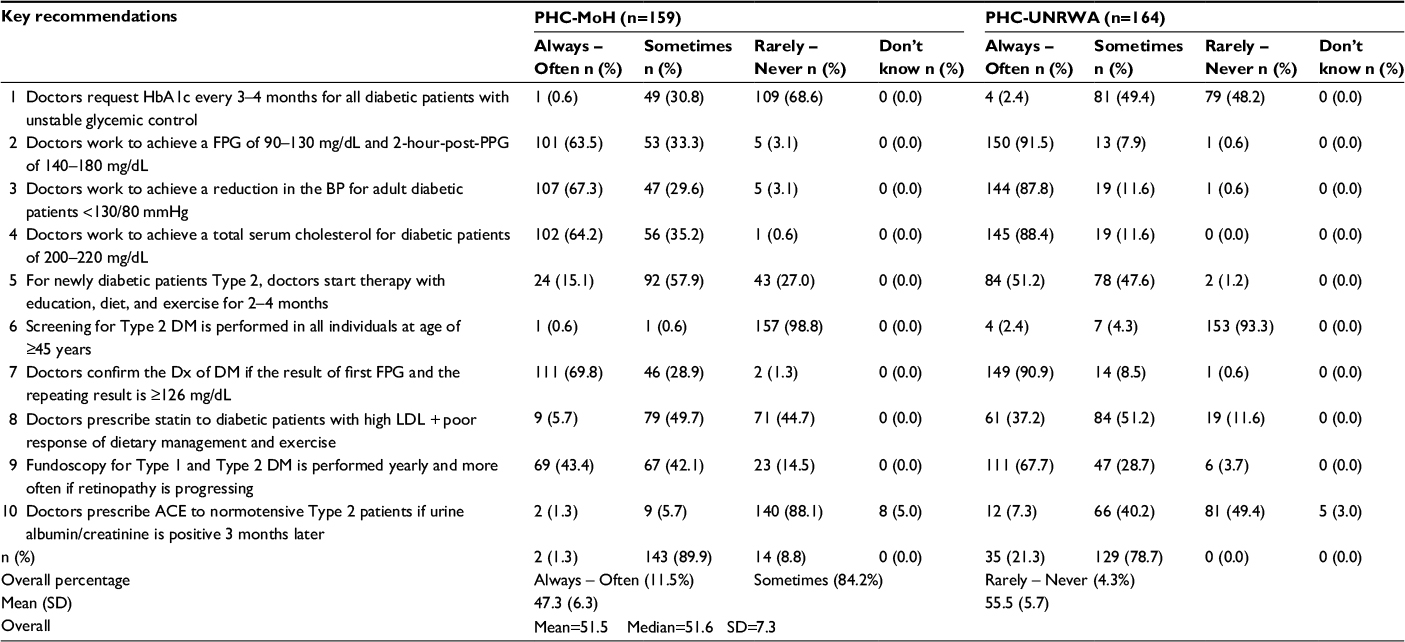 | Table 2 Adherence level to the diabetic guideline Abbreviations: ACE, angiotensin-converting enzyme; BP, blood pressure; DM, diabetes mellitus; FPG, fasting plasma glucose; LDL, low-density lipoprotein; PHC-MoH, Palestinian Primary Healthcare Centers of the Ministry of Health; PHC-UNRWA, Primary Healthcare Centers of the United Nations Relief and Works Agency for Palestine Refugees; PPG, postprandial glucose; SD, standard deviation. |
The dominant culture archetype
Figure 1 shows that among the four types of culture in the PHC-MoH, the clan/group culture received most of the points (mean =41.13; SD =8.92), followed by hierarchical (mean =33.14; SD =5.96), rational (mean =17.47; SD =7.39), and finally developmental culture (mean =8.11; SD =5.91). In the PHC-UNRWA, the hierarchical type was the dominant and received the highest of the points (mean =48.43; SD =12.51), followed by clan/group (mean =29.73; SD =8.37), rational (mean =14.26; SD =8.79), and last, developmental culture (mean =7.54; SD =6.63). In Table 3, the analysis pointed out a significant difference between the PHC-MoH and the PHC-UNRWA in perceiving the clan/group, hierarchical, and rational cultures. Significantly higher mean score of the clan/group culture was found in the PHC-MoH (mean =41.13; SD =8.92) compared to the PHC-UNRWA (mean =29.73; SD =8.37) (p<0.001). The respondents in the PHC-UNRWA were most likely to perceive the hierarchical culture (mean =48.43; SD =12.51) than those in the PHC-MoH (mean =33.14, SD =5.96) (p<0.001). Perception of rational culture yielded a statistically significant difference (p<0.001) among participants in the PHC-MoH (mean =17.47; SD =7.39) and the PHC-UNRWA (mean =14.26; SD =8.79). There was insignificant difference in perceiving the developmental culture among respondents working in both the PHC settings (p=0.416). Table 4 shows that the association between adherence to the diabetic guideline and the developmental and rational cultures was significant in the PHC-MoH, whereas no significant association was discovered in the PHC-UNRWA.
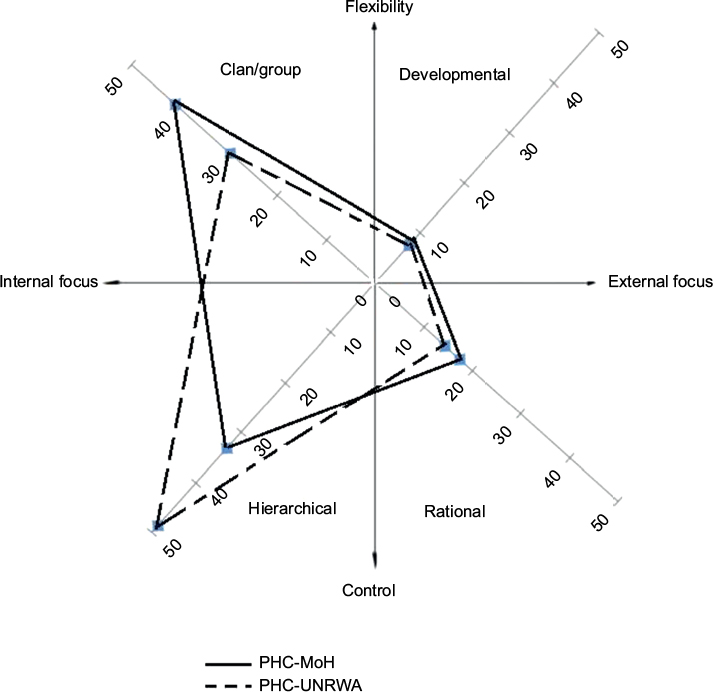 | Figure 1 Culture archetype scores within the PHC-MoH and PHC-UNRWA. Abbreviations: PHC-MoH, Palestinian Primary Healthcare centers of the Ministry of Health; PHC-UNRWA, Primary Healthcare Centers of the United Nations Relief and Works Agency for Palestine Refugees. |
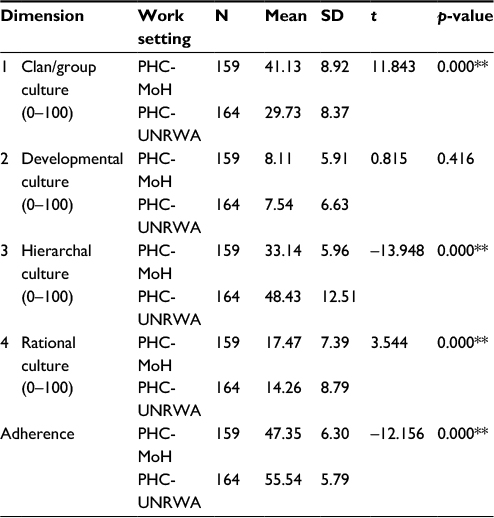 | Table 3 Culture archetype scores within both the PHC settings Note: **Differences are highly significant. Abbreviations: PHC-MoH, Palestinian Primary Healthcare Centers of the Ministry of Health; PHC-UNRWA, Primary Healthcare Centers of the United Nations Relief and Works Agency for Palestine Refugees; SD, standard deviation. |
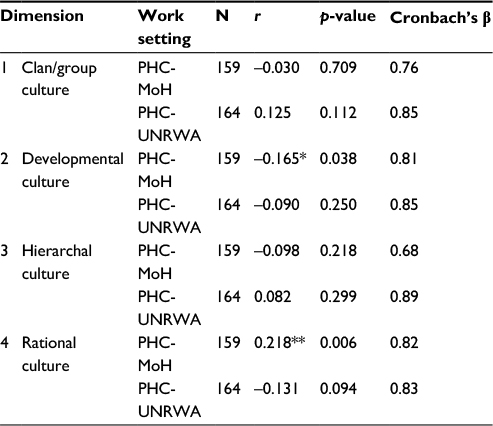 | Table 4 Spearman correlation of provider adherence to diabetic guideline and culture archetypes Notes: *Correlation is significant at the 0.05 level (two-tailed). **Correlation is significant at the 0.01 level (two-tailed). Abbreviations: PHC-MoH, Palestinian Primary Healthcare Centers of the Ministry of Health; PHC-UNRWA, Primary Healthcare Centers of the United Nations Relief and Works Agency for Palestine Refugees. |
Discussion
To the best of our knowledge, this is the first study that assessed the influence of OC on the adherence to the CPG for DM in the Palestinian PHC-MoH and PHC-UNRWA employing the widely used CVF instrument. The overall adherence level was suboptimal (51.5%). In Indonesia, the level of adherence to the recommendations of diabetic guideline was low and varied between 2% and 45%.19 In general, the level of adherence to CPGs is moderate20 or even low.21 Many systematic reviews pointed out that most of the adherence-enhancing interventions had only modest-to-moderate effects.22,23 Such limited effects might be due to the improper use of the behavioral and organizational theories as a guide for enhancing the adherence.24 Therefore, we employed a popular theoretical framework and went through the assessment of OC as a contextual factor that might affect the provider adherence. Overall, our study showed that there were significant differences in perceiving the OC (clan/group, hierarchal, and rational type) and the adherence to diabetic guideline among the health care professionals in the PHC-MoH and the PHC-UNRWA (p<0.05).
Figure 1 shows that in both the PHC settings, the clan/group and hierarchical culture archetypes were dominant. This proposes that diverse cultures can coexist in a single organization.25 In general, in PHC organizations, the clan/group culture is mainly prevailing.11,12 Similarly, in the PHC-MoH, the clan/group culture was the most prevalent. Such finding could be explained by the fact that PHC clinics are typically small-sized areas with small groups that lack the formalized structure of large organizations such as in hospitals. This suggests that these small groups are more inclined toward values such as collaboration, cohesiveness, and teamwork. Contrary to expectations, the clan and the hierarchal culture in both the PHC settings were not significantly associated with adherence to CPG for DM (p>0.05). Previous research has found that more group-oriented cultures have been positively associated with a variety of better outcomes7,10,26 and implementation of quality improvement.27 In the PHC-MoH, the rational culture was positively associated with the provider adherence to CPG for DM (r=0.216, p=0.006). Likewise, in Utah community clinics, the rational culture was positively associated with the provider satisfaction with the quality of care.28 This culture type tends to value productivity, achievement, and meeting organizational goals. This could somehow contribute toward having a positive correlation with guideline adherence. In a context like the Palestinian one, the MoH as the main health care provider is invited to further encourage the competition among professionals according to well-established criteria and reward them in case of better adherence to the guideline and consequently attaining the organizational goals. The developmental culture archetype was negatively associated with the provider adherence to the diabetic guideline (r=–0.165, p=0.038). In developmental cultures, where flexibility is highly valued, it seems that focusing on creativity and risk taking does not match well with implementing the guidelines.
The PHC-UNRWA has a predominantly hierarchal culture. Such a finding could be explained by its prevailing bureaucratic system which is characterized by having clear lines of decision-making authority, formalized measurement, top-down monitoring and process control, and formal rules and policies. In such hierarchy and bureaucracy, it was exceedingly expected to have a better adherence level to the guidelines. Although there was an insignificant association between the hierarchical culture and the adherence to the diabetic guideline (p>0.05), it seems reasonable to argue that more control-orientated hierarchical culture type might be quite suitable in promoting adherence to CPG. Our findings did not prove such association. On the contrary, it has been shown that the hierarchical culture was a significant barrier to quality of care29 and negatively associated with perceived clinical effectiveness in primary care pediatric practices.9 Our analysis found no associations between any type of OC and adherence to CPG for DM in the PHC-UNRWA. Several other studies failed to find associations between culture and health care performance12,30 or at least could not elucidate the shape of that relationship.31 The possible explanation for the absence of significant associations between most of culture archetypes and adherence to the diabetic guideline is that culture is a complex construct that requires an advanced and sensitive method to measure its aspects. Furthermore, it is possible that other organizational, environmental, attitudinal, or knowledge-related factors influence the guideline adherence20 in the Palestinian PHC settings more than the OC. Although our analysis suggests that the OC was an important predictor of the adherence to the diabetic guideline, the health care managers and policy makers within both the PHC settings are advised to effectively consider other factors that are associated with successful implementation of CPGs, namely the quality of evidences used to set up the guideline, the feasibility of the recommendations, the professionalism of the guideline developers, the affordability of resources, and the characteristics of the patients, providers, and health care organizations.32
Conclusion
Our analysis shows that adherence to CPG for DM in the PHC-UNRWA and PHC-MoH was relatively low. In the PHC-MoH, the most dominant culture was the clan/group, followed by hierarchical, rational, and finally developmental. In the PHC-UNRWA, the prevailing culture was hierarchical, followed by clan/group, rational, and then developmental. Although some significant correlations were found between the provider adherence to the diabetic guideline in the PHC-MoH and the clan and developmental archetypes, these relationships were rather marginal. In the PHC-UNRWA, no significant association between the adherence and any type of the OC was detected. Future research should preferably mix quantitative and qualitative approaches and explore the use of instruments more sensitive to measure such a complex construct and their effects on the guideline adherence in small-sized clinics.
Strengths and limitations
The evaluation of the OC was totally based on a common and widely used theoretical framework of the CVF. The adherence was assessed based on 10 key recommendations elicited from the existing diabetic guideline in order to ensure a common understanding among participants and achieve a maximum representation of the various main recommendations. The sample was a census from 71 PHC clinics with a high response rate (93.3%). A potential limitation of our study is the reliance on self-reported data, which may lead to recall bias and social desirability bias. Our analysis was based on quantitative data which could not capture the extent to which the OC influences the guideline adherence.
Acknowledgments
The authors would like to deeply thank all the participants and validators. Special thanks and appreciation are extended to Dr Ayman Abu Mostafa, Mr Jehad Okasha, and Ms Tagreed Al-Ghoti for their assistance in data analysis.
Author contributions
All the authors have contributed significantly to this research work. The authors (MR, AAS, AR, and AT) significantly contributed to the study design and the critical review of the manuscript. The principal investigator (MR) collected, analyzed, interpreted the data, and wrote the first draft of the manuscript. The authors (SAD and AE) remarkably contributed to the analysis and interpretation of data. Final approval was given by all the authors. All authors contributed toward data analysis, drafting and revising the paper and agree to be accountable for all aspects of the work.
Disclosure
The authors report no conflicts of interest in this work.
References
WHO. Global Report on Diabetes. Geneva: WHO; 2016. | ||
Seuring T, Archangelidi O, Suhrcke M. The economic costs of type 2 diabetes: a global systematic review. Pharmacoeconomics. 2015;33(8):811–831. | ||
Abu-Rmeileh NME, Husseini A, O’Flaherty M, Shoaibi A, Capewell S. Forecasting prevalence of type 2 diabetes mellitus in Palestinians to 2030: validation of a predictive model. Lancet. 2012;380:S21. | ||
Schein E. Organizational Culture and Leadership. San Francisco: Josey-Bass; 1985. | ||
Bloor G, Dawson P. Understanding professional culture in organizational context. Organ Stud. 1994;15(2):275–295. | ||
Zazzali JL, Alexander JA, Shortell SM, Burns LR. Organizational culture and physician satisfaction with dimensions of group practice. Health Serv Res. 2007;42(3 Pt 1):1150–1176. | ||
Shortell SM, O’Brien JL, Carman JM, et al. Assessing the impact of continuous quality improvement/total quality management: concept versus implementation. Health Serv Res. 1995;30(2):377–401. | ||
Rondeau KV, Wagar TH. Hospital chief executive officer perceptions of organizational culture and performance. Hosp Top. 1998;76(2):14–21. | ||
Brazil K, Wakefield DB, Cloutier MM, Tennen H, Hall CB. Organizational culture predicts job satisfaction and perceived clinical effectiveness in pediatric primary care practices. Health Care Manage Rev. 2010;35(4):365–371. | ||
Meterko M, Mohr DC, Young GJ. Teamwork culture and patient satisfaction in hospitals. Med Care. 2004;42(5):492–498. | ||
Bosch M, Dijkstra R, Wensing M, van der Weijden T, Grol R. Organizational culture, team climate and diabetes care in small office-based practices. BMC Health Serv Res. 2008;8:180. | ||
Hann M, Bower P, Campbell S, Marshall M, Reeves D. The association between culture, climate and quality of care in primary health care teams. Fam Pract. 2007;24(4):323–329. | ||
Beaton DE, Bombardier C, Guillemin F, Ferraz MB. Guidelines for the process of cross-cultural adaptation of self-report measures. Spine. 2000;25(24):3186–3191. | ||
Lynn MR. Determination and quantification of content validity. Nurs Res. 1986;35(6):382–385. | ||
Quinn RE, Rohrbaugh J. A competing values approach to organizational effectiveness. Public Product Rev. 1981;5(2):122–140. | ||
Gifford BD, Zammuto RF, Goodman EA. The relationship between hospital unit culture and nurses’ quality of work life. J Healthc Manag. 2002;47(1):13–25; discussion 25–26. | ||
Helfrich CD, Li Y-F, Mohr DC, Meterko M, Sales AE. Assessing an organizational culture instrument based on the competing values framework: exploratory and confirmatory factor analyses. Implement Sci. 2007;2(1):13. | ||
Shortell SM, Jones RH, Rademaker AW, et al. Assessing the impact of total quality management and organizational culture on multiple outcomes of care for coronary artery bypass graft surgery patients. Med Care. 2000;38(2):207–217. | ||
Widyahening IS, van der Graaf Y, Soewondo P, Glasziou P, van der Heijden GJ. Awareness, agreement, adoption and adherence to type 2 diabetes mellitus guidelines: a survey of Indonesian primary care physicians. BMC Fam Pract. 2014;15(1):72. | ||
Cabana MD, Rand CS, Powe NR, et al. Why don’t physicians follow clinical practice guidelines? A framework for improvement. JAMA. 1999;282(15):1458–1465. | ||
Hepner KA, Rowe M, Rost K, et al. The effect of adherence to practice guidelines on depression outcomes. Ann Int Med. 2007;147(5):320–329. | ||
Bero LA, Grilli R, Grimshaw JM, Harvey E, Oxman AD, Thomson MA. Closing the gap between research and practice: an overview of systematic reviews of interventions to promote the implementation of research findings. The Cochrane Effective Practice and Organization of Care Review Group. BMJ. 1998;317(7156):465–468. | ||
Grimshaw JM, Thomas RE, MacLennan G, et al. Effectiveness and efficiency of guideline dissemination and implementation strategies. Health Technol Assess. 2004;8(6):iii–iv, 1–72. | ||
Eccles M, Grimshaw J, Walker A, Johnston M, Pitts N. Changing the behavior of healthcare professionals: the use of theory in promoting the uptake of research findings. J Clin Epidemiol. 2005;58(2):107–112. | ||
Nembhard IM, Singer SJ, Shortell SM, Rittenhouse D, Casalino LP. The cultural complexity of medical groups. Health Care Manage Rev. 2012;37(3):200–213. | ||
Zazzali JL, Alexander JA, Shortell SM, Burns LR. Organizational culture and physician satisfaction with dimensions of group practice. Health Serv Res. 2007;42(3 Pt 1):1150–1176. | ||
Berlowitz DR, Young GJ, Hickey EC, et al. Quality improvement implementation in the nursing home. Health Serv Res. 2003;38(1 Pt 1):65–83. | ||
Bosch M, Halfens RJ, van der Weijden T, Wensing M, Akkermans R, Grol R. Organizational culture, team climate, and quality management in an important patient safety issue: nosocomial pressure ulcers. Worldviews Evid Based Nurs. 2011;8(1):4–14. | ||
Wicke D, Coppin R, Payne S. Teamworking in nursing homes. J Adv Nurs. 2004;45(2):197–204. | ||
Shortell SM, Zazzali JL, Burns LR, et al. Implementing evidence-based medicine: the role of market pressures, compensation incentives, and culture in physician organizations. Med Care. 2001;39(7 Suppl 1):62–78. | ||
Scott T, Mannion R, Davies H, Marshall M. The quantitative measurement of organizational culture in health care: a review of the available instruments. Health Serv Res. 2003;38(3):923–945. | ||
Grimshaw J, Eccles M, Tetroe J. Implementing clinical guidelines: current evidence and future implications. J Contin Educ Health Prof. 2004;24 (Suppl 1):S31–S37. |
 © 2017 The Author(s). This work is published and licensed by Dove Medical Press Limited. The full terms of this license are available at https://www.dovepress.com/terms.php and incorporate the Creative Commons Attribution - Non Commercial (unported, v3.0) License.
By accessing the work you hereby accept the Terms. Non-commercial uses of the work are permitted without any further permission from Dove Medical Press Limited, provided the work is properly attributed. For permission for commercial use of this work, please see paragraphs 4.2 and 5 of our Terms.
© 2017 The Author(s). This work is published and licensed by Dove Medical Press Limited. The full terms of this license are available at https://www.dovepress.com/terms.php and incorporate the Creative Commons Attribution - Non Commercial (unported, v3.0) License.
By accessing the work you hereby accept the Terms. Non-commercial uses of the work are permitted without any further permission from Dove Medical Press Limited, provided the work is properly attributed. For permission for commercial use of this work, please see paragraphs 4.2 and 5 of our Terms.