")
Back to Journals » Drug Design, Development and Therapy » Volume 9
Influence of glucosamine on the bioactivity of insulin delivered subcutaneously and in an oral nanodelivery system
Authors Al-Kurdi Z, Chowdhry B, Leharne S, Qinna N , Al Omari M, Badwan A
Received 8 July 2015
Accepted for publication 6 September 2015
Published 19 November 2015 Volume 2015:9 Pages 6167—6176
DOI https://doi.org/10.2147/DDDT.S91974
Checked for plagiarism Yes
Review by Single anonymous peer review
Peer reviewer comments 3
Editor who approved publication: Prof. Dr. Wei Duan
Zakieh I Al-Kurdi,1,2 Babur Z Chowdhry,2 Stephen A Leharne,2 Nidal A Qinna,3 Mahmoud MH Al Omari,1 Adnan A Badwan1
1The Jordanian Pharmaceutical Manufacturing Company (PLC), Naor, Jordan; 2Faculty of Engineering and Science, University of Greenwich, Medway Campus, Kent, UK; 3Department of Pharmacology and Biomedical Sciences, Faculty of Pharmacy and Medical Sciences, University of Petra, Amman, Jordan
Abstract: The aim of the work reported herein was to study the effect of glucosamine HCl (GlcN·HCl) on the bioactivity (BA) of insulin, administered via subcutaneous (SC) and oral routes, in adult male Sprague Dawley rats. The oral insulin delivery system (insulin–chitosan reverse micelle [IC-RM]) was prepared by solubilizing insulin–chitosan (13 kDa) polyelectrolyte complex in a RM system consisting of oleic acid, PEG-8 caprylic/capric glycerides, and polyglycerol-6-dioleate. The BA of insulin in vivo was evaluated by measuring blood glucose level using a blood glucose meter; the results revealed that the extent of hypoglycemic activity of SC insulin was GlcN·HCl dose dependent when they were administered simultaneously. A significant reduction in blood glucose levels (P<0.05) was found for the insulin:GlcN·HCl at mass ratios of 1:10 and 1:20, whereas lower ratios (eg, 1:1 and 1:4) showed no significant reduction. Furthermore, enhancement of the action of SC insulin was achieved by oral administration of GlcN·HCl for 5 consecutive days prior to insulin injection (P<0.05). For oral insulin administration via the IC-RM system, the presence of GlcN·HCl increased the hypoglycemic activity of insulin (P<0.05). The relative BA were 6.7% and 5.4% in the presence and absence of GlcN·HCl (ie, the increase in the relative BA was approximately 23% due to incorporating GlcN·HCl in the IC-RM system), respectively. The aforementioned findings offer an opportunity to incorporate GlcN·HCl in oral insulin delivery systems in order to enhance a reduction in blood glucose levels.
Keywords: oral insulin, bioactivity, glucosamine, low molecular weight chitosan, nanoparticles
Introduction
Glucosamine (2-amino-2-deoxy-d-glucose; GlcN) is an endogenous amino monosaccharide synthesized in the body via the hexosamine biosynthetic pathway (HBP).1
GlcN can also be obtained from exogenous sources in which it is phosphorylated to glucosamine-6-phosphate by hexokinase, which then bypasses glutamine:fructose-6-phosphate amidotransferase to HBP.2 Salts of GlcN (chloride or sulfate) differ in their pharmacokinetic parameters; however, body exposure to either salt is the same as when ingested; both salts dissociate fully yielding free GlcN, and the bioavailability of GlcN derived from either source is expected to be the same.3 In addition, extracellular GlcN is transported into muscle and adipose tissue via specific glucose transporters (GLUT1, 2, and 4). Whereas GLUT1 and GLUT4 have similar apparent affinities for glucose and GlcN, GLUT2 has a 20-fold higher affinity for GlcN than for glucose.4
GlcN is one of the most widely used over the counter dietary supplements for the management of osteoarthritis.5 The therapeutic effect of GlcN in osteoarthritis is due to its immunomodulatory activity,6 and via inhibition of the COX-2 enzyme.7 GlcN has also been shown to display antioxidant activity,8 increase the biosynthesis of glutathione,9,10 and affect transcription regulation in response to stress (Forkhead Box O4 induction).11
Marshall et al12 have examined the effect of GlcN on glucose metabolism and insulin secretion. They hypothesized that insulin resistance, resulting from chronic hyperglycemia, might be related to the increased flux of metabolites through the HBP. The effect of increasing GlcN concentrations on glucose transport and glycogen synthesis, in muscle and adipose tissues has also been investigated.13 GlcN inhibits the glucose transporter system, GLUT4, further limiting glucose entry into cells and reduces glucose storage via glycogen. Infusion of GlcN to normal rats induces insulin resistance in several insulin sensitive tissues including muscle, heart, liver, and adipose tissue.14 In human clinical studies,15 a large amount of GlcN (7.2–9.7 g, 1.6–5.0 μmol/min/kg) was infused over a 5-hour period with no change in blood glucose levels. Reginster et al16 studied the effect of GlcN sulfate supplementation (1.5 g/day) given to participants for a period of 3 years. The study showed that blood glucose values were slightly lower than baseline values. A recent study by Jae et al17 described a pharmaceutical formulation comprising GlcN·HCl as an active ingredient for the treatment of diabetes in order to lower blood sugar levels. The proposed formulation can be administered (0.1–1.0 g/kg) orally, transdermally, subcutaneously, intravenously, or intramuscularly.17
The co-administration of GlcN, a highly used over-the-counter product, with hypoglycemic drugs in diabetic patients is worthy of attention. Recently, it has been shown that the co-administration of GlcN with paracetamol18 and statin19 may inhibit the metabolism of these drugs by lowering the concentration of paracetamol metabolites (paracetamol mercapurate and paracetamol cysteine), which may subsequently influence the side effects of these drugs.
Using chitosan and modified chitosan to deliver insulin via the oral route by nanoparticles has been widely investigated.20 Badwan et al21 described a novel system based on solubilization of insulin–chitosan polyelectrolyte complex (IC-PEC) in a reverse micelle (RM) system synthesized using PEG-8 caprylic/capric glycerides and glycerol-6-dioleate as emulsifying agents and dispersed in oleic acid. RM system characterization, factors affecting the physical and chemical stability of this system and its bioactivity (BA) were investigated.22–24
However, to the best of our knowledge, the effect of GlcN on the pharmacological activity of orally delivered insulin has not been reported in the literature. In the current work, an oral insulin delivery system (insulin–chitosan reverse micelles [IC-RMs]) was prepared by solubilizing IC-PEC in a RM system consisting of oleic acid, PEG-8 caprylic/capric glycerides, and polyglycerol-6-dioleate and then characterized by different techniques. Furthermore, the effect of incorporating GlcN in subcutaneous (SC) and in IC-RM oral preparations administrated to rats on the BA of insulin was also investigated.
Materials and methods
Materials
USP human insulin RS (26.4 USP insulin human units/mg, lot No J0J250) was purchased from USP Convention (Rockville, MD, USA). Recombinant human insulin of pharmaceutical grade (99.4%), standardized by using USP insulin human RS and GlcN·HCl (99.1%) were purchased from Biocon (Electronics City, Bangalore, India). Chitosan HCl (250 kDa, 95% degree of deacetylation [DDA]) was obtained from Xiamen Xiang (Shanghai, People’s Republic of China). Low molecular weight chitosan (LMWC), 13 kDa, of 99% DDA was obtained by the depolymerization of chitosan according to a previously published method.25 Vegetable oleic acid was purchased from Merck KGaA (Bundesland Hesse, Darmstadt, Germany). Labrasol® (PEG-8 caprylic/capric glycerides) and Plurol® Oleique CG (polyglycerol-6-dioleate) were purchased from Gattefosse (Saint-Priest, Lyon, France). Streptozotocin (STZ) (>98%) was purchased from Sigma-Aldrich (St Louis, MO, USA). The Jordanian Pharmaceutical Manufacturing Company (Naor, Jordan) provided purified water. All other chemicals were of analytical grade.
Preparation of insulin solution
Insulin, 35 mg, was dissolved in 1 mL of 0.1 N HCl, neutralized with 0.1 N NaOH and the volume made up to10 mL with Tris (hydroxymethyl aminomethane) buffer (pH 6.5). Then 1 mL of this solution was diluted to 100 mL with water to obtain a solution at a concentration of 0.035 mg/mL of insulin (equivalent to 1 insulin unit [IU]/mL).
Preparation of GlcN solutions
Appropriate amounts of GlcN HCl were separately dissolved in water to obtain solutions at concentrations of 12.5, 25, and 50 mg/mL.
Preparation of insulin–GlcN·HCl mixture solutions
Equal volumes of insulin stock solution (2 IU/mL), prepared following the aforementioned procedure, and GclN HCl solutions at concentrations of 0.07, 0.28, 0.70, and 1.32 mg/mL were gently mixed using a magnetic stirrer. The solutions obtained contained insulin at a concentration of 1 IU/mL and different insulin:GlcN HCl mass ratios of 1:1, 1:4, 1:10, and 1:20, respectively.
Preparation of IC-RM
IC-PEC and IC-RM systems were prepared following the method reported by Elsayed et al;22 30 mg of LMWC powder was dissolved in water, the pH was adjusted to 5.5 with 0.1 N NaOH and the volume made up to 10 mL with water. A total of 70 mg of insulin powder was dissolved in 0.1 N HCl, neutralized with 0.1 N NaOH, and the volume adjusted to 10 mL with 1 M Tris (hydroxylmethyl aminomethane) buffer, pH 6.5. The IC-PEC was prepared by gently mixing equal volumes of LMWC and insulin solutions in a glass vial using a magnetic stirrer. The prepared IC-PEC contained 100 IU/mL of insulin and 1.5 mg LMWC/mL.
The same procedure was used to prepare another IC-PEC containing GlcN·HCl. A total of 420 mg GlcN·HCl was initially dissolved in the insulin solution prior to mixing with LMWC solution. The prepared IC-PECGlcN contained 21 mg GlcN·HCl/mL.
In order to prepare the IC-RMs, 80 g of oleic acid and 20 g of surfactant mixture were mixed together for 5 minutes; 8 mL of IC-PEC was added to the mixture of oleic acid and surfactant and mixed using a magnetic stirrer (250× g for 5 minutes). A surfactant mixture of Labrasol® and Plurol® Oleique CG was prepared at a mass ratio of 1:1 by mixing the constituents using a magnetic stirrer for 5 minutes. The two IC-RM systems prepared contained 6.7 IU/mL of insulin with and without 2.8 mg GlcN·HCl/mL, respectively.
Characterization of LMWC, IC-PEC, and IC-RMs
The LMWC was characterized by Fourier transform infrared spectroscopy (FT-IR) (Thermo Scientific Nicolet Avatar 360 FT-IR ESP Spectrometer, Madison, WI, USA) using a KBr pellet. FT-IR spectra were obtained in the 400–4,000 cm−1 range at a resolution of 2 cm−1 with a minimum of 16 scans per spectrum. All measurements were undertaken at room temperature.
The film of LMWC, obtained after freeze-drying on glass Petri dishes for 24 hours, was examined visually and photographed using a Sony Cybershot digital camera (Tokyo, Japan). Furthermore, the morphology of the LMWC was ascertained using a FEI Quanta 200 Scanning Electron Microscopy (Hillsboro, OR, USA).26
The amount of insulin entrapped within the IC-PEC was determined indirectly in the supernatant following separation of IC-PEC and nonassociated insulin by centrifugation at 14,000× g for 30 minutes. The supernatant was assayed for insulin content by high-performance liquid chromatography (HPLC) at 214 nm (the HPLC system consisted of a TSP 1000 pump system, a TSP 1000 UV-VIS detector, and a TSP AS 3000 autosampler [Thermo Separation Products, Waltham, MA, USA]). A C18 (L1) column (particle size 5 μm), dimensions of 4.6×150 mm (Thermo column from Thermo Fisher Scientific Inc., Rockford, IL, USA), maintained at 40°C during analysis, was used as the stationary phase, together with a Lichrospher 100 RP-18, 5 μm particle size guard column (Merck, Darmstadt, Germany). Elution was performed isocratically (flow rate 1 mL/minute) using sulfate buffer pH 2.3-acetonitrile (73/27, v/v) as the mobile phase and the injection volume of 20 μL.24 The verification results of the HPLC method showed a linear response for signal output versus insulin concentration over the concentration range of 0.9–10 mg insulin/mL with a R2 value >0.995. The intra- and interday relative standard deviation values were less than 2%, indicating good precision. No interfering peaks from the components of the delivery systems were detected. The resolution factor between insulin and A-21 desamido insulin was >2.0, indicating that the method is specific. The method sensitivity was proved by low detection limit (0.02 mg/mL) and quantitation limit (0.08 mg/mL) values.24
The mean diameter and zeta potential of IC-PEC and IC-RM were determined by dynamic light scattering using a Zetasizer Nano ZS instrument (Malvern Instruments, Malvern, UK). Replicate measurements (n=6) were carried out at 25°C using a detection angle of 90°.24
In vivo pharmacological activity evaluation
Animal handling
Adult male Sprague Dawley rats (200–250 g) were purchased from Yarmouk University, Irbid, Jordan and accommodated at Petra University Animal House Unit, Amman, Jordan, under standard temperature, humidity, and photoperiod light cycles. All rats were acclimatized for 10 days before experimenting day and received standard chow and tap water ad libitum. Animal care and use were performed in compliance with guidelines of the Federation of European Laboratory Animal Science Association and European Union (Council Directive 86/609/EEC). The study protocol (SUG/13/45) was revised and approved by the Ethical Committee of The Jordanian Pharmaceutical Manufacturing Company, Naor, Jordan.
Induction of diabetes using STZ
Diabetes was induced in rats by intraperitoneal injection of two doses of 80 mg STZ/kg over 2 days. STZ was freshly prepared by dissolving in 0.1 M citrate buffer pH 4.5. Only fasted rats (18 hours, drinking water ad libitum) with a basal blood glucose level above 200 mg/dL were considered diabetic. Blood samples were collected directly from each rat’s tail and blood glucose measurements (in mg/dL) were performed using a blood glucose meter (GlucoDr, All Medicines, Korea).
SC experimental design
For all experiments, a group of rats was injected SC with 1 IU/kg insulin (control group).
Nondiabetic fasted rats were randomized into groups (n=10 rats per group). The initial blood glucose level at 0 hour was determined for each rat just before sample injection and at time intervals of 0.5, 1, 2, 3, and 4 hours post-SC injection.
GlcN·HCl solutions, which represent doses of 0, 50, 100, and 200 mg/kg, were individually injected SC 30 minutes prior to injection of insulin solution (1 IU/kg) and changes in blood glucose levels were monitored.
In other experiments, the effect of simultaneous SC administration of insulin and GlcN·HCl on insulin BA was investigated by injection of insulin–GlcN·HCl solutions, which contained 1 IU/kg insulin and different insulin:GlcN·HCl mass ratios of 1:0, 1:1, 1:4, 1:10, and 1:20.
Furthermore, rats with free access to food were offered either water or GlcN-HCl solution at a concentration of 25 mg/mL in the feeding bottles ad libitum for 24 hours for 5 consecutive days. At day 6, the fasted rats were injected with insulin solution (1 IU/mL) and changes in blood glucose levels were monitored.
Oral experimental design
STZ diabetic rats (n=10) were randomized into two groups. One group received IC-RMs and the other group received IC-RMs containing 2.8 mg GlcN·HCl/mL. This group of animals received the samples orally using a stainless steel oral gavage needle. Blood sampling for glucose measurements were undertaken at time intervals of 0, 1, 2, 3, 4, 5, 6, 8, and 10 hours postsample administration.
Data and statistical analysis
Blood glucose levels are expressed as the mean percentage of the baseline glucose levels, and plotted against time to evaluate the cumulative hypoglycemic effect over time. Glucose level profiles were quantified by the area above the curve (AAC) following the trapezoidal rule. All data are expressed as mean values ± standard error of means. One way analysis of variance followed by Tukey’s post hoc test for multiple comparisons were used for statistical evaluation (SPSS 17, Chicago, IL, USA). P-values <0.05 were considered significant.
Figure 1 represents the scheme of IC-PEC and IC-RM preparations, administration, and monitoring glucose level in rat.
 | Figure 1 Scheme of present work procedures including IC-PEC and IC-RM system preparations, administration, and glucose level measurement. |
Results
Preparation and characterization of IC-PEC and IC-RM
In previous reports,24,26 the preparation of LMWCs of different molecular weights and % DDA and their effects on the physicochemical and BA properties of oral insulin delivery system were investigated. In the current work, 13 kDa LMWC was selected because this molecular weight of chitosan gave an optimal oral formulation with respect to its physical and chemical stability.24 Samples of 13 kDa LMWC were prepared by acid hydrolysis and characterized by different techniques.26 The full deacetylation of 13 kDa LMWC was confirmed using FT-IR by the absence of an amide I band at 1,650 cm−1, while the band corresponding to free amino acid (amide II) occurred at 1,574 cm−1 (Figure 2A). The surface morphology (Figure 2B) showed that the film of 13 kDa LMWC with DDA 100% was arranged as thick and rigid fiber when compared with LMWC that had thin and fragile fibers, while the scanning electron microscope image (Figure 2C) showed that the fully deacetylated LMWC has a rough and irregular surface.26
 | Figure 2 Characterization of 13 kDa LMWC with 100% DDA. |
The IC-PEC and IC-RM systems were prepared following the scheme in Figure 1 and characterized. They displayed a homogeneous size distribution with a mean diameter of 100 and 300 nm, respectively (Table 1). The zeta potential measurements gave an overall positive charge and good encapsulation efficiency (76.2%) as determined by HPLC analysis.
 | Table 1 Characteristics of IC-PEC and IC-RM |
Effect of GlcN·HCl SC administration on insulin BA
The presence of GlcN·HCl prior to SC injection of insulin (1 IU/kg) significantly enhanced the action of insulin by reducing the blood glucose levels of the tested rats (P<0.01). In the post hoc analysis, the reduction in blood glucose levels was confirmed to be significant at GlcN·HCl doses of 50, 100, and 200 mg/kg. Therefore, a dose-dependent effect of GlcN·HCl on enhancing the BA of insulin could be inferred. The maximum glucose reduction was also obtained in rats pretreated with 200 mg GlcN·HCl/kg where the glucose level reached 47% (Figure 3).
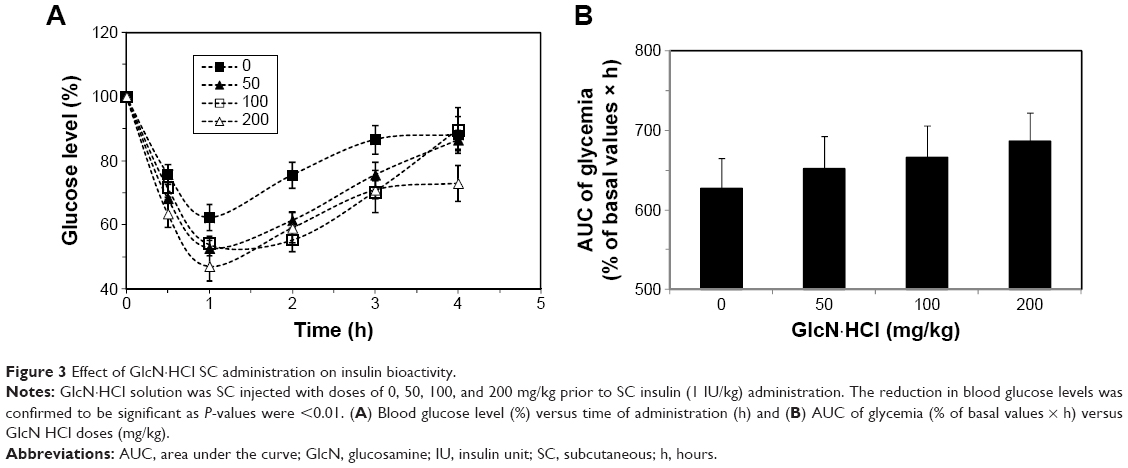 | Figure 3 Effect of GlcN·HCl SC administration on insulin bioactivity. |
Effect of simultaneous SC insulin–GlcN·HCl administration on insulin BA
Blood glucose levels of fasted rats administered insulin–GlcN·HCl solutions at different insulin–GlcN·HCl mass ratios (1:0, 1:1, 1:4, 1:10, and 1:20) are presented in Figure 4. The hypoglycemic activity of insulin in the presence of GlcN·HCl was retained and the onset of action was rapid and similar to that of free insulin. The maximum reduction in glucose levels was detected 30–60 minutes after insulin injection in all tested groups of animals. The hypoglycemic effects of 1:1 and 1:4 insulin–GlcN·HCl solutions were comparable to those of free insulin with a small increase in glucose levels at all time intervals except 0.5 hours (P>0.05). However, mixtures prepared at mass ratios of 1:10 and 1:20 induced significant reductions in the blood glucose levels of the tested rats. Such reductions were confirmed statistically significant compared to the free insulin group at 0.5 and 4 hours time intervals, as revealed by Tukey’s multiple comparison test (P<0.05).
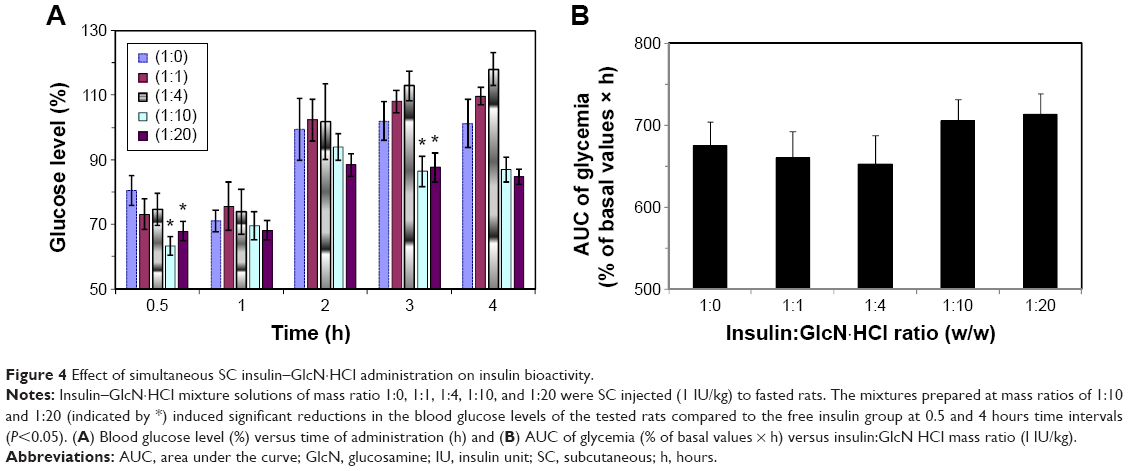 | Figure 4 Effect of simultaneous SC insulin–GlcN·HCl administration on insulin bioactivity. |
Effect of continuous oral GlcN·HCl administration on insulin BA
Feeding rats ad libitum with 25 mg GlcN·HCl/mL for 5 days enhanced the action of SC insulin (1 IU/kg), as shown in Figure 5. Blood glucose levels post-SC insulin administration were significantly reduced when rats were continuously fed with GlcN·HCl compared to rats offered water in the feeding bottles (P=0.028). By comparing the effect at different time intervals, the reduction was revealed to be significant at 1 and 3 hours postinsulin administration (P<0.05).
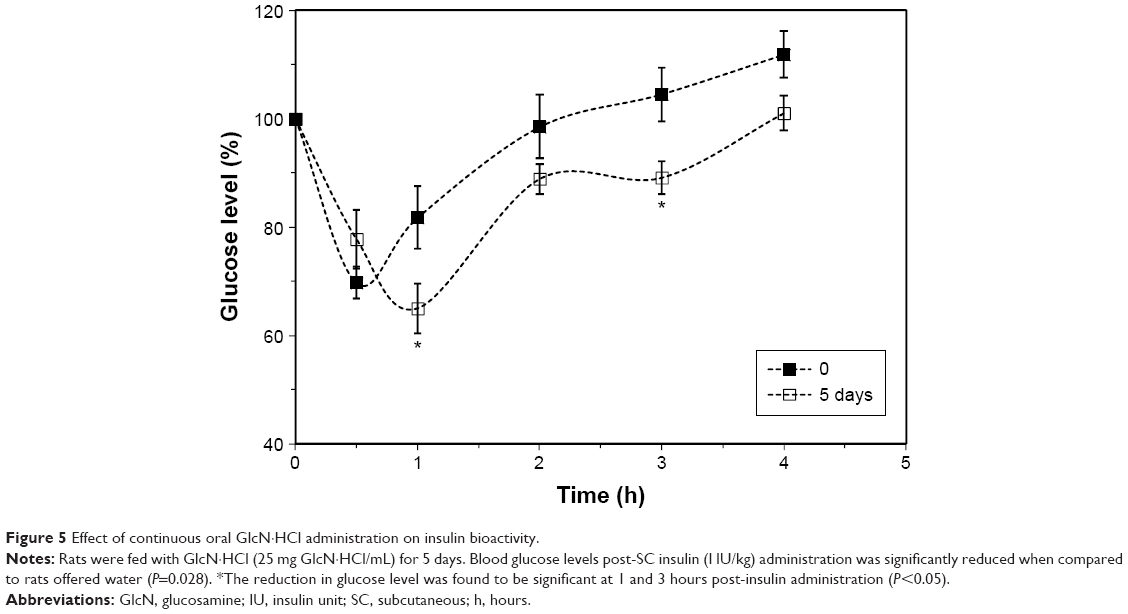 | Figure 5 Effect of continuous oral GlcN·HCl administration on insulin bioactivity. |
The minimum glucose level in the case of GlcN-fed rats reached 66.2%±5.0% compared to 69.7%±2.9% glucose level of water-fed rats, such difference was not significant (P>0.05). However, the minimum glucose level for GlcN-fed group was reached 1 hour postinsulin administration (Tmin) compared to 0.5 hour for water-fed group. Moreover, due to such action of GlcN on reducing glucose level and shifting Tmin, the calculated AAC for GlcN (658.7±18.5) was found significantly different (P<0.05) from the calculated AAC for water-fed group (619.8±16.1).
Effect of GlcN·HCl in IC-RM BA
The effect of incorporating GlcN·HCl in IC-RM preparations on the BA of insulin in diabetic rats is shown in Figure 6 and the corresponding pharmacokinetic parameters for glucose levels are shown in Table 2. The results obtained indicate that the hypoglycemic activity of IC-RM containing GlcN·HCl was higher (BA =6.7) compared with IC-RM containing no GlcN·HCl (BA =5.4) and that such a difference is significant (P<0.05).
 | Figure 6 Effect of GlcN·HCl on IC-RM bioactivity in diabetic rats. |
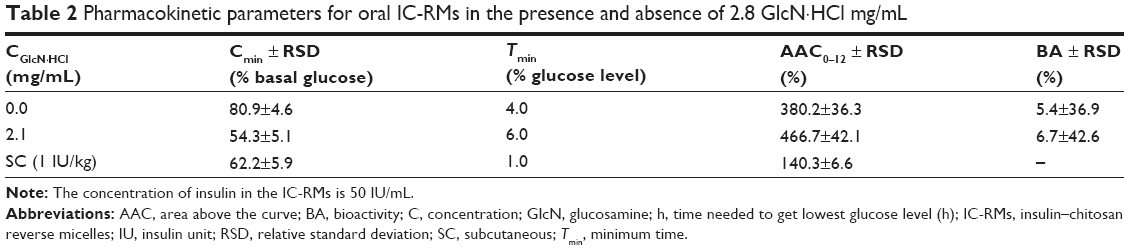 | Table 2 Pharmacokinetic parameters for oral IC-RMs in the presence and absence of 2.8 GlcN·HCl mg/mL |
Discussion
GlcN is a widely used dietary supplement that is described as efficacious and safe for many individuals with osteoarthritis especially of the knees.27
As previously stated, in vitro studies by Marshall et al12 showed that exogenous GlcN could increase the activity of HBP, a metabolic process that is believed to function as a nutrient sensor modulating insulin resistance. Increasing tissue levels of GlcN also impair insulin secretion.28 To assess the biological importance of these studies it is important to compare the GlcN concentrations used in vitro with those expected in vivo. Interference with glucose metabolism occurs only at concentrations comparable with those of GlcN≈6.6 mmol; a concentration that is several hundred folds greater than plasma concentrations that occur during oral GlcN therapy in humans.29 At these concentrations (<10 μmol/L) GlcN neither augments the HBP nor does it reduce mediated glucose uptake.30,31
In this study, the SC coadministration of insulin and GlcN yielded different results depending on the ratios of insulin:GLcN used (Figure 1). At ratios of 1:1 and 1:4, the hypoglycemic effect was similar to insulin as no significant difference was obtained. However, at ratios of 1:10 and 1:20, the hypoglycemic effect was higher than insulin alone. GlcN can reduce blood glucose levels;16,17 the mechanism is not well understood. However, it might be related to the role of ATP depletion.32 The effect is only observed at 2 and 3 hours, thus supporting the role of ATP depletion in enhancing the hypoglycemic effect of insulin,2–4 and that GlcN as a COX-2 inhibitor will prevent insulin degradation.7
When GlcN·HCl was administered SC 30 minutes before insulin, the reduction in the level of glucose was greater when compared with insulin alone (Figure 2). The peak level of GlcN·HCl is approximately 2 hours and the maximum hypoglycemic effect occurs between 1 and 2 hours, taking into account that GlcN·HCl was administered 30 minutes before insulin. GlcN·HCl at a dose of 100 mg/kg showed a different hypoglycemic peak effect compared to other (50 and 200 mg/kg) concentrations. The time at minimum glucose level for doses of 50 and 200 mg/kg was at 1 hour, similar to a dose of insulin alone, while for GlcN·HCl at a dose of 100 mg/kg a minimum glucose level was obtained after 1.5 hours as GlcN is rapidly absorbed. After 6 hours, the GlcN·HCl level is minimal as plasma GlcN is eliminated,33 that is, the least effect on insulin activity. The decrease in blood glucose level is most likely due to ATP depletion. Such an effect leads to a decrease in insulin degradation, which explains the lower glucose levels at 1, 2, 3, and 4 hours.
Insulin is metabolized in the liver by the oxidoreductase behavior of a protein–disulfide isomerase, also known as glutathione–insulin transhydrogenase enzyme. This enzyme breaks the disulfide bonds of insulin, thereby causing its degradation.34 As the enzyme is an oxidoreductase and depends on NADH to degrade insulin, it might be inhibited by ATP/NADH depletion state as was noted in cytochrome P450 and GlcN.35
In this study, blood glucose levels tended to decrease compared to the control group in the group fed with 100 mg GlcN·HCl/kg for 5 days. GlcN HCl is usually taken orally and in human (≈90%) is absorbed,36 orally administered GlcN HCl has only 26% of the bioavailability of the intravenously administered form of GlcN HCl in humans37 and as 20% in rats.38 Data on pharmacokinetics, bioavailability, and metabolism of GlcN in rats38 are similar to those reported for human.36 Plasma GlcN is eliminated in approximately 10 hours postdosing. Pharmacokinetic parameters for GlcN, after multiple doses for 7 days, indicated no significant accumulation effects.33 This may be explained by the fact that the absorption of orally administered GlcN is limited, which is due to its dependence on facilitated transport and presystemic loss brought by the gut microbiota and so the liver is not exposed to high concentrations of GlcN in the portal venous blood even when it is consumed at high concentrations. So feeding of GlcN·HCl for 5 days is not increasing plasma GlcN·HCl levels.39,40 Based on such facts, we can explain why the hypoglycemic effect was not more pronounced than that of a single dose of GlcN·HCl. It seems, as anticipated, that GlcN homeostasis is responsible for preventing the accumulation of GlcN.
Encapsulation of GlcN·HCl in nanoparticles using chitosan as a polymer together with insulin for oral delivery was not investigated. We solubilized GlcN·HCl with IC-PEC inside RMs in order to evaluate its effect on insulin administered orally. The use of the micellar delivery system avoids the effects of pepsin and protects insulin from degradation, minimizing the effect of degrading enzymes on insulin. Therefore, part of insulin activity is retained. In the presence of GlcN·HCl, the hypoglycemic effect of insulin encapsulated in the RMs is higher than that obtained using insulin alone. The relative BA was calculated to be 6.7% compared to a value of 5.4% obtained for the group of rats treated with the RMs, which did not contain GlcN·HCl. The BA obtained for insulin delivered through the micellar system reflect that part of insulin activity is retained. Higher value is obtained when GlcN HCl is encapsulated with insulin in RMs, this result may be because when GlcN·HCl is given orally together with insulin it will enter the hepatic portal system and so it is carried through the portal vein into the liver, where most drug metabolism occurs. The biological activity of GlcN HCl on drug metabolism enzymes (DMEs) has been reported.35,41 Total cytochrome P450 content in liver decreased with rats fed with GlcN·HCl. Modulation of DME activity by GlcN may originate from indirect action on the immune system as this alters DME expression.42 However, it must be noted that all in vivo experiments were conducted on STZ diabetic rats and alteration of the metabolism might be expected due to the toxicity of the diabetogenic agent.43
Conclusion
LMWC was prepared and characterized. Oral nanodelivery system was prepared by solubilizing IC-PEC in RM system. The effect of SC administration of GlcN on insulin bioavailability was evaluated; the results showed a dose-dependent effect of GlcN. The cosolubilization of GlcN with insulin in the RMs effectively reduced blood glucose levels in rats in vivo. Further studies are needed to verify the actual mechanism.
Disclosure
The authors report no conflicts of interest in this work.
References
Groves JA, Lee A, Yildirir G, Zachara NE. Dynamic O-GlcNAcylation and its roles in the cellular stress response and homeostasis. Cell Stress Chaperon. 2013;18(5):535–558. | ||
Chatham JC, Marchase RB. Protein O-GlcNAcylation: a critical regulator of the cellular response to stress. Curr Signal Transduct Ther. 2010;5(1):49–59. | ||
Aghazadeh-Habashi A, Jamali F. The glucosamine controversy: a pharmacokinetic issue. J Pharm Pharm Sci. 2011;14(2):264–273. | ||
Mueckler M, Thorens B. The SLC2 (GLUT) family of membrane transporters. Mol Aspects Med. 2013;34(2–3):121–138. | ||
Bruno JJ, Ellis JJ. Herbal use among US elderly: 2002 National Health Interview Survey. Ann Pharmacother. 2005;39(4):643–648. | ||
Nakamura H. Application of glucosamine on human disease – osteoarthritis. Carbohydr Polym. 2011;84:835–839. | ||
Park SH, Hong H, Han YM, et al. Nonsteroidal anti-inflammatory drugs (NSAID) sparing effects of glucosamine HCl through n-glycosylation inhibition; strategy to rescue stomach from NSAID damage. J Physiol Pharmacol. 2013;64(2):157–165. | ||
Xing R, Liu S, Guo Z, et al. The antioxidant activity of glucosamine hydrochloride in vitro. Bioorg Med Chem. 2006;14(6):1706–1709. | ||
Geenen S, du Preez FB, Snoep JL, et al. Glutathione metabolism modeling: a mechanism for liver drug-robustness and a new biomarker strategy. Biochim Biophys Acta. 2013;1830(10):4943–4959. | ||
Gupta SC, Sundaram C, Reuter S, Aggarwal BB. Inhibiting NF-kB activation by small molecules as therapeutic strategy. Biochim Biophys Acta. 2010;1799(10–12):775–787. | ||
Ho SR, Wang K, Whisenhunt TR, et al. O–GlcNAcylation enhances FOXO4 transcriptional regulation in response to stress. FEBS Lett. 2010;584(1):49–54. | ||
Marshall S, Bacote V, Traxinger RR. Discovery of a metabolic pathway mediating glucose-induced desensitization of the glucose transport system. J Biol Chem. 1991;266(8):4706–4712. | ||
Nelson BA, Robinson KA, Buse MG. High glucose and glucosamine induce insulin resistance via different mechanisms in 3T3-L1 adipocytes. Diabetes. 2000;49(6):981–991. | ||
Virkamäki A, Daniels MC, Hämäläinen S, Utriainen T, McClain D, Yki-Järvinen H. Activation of the hexosamine pathway by glucosamine in vivo induces insulin resistance in multiple insulin sensitive tissues. Endocrinology. 1997;138(6):2501–2507. | ||
Pouwels MJ, Jacobs JR, Span PN, Lutterman JA, Smits P, Tack CJ. Short-term glucosamine does not affect insulin sensitivity in humans. J Clin Endocrinol Metab. 2001;86(5):2099–2103. | ||
Reginster JY, Deroisy R, Rovati LC, et al. Long-term effects of glucosamine sulphate on osteoarthritis progression: a randomised, placebo-controlled clinical trial. Lancet. 2001;357(9252):251–256. | ||
Jae LJ, Teak OS, Hee S, et al. Pharmaceutical composition for treatment of diabetes comprising glucosamine hydrochloride, capable for lowering level of blood sugar. Korea patent 1020040105540. 2006 June 20. | ||
Alkhawaja B, Arafat T, Mallah E, et al. Simultaneous determination of paracetamol and its metabolites in rat serum by HPLC method and its application supplement-drug pharmacokinetic interaction. Int J Pharm Anal. 2014;39(2):2051–2740. | ||
Al-Akkam EJ. Influence of Glucosamine and Its Polymers on the Bioavailability of Atorvastatin and Rosuvastatin in Rats [dissertation]. Baghdad: University of Baghdad; 2013. | ||
Mukhopadhyay P, Mishra R, Rana D, Kundu PP. Strategies for effective oral insulin delivery with modified chitosan nanoparticles: a review. Prog Polym Sci. 2012;37(11):1457–1475. | ||
Badwan AA, Al-Remawi M, El-Thaher T, et al. Oral delivery of protein drugs using microemulsion. European patent EP1797870. 2007 June 20. | ||
Elsayed A, Remawi MA, Qinna N, Farouk A, Badwan A. Formulation and characterization of an oily-based system for oral delivery of insulin. Eur J Pharm Biopharm. 2009;73(2):269–279. | ||
Assaf SM, Al-Jbour ND, Eftaiha AF, et al. Factors involved in formulation for proteins based on PEG-8 caprylic/capric glycerides and polyglyceryl-6-diolate in a mixture of oleic acid with chitosan. J Dispers Sci Technol. 2011;32(5)623–633. | ||
Al-Kurdi Z, Chowdhry BZ, Leharne SA, Al Omari MMH, Badwan AA. Low molecular weight chitosan–insulin polyelectrolyte complex: characterization and stability studies. Mar Drugs. 2015:13(4):1765–1784. | ||
Vårum KM, Ottøy MH, Smidsrød O. Varum. Acid hydrolysis of chitosans. Carbohydr Polym. 2001;46(1):89–98. | ||
Qinna NA, Karwi QG, Al-Jbour N, et al. Influence of molecular weight and degree of deacetylation of low molecular weight chitosan on the bioactivity of oral insulin preparations. Mar Drugs. 2015;13(4):1710–1725. | ||
Simon RR, Marks V, Leeds AR, Anderson JW. A comprehensive review of oral glucosamine use and effects on glucose metabolism in normal and diabetic individuals. Diabetes Metab Res Rev. 2011;27(1):14–27. | ||
Uldry M, Ibberson M, Hosokawa M, Thorens B. GLUT2 is a high affinity glucosamine transporter. FEBS Lett. 2002;524(1–3):199–203. | ||
Institute of Medicine and National Research Council 2004. Prototype monograph on glucosamine. In Dietary Supplements: A Framework for Evaluating Safety. C.1–C.86. | ||
Marshall S, Nadeau O, Yamasaki K. Dynamic actions of glucose and glucosamine on hexosamine biosynthesis in isolated adipocytes: differential effects on glucosamine 6-phosphate, UDP-N-acetylglucosamine, and ATP levels. J Biol Chem. 2004;279(34):35313–35319. | ||
Heart E, Choi WS, Sung CK. Glucosamine-induced insulin resistance in 3T3-L1 adipocytes. Am J Physiol Endocrinol Metab. 2000;278(1):E103–E112. | ||
Hresko RC, Heimberg H, Chi MM, Mueckler M. Glucosamine-induced insulin resistance in 3T3-L1 adipocytes is caused by depletion of intracellular ATP. J Biol Chem. 1998;273(32):20658–20668. | ||
Song M, Hang TJ, Wang C, Yang L, Wen AD. Precolumn derivatization LC–MS/MS method for the determination and pharmacokinetic study of glucosamine in human plasma and urine. J Pharm Anal. 2012;2(1):19–28. | ||
Chandler ML, Varandani PT. Kinetic analysis of the mechanism of insulin degradation by glutathione–insulin transhydrogenase. Biochemistry. 1975;14(10):2107–2115. | ||
Yao HT, Luo MN, Hung LB, et al. Effect of chitosan oligosaccharides on drug-metabolizing enzymes in rat liver and kidneys. Food Chem Toxicol. 2012;50(5):1171–1177. | ||
Setnikar I, Rovati LC. Absorption, distribution, metabolism and excretion of glucosamine sulfate. A review. Arzneimittelforschung. 2001; 51(9):699–725. | ||
Setnikar I, Palumbo R, Canali S, Zanolo G. Pharmacokinetics of glucosamine in man. Arzneimittelforschung. 1993;43(10):1109–1113. | ||
Aghazadeh-Habashi A, Sattari S, Pasutto F, Jamali F. Single dose pharmacokinetics and bioavailability of glucosamine in the rat. J Pharm Pharm Sci. 2002;5(2):181–184. | ||
Hirayama BA, Loo DD, Díez-Sampedro A, et al. Sodium-dependent reorganization of the sugar-binding site of SGLT1. Biochemistry. 2007; 46(46):13391–13406. | ||
Ibrahim A, Gilzad-kohan MH, Aghazadeh-Habashi A, Jamali F. Absorption and bioavailability of glucosamine in the rat. J Pharm Sci. 2012;101(7):2574–2583. | ||
Nam KS, Kim MK, Shon YH. Inhibition of proinflammatory cytokine-induced invasiveness of HT-29 cells by chitosan oligosaccharide. J Microbiol Biotechnol. 2007;17(12):2042–2045. | ||
Sherry CL, Kim SS, Dilger RN, et al. Sickness behavior induced by endotoxin can be mitigated by the dietary soluble fiber, pectin, through up-regulation of IL-4 and Th2 polarization. Brain Behav Immun. 2010; 24(4):631–640. | ||
Qinna NA, Badwan AA. Impact of streptozotocin on altering normal glucose homeostasis during insulin testing in diabetic rats compared to normoglycemic rats. Drug Des Dev Ther. 2015;9:2515–2525. |
 © 2015 The Author(s). This work is published and licensed by Dove Medical Press Limited. The full terms of this license are available at https://www.dovepress.com/terms.php and incorporate the Creative Commons Attribution - Non Commercial (unported, v3.0) License.
By accessing the work you hereby accept the Terms. Non-commercial uses of the work are permitted without any further permission from Dove Medical Press Limited, provided the work is properly attributed. For permission for commercial use of this work, please see paragraphs 4.2 and 5 of our Terms.
© 2015 The Author(s). This work is published and licensed by Dove Medical Press Limited. The full terms of this license are available at https://www.dovepress.com/terms.php and incorporate the Creative Commons Attribution - Non Commercial (unported, v3.0) License.
By accessing the work you hereby accept the Terms. Non-commercial uses of the work are permitted without any further permission from Dove Medical Press Limited, provided the work is properly attributed. For permission for commercial use of this work, please see paragraphs 4.2 and 5 of our Terms.