")
Back to Journals » Diabetes, Metabolic Syndrome and Obesity » Volume 12
Influence of genomic ancestry and self-reported color-race in CKD in a nationwide admixed sample of Brazilian patients with type 1 diabetes
Authors Pizarro MH , Santos DC , Melo LGN , Barros BSV , Muniz LH, Porto LC , Silva DA , Gomes MB
Received 30 March 2019
Accepted for publication 29 August 2019
Published 12 September 2019 Volume 2019:12 Pages 1831—1840
DOI https://doi.org/10.2147/DMSO.S210585
Checked for plagiarism Yes
Review by Single anonymous peer review
Peer reviewer comments 2
Editor who approved publication: Prof. Dr. Antonio Brunetti
Marcela Haas Pizarro,1 Deborah Conte Santos,1 Laura Gomes Nunes Melo,2 Bianca Senger Vasconcelos Barros,1 Luiza Harcar Muniz,1 Luís Cristóvão Porto,3 Dayse Aparecida Silva,4 Marília Brito Gomes1
1Department of Internal Medicine, Diabetes Unit, Rio de Janeiro State University (UERJ), Rio de Janeiro, Rio de Janeiro, Brazil; 2Department of Ophthalmology, Rio de Janeiro State University (UERJ), Rio de Janeiro, Rio de Janeiro, Brazil; 3Histocompatibility and Cryopreservation Laboratory (HLA), Rio de Janeiro State University (UERJ), Rio de Janeiro, Rio de Janeiro, Brazil; 4DNA Diagnostic Laboratory (LDD), Rio de Janeiro State University (UERJ), Rio de Janeiro, Rio de Janeiro, Brazil
Correspondence: Marcela Haas Pizarro
Department of Internal Medicine, Diabetes Unit, Rio de Janeiro State University (UERJ), Boulevard 28 de Setembro, 77- 3º andar - Vila Isabel, Rio de Janeiro, RJ 20551-030, Brazil
Tel +55 212 868 8224
Email [email protected]
Aims: Patients with diabetes that are African-Americans or Asians have a higher chance of developing diabetic nephropathy than Caucasian. Our objective was to evaluate the association between self-reported color-race, genomic ancestry, and the presence of chronic kidney disease (CKD), assessed by glomerular filtration rate and albuminuria in patients with type 1 diabetes.
Methods: This is a multicenter, observational, cross-sectional study with 1564 patients, conducted between August 2011 and August 2014 in 14 public clinics from 10 Brazilian cities. The ethnic aspects of the patients were evaluated using self-reported color-race and genomic ancestry (divided in European, African, and Amerindian). We divided the patients into groups: normal renal function and CKD.
Results: More patients self-declared themselves as black and brown in the group with CKD. The multivariate logistic analysis revealed that self-reported color-race was not associated with CKD and that a higher African ancestry was also not associated with CKD (p=0.06). Patients with an African ancestry of 50% or higher had an association with CKD that did not persist after the multivariate analysis.
Conclusion: In our patients, from an admixed, multi-ethnic population, we did not find an association between self-reported color-race, genomic ancestry and CKD. It is important to note that despite the fact that we did not find a significant p-value in the multivariate analysis concerning African ancestry and CKD, we found a narrow confidence interval (0.961–3.98) with an OR of 1.956. Further studies should be conducted to confirm the lack of association between African ancestry and CKD, especially from populations with higher African or Amerindian ancestries to better understand the association between self-reported color-race and genomic ancestry with CKD.
Keywords: Self-reported color-race, genomic ancestry, Chronic kidney disease, Ethnicity
Plain language summary
Our study was conducted with people that have type 1 diabetes, that is a type of diabetes that is diagnosed generally in children and adolescents and that is always treated with insulin. Patients that have diabetes have a risk of developing a chronic complication that affects the kidney function. We already know some of the risk factors that cause a higher risk of developing this complication, such as high blood pressure and high glucose levels. Some studies show that patients that are Black or Asians have a higher chance of developing this complication, but there are few studies that investigate this relationship with genetic testing to calculate the percentage of our ancestry. Our study tested the relationship between African ancestry (the amount of our ancestry that is from African heritage) and the kidney complication. We did not find a clear association between having a higher African ancestry and a lower kidney function. More studies are necessary to study this association in a highly admixed population such as the one in Brazil, where the study was done.
Introduction
Diabetic nephropathy is one of the most common microvascular complications that occur in patients with type 1 diabetes (T1D). Currently, 40% of the patients with chronic kidney disease (CKD) have diabetes in the USA.1 CKD is associated with an elevated morbi-mortality, high cardiovascular risk, and an excessive burden to the health care system.2 Patients with CKD have more than double the mortality rate when compared with patients without CKD, even when corrected for gender, age and different ethnicities.1 This excessive mortality is especially related to cardiovascular disease.
Despite the fact that diabetes is the main cause of CKD worldwide,3 the physiopathology of diabetic nephropathy is still not fully understood. It seems to result from the interaction between several genetic and environmental factors. Known risk factors for the development and progression of diabetic nephropathy include high HbA1c, the presence of other microvascular complications,4 the duration of diabetes, and the presence of hypertension.5
Diabetic patients that are African-Americans, Hispanics, and Asians, have a higher chance of developing diabetic nephropathy when compared with Caucasians.6–8 This fact cannot be completely explained by social economic differences, differences in the prevalence of diabetes, or in their glycemic control. Genetic factors can account for a higher prevalence of diabetic nephropathy in these groups, as studies indicate the presence of diabetic nephropathy susceptibly genes in these patients.9 Most of these studies use self-reported color-race to study different ethnicities and the association to CKD. However, it is important to note that the majority of these studies were performed in homogenous populations, and not in a highly admixed population, such as the Brazilian population.
The Brazilian population is formed by three main ancestral contributions: Europeans (EUR), Africans (AFR) and Native Amerindians (NAM). Originally, Brazil was occupied by Native Amerindians and was colonized by Europeans, especially the Portuguese. The Portuguese-Amerindian admixture started soon after their arrival. After that, in the 16th century, Africans were brought in great numbers as slaves. The Brazilian population is heterogeneous as a result of five centuries of interethnic miscegenation among these three groups.10 The Brazilian census uses self-reported color-race and separates them into five categories: White, Black, Brown (parda), Asian (amarelo) and Indigenous (indígena).11
However, studies show that there is a poor correlation between self-reported color-race and genomic ancestry in the Brazilian population and in patients with T1D in Brazil.12,13 The study of genomic ancestry (GA), with methods such as autosomal Ancestry Informative Markers (AIMs), can be used to better stratify these patients from a highly admixed population, providing a lower risk of misclassification. A more precise stratification has a better chance of identifying groups that have a higher risk for developing CKD.
So far, there are few studies about CKD and ethnicity in patients with T1D in highly admixed populations such as the one encountered in Brazil. Our study aimed to evaluate the association between GA, self-reported color-race, and CKD in patients with T1D in Brazil.
Materials and methods
This is a cross-sectional, observational, multicenter study performed by the Brazilian type 1 Diabetes Study Group (BrazDiab1SG). Initially, 1760 patients with T1D were included. Data were collected between August 2011 and August 2014. The patients were from all geographical areas of Brazil, from 14 public clinics of the secondary and tertiary care levels located in ten cities. The methods have been described previously.14
Briefly, all patients received health care from the National Brazilian Health Care System. All patients were followed by an Endocrinologist in secondary and tertiary centers. Patients that were included had at least 13 years of age, medical follow-up of six months or more at the respective center, at least five years of diagnosis of T1D, and diagnosis of T1D by a physician based on the presence of classic clinical presentation at the moment of the diagnosis. Patients that were pregnant or lactating at the moment of inclusion, had an acute infection or ketoacidosis in the three months before the recruitment, or had a history of renal transplant were excluded from the study. Patients between 13 and 19 years of age were classified as adolescents, and patients older than 19 years were considered adults, based on the American Diabetes Association criteria.15
The following variables were obtained using a questionnaire during a clinical visit: gender, current age (years), duration of diabetes (years), associated diseases, self-reported color-race, and other variables of interest. The following clinical variables were evaluated: weight (kg), height (cm), body mass index BMI (kg/m2), systemic blood pressure, and abdominal circumference.
Socioeconomic status was defined according to the Brazilian economic classification criteria and was divided in high, middle, low, and very low socioeconomic status. This classification takes in consideration the household income, possession of certain home appliances, and the level of educational status.16
The study was approved by the ethics committee of Pedro Ernesto University Hospital (State University of Rio de Janeiro), and by the local ethics committee of each center. All participants or their parents signed the informed consent form.
HbA1c was measured in a single center, using high-performance liquid chromatography (HPLC, Bio-Rad Laboratories, Hercules, California, USA). Serum creatinine, urea, urinary albumin concentration, serum uric acid were also measured in a single center.
Evaluation of renal function
Creatinine was measured using a colorimetric assay kit (Biosystems). Renal function was estimated by the CKD-EPI equation17 in adults and by the Schwartz formula in adolescents18 and was expressed as glomerular filtration rate (GFR) in milliliters per minute per 1.73 m2 (mL/min). We considered all patients as non-African-American in the CKD-EPI equation, since our patients had a low percentage of AFR ancestry, even the ones that self-reported as Blacks. Albuminuria concentration was measured from a morning urine sample. Patients were instructed to avoid physical exercise before collecting the urine sample, and samples with urinary infection or hematuria were excluded. This procedure was repeated twice with a minimal interval of one week and maximal of six months between each sample. The dosage of urinary albumin was evaluated by immunoturbidimetry. The presence of albuminuria was defined as albuminuria ≥30 mg/dl. The dosage of albuminuria was only considered if patients collected at least two urine samples and the mean of the samples was calculated to classify the patients as having albuminuria or not.
Patients were divided into two groups: Normal renal function and CKD. Patients with normal renal function had a GFR ≥60 mL/min and the absence of albuminuria. CKD was defined as a GFR <60 ml/min and/or the presence of albuminuria.19
DNA extraction and AIM-Indel genotyping
We used the commercial kit SP QIA symphony by automation with QIA symphony equipment, following manufacturer’s instructions (Qiagen, USA) to extract Genomic DNA from peripheral blood. The global and individual GA were inferred using a panel of 46 AIM-INDEL, with a protocol described by Pereira et al.20 Genotyping was done by multiplex PCR followed by capillary electrophoresis with the ABI 3500 sequencer. The software Gene Mapper V.4.1 (Life Technologies, USA) was used for Allele naming. We used the Structure V.2.3.3 software to estimate ancestry and the HGDP-CEHP diversity panel (Sub-Set H952) as reference date of ancestral populations. Genotyping was carried out independently by two analysts using GeneMapper Analysis Software v.4.1 (Applied Biosystems) and results were compared for consistency. GA was expressed as percentages, with the sum of EUR, AFR and NAM equaling 100%.
Statistical analysis
Continuous variables are presented as the medians [Interquartile range (IQR)] and frequencies and percentages were used to present categorical variables. Differences between categorical variables were assessed using chi-squared and between independent continuous variables were assessed using Mann-Whitney U test.
We performed a binomial logistic regression using Generalized Linear Models (GLM) to explore the association between self-reported color-race and renal function as the dependent variable. Renal function was divided into normal renal function and CKD. We repeated a binary logistic regression using GLM to explore the association between genomic ancestry and renal function. We included only the AFR ancestry as a continuous variable to study GA. A third analysis was performed dividing the patients into two groups: the first with an AFR ancestry of 50% or higher and the second with less than 50% of AFR ancestry. A binomial logistic regression using GLM was also performed.
Adjustments were made for potential confounders, such as: HbA1c, hypertension, dyslipidemia, gender, duration of diabetes, BMI, years of education, and economic status. These variables were included in all multivariate analyses and were selected since they were significant in the exploratory analysis. Estimates of individual and global ancestry were performed with the Structure software v2.3.3.21 Structure ran with 100,000 burning steps followed by 100,000 Markov Chain Monte Carlo (MCMC) interactions using the “Admixture MODEL” default correlating allele frequencies and the number of populations (K =3), designated as EUR, AFR and NAM. All statistical analyses were performed with Statistical Package for Social Sciences (SPSS) 24.0. Confidence intervals (95%) were expressed when indicated. A two-sided p-value less than 0.05 was considered significant.
Results
Participants’ demographic and clinical characteristics according to levels of renal function
Among 1760 patients, we excluded 184 that had less than 5 years of diabetes, had a history of receiving a renal transplant or lacked data on GA or renal function. The study, therefore, included 1564 (89%) patients. Clinical and demographic data of the studied population stratified into levels of renal function are summarized in Table 1.
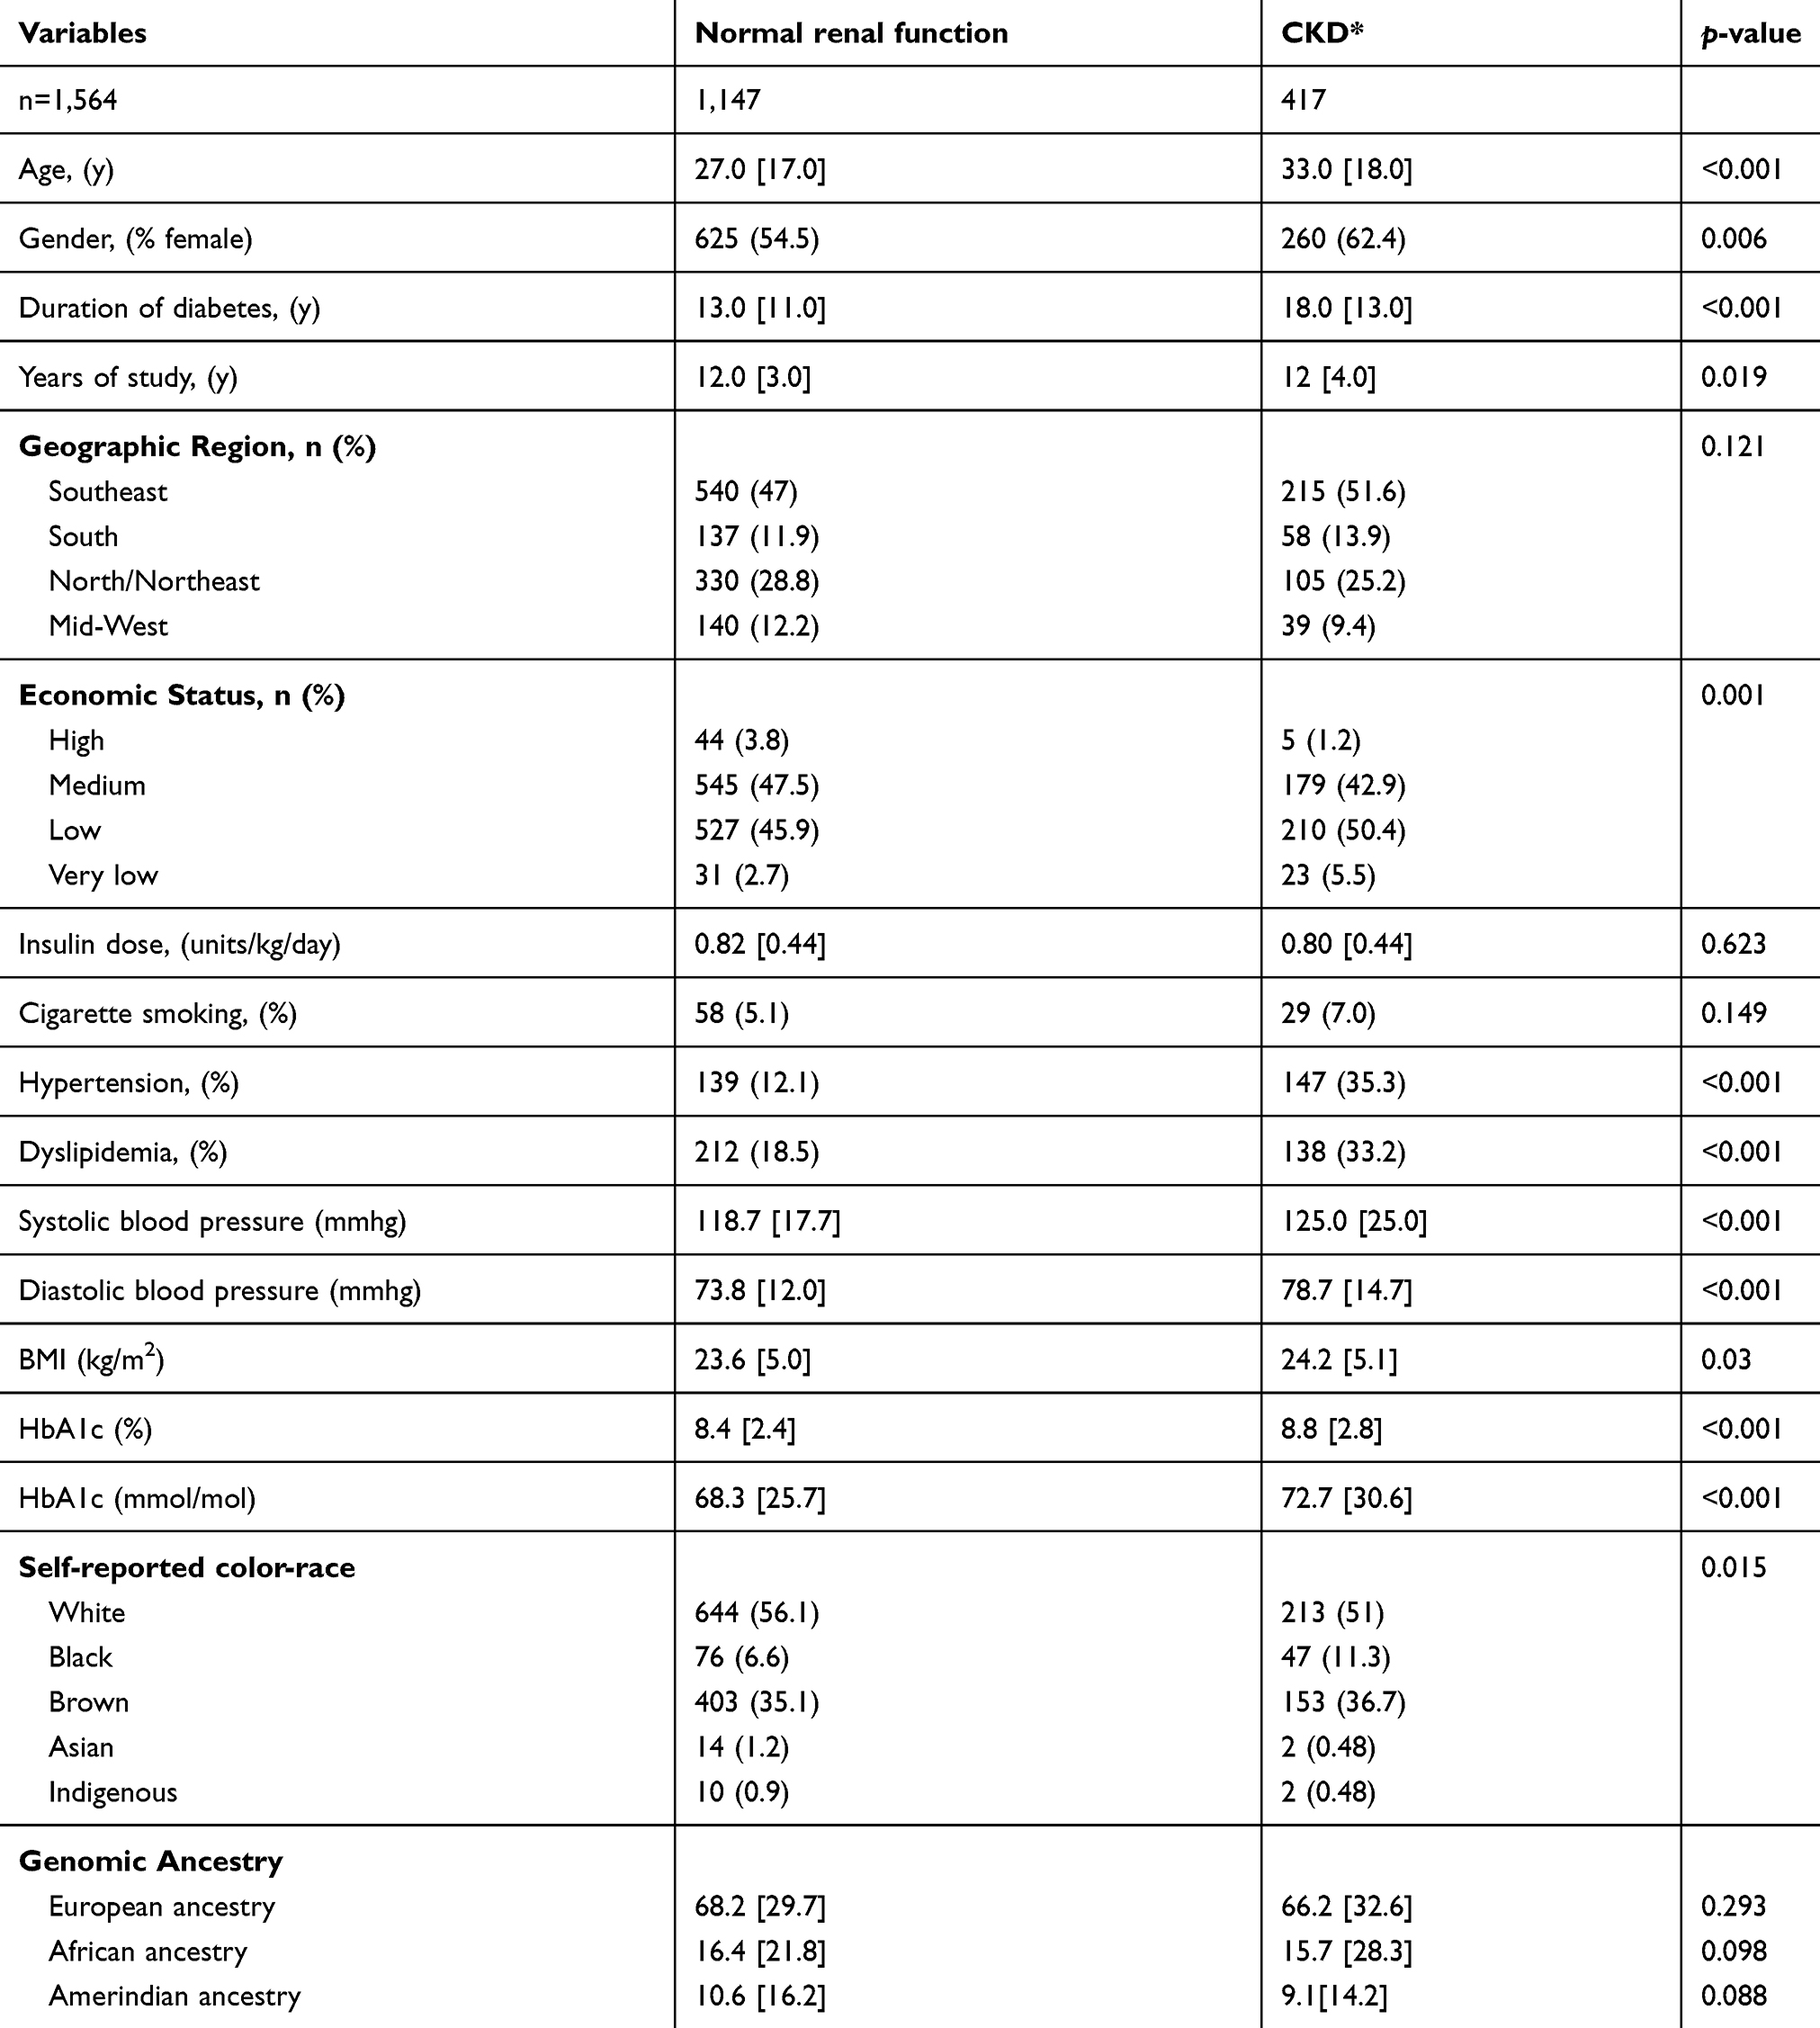 |
Table 1 Characteristics of patients with type 1 diabetes according to groups of renal function |
The median EUR ancestry in our sample was 68.0 [30.9], AFR was 16.3 [23.1] and NAM was 10.2 [15.9]. Figure 1 shows the global admixture distribution per individual considering the proportion of EUR, AFR and NAM ancestries and dividing the patients into normal renal function group and CKD group.
 |
Figure 1 Individual ancestry estimates obtained for the HGDP-CEPH reference samples (POPFLAG =1) and T1D participants tested from the Brazilian population (POPFLAG =0) using 46 AIMs-INDELS. Ancestry estimates were obtained using STRUCTURE, with the following options: MAXPOPS =3; BURNIN =50.000; NUMREPS =50.000; NOADMIX =0; USEPOPINFO =1; PFROMPFOPLAGONLY =1. Abbreviations: AFR, African; EUR, European, NAM, Native Amerindian. |
CKD was encountered in 417 (26.7%) of the patients in our study. Patients with CKD had a higher prevalence of hypertension and dyslipidemia and had a longer duration of diabetes (p<0.001).
More patients self-declared themselves as Black (11.3% vs 6.6%) and Brown (36.7% vs 35.1%) in the CKD group than in the normal renal function group (p<0.001). The percentage of EUR, AFR and NAM ancestries did not differ between the two groups.
Multivariate analysis concerning self-reported color- race
When we analyzed self-reported color-race and the groups of renal function using a binary logistic regression, self-reported color-race was not associated with CKD (p=0.486). A multivariate logistic regression was used to correct this possible association for social factors and comorbidities. This second analysis revealed that self-reported color-race was still not associated with CKD, even when corrected by the confounding factors as shown in Table 2. The variables that had a significant association with the presence of CKD were: the duration of diabetes, female gender, HbA1c, a lower economic status, and the presence of hypertension. The final adjusted data are described in Table 2.
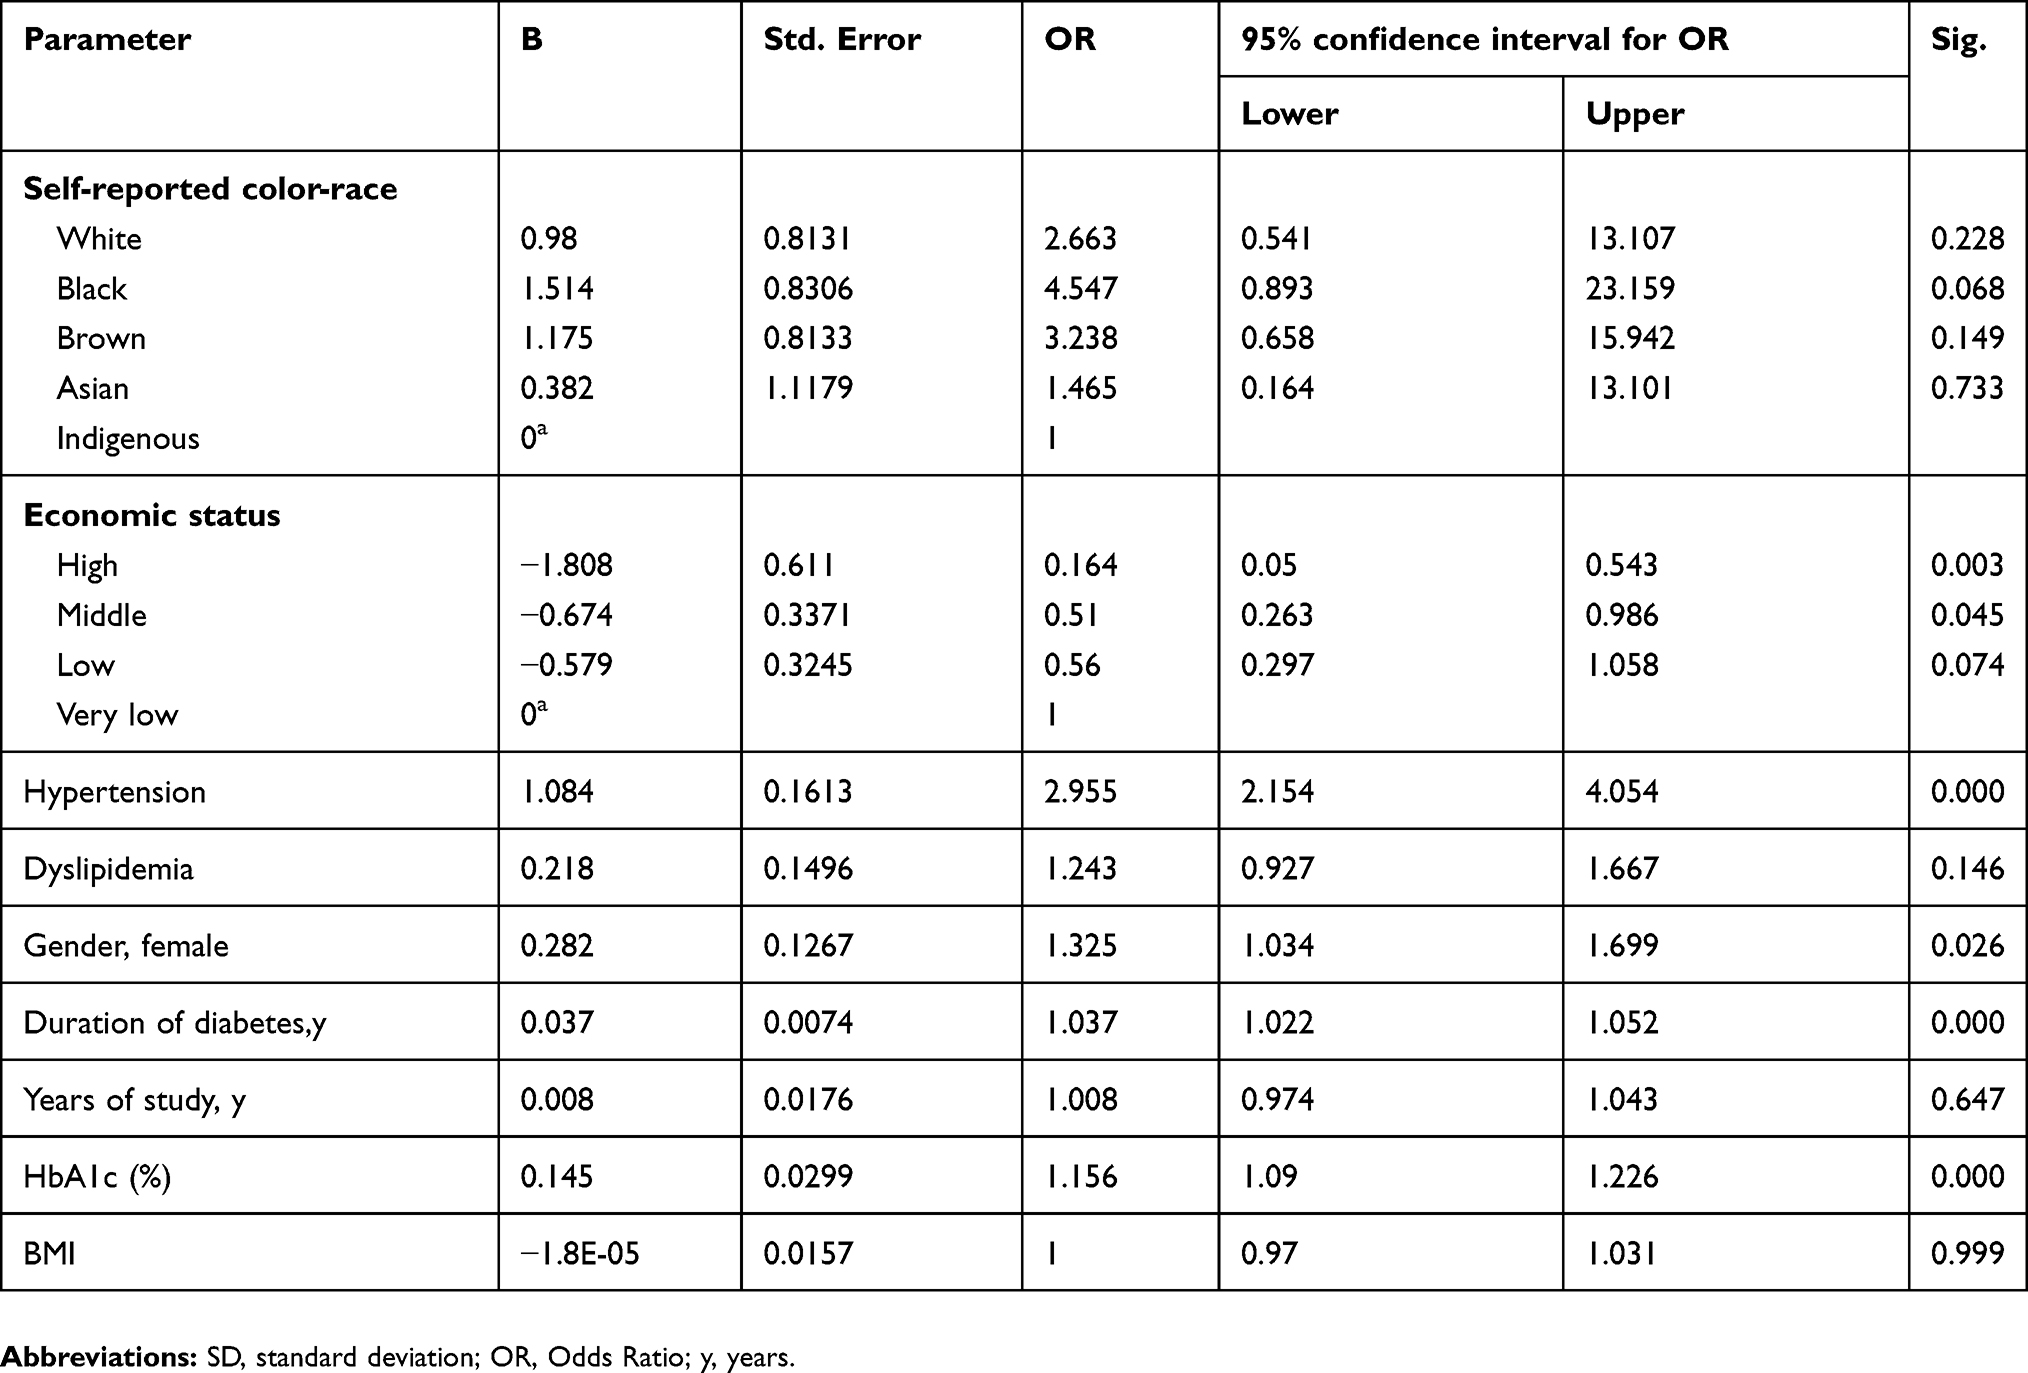 |
Table 2 Final adjusted regression model according to self-reported color-race |
Multivariate analysis concerning genomic ancestry
The binary logistic regression used to evaluate the relationship between African GA and renal function showed a significant association between a higher African ancestry and CKD, with an OR of 2.387 (1.247–4.572), p=0.009. However, a multivariate logistic regression between African GA and CKD, after the adjustment for confounding factors, such as HbA1c, hypertension, and social economic aspects, did not confirm this association (p=0.064). The final adjusted data are described in Table 3.
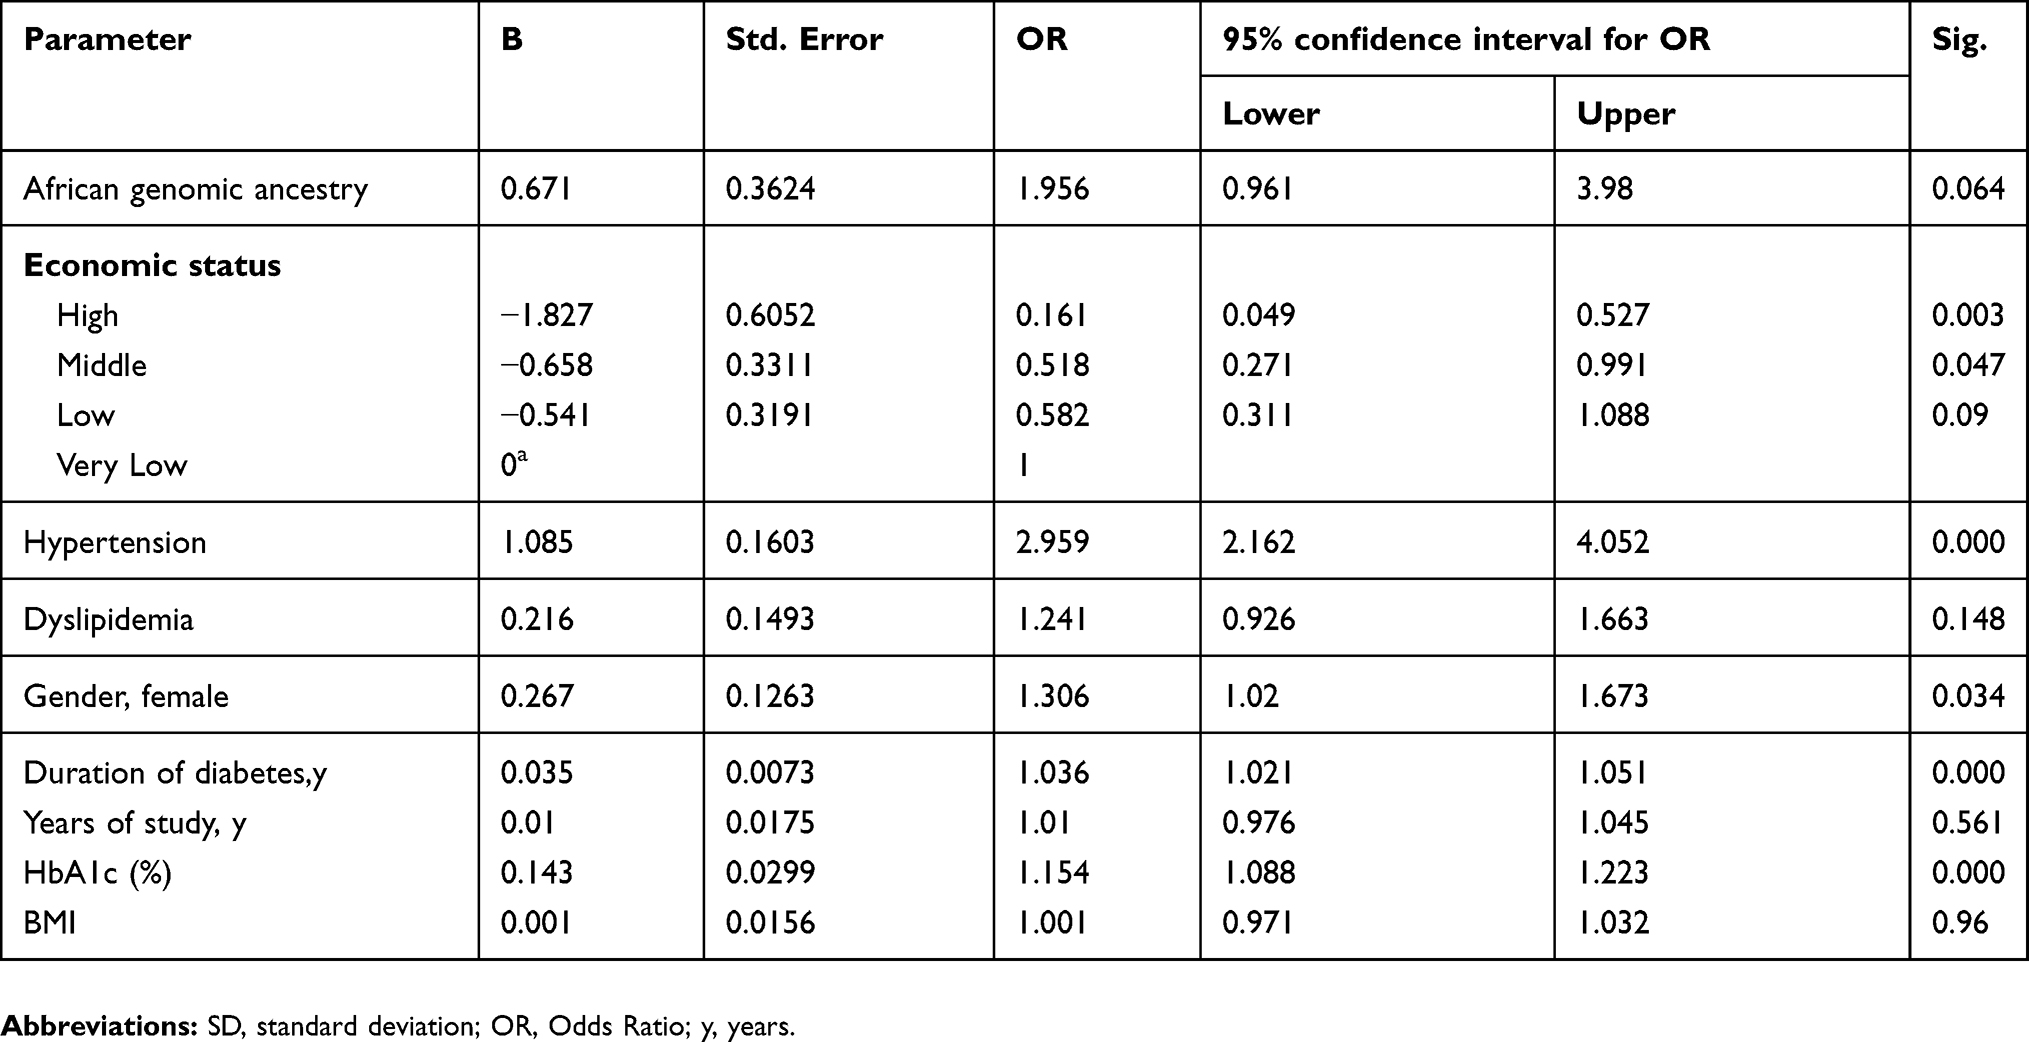 |
Table 3 Final adjusted regression model concerning genomic ancestry |
Multivariate analysis concerning two groups of AFR ancestry
Only 96 patients in our study had a percentage of AFR ancestry higher or equal to 50%. We compared them with the 1468 patients that had a percentage of AFR ancestry <50%. When we analyzed the group with AFR ancestry ≥50% in a binary logistic regression, there was an association between higher percentages of AFR ancestry and the presence of CKD (OR: 1.7, p=0.014). However, a multivariate logistic regression between African genomic ancestry groups and CKD, after the adjustment for confounding factors, was not significant (p=0.213). The final adjusted data are described in Table 4.
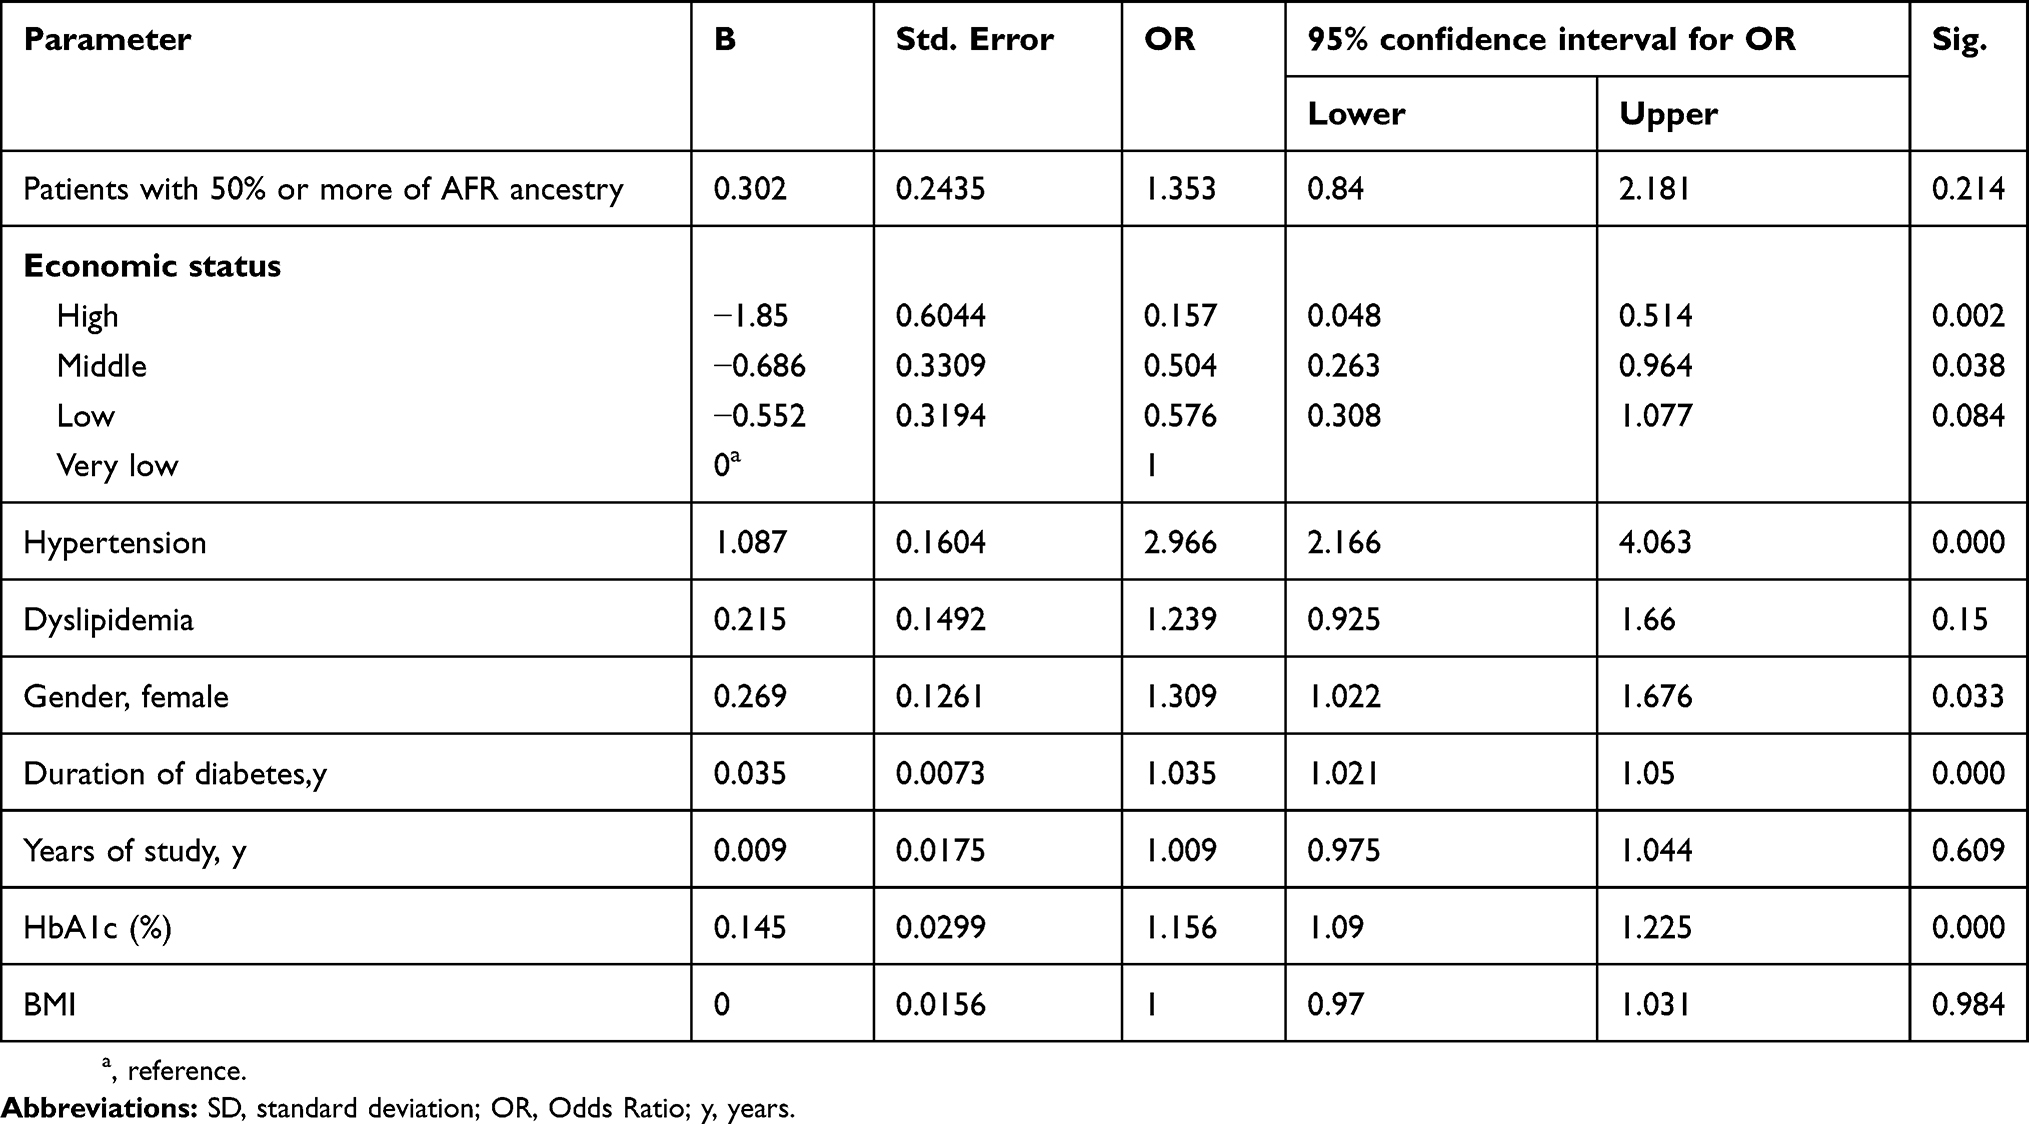 |
Table 4 Final adjusted regression model according to groups of AFR ancestry |
Discussion
Our study indicates that in our patients with T1D, from an admixed, multi-ethnic population, self-reported color-race and a higher AFR GA were not associated with CKD after adjustments. There was also an association between patients with AFR ancestry ≥50% and CKD, which did not persist after the correction for the confounding factors, possibly due to the small number of patients with an AFR ancestry ≥50% .
It is important to note that despite the fact that we did not find a significant p-value in the multivariate analysis concerning AFR GA and CKD, we found a narrow confidence interval (0.961–3.98) with an OR of 1.956. This suggests that further studies should be conducted to confirm the lack of association between AFR ancestry and CKD, especially in admixed populations, such as the one encountered in Brazil.
It is important to identify groups that have a higher risk of developing chronic complications, especially diabetic nephropathy, so we can intensify the treatment of diabetes and of other risk factors associated with the development and progression of diabetic nephropathy and try to avoid their disproportionate progression to CKD. There are some risk factors that are modifiable, such as the glycemic control, hypertension, and dyslipidemia, and others that we cannot alter, such as GA and family history. Rosolowsky et al showed that despite the efforts to control these modifiable risk factors with the use of renoprotective treatments, a stricter glycemic control, and the treatment of hypertension, the risk of end-stage renal disease did not change over the years in a population of patients with T1D.22
The disparities in the incidence of CKD in patients with diabetes according to different ethnicities have been described for a long time. One of the first studies to identify this difference was published in 1989 and revealed that Black patients with diabetes had a 2.6 fold increase in risk of CKD when compared to Caucasian patients.6 Other studies were performed to verify if the improvements in the treatment of diabetes changed those disparities between ethnicities. One study showed that patients with diabetes that were Black, Latino, or Asian had a higher risk of CKD when compared with diabetic patients that were White. This association persisted even after the correction for social factors such as annual income and educational levels.7 Another study showed that Asian and Hispanic patients with type 2 diabetes (T2D) had a higher prevalence of micro and macroalbuminuria, when compared to Caucasian patients.23 There are few studies that evaluate the association between diabetic nephropathy and self-reported color-race, in a highly admixed population, especially studies involving patients with T1D. We did not find a significant association between any category of self-reported color-race and CKD.
In Brazil, color is a poor predictor of GA, especially of AFR ancestry.12 The self-reported color-race is based primordially in phenotype, taking into account skin color, hair type, shape of the nose and mouth. In a study involving siblings, 35% of the siblings reported themselves in a different color category, despite having no significant difference in their skin pigmentation. This indicates that stratifying our population using self-reported color-race is not ideal.24 To avoid this bias and avoid misclassifications, we performed the analyses of the GA, using AIMs.
In our study we found an association between AFR ancestry and CKD that did not persist after the correction by the confounding factors. This can possibly be explained by our low percentage of African ancestry in our highly admixed population. Patients that present a percentage of any ancestry higher than 95% are considered non-admixed patients.25 These patients were not encountered in our sample. Our group showed in a previous study that patients with T1D had a higher median EUR ancestry, and lower median AFR and NAM ancestries, when compared to controls in Brazil.26 Another study, conducted in American patients from Manhattan revealed a mean African ancestry of 82% in African American patients27 which is much higher than our median African ancestry in patients that self-reported as Blacks (41.8 [31.5]). However, the study mentioned above was not conducted with patients with T1D and had an average of only 16–30% of participants with diabetes.
Further studies in this area reveal that non-diabetic African-Americans have an elevated risk of developing CKD that is in great part associated with genetic variants in the apolipoprotein L1 gene (APOL1). Africans have a higher prevalence of this APOL1 risk variants, because it conferred protection against lethal Trypanosoma brucei infections. APOL1 variants are associated with an elevated risk of hypertension-attributable CKD, HIV-nephropathy, and lupus kidney disease.28 However, the association between APOL1 and diabetic nephropathy is still controversial.29 Studies in patients with T2D reveal that the risk for developing CKD is in fact, attributable to the combination of several genes,29 and not just the APOL1 variant.
A particular strength of our study is the population-based ascertainment of diabetes cases in a large sample of Brazilian patients with T1D, from a wide range of ethnic groups, from all geographic regions of the country. To our knowledge, this is the first study to evaluate the association between ethnicity, studied as self-reported color-race and GA, and CKD in patients with T1D from a highly admixed population. This historical association between different ethnicities and CKD in patients with diabetes has not yet been studied using GA. Our study raises the question if patients from ethnic groups such as African-Americans and Asians should be screened earlier for this complication or have a stricter therapy as to prevent the development of CKD, since they were known as a group with a higher chance of developing this complication.
Our study has some limitations. First, we only included patients that were followed in secondary and tertiary centers, so patients treated in primary clinics were excluded. This probably had little impact in our study since the majority of patients with T1D are followed in secondary and tertiary centers in Brazil. Second, we used the measurement of albumin concentration from a morning sample of urine instead of measurement in urine collected in 24 hrs. However, studies show that the urinary albumin concentration in a random spot urine is a reliable predictor of diabetic nephropathy and cardiovascular events.30
Conclusion
Our results did not confirm an association between self-reported color-race or AFR ancestry and CKD. However, as we studied patients from a highly admixed population, with a low proportion of AFR ancestry, further studies should be conducted to better establish if the historical association between ethnicity and CKD is confirmed, especially in patients with a higher percentage of AFR or NAM ancestries.
Abbreviations
CKD, Chronic Kidney Disease; T1D, Type 1 diabetes; EUR, European; AFR, African; NAM, Native Amerindian; AIMs, Ancestry Informative Markers; GA, genomic ancestry; BMI, body mass index; GLM, Generalized Linear Models; T2D, Type 2 diabetes; APOL1, Apolipoprotein L1 gene.
Ethics and consent
The study was approved by the ethics committee of Pedro Ernesto University Hospital (State University of Rio de Janeiro), and by the local ethics committee of each center. All participants or their parents signed the informed consent form. This study has been performed in accordance with the ethical standards as laid down in the 1964 Declaration of Helsinki and its later amendments.
Acknowledgments
The authors would like to acknowledge the following:
Brazilian Type 1 Diabetes Study Group BrazDiab1SG Executive steering committee: Marilia Brito Gomes (chair), Carlos Antonio Negrato.
Principal investigators are indicated by an asterisk.
Department of Internal Medicine, Diabetes Unit, State University of Rio de Janeiro, Brazil: Marilia Brito Gomes*.
Department of Internal Medicine, Diabetes Unit, State University of Rio de Janeiro, Brazil: Roberta Cobas; Lucianne Righeti Monteiro Tannus.
Federal University Hospital of Rio de Janeiro: Melanie Rodacki*, M.D.; Lenita Zajdenverg, M.D.; Joana Rodrigues Dantas, M.D.
Diabetes Unit, University Hospital of São Paulo, São Paulo: Maria Lúcia Cardillo Corrêa-Giannella*, M.D.; Sharon Nina Admoni, M.D.; Daniele Pereira dos Santos, M.D.
Bauru’s Diabetics Association, Bauru, São Paulo: Carlos Antonio Negrato*, M.D.; Maria de Fatima Guedes, M.D.
Diabetes Unit, Federal University of São Paulo State, São Paulo: Sergio Atala Dib*, M.D.; Celso Ferreira de Camargo Sallum Filho, M.D.
Diabetes Unit, University of Campinas, São Paulo: Elisabeth João Pavin*, M.D.; Caroline Takano, M.D.
Clinical Hospital of the Federal University of Paraná: Rosângela Roginski Rea*, M.D.; Nicole Balster Romanzini, M.D.
Clinical Hospital of Porto Alegre, Rio Grande do Sul: Mirela Azevedo*, M.D.; Luis Henrique Canani, M.D.
Regional Hospital of Taguatinga, Brasília: Hermelinda Cordeiro Pedrosa*, M.D.; Monica Tolentino; Cejana Hamu Aguiar, M.D.
Diabetes and Endocrinology Center of Bahia: Reine Marie Chaves Fonseca*, M.D.; Ludmila Chaves Fonseca M.D., Raffaele Kasprowicz, M.D.
Diabetes and Hypertension Center of Ceará: Adriana Costa e Forti*M.D.; Angela Delmira Nunes Mendes, M.D.
Federal University of Ceará: Renan Montenegro Junior*, M.D.; Virgínia Oliveira Fernandes, M.D.
Federal University Hospital of Pará: João Soares Felício*, M.D.; Flavia Marques Santos, M.D.
This article was funded by FAPERJ (Fundação Carlos Chagas Filho de Amparo à Pesquisa do Estado do Rio de Janeiro), grant number: E-26/110.170/2013 and by CNPq (Conselho Nacional de Desenvolvimento Científico e Tecnológico), grant number: 563753/2010-2.
Disclosure
The authors declare that they have no conflicts of interest in this work.
References
1. United States Renal Data System 2017. Annual data report. Available from: https://www.usrds.org/adr.aspx.
2. McBrien KA, Manns BJ, Chui B, et al. Health care costs in people with diabetes and their association with glycemic control and kidney function. Diabetes Care. 2013;36(5):1172–1180. doi:10.2337/dc12-0862
3. Webster AC, Nagler EV, Morton RL, Masson P. Chronic kidney disease. Lancet. 2016;389(10075):1238–1252.
4. Klein R, Zinman B, Gardiner R, et al. The relationship of diabetic retinopathy to preclinical diabetic glomerulopathy lesions in type 1 diabetic patients: the renin-angiotensin system study. Diabetes. 2005;54(2):527–533. doi:10.2337/diabetes.54.2.527
5. Radcliffe NJ, Seah JM, Clarke M, MacIsaac RJ, Jerums G, Ekinci EI. Clinical predictive factors in diabetic kidney disease progression. J Diabetes Investig. 2016;8(1):6–18. ISSN 2040-1124.
6. Cowie CC, Port FK, Wolfe RA, Savage PJ, Moll PP, Hawthorne VM. Disparities in incidence of diabetic end-stage renal disease according to race and type of diabetes. N Engl J Med. 1989;321(16):1074–1079. doi:10.1056/NEJM198910193211603
7. Karter AJ, Ferrara A, Liu JY, Moffet HH, Ackerson LM, Selby JV. Ethnic disparities in diabetic complications in an insured population. JAMA. 2002;287(19):2519–2527. doi:10.1001/jama.287.19.2519
8. Bhalla V, Zhao B, Azar KM, et al. Racial/ethnic differences in the prevalence of proteinuric and nonproteinuric diabetic kidney disease. Diabetes Care. 2013;36(5):1215–1221. doi:10.2337/dc12-0951
9. Iyengar SK, Sedor JR, Freedman BI, et al. Genome-wide association and trans-ethnic meta-analysis for advanced diabetic kidney disease: Family Investigation of Nephropathy and Diabetes (FIND). PLoS Genet. 2015;11(8):e1005352. ISSN 1553-7404. doi:10.1371/journal.pgen.1005352
10. Alves-Silva J, Da Silva Santos M, Guimarães PE, et al. The ancestry of Brazilian mtDNA lineages. Am J Hum Genet. 2000;67(2):444–461. doi:10.1086/303004
11. IBGE. Características Étnico-raciais Da População: Um Estudo Das Categorias De Classificação De Cor Ou Raça. Rio de Janeiro; 2008. Available from: https://biblioteca.ibge.gov.br/index.php/biblioteca-catalogo?view=detalhes&id=249891.
12. Parra FC, Amado RC, Lambertucci JR, Rocha J, Antunes CM, Pena SD. Color and genomic ancestry in Brazilians. Proc Natl Acad Sci U S A. 2003;100(1):177–182. doi:10.1073/pnas.0126614100
13. Gomes KF, Santos AS, Semzezem C, et al. The influence of population stratification on genetic markers associated with type 1 diabetes. Sci Rep. 2017;7:43513. doi:10.1038/srep43513
14. Gomes MB, Negrato CA. Adherence to insulin therapeutic regimens in patients with type 1 diabetes. A nationwide survey in Brazil. Diabetes Res Clin Pract. 2016;120:47–55. doi:10.1016/j.diabres.2016.07.011
15. American Diabetes Association. Standards of medical care. Diabetes Care 2015. 2015;38(Suppl. 1):S41–8. doi:10.2337/dc15-S010
16. Criterio Brasil - ABEP. 2015. Available from: http://www.abep.org/criterio-brasil.
17. Levey AS, Stevens LA, Schmid CH, et al. A new equation to estimate glomerular filtration rate. Ann Intern Med. 2009;150(9):604–612. doi:10.7326/0003-4819-150-9-200905050-00006
18. Schwartz GJ, Work DF. Measurement and estimation of GFR in children and adolescents. Clin J Am Soc Nephrol. 2009;4(11):1832–1843. doi:10.2215/CJN.01640309
19. Kidney Disease: improving Global Outcomes (KDIGO) CKD Work Group. KDIGO 2012 Clinical practice guideline for the evaluation and management of chronic kidney disease. Kidney Int Suppl. 2013:1–150. Available from: http://kdigo.org/guidelines/ckd-evaluation-and-management/.
20. Pereira R, Phillips C, Pinto N, et al. Straightforward inference of ancestry and admixture proportions through ancestry-informative insertion deletion multiplexing. PLoS One. 2012;7(1):e29684. doi:10.1371/journal.pone.0029684
21. Pritchard JK, Stephens M, Donnelly P. Inference of population structure using multilocus genotype data. Genetics. 2000;155(2):945–959.
22. Rosolowsky ET, Skupien J, Smiles AM, et al. Risk for ESRD in type 1 diabetes remains high despite renoprotection. J Am Soc Nephrol. 2011;22(3):545–553. doi:10.1681/ASN.2010040354
23. Parving HH, Lewis JB, Ravid M, Remuzzi G, Hunsicker LG, Investigators D. Prevalence and risk factors for microalbuminuria in a referred cohort of type II diabetic patients: a global perspective. Kidney Int. 2006;69(11):2057–2063. doi:10.1038/sj.ki.5000377
24. Leite TK, Fonseca RM, de França NM, Parra EJ, Pereira RW. Genomic ancestry, self-reported “color” and quantitative measures of skin pigmentation in Brazilian admixed siblings. PLoS One. 2011;6(11):e27162. doi:10.1371/journal.pone.0027162
25. Homburger JR, Moreno-Estrada A, Gignoux CR, et al. Genomic insights into the ancestry and demographic history of South America. PLoS Genet. 2015;11(12):e1005602. doi:10.1371/journal.pgen.1005602
26. Gomes MB, Gabrielli AB, Santos DC, et al. Self-reported color-race and genomic ancestry in an admixed population: a contribution of a nationwide survey in patients with type 1 diabetes in Brazil. Diabetes Res Clin Pract. 2018;140:245–252. doi:10.1016/j.diabres.2018.03.021
27. Udler MS, Nadkarni GN, Belbin G, et al. Effect of genetic african ancestry on eGFR and kidney disease. J Am Soc Nephrol. 2015;26(7):1682–1692. doi:10.1681/ASN.2014050474
28. Friedman DJ, Pollak MR. Apolipoprotein L1 and kidney disease in African Americans. Trends Endocrinol Metab. 2016;27(4):204–215. doi:10.1016/j.tem.2016.02.002
29. Palmer ND, Freedman BI. Insights into the genetic architecture of diabetic nephropathy. Curr Diab Rep. 2012;12(4):423–431. doi:10.1007/s11892-012-0279-2
30. Viana LV, Gross JL, Camargo JL, Zelmanovitz T, Da Costa Rocha EP, Azevedo MJ. Prediction of cardiovascular events, diabetic nephropathy, and mortality by albumin concentration in a spot urine sample in patients with type 2 diabetes. J Diabetes Complications. 2012;26(5):407–412. doi:10.1016/j.jdiacomp.2012.04.014
 © 2019 The Author(s). This work is published and licensed by Dove Medical Press Limited. The full terms of this license are available at https://www.dovepress.com/terms.php and incorporate the Creative Commons Attribution - Non Commercial (unported, v3.0) License.
By accessing the work you hereby accept the Terms. Non-commercial uses of the work are permitted without any further permission from Dove Medical Press Limited, provided the work is properly attributed. For permission for commercial use of this work, please see paragraphs 4.2 and 5 of our Terms.
© 2019 The Author(s). This work is published and licensed by Dove Medical Press Limited. The full terms of this license are available at https://www.dovepress.com/terms.php and incorporate the Creative Commons Attribution - Non Commercial (unported, v3.0) License.
By accessing the work you hereby accept the Terms. Non-commercial uses of the work are permitted without any further permission from Dove Medical Press Limited, provided the work is properly attributed. For permission for commercial use of this work, please see paragraphs 4.2 and 5 of our Terms.