")
Back to Journals » Diabetes, Metabolic Syndrome and Obesity » Volume 13
Influence of Diabetic Retinopathy on the Relationship Between Body Mass Index and Mortality in Patients with Poorly Controlled Type 2 Diabetes
Authors Li YH, Sheu WHH, Lee IT
Received 15 January 2020
Accepted for publication 11 March 2020
Published 24 March 2020 Volume 2020:13 Pages 907—914
DOI https://doi.org/10.2147/DMSO.S246032
Checked for plagiarism Yes
Review by Single anonymous peer review
Peer reviewer comments 2
Editor who approved publication: Dr Konstantinos Tziomalos
Yu-Hsuan Li,1,2 Wayne Huey-Herng Sheu,1,3,4 I-Te Lee1,3,5,6
1Division of Endocrinology and Metabolism, Department of Internal Medicine, Taichung Veterans General Hospital, Taichung 40705, Taiwan; 2Graduate Institute of Data Science, Taipei Medical University, Taipei 11031, Taiwan; 3School of Medicine, National Yang-Ming University, Taipei 11221, Taiwan; 4Rong Hsing Research Center for Translational Medicine, College of Life Sciences, National Chung Hsing University, Taichung 40227, Taiwan; 5School of Medicine, Chung Shan Medical University, Taichung 40201, Taiwan; 6College of Science, Tunghai University, Taichung 40704, Taiwan
Correspondence: I-Te Lee
Division of Endocrinology and Metabolism, Department of Internal Medicine, Taichung Veterans General Hospital, 1650 Taiwan Boulevard, Sect. 4, Taichung 40705, Taiwan
Tel +886-4-23741300
Fax +886-4-23593662
Email [email protected]
Purpose: An “obesity paradox” has been observed in patients with type 2 diabetes. However, the optimal body mass index (BMI) for survival may be influenced by the stage of diabetes. We examined the relationship between BMI and mortality in patients with type 2 diabetes and the influence of diabetic retinopathy (DR).
Patients and Methods: This is a retrospective cohort composing patients with type 2 diabetes who were admitted due to poor glucose control. Presence of DR was confirmed by ophthalmologists. The primary outcome was all-cause mortality. The association between BMI and mortality was assessed using a Cox proportional hazards model with adjustment for age, sex, and traditional risk factors.
Results: A total of 2053 patients were enrolled. Over median follow-up of 6.7 years, there were 1060 deaths. Patients were classified into five categories based on admission BMI (kg/m2): < 18.5, 18.5‒23, 23‒25, 25‒27 (reference), 25‒30 and > 30. Mortality risk was significantly higher in the < 18.5 kg/m2, 18.5– 23 kg/m2, and 23– 25 kg/m2 categories than in the reference category (P < 0.001). The similar obesity paradox was observed in the subgroup of patients without DR. However, in patients with DR, only patients with BMI < 18.5 kg/m2 had significantly increased mortality than those in the reference category. The presence of DR significantly modified the shape of the association between BMI and mortality (P = 0.019).
Conclusion: The obesity paradox exists in patients with poorly controlled type 2 diabetes. The presence of DR appears to significantly influence the shape of the association between BMI and mortality.
Keywords: cohort, inpatient, obesity, paradox, overweight, retrospective
Introduction
Obesity is a well-established risk factor for cardiovascular disease.1 In patients with type 2 diabetes, obesity not only escalates cardiovascular risk, but also worsen glucose control.2 Therefore, maintaining normal weight has traditionally been an important component of diabetes management. However, recent large-scale epidemiologic studies have shown that overweight is associated with survival benefit as compared with normal weight in patients with type 2 diabetes. This phenomenon is referred to as the “obesity paradox”,3–8 and it raises doubts regarding the optimal weight status for patients with type 2 diabetes.
Although the majority of research supports the existence of the obesity paradox, a growing body of literature suggests that this observation might be biased by reverse causality or unknown confounders.9–11 Differences in the sample populations may be responsible for the inconsistent results.12 Specifically, Lee et al13 reported that the optimal body mass index (BMI) for survival depends on the patient’s glucose regulation status. Xing et al14 reported no obesity paradox in patients with long-standing type 2 diabetes. As type 2 diabetes is a heterogeneous disease comprising a wide spectrum of phenotypes, we hypothesized that the shape of the association between BMI and mortality might differ among various diabetic phenotypes. Although previous studies have been reported in patients with incident diabetes, little is known about the relationship between BMI and mortality in patients with poorly controlled diabetes.3,7
A recent analysis of Swedish National Diabetes Register data suggested that control status of five risk-factor variables, including glycated hemoglobin (HbA1c), low-density lipoprotein (LDL) cholesterol, albuminuria, smoking, and blood pressure, influences long-term mortality in patients with type 2 diabetes.15 Comorbid conditions such as cardiovascular disease,5 heart failure,16,17 and chronic kidney disease18 also influence the relationship between BMI and mortality. However, the effect of diabetic retinopathy (DR) on the relationship between BMI and long-term mortality has not been explored in patients with type 2 diabetes. Therefore, we examined the relationship between BMI and all-cause mortality in patients with poorly controlled type 2 diabetes, and determined whether the presence of DR affects this relationship.
Materials and Methods
Setting and Participants
This retrospective cohort study was conducted at Taichung Veterans General Hospital. Clinical data were obtained by reviewing the medical records of patients with type 2 diabetes who were hospitalized between August 1996 and August 2007. The inclusion criteria were (1) adults with type 2 diabetes who were admitted to the Endocrinology and Metabolism section due to a primary diagnosis of poor glucose control based on the endocrinologists’ evaluations; and (2) fundal examination performed by an ophthalmologist during hospital stay. The exclusion criteria were (1) no available BMI data measured in standing position on admission; (2) end-stage renal disease; (3) pregnancy; or (4) death in hospital or within 24 hrs of discharge. The research protocol was approved by the Institutional Review Board of Taichung Veterans General Hospital. The need for informed consent was waived in the view of the retrospective nature of the study. This study was conducted in accordance with the Declaration of Helsinki, and all data were maintained with confidentiality.
Measurements
Based on the standard procedures for hospitalization, standing height and weight were measured on admission, and the BMI was calculated using the following formula: weight in kilograms divided by height in meters squared (kg/m2). Blood samples were collected for biochemistry assessment after overnight fasting during the hospitalization period. DR included non-proliferative DR (NPDR) and proliferative DR (PDR). DR was screened using fundoscopic examinations by ophthalmologists via formal consultations. In cases with abnormal fundoscopic findings, retinal angiography (CF-60UVi Fundus camera, Canon, Tokyo, Japan) was subsequently performed to confirm the retinopathy diagnosis. The history of coronary artery disease (CAD) was obtained from the electronic medical records. Self-reported current smoking status was obtained from the medical records.
HbA1c level was determined using National Glycohemoglobin Standardization Program (NGSP) certified cation-exchange high-performance liquid chromatography (G8, TOSOH, Tokyo, Japan). LDL cholesterol level was determined using enzymatic methods (Advia 1800, Siemens, NY, USA). Serum creatinine level was determined using the Jaffé method (Advia 1800, Siemens, NY, USA). The estimated glomerular filtration rate (eGFR) was calculated by 186 × serum creatinine (mg/dL)−1.154 × age (year)−0.203 (×0.742 if female) mL/min/1.73 m2 based on the modification of diet in renal disease (MDRD) equation.19
According to World Health Organization (WHO) recommendations,20 underweight, overweight, and obesity are defined as BMI (kg/m2) of <18.5, ≥25, and ≥30, respectively. Furthermore, the BMI cutoff point for obesity or high risk should depend on the assessed population.20 To facilitate the exploration of mortality and BMI, we added BMI of 27 kg/m2, defined as obesity in Taiwan, as the cutoff for high risk.21 In our study, therefore, BMI was categorized into <18.5 kg/m2, 18‒23 kg/m2, 23‒25 kg/m2, 25‒27 kg/m2, 27‒30 kg/m2, and >30 kg/m2 groups for analysis. The primary endpoint was all-cause mortality after discharge. We applied the mortality data up to December 2011 from the Collaboration Center of Health Information Application, Department of Health, Executive Yuan, Taiwan.
Statistical Analysis
Continuous data were summarized as the means ± standard deviations (SD); categorical data as numbers (with percentages). One-way analysis of variance (ANOVA) was used to determine the significance of the differences among groups. Kruskal–Wallis test was used for analysis of diabetic duration and follow-up duration due to the skewed distributions of these measures. Chi-square test was used to compare categorical variables across groups. Cox proportional hazards regression analysis was used to determine the hazard ratios for mortality. Proportionality was checked using Schoenfeld residuals, and models were stratified on variables which were found to violate proportionality. To assess the influence of DR on the relationship between BMI and mortality, we introduced an interaction term (BMI × DR) in the Cox model, using BMI treated as a continuous variable. We also checked the interaction effect using BMI as a category variable. We compared the Cox models with and without the interaction term (BMI category × DR) and used ANOVA to test the significance. Statistical significance was at P < 0.05. Statistical analysis was performed using R 3.4 software.
Results
A total of 2053 patients were included in this analysis. There were 163 patients with BMI <18.5 kg/m2, 730 with BMI 18‒23 kg/m2, 417 with BMI 23‒25 kg/m2, 289 with BMI 25‒27 kg/m2, 276 with BMI 25‒27 kg/m2, and 178 with BMI >30 kg/m2. Duration of diabetes, serum LDL cholesterol, and smoking status were comparable between groups. However, mean age, mean systolic pressure, mean diastolic pressure, and CAD prevalence were significantly lower; and HbA1c was significantly higher in the BMI <18.5 kg/m2 category than in the other BMI categories (P < 0.001 for all). There was a significant inverse trend between mean eGFR and BMI (Table 1).
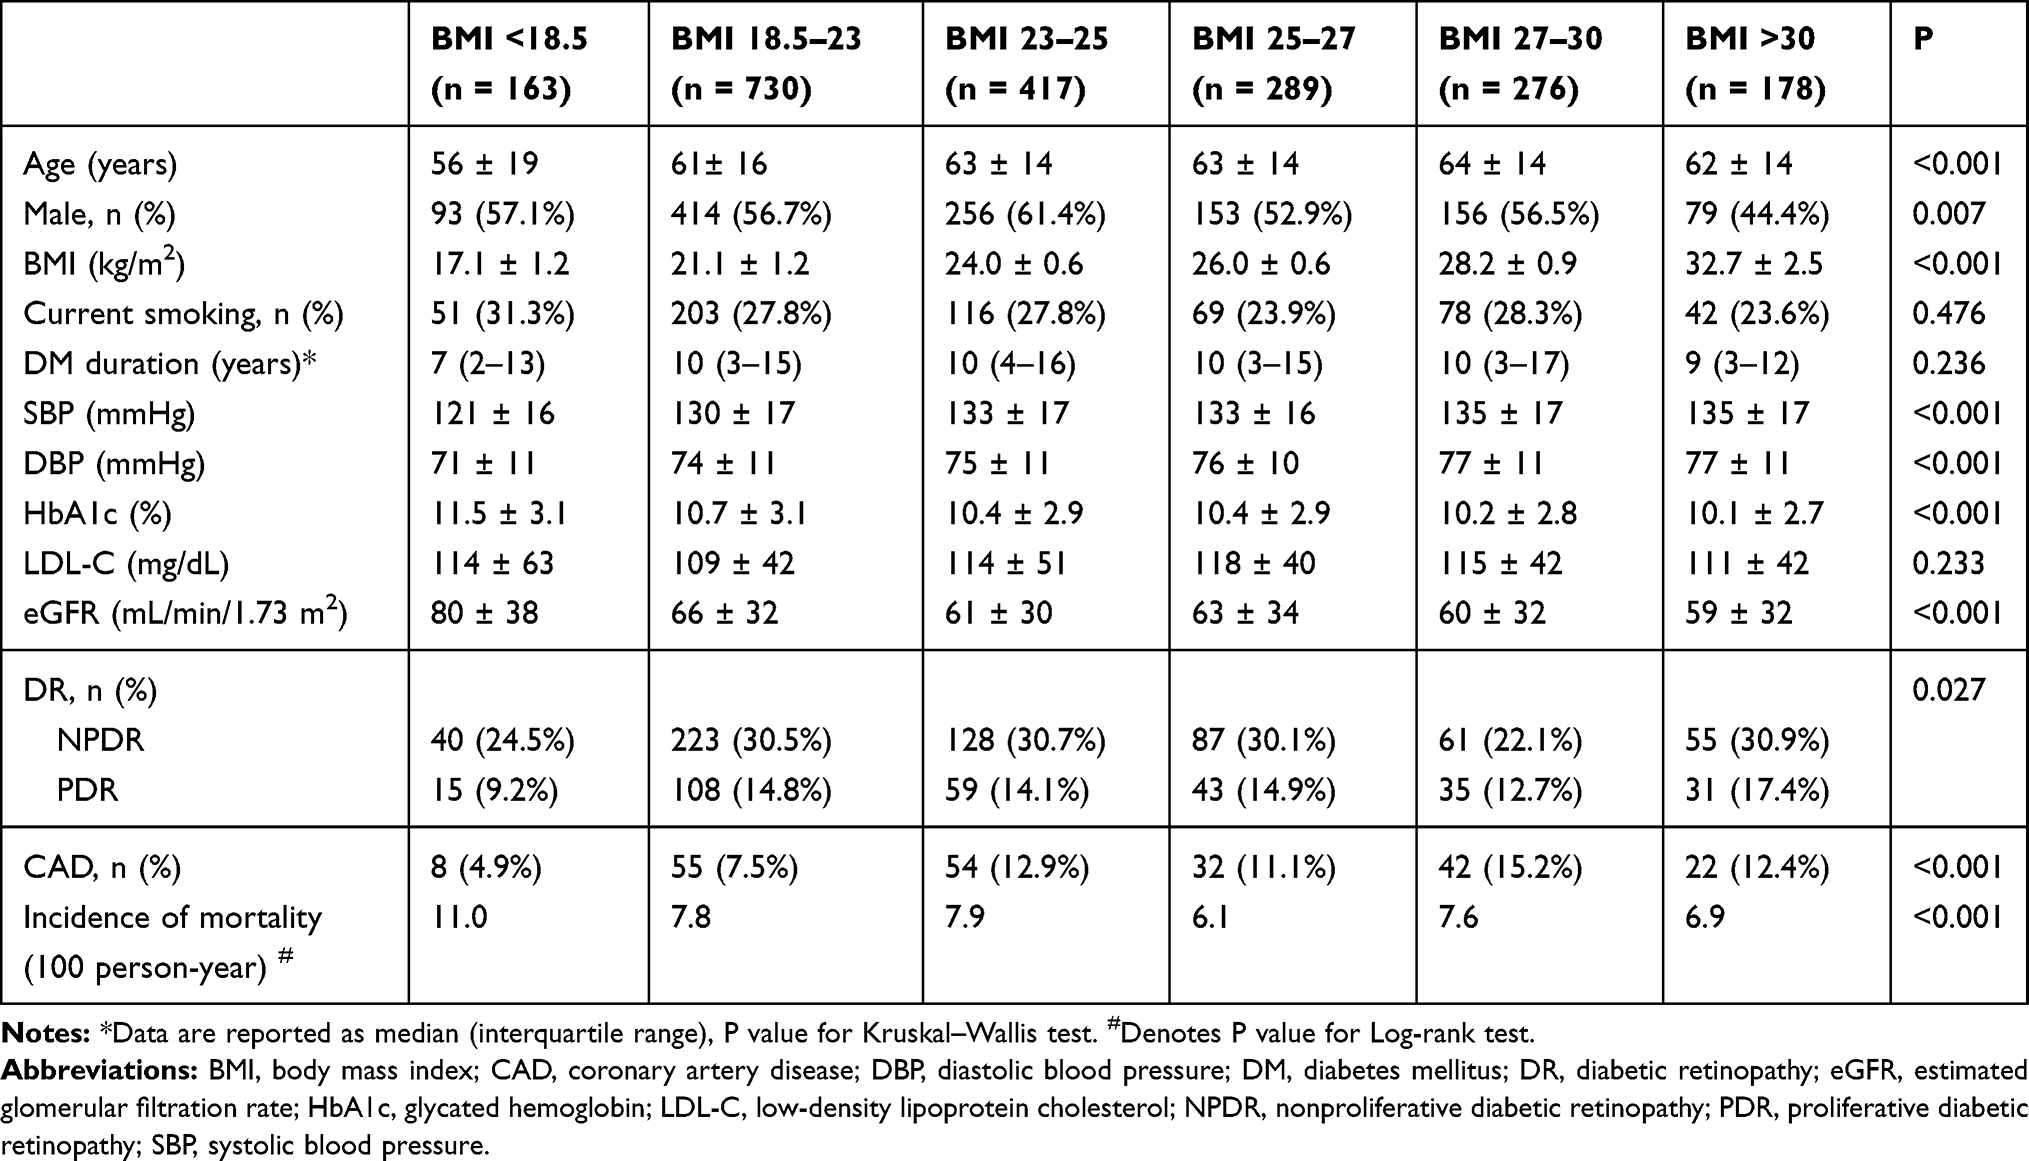 |
Table 1 Characteristics of Enrolled Patients Stratified by Body Mass Index (BMI) |
Over median of 6.7 years (interquartile range, 3.9‒9.6 years) of follow-up, 1060 patients died. Mortality risk was significantly higher in the BMI <18.5 kg/m2, 18.5‒23 kg/m2, and 23‒25 kg/m2 categories than in the reference category of BMI 25‒27 kg/m2; however, mortality risks in the 27‒30 kg/m2 and >30 kg/m2 categories were comparable to that in the reference category (Figure 1).
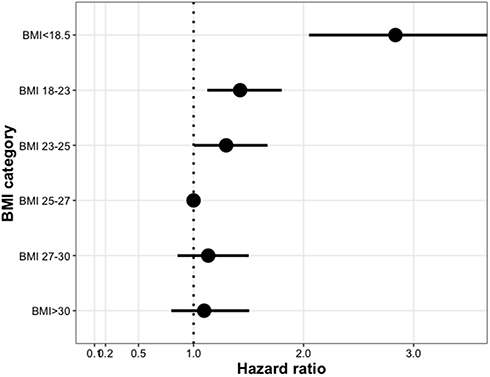 |
Figure 1 Hazard ratios for all-cause mortality according to predefined body mass index (BMI) categories in all participants. |
There were 885 patients with DR and 1168 patients without DR. We stratified the study cohort according to presence or absence of DR. The incidence of all-cause mortality was 9.3/100 person‒year in patients with DR and 6.5/100 person‒year in those without DR. The risk of all-cause mortality was significantly higher in the patients with DR than those without DR (Log-rank test P < 0.001, using Kaplan-Meier analysis; Figure 2). Table 2 shows the hazard ratio for mortality in each BMI category as compared to the reference category in the Cox regression model, and we selected the covariates which were significantly associated with BMI shown in Table 1. As current smoking is an important correctable factor for mortality in type 2 diabetes,9,15 we also included current smoking as a covariate in the Cox regression model. Among the patients without DR, the relationship between BMI and all-cause mortality was similar to that seen in the entire cohort: i.e. significantly higher risk of mortality in the BMI categories <18.5 kg/m2, 18.5‒23 kg/m2, and 23‒25 kg/m2 than in the reference category, and comparable risk of mortality among the 27‒30 kg/m2, >30 kg/m2, and the reference categories. Among the patients with DR, however, only those with BMI <18.5 kg/m2 had significantly higher risk of mortality than the reference group (Table 2). The shape of the relationship between BMI and mortality risk was obviously different between the patients with and without DR (Figure 3). There was significant interaction between continuous BMI data and DR (P = 0.019), as well as between categorized BMI data and DR (P = 0.036).
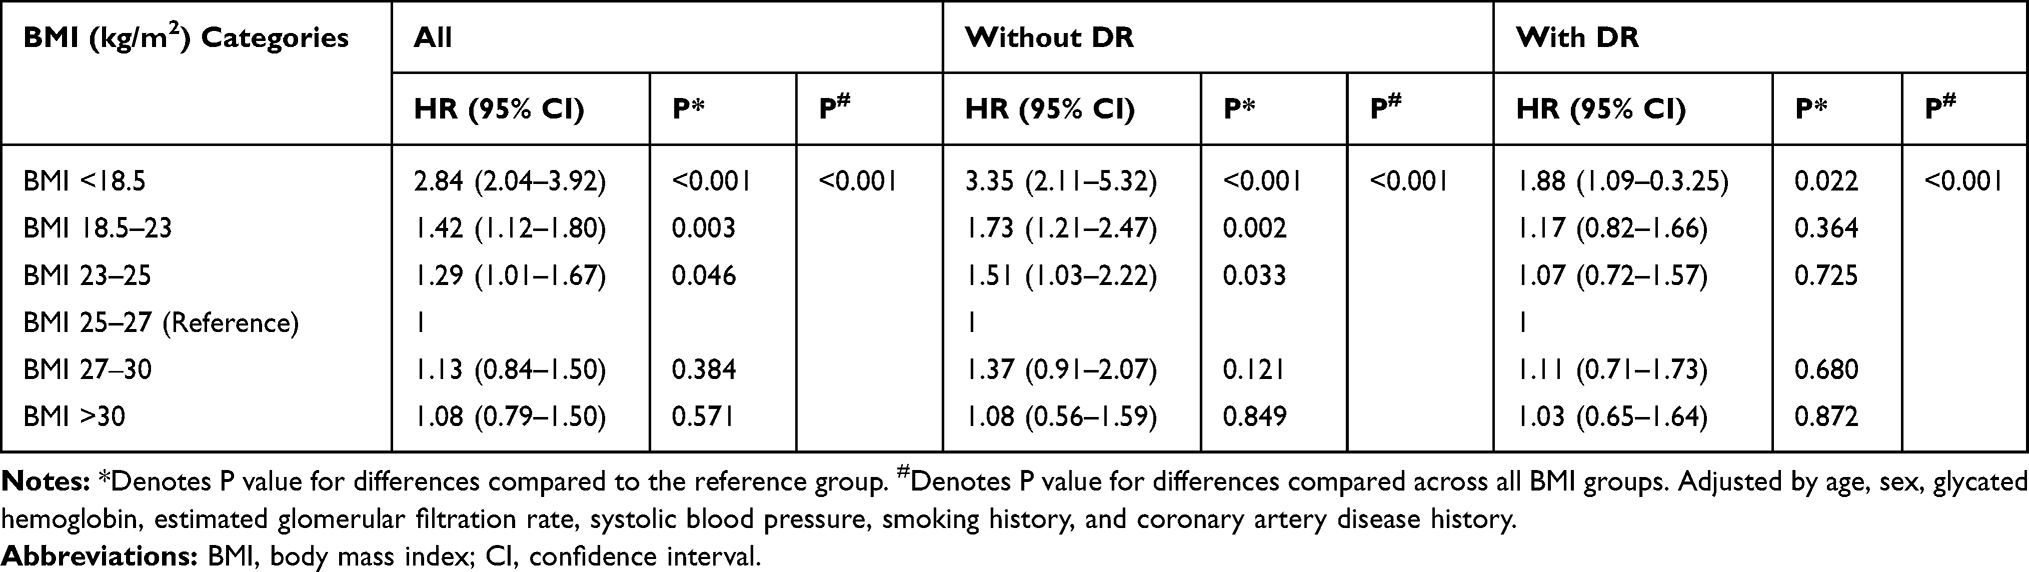 |
Table 2 Hazard Ratio (HR) for All-Cause Mortality, Stratified by Body Mass Index (BMI) for Patients with and Without Diabetic Retinopathy (DR) |
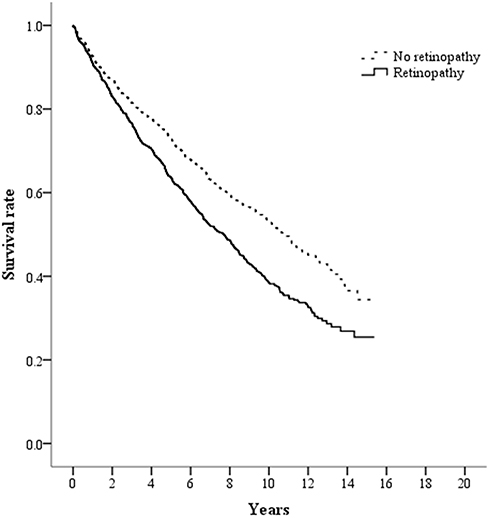 |
Figure 2 Survival rates shown by Kaplan–Meier curves according to the presence or absence of retinopathy (Log-rank test P < 0.001). |
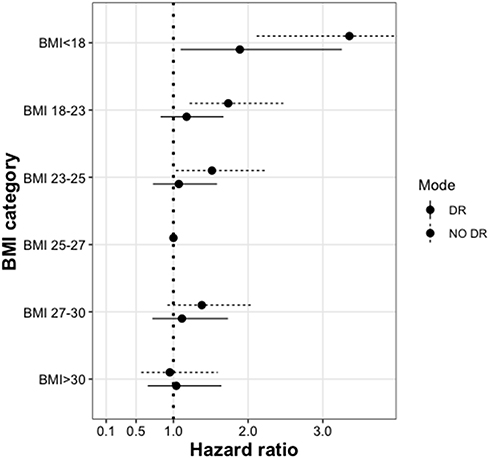 |
Figure 3 Hazard ratios with 95% confidence interval for mortality in patients with and without diabetic retinopathy (DR). P = 0.019 for the interaction between body mass index (BMI) and DR. |
Discussion
Among the patients hospitalized because of poorly controlled diabetes, those with BMI of <18.5 kg/m2, 18.5‒23 kg/m2, and 23‒25 kg/m2 had a higher mortality risk than those with BMI of 25‒27 kg/m2. Therefore, an existence of the obesity paradox was shown in this cohort. The lowest mortality was observed in patients with BMI of 25–27 kg/m2, which harbored in the overweight range in Asians according to the criteria of WHO20 or in Taiwan.21 Interestingly, there was a significant interaction between DR and BMI. In patients with DR, only those with BMI <18.5 kg/m2 had significantly higher risk of mortality than the reference group (BMI of 25–27 kg/m2). Thus, the presence of DR changed the shape of the association between BMI and all-cause mortality in patients with type 2 diabetes.
Several studies have shown a U-shaped association between BMI and mortality. The optimal BMI for survival appears to depend on the characteristics of the populations. Among the patients with newly diagnosed diabetes, the lowest mortality rate in the obesity group (BMI of 30‒35 kg/m2) was reported in the Louisiana State University Hospital-Based Longitudinal Study;22 among the patients with known type 2 diabetes and a median diabetic duration of 9 years, the lowest mortality rate in the group with BMI between 33.2 and 39.4 kg/m2 was reported in the Madrid DIABETES Study with the mortality records of the Spanish National Institute of Statistics.23 In comparison to subjects with normal glucose regulation, it has been deduced that the optimal BMI was approximately 1.5 kg/m2 higher for patients with incident diabetes and approximately 3 kg/m2 higher for patients with known diabetes.13 In the Action to Control Cardiovascular Risk in Diabetes (ACCORD) study, however, Xing et al14 reported contrary findings. Among patients with long-standing diabetes, the highest risk of mortality in patients with BMI ≥40 kg/m2 was observed with no evidence of the obesity paradox, but it should be noted that the ACCORD study was primarily designed for intensive control of blood glucose, blood pressure, and lipids.14
In medical science, the term “obesity paradox” still lacks a precise definition.24 It was first used as an article title for an unexpected higher mortality in CAD patients with normal BMI than those with overweight BMI. In line with our findings that article did not find a significant difference in mortality between subjects with overweight and obesity.25 Here, we selected BMI of 25‒27 kg/m2 as the reference category because previous reports have shown a low risk of mortality in this BMI range among Taiwanese with type 2 diabetes and among Asians.26,27 Therefore, we considered the relationship between long-term mortality and BMI an obesity paradox in the present study, with mortality risk being lowest in overweight patients. Salehidoost et al28 also reported relatively low mortality risk in overweight Iranians with type 2 diabetes. In Asian patients developing type 2 diabetes, low BMI is associated with predominant β-cell dysfunction.29 In our cohort composed of inpatients with type 2 diabetes and a mean HbA1c of approximately 10%, these patients might undergo a certain degree of the catabolic effects of hyperglycemia when admission, especially patients with BMI <18.5 kg/m2.
Fatty acid oxidation is an important energy source for the heart. An alternative energy source, such as glucose, should be increased when fatty acid utilization is impaired; however, glucotoxicity status with high insulin resistance may result in a lack of glucose uptake into cardiomyocytes.30 Impaired energy utilization may induce a cardiac damage and increase risk of heart failure.31 Therefore, the maladaptive cardiac response to energy impairment may explain the high mortality risk in patients with low BMI and poor glucose control. Furthermore, impaired activation of peroxisome proliferator-activated receptor-gamma (PPARγ), mostly expressed in adipose tissue, may also be a mechanism for the high mortality rate in patients with low BMI, based on the literature-based discovery.32 In an animal study, PPARγ agonist-induced fatty acid oxidation and prevented heart failure.33
DR was a significant predictor of mortality in the present study. In a meta-analysis of studies on type 2 diabetes, Kramer et al34 showed that DR was associated with 2.41-fold increased risk of mortality. In Asians with type 2 diabetes, Sabanayagam et al35 reported that DR was associated with 1.54-fold increased risk of mortality, and this result is consistent with our own previous study in which we found that DR was associated with 1.58-fold increased risk of mortality in patients without albuminuria.36
The role of adiposity is ambiguous in patients with DR.37 DR has been shown to be associated with obesity.38,39 On the contrary, several studies have shown that obesity has the potential to diminish the severity of DR in Asians with type 2 diabetes.40–42 Man et al40 pointed out that generalized obesity and abdominal obesity may have different effects on DR. Although a high waist-to-hip ratio increased the risk of DR, a high BMI decreased the risk of DR in Asians with type 2 diabetes recruited from the Singapore National Eye Centre.40 Sasongko et al41 reported that high BMI was significantly associated with lower risk of DR in Indonesians with type 2 diabetes. Similarly, Chan et al42 reported an inverse association between BMI and incidence of DR in separate prospective cohorts of Malays and Indians.
Ahlqvist et al43 reported that patients with low BMI and low insulin secretion were prone to developing DR based on data-driven cluster analysis. A lower DR risk was associated with a better β-cell function, as reflected by high fasting C-peptide levels, in Chinese patients with type 2 diabetes.44 Furthermore, there are some differences in the mechanism between DR and CAD; for example, vascular endothelial growth factor is an initiator of DR development, but plays a protective role in vascular collateralization for CAD.45,46 Therefore, patients with DR should be viewed as a different population from those without DR. There appears to be a close relationship between DR, BMI, and mortality. Ours is the first study to demonstrate a difference in the shape of the association between BMI and mortality in patients with and without DR.
The present study has several strengths. First, DR was diagnosed by ophthalmologists. Second, BMI was obtained on admission using standard instruments, avoiding the recall bias of self-reported values. Third, all-cause mortality data were obtained from the national mortality registry, which covers 99.6% of the total population of Taiwan. Nevertheless, this study also has some limitations. First, BMI is known to be a weak surrogate for adiposity as it does not distinguish between muscle and fat. BMI also fails to reflect visceral adiposity, which has more impact on cardiovascular risk than subcutaneous fat.47 Second, we did not identify the mechanism by which DR influences the relationship between BMI and mortality. Finally, we did not assess the effect of treatments received by patients after discharge.
Conclusion
A low BMI appears to be associated with a high risk of mortality in patients with poorly controlled type 2 diabetes. The lowest mortality risk was observed in patients with BMI between 25 and 27 kg/m2. The relationship between BMI and mortality in patients with DR differed from that in patients without DR. Compared with the reference group, the curve of obesity paradox became flat and only patients with BMI <18.5 kg/m2 showed a significantly higher mortality risk.
Acknowledgments
This work was supported by Taichung Veterans General Hospital, Taichung, Taiwan (TCVGH-1083504C) and the Ministry of Science and Technology, Taiwan (MOST 108-2314-B-075A-002). The funders had no role in the decision to submit the manuscript for publication. Mortality data were provided by the Collaboration Center of Health Information Application, Ministry of Health and Welfare, Executive Yuan. The statistical analysis was performed by the Biostatistics Task Force of Taichung Veterans General Hospital, Taichung, Taiwan.
Disclosure
The authors report no conflicts of interest in this work.
References
1. Chen Y, Copeland WK, Vedanthan R, et al. Association between body mass index and cardiovascular disease mortality in east Asians and south Asians: pooled analysis of prospective data from the Asia Cohort Consortium. BMJ. 2013;347:f5446. doi:10.1136/bmj.f5446
2. Farag YM, Gaballa MR. Diabesity: an overview of a rising epidemic. Nephrol Dial Transplant. 2011;26:28–35. doi:10.1093/ndt/gfq576
3. Carnethon MR, De Chavez PJ, Biggs ML, et al. Association of weight status with mortality in adults with incident diabetes. JAMA. 2012;308:581–590. doi:10.1001/jama.2012.9282
4. Kuo JF, Hsieh YT, Mao IC, Lin SD, Tu ST, Hsieh MC. The association between body mass index and all-cause mortality in patients with Type 2 diabetes mellitus: a 5.5-year prospective analysis. Medicine. 2015;94:e1398. doi:10.1097/MD.0000000000001398
5. Thomas G, Khunti K, Curcin V, et al. Obesity paradox in people newly diagnosed with Type 2 diabetes with and without prior cardiovascular disease. Diabetes Obes Metab. 2014;16:317–325. doi:10.1111/dom.12217
6. Costanzo P, Cleland JG, Pellicori P, et al. The obesity paradox in Type 2 diabetes mellitus: relationship of body mass index to prognosis: a cohort study. Ann Intern Med. 2015;162:610–618. doi:10.7326/M14-1551
7. Tobias DK, Pan A, Jackson CL, et al. Body-mass index and mortality among adults with incident type 2 diabetes. N Engl J Med. 2014;370:233–244. doi:10.1056/NEJMoa1304501
8. Dallongeville J, Bhatt DL, Steg PH, et al. Relation between body mass index, waist circumference, and cardiovascular outcomes in 19,579 diabetic patients with established vascular disease: the REACH Registry. Eur J Prev Cardiol. 2012;19:241–249. doi:10.1177/1741826710394305
9. Jenkins DA, Bowden J, Robinson HA, et al. Adiposity-mortality relationships in Type 2 diabetes, coronary heart disease and cancer subgroups in the UK biobank, and their modification by smoking. Diabetes Care. 2018;41:1878–1886. doi:10.2337/dc17-2508
10. Tobias DK. Addressing reverse causation bias in the obesity paradox is not “One size fits all”. Diabetes Care. 2017;40:1000–1001. doi:10.2337/dci17-0010
11. Edqvist J, Rawshani A, Adiels M, et al. BMI and mortality in patients with new-onset Type 2 diabetes: a comparison with age- and sex-matched control subjects from the general population. Diabetes Care. 2018;41(3):485–493. doi:10.2337/dc17-1309
12. Kwon Y, Kim HJ, Park S, Park YG, Cho KH. Body mass index-related mortality in patients with Type 2 diabetes and heterogeneity in obesity paradox studies: a dose-response meta-analysis. PLoS One. 2017;12:e0168247. doi:10.1371/journal.pone.0168247
13. Lee EY, Lee YH, Yi SW, Shin SA, Yi JJ. BMI and all-cause mortality in normoglycemia, impaired fasting glucose, newly diagnosed diabetes, and prevalent diabetes: a cohort study. Diabetes Care. 2017;40:1026–1033. doi:10.2337/dc16-1458
14. Xing Z, Pei J, Huang J, Peng X, Chen P, Hu X. Relationship of obesity to adverse events among patients with mean 10-year history of type 2 diabetes mellitus: results of the ACCORD study. J Am Heart Assoc. 2018;7:e010512. doi:10.1161/JAHA.118.010512
15. Rawshani A, Rawshani A, Franzen S, et al. Risk factors, mortality, and cardiovascular outcomes in patients with Type 2 diabetes. N Engl J Med. 2018;379:633–644. doi:10.1056/NEJMoa1800256
16. Shah R, Gayat E, Januzzi JL
17. De Schutter A, Lavie CJ, Kachur S, Patel DA, Milani RV. Body composition and mortality in a large cohort with preserved ejection fraction: untangling the obesity paradox. Mayo Clin Proc. 2014;89:1072–1079. doi:10.1016/j.mayocp.2014.04.025
18. Kim H, Kim H, Lee M, et al. The impact of disease severity on paradoxical association between body mass index and mortality in patients with acute kidney injury undergoing continuous renal replacement therapy. BMC Nephrol. 2018;19:32. doi:10.1186/s12882-018-0833-5
19. Inker LA, Astor BC, Fox CH, et al. KDOQI US commentary on the 2012 KDIGO clinical practice guideline for the evaluation and management of CKD. Am J Kidney Dis. 2014;63:713–735. doi:10.1053/j.ajkd.2014.01.416
20. WHO Expert Consultation. Appropriate body-mass index for Asian populations and its implications for policy and intervention strategies. Lancet. 2004;363:157–163. doi:10.1016/S0140-6736(03)15268-3
21. Pan WH, Flegal KM, Chang HY, Yeh WT, Yeh CJ, Lee WC. Body mass index and obesity-related metabolic disorders in Taiwanese and US whites and blacks: implications for definitions of overweight and obesity for Asians. Am J Clin Nutr. 2004;79:31–39. doi:10.1093/ajcn/79.1.31
22. Zhao W, Katzmarzyk PT, Horswell R, et al. Body mass index and the risk of all-cause mortality among patients with type 2 diabetes mellitus. Circulation. 2014;130:2143–2151. doi:10.1161/CIRCULATIONAHA.114.009098
23. Salinero-Fort MA, San Andres-Rebollo FJ, Gomez-Campelo P, et al. Body mass index and all-cause mortality among type 2 diabetes mellitus patients: findings from the 5-year follow-up of the MADIABETES cohort. Eur J Intern Med. 2017;43:46–52. doi:10.1016/j.ejim.2017.06.021
24. Flegal KM, Ioannidis JPA. The obesity paradox: a misleading term that should be abandoned. Obesity. 2018;26:629–630. doi:10.1002/oby.22140
25. Gruberg L, Weissman NJ, Waksman R, et al. The impact of obesity on the short-term and long-term outcomes after percutaneous coronary intervention: the obesity paradox? J Am Coll Cardiol. 2002;39:578–584. doi:10.1016/S0735-1097(01)01802-2
26. Lin CC, Li CI, Liu CS, et al. Obesity paradox in associations between body mass index and diabetes-related hospitalization and mortality in patients with type 2 diabetes: retrospective cohort studies. Diabetes Metab. 2019;45:564–572. doi:10.1016/j.diabet.2019.02.007
27. Zheng W, McLerran DF, Rolland B, et al. Association between body-mass index and risk of death in more than 1 million Asians. N Engl J Med. 2011;364:719–729. doi:10.1056/NEJMoa1010679
28. Salehidoost R, Mansouri A, Amini M, Yamini SA, Aminorroaya A. Body mass index and the all-cause mortality rate in patients with type 2 diabetes mellitus. Acta Diabetol. 2018;55:569–577. doi:10.1007/s00592-018-1126-y
29. Kim CH, Kim HK, Kim EH, Bae SJ, Park JY. Relative contributions of insulin resistance and beta-cell dysfunction to the development of Type 2 diabetes in Koreans. Diabet Med. 2013;30:1075–1079. doi:10.1111/dme.12201
30. De Rosa M, Gambardella J, Shu J, Santulli G. Dietary fat is a key determinant in balancing mitochondrial dynamics in heart failure: a novel mechanism underlying the obesity paradox. Cardiovasc Res. 2018;114:925–927. doi:10.1093/cvr/cvy074
31. Fujii N, Nozawa T, Igawa A, et al. Saturated glucose uptake capacity and impaired fatty acid oxidation in hypertensive hearts before development of heart failure. Am J Physiol Heart Circ Physiol. 2004;287:H760–H766. doi:10.1152/ajpheart.00734.2003
32. Cairelli MJ, Miller CM, Fiszman M, Workman TE, Rindflesch TC. Semantic MEDLINE for discovery browsing: using semantic predications and the literature-based discovery paradigm to elucidate a mechanism for the obesity paradox. AMIA Annu Symp Proc. 2013;2013:164–173.
33. Legchenko E, Chouvarine P, Borchert P, et al. PPARgamma agonist pioglitazone reverses pulmonary hypertension and prevents right heart failure via fatty acid oxidation. Sci Transl Med. 2018;10:eaao0303. PMID: 29695452. doi:10.1126/scitranslmed.aao0303
34. Kramer CK, Rodrigues TC, Canani LH, Gross JL, Azevedo MJ. Diabetic retinopathy predicts all-cause mortality and cardiovascular events in both type 1 and 2 diabetes: meta-analysis of observational studies. Diabetes Care. 2011;34:1238–1244. doi:10.2337/dc11-0079
35. Sabanayagam C, Chee ML, Banu R, et al. Association of diabetic retinopathy and diabetic kidney disease with all-cause and cardiovascular mortality in a multiethnic Asian population. JAMA Netw Open. 2019;2:e191540. doi:10.1001/jamanetworkopen.2019.1540
36. Hsieh YM, Lee WJ, Sheu WH, Li YH, Lin SY, Lee IT. Inpatient screening for albuminuria and retinopathy to predict long-term mortality in type 2 diabetic patients: a retrospective cohort study. Diabetol Metab Syndr. 2017;9:29. doi:10.1186/s13098-017-0229-x
37. Song SJ. Obesity and diabetic retinopathy: new perspectives. JAMA Ophthalmol. 2016;134:258. doi:10.1001/jamaophthalmol.2015.5178
38. Zhu W, Wu Y, Meng YF, Xing Q, Tao JJ, Lu J. Association of obesity and risk of diabetic retinopathy in diabetes patients: a meta-analysis of prospective cohort studies. Medicine. 2018;97:e11807. doi:10.1097/MD.0000000000011807
39. Moh A, Neelam K, Zhang X, et al. Excess visceral adiposity is associated with diabetic retinopathy in a multiethnic Asian cohort with longstanding type 2 diabetes. Endocr Res. 2018;43(3):186–194. doi:10.1080/07435800.2018.1451541
40. Man RE, Sabanayagam C, Chiang PP, et al. Differential association of generalized and abdominal obesity with diabetic retinopathy in Asian patients with Type 2 diabetes. JAMA Ophthalmol. 2016;134:251–257. doi:10.1001/jamaophthalmol.2015.5103
41. Sasongko MB, Widyaputri F, Sulistyoningrum DC, et al. Estimated resting metabolic rate and body composition measures are strongly associated with diabetic retinopathy in Indonesian adults with Type 2 diabetes. Diabetes Care. 2018;41:2377–2384. doi:10.2337/dc18-1074
42. Chan JCY, Chee ML, Tan NYQ, Cheng CY, Wong TY, Sabanayagam C. Differential effect of body mass index on the incidence of diabetes and diabetic retinopathy in two Asian populations. Nutr Diabetes. 2018;8:16. doi:10.1038/s41387-018-0018-0
43. Ahlqvist E, Storm P, Käräjämäki A, et al. Novel subgroups of adult-onset diabetes and their association with outcomes: a data-driven cluster analysis of six variables. Lancet Diabetes Endocrinol. 2018;6:361–369. doi:10.1016/S2213-8587(18)30051-2
44. Lu J, Hou X, Zhang L, et al. Association between body mass index and diabetic retinopathy in Chinese patients with type 2 diabetes. Acta. Diabetol. 2015;52:701–708.
45. Aiello LP, Wong JS. Role of vascular endothelial growth factor in diabetic vascular complications. Kidney Int Suppl. 2000;77:S113–S119. doi:10.1046/j.1523-1755.2000.07718.x
46. Matsudaira K, Maeda K, Okumura N, et al. Impact of low levels of vascular endothelial growth factor after myocardial infarction on 6-month clinical outcome. Results from the Nagoya acute myocardial infarction study. Circ J. 2012;76:1509–1516. doi:10.1253/circj.CJ-11-1127
47. Klein S, Allison DB, Heymsfield SB, et al. Waist circumference and cardiometabolic risk: a consensus statement from shaping america’s health: association for weight management and obesity prevention; NAASO, the obesity society; the American society for nutrition; and the American diabetes association. Obesity. 2007;15:1061–1067. doi:10.1038/oby.2007.632
 © 2020 The Author(s). This work is published and licensed by Dove Medical Press Limited. The full terms of this license are available at https://www.dovepress.com/terms.php and incorporate the Creative Commons Attribution - Non Commercial (unported, v3.0) License.
By accessing the work you hereby accept the Terms. Non-commercial uses of the work are permitted without any further permission from Dove Medical Press Limited, provided the work is properly attributed. For permission for commercial use of this work, please see paragraphs 4.2 and 5 of our Terms.
© 2020 The Author(s). This work is published and licensed by Dove Medical Press Limited. The full terms of this license are available at https://www.dovepress.com/terms.php and incorporate the Creative Commons Attribution - Non Commercial (unported, v3.0) License.
By accessing the work you hereby accept the Terms. Non-commercial uses of the work are permitted without any further permission from Dove Medical Press Limited, provided the work is properly attributed. For permission for commercial use of this work, please see paragraphs 4.2 and 5 of our Terms.