")
Back to Journals » ClinicoEconomics and Outcomes Research » Volume 13
Inequality and Inequity in Outpatient Care Utilization in Ethiopia: A Decomposition Analysis of Ethiopian National Health Accounts
Authors Kifle H, Merga BT , Dessie Y, Demena M, Fekadu G , Negash B
Received 11 October 2020
Accepted for publication 16 January 2021
Published 2 February 2021 Volume 2021:13 Pages 89—98
DOI https://doi.org/10.2147/CEOR.S286253
Checked for plagiarism Yes
Review by Single anonymous peer review
Peer reviewer comments 2
Editor who approved publication: Professor Giorgio Colombo
Hilawi Kifle,1 Bedasa Taye Merga,2 Yadeta Dessie,2 Melake Demena,2 Gelana Fekadu,3 Belay Negash2
1Haramaya University Higher Health Center, Haramaya University, Haramaya, Ethiopia; 2School of Public Health, College of Health and Medical Sciences, Haramaya University, Harar, Ethiopia; 3School of Nursing and Midwifery, College of Health and Medical Sciences, Haramaya University, Harar, Ethiopia
Correspondence: Bedasa Taye Merga
School of Public Health, College of Health and Medical Sciences, Haramaya University, P.O. Box 235, Harar, Ethiopia
Tel +251917723961
Email [email protected]
Background: Inequity in healthcare use is avoidable inequality, and it exists when there are differences in the use of healthcare after standardization of different needs among the population. In Ethiopia, wide variation and lower achievement exists in outpatient visit per person per year against the target to reach by 2020. Therefore, this study is aimed at measuring inequalities and inequities in outpatient care utilization in Ethiopia.
Methods: The study utilized data from 2015/16 Ethiopian National Health Account survey. The analysis included a weighted sample of 42,460 individuals. Concentration curve and indices were used to measure inequality in outpatient care utilization. Deviations in the degree to which outpatient care was distributed according to need were measured by the horizontal inequity index. All statistical analyses were done using STATA version 14. In all analyses statistical significance was declared at a p-value < 0.05 and a 95% confidence interval.
Results: The outpatient care utilizations were found to be concentrated among the rich. The actual (C = 0.0335, 95% CI: 0.0298, 0.0431) and need predicted (C = 0.0157, 95% CI: 0.0117, 0.0413) utilizations were concentrated among the rich. The distributions of outpatient care in Ethiopians were pro-rich (rich-favoring). The decomposition analysis revealed that need factors were the main positive contributors to the inequality (23.6%) and non-need factors were among the negative contributors to the inequality (− 48.4%).
Conclusion: This study evidenced the presence of rich-favoring inequality and inequity in outpatient care utilization in Ethiopia. Therefore, there is a need to consider implementation strategies that focus on fairness in healthcare utilization.
Keywords: national health accounts, outpatient care utilization, inequality, inequity, decomposition analysis, Ethiopia
Introduction
Equity in health and healthcare is one of the main policy objectives in healthcare systems of most countries.1–4 Health inequities are avoidable, unfair, and unjust differences in accessing and utilizing health services between different socioeconomic groups.5,6 Health inequality is differences in health status or in the distribution of health determinants between different population groups.5,7 Inequity in healthcare use is avoidable inequality, and it exists when there are differences in the use of healthcare after standardization of different needs among the population.8,9
Ensuring equitable distributions of healthcare services with financial protection is an ultimate healthcare objective for all countries aiming to achieve universal health coverage.8 However, making health systems equitable continues to be a challenge in global health.10 Health systems that consider the circumstances and needs of socially disadvantaged and marginalized populations, including women, children, the older population, the poor and groups who experience stigma and discrimination could promote health equity.11
Previously conducted studies on inequality and inequity in healthcare utilization have revealed disparities and unfairness in healthcare utilization across socioeconomic groups.12–15 Studies in countries like Nepal, Iran and China revealed socioeconomic status (SES)-related inequality in access to and utilization of healthcare.16–18 In sub-Saharan countries there has been a noticeable inequity regarding maternal, child health19,20 and general healthcare services.21 However, the causal pathways that explain the inequities in access are not precisely understood.11
In Ethiopia the average outpatient visit per person per year is 0.7, with a target to reach 2 outpatient visits per person per year by 2020. The average outpatient visits vary among regions, ranging from 0.2 in Somali to 1.8 in Tigray.22 Only 10% of persons reporting illness actually obtained treatment for their condition from any health facility, government or private. In addition, utilization of health services during illness had shown great rural−urban differences, with 9.5% in rural and 14% in urban areas.23
Ethiopia set a transformational agenda in its Health Sector Transformational Plan, envisioning all of its citizens enjoying equitable and affordable access to all types of health services by 2020. This five-year strategic plan contains four outpatient care utilization indicators from fourteen core equity indicators.3 The achievement of the health sector transformation plan is found to be promising in terms of healthcare utilization. However, the achievement varies across regions and socioeconomic groups.24
Some studies attempted to assess the health service utilization rate of individual services and to identify determinants of healthcare use for the individual services. However, much was not done so far on the inequality and inequity in outpatient care utilization in Ethiopia. This study is, therefore, aimed at measuring inequalities and inequities in outpatient care utilization in Ethiopia using national health account data.
Moreover, the results of this study provide factual insights for policymakers and program implementers to design effective policies and strategies that could reduce socioeconomic inequalities in the utilization of outpatient care in Ethiopia.
Methods
Data Sources
This study utilized data from the 2015/16 Ethiopian National Health Account (NHA), which is a nationally representative survey. National Health Account tracks the total health expenditure flows of a health system from financing sources to purposes of spending and end users for a given time period. Ethiopia’s sixth round of Health Accounts covered fiscal year 2013/14 (July 8, 2013 through July 7, 2014). A total of 42,460 individuals residing in 9986 randomly selected households were included from the nine administrative regions and two city administrations of Ethiopia. Details about the NHA sampling techniques and sample size are available at www.who.int/health-topics/health-accounts/. The NHA research protocol complies with the National Health Research Ethics Committee and Institutional Review Board guidelines.
Study Variables
Dependent Variable
Healthcare utilization measured by outpatient visits.
Independent Variable
Total annual personal expenditure used as a proxy for living standard and grouped individuals into five quintiles.
Need variables: In this study, age, sex and perceived health status (self-assessed health and chronic diseases) were used as need factors for outpatient care utilization.
Non-need variables: In this study, total personal expenditure, education, marital status, area of residence, health insurance, and employment and occupation status were non-need factors.
Operational Definition
Need-predicted outpatient care utilization: Need-predicted outpatient care utilization represents “fair inequality” caused by the healthcare need factors: age, sex, and health status (self-assessed health status and chronic disease status).
Need-standardized outpatient care utilization: Standardized outpatient care utilization signifies unfair inequality which is caused by socioeconomic factors that can be avoided by proper policy arrangement.
Concentration index: Measures the direction and the magnitude of inequality in outpatient care utilization due to socioeconomic factors.
Horizontal inequity index: Measures the direction and the magnitude of inequity in outpatient care utilization due to socioeconomic factors.
Method of Data Processing and Analysis
The extracted data were weighted to ensure the sample representativeness for the nine regions and two city administrations. Analyses were performed using STATA version 14. Data were treated using a “stack” command in STATA that change wide to long form and generate individual level data set. Data cleaning were done to treat missing values. The NHA questionnaire assessed outpatient care utilization in the last four weeks prior to the survey; the recorded number of visits were dichotomized (0 = no visit and 1 = one or more visits).
The concentration curve plots the cumulative percentage of the outpatient care utilization (y-axis) against the cumulative percentage of the population by sex and area of residence, ranked by living standards, beginning with the poorest, and ending with the richest (x-axis). In other words, the concentration curve plots shares of the outpatient care utilization against quintiles of the living standards variable. Graphing concentration curves were done using the command glcurve.
The concentration index is calculated as twice the area between the concentration curve and the line of equality (45° line). The concentration index ranges between −1 and +1. The concentration index takes a value of zero if outpatient care utilization distribution is completely equal. It is negative when the concentration curve lies above the line of equality, which indicates greater concentration of the healthcare utilization variable among the poor (pro-poor concentrations). Meanwhile, it takes a positive value if the concentration curve lies below the line of equality, which indicates greater concentration of the healthcare utilization variable among the rich (pro-rich concentrations).

where C indicates concentration index applied with sample weights in the computation of the mean (µ), the covariance (cov), outpatient care utilization (y) and the rank variable (r), which is rank of the individual by total personal expenditure distribution.
A probit regression model of decomposition for concentration index was computed to measure absolute and percentage contribution to the concentration index related to outpatient care utilization. Then, the concentration index for y for this non-linear approach can be written as
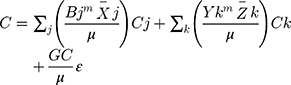
where m is the mean of y; x̄j is the mean of xj; and z̄k is the mean of zk, GCε is the generalized concentration index for the error term (ε). The probit STATA command was used.
The horizontal inequity (HI) index measures the magnitude of inequity. The value of HI is measured as the difference between the concentration index of healthcare use ( ) and that of healthcare need (
 ).25 Horizontal inequity measures socioeconomic-related inequity in healthcare use after standardizing for need differences in the outpatient care utilizations.
In all analyses statistical significance was declared at a p-value < 0.05 and 95% confidence interval.
Ethical Considerations
The Institutional Health Research Ethical Review Committee of the College of Health and Medical Sciences, Haramaya University approved the protocol of this study (Ref. no: IHRERC/066/2019). A letter of permission was written to the Federal Ministry of Health, Cooperative and Partnership Directorate to request access to the NHA dataset. There are no names of individuals or household addresses in the data files. The data were treated as confidential, and no effort was made to identify any household or individual respondent interviewed in the survey. The data were used only for the proposed study. The NHA research protocol complies with the National Health Research Ethics Committee and Institutional Review Board guidelines.
Results
Characteristics of the Study Participants
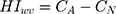
A total of 42,460 individuals residing in 9986 households were included in the study. Nine regions and two administrative cities were included. The mean age of the participants was 22.26 years. More than half (51%) of the study participants were female. About three-quarters (75.74%) were from rural settings. Only 31.77% were employed (Table 1).
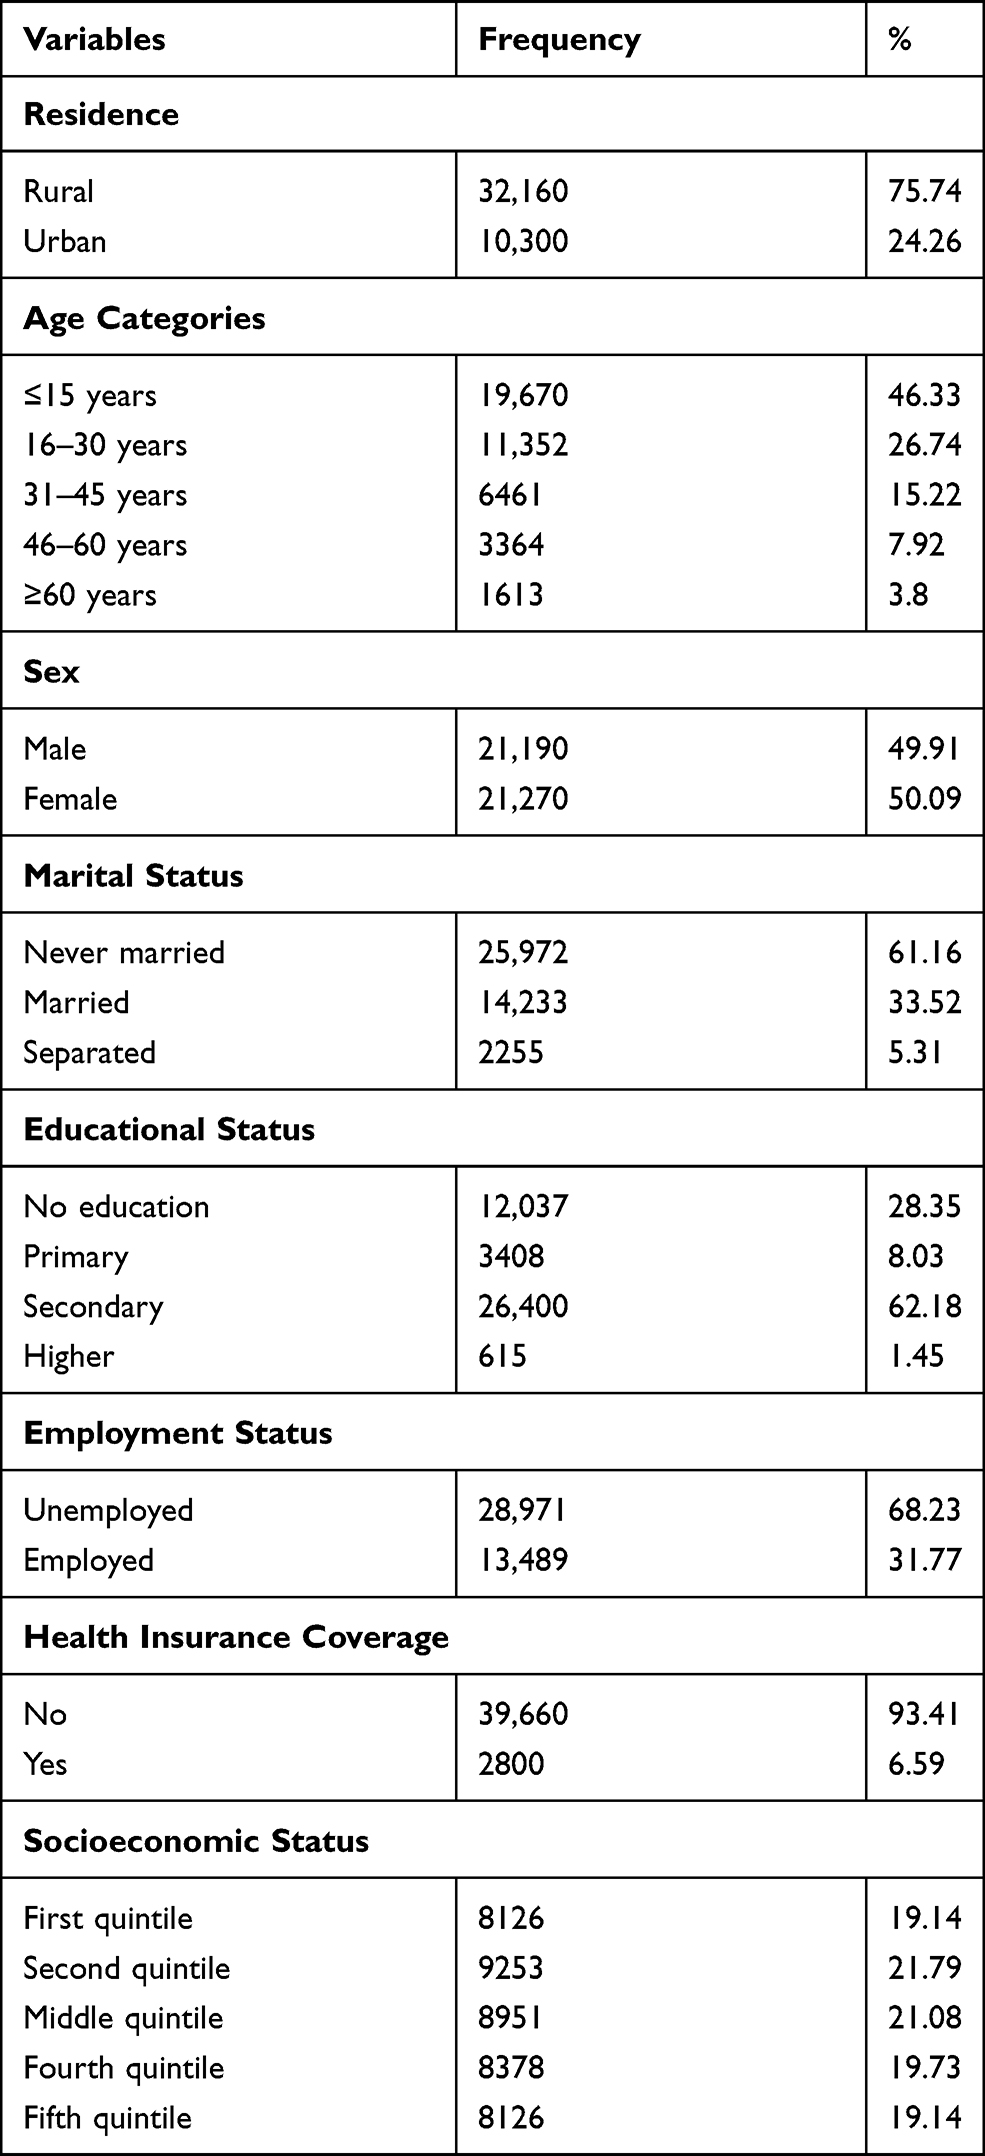 |
Table 1 Socio-Demographic Characteristics of Study Participants for Socioeconomic-Related Inequity in Outpatient Care Utilization in Ethiopia, 2014/15 (N = 42,460) |
Self-Reported Health Status of the Participants
Self-assessed health status was rated as very good by 55.27% and good by 35.66%. About 7.9% reported one of the chronic diseases, of which 6.49% reported HIV/AIDS (Table 2).
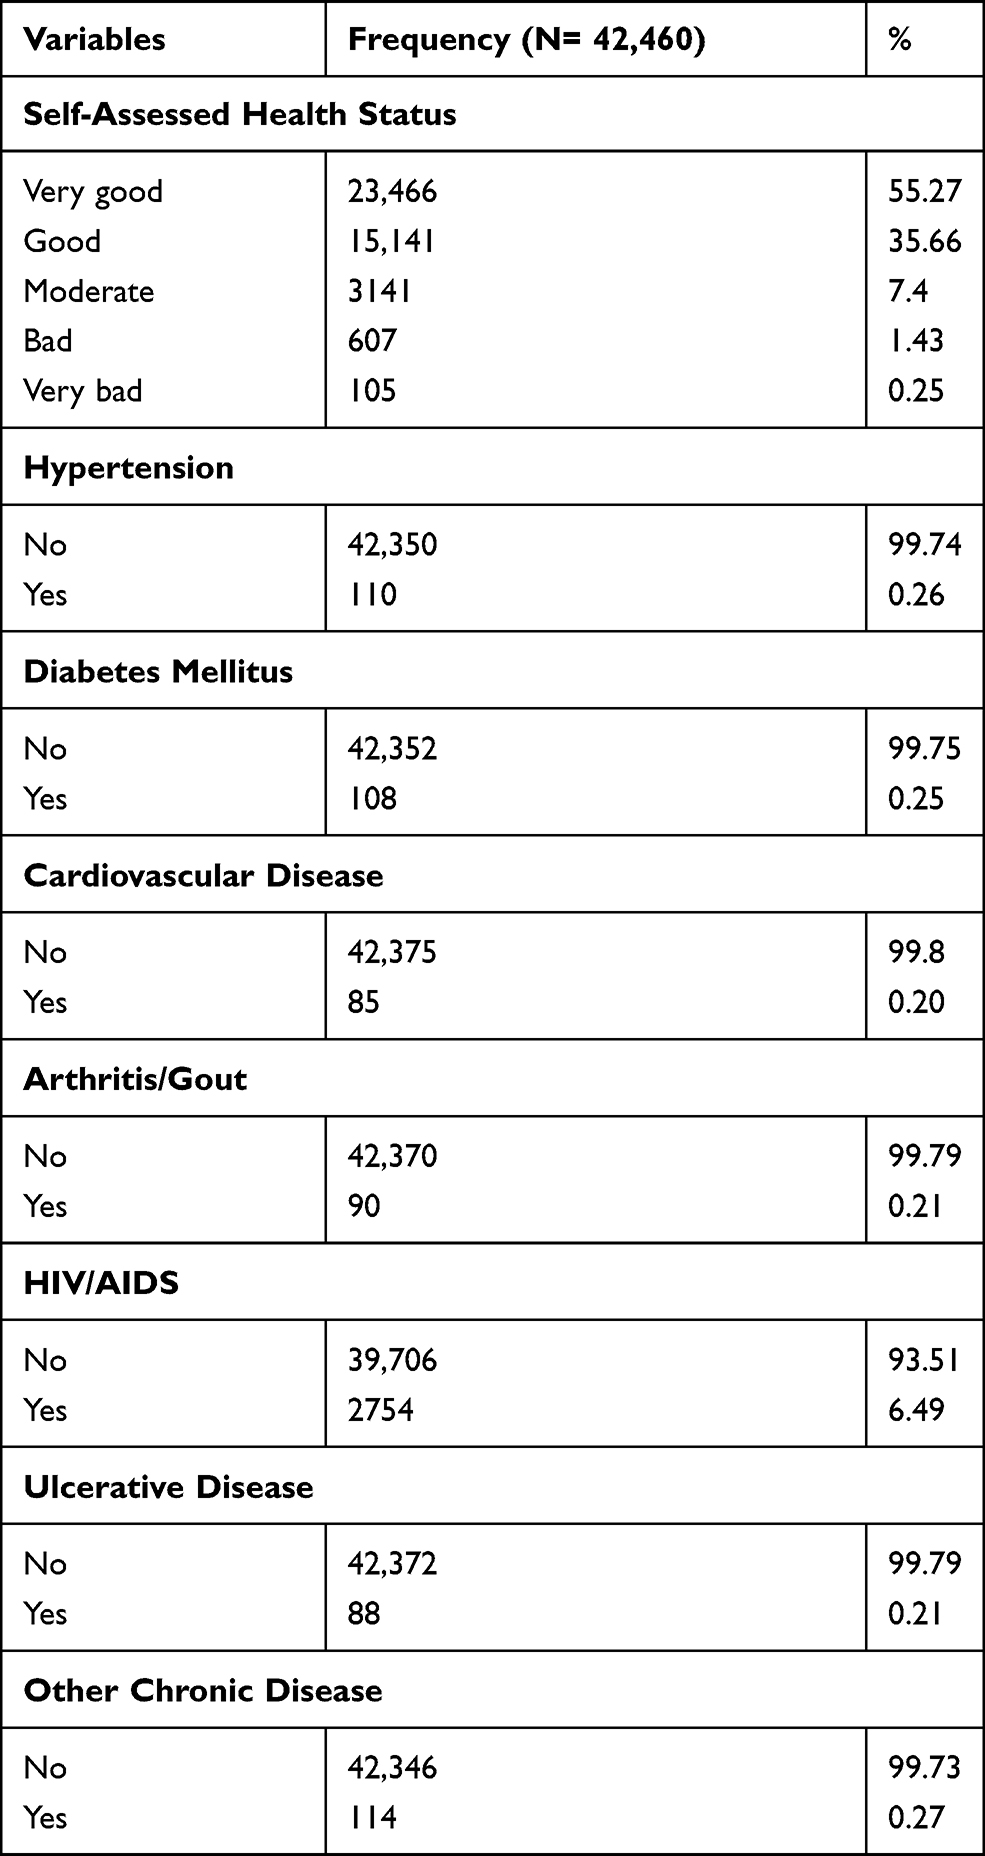 |
Table 2 Self-Reported Health Status of Study Participants for Socioeconomic-Related Inequity in Outpatient Care Utilization in Ethiopia, 2015/16 (N = 42,460) |
Healthcare Utilization
The outpatient care visits in the four weeks preceding the survey were 9.4% (95% CI = 9.1%, 9.6%). The outpatient care utilization was highest (25.71%) in those who rated their health status as very bad and lowest (5.90%) in those who perceived their health status as very good. The outpatient utilization rate was highest (18.18%) in hypertensive respondents and lowest (5.68%) in ulcerative diseased respondents.
Among individuals with different educational statuses, the outpatient utilization rate increased as educational level increased, with lowest in others category (religious/adult education) 5.91% [95% CI = 3.88%, 8.90%] and highest in higher educational level 13.00% [95% CI = 10.57%, 15.90%].
Indirectly Standardized Outpatient Care Utilization
The probability mean of actual outpatient care utilization was highest in middle, second richest and richest quintile of 0.1 and lowest in the first quintile of 0.08; on the other hand, a mean need-predicted outpatient care utilization was highest in second richest and richest quintiles of 0.07, with a total of 0.06. Further, a probability mean of need-standardized utilization shows similarity in differences with actual utilization (Figure 1).
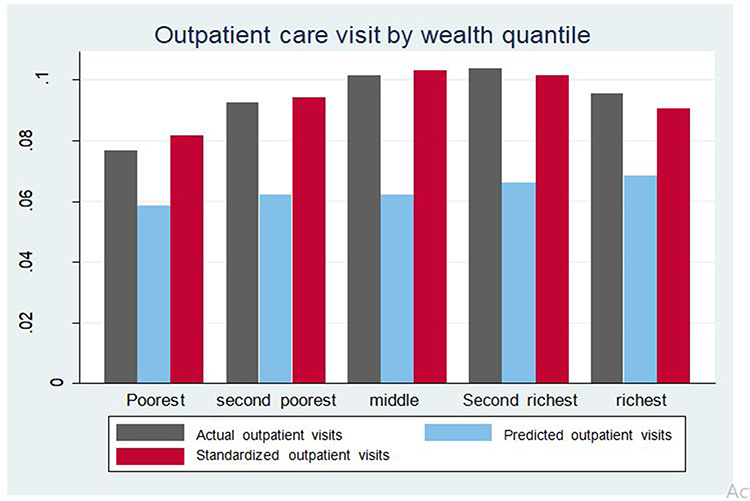 |
Figure 1 Probability mean of actual utilizations of outpatient care by socioeconomic status in Ethiopia, 2015/16. |
Concentration Curve and Concentration Index
The concentration curves for sex (Figure 2) (male and female) and area of residence (Figure 3) (rural/urban) were ranked by socioeconomic quintile. Concentration curves for female lay above the 45° line (the line of equality), indicating that the utilization of outpatient care was more concentrated among the poor females. However the curve for males in both areas of residence lay below the line of equity, indicating that the utilization of outpatient care was more concentrated among the rich male, rural and urban residents.
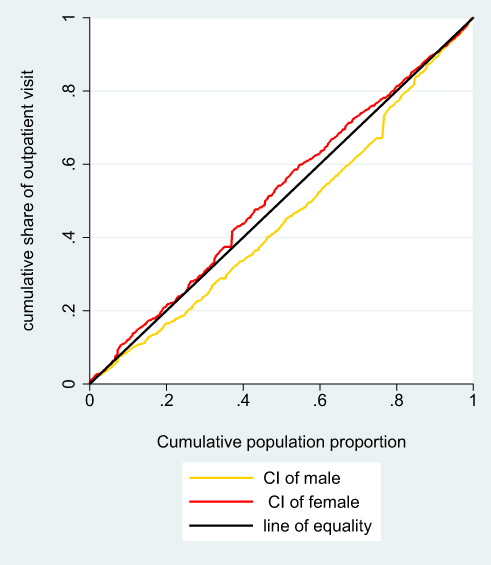 |
Figure 2 Concentration curve of outpatient care utilization by sex in Ethiopia, 2015/16. |
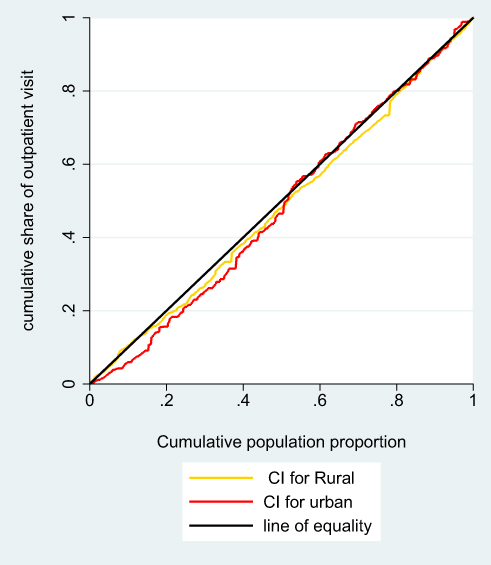 |
Figure 3 Concentration curve of outpatient care utilization by place of residence in Ethiopia, 2015/16. |
Decomposition of Concentration Index
The positive (negative) contribution indicates that the determinant increases (decreases) the total inequality in outpatient care utilization, with positive (negative) percentages referring to increases (decreases) in percentages. Decomposition of the concentration index for each need and non-need factor's contribution to the inequality in outpatient care utilization is shown in Table 3.
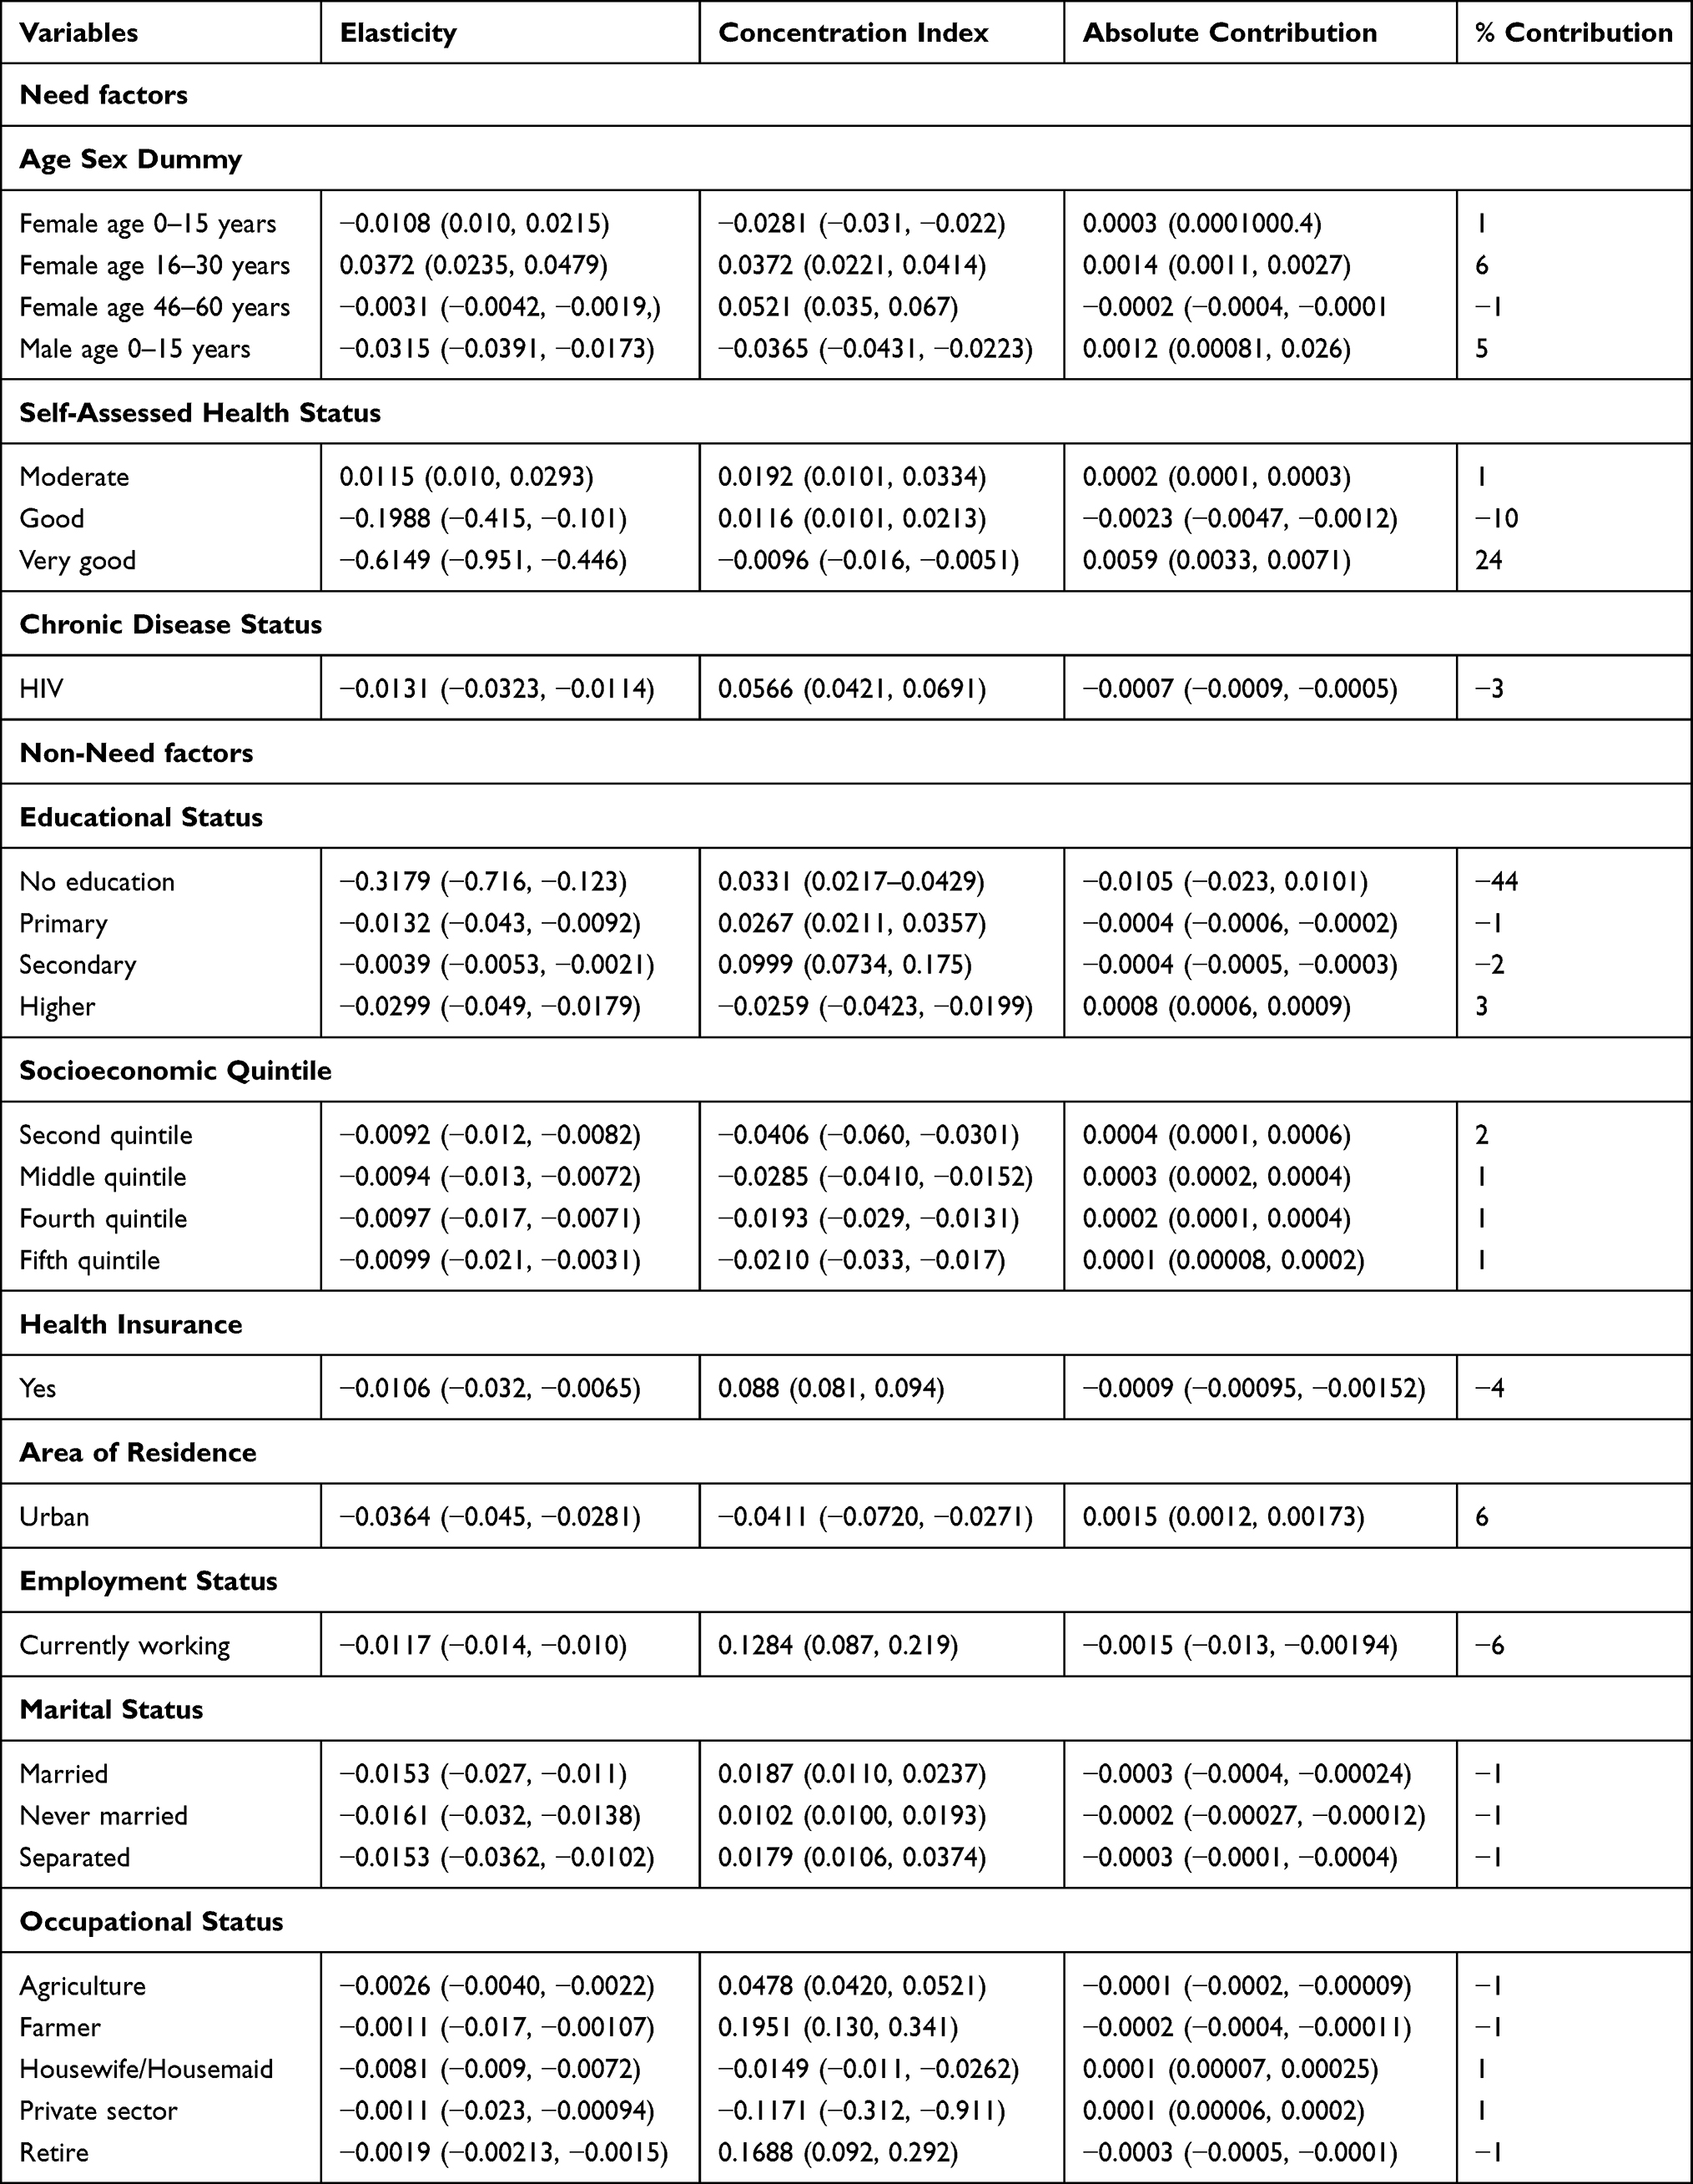 |
Table 3 Decomposition Analysis of Inequality and Inequity in Outpatient Care Utilization in Ethiopia, 2015/16 |
A perceived self-assessed health status response of “Very good” showed a 24% increase in the pro-poor (C = −0.0096, 95% CI; −0.016, −0.0051) contribution to the inequality; on the other hand, “Good” showed a −10% (decrease) in the pro-rich (C =0.0116, 95% CI; 0.0101, 0.0213) contribution to the inequality in outpatient care utilization from need factors. Females aged 16–30 years old showed a 6% increase in the pro-rich (C = 0.0372, 95% CI; 0.0221, 0.0414) contribution. Having no education shows a −44% decrease in pro-rich utilization (C =0.0331, 95% CI; 0.0217, 0.0429) and, currently, working group employment status decreases the pro-rich (C = 0.1284, 95% CI; 0.085–0.291) contribution by −6%.
Generally, inequality due to need factors was (C = 0.006, p<0.001), which increases the pro-rich utilization by 23.6%. Inequality due to non-need factors was (C = −0.012, p<0.001), which decreases pro-poor utilization by 48.4%. Additionally, inequality related to age/sex was (C = 0.003, p<0.001), which increases pro-rich utilization by 11.8%. Self-assessed health was pro-rich (C = 0.004, p<0.001), which increases utilization by 15.4%. Further, the chronic disease contribution was pro-poor (CI= −0.001, p<0.001), which decreases utilization by −3.6% for outpatient care utilization.
Horizontal Inequity for Outpatient Care Utilization
A positive concentration index for actual outpatient use was (C = 0.0335, 95% CI; 0.0298, 0.0431), which means that a pro-rich utilization and an estimate for total socioeconomic status related to inequality in utilization. On the other hand, a positive need-predicted concentration index (C = 0.0157, 95% CI; 0.0117, 0.0413), which indicates a pro-rich utilization and an estimate for fair inequality, were derived by need factors for utilization. Horizontal inequity, the difference between actual and need-adjusted utilization depicts a pro-rich inequity (HI = 0.018, 95% CI; 0.012, 0.022), which indicates the better-off had more outpatient care utilization than the worse-off (Table 4).
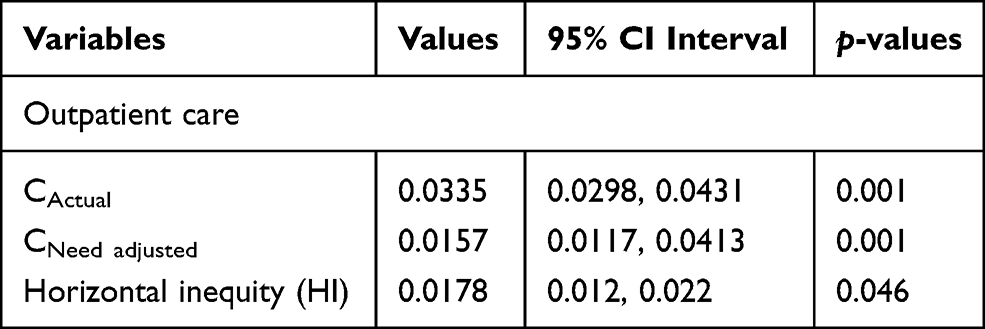 |
Table 4 Horizontal Inequity Index (HI) for Inequity in Outpatient Care Utilization in Ethiopia, 2015/16 |
Discussion
This study compares the distribution difference in direction and magnitude of inequality and inequity of outpatient care utilization by expenditure quintile and contributing factors in Ethiopia. The distributions of actual outpatient care utilization over socioeconomic quintile were highest for the middle and above quintiles in both need-predicted and need-standardized utilization after standardization for need.
The actual outpatient care utilizations were lowest in the poorest quintile and highest in the richest quintile. This finding is consistent with a study conducted in Afghanistan.26 The findings from Brazil and Zambia also show the pro-rich utilization of care.27–29
The age, sex and health status variables (self-assessed health status and chronic disease status) are considered as proxies for need and indirectly standardized for outpatient care utilization. This need-predicted outpatient care utilization was lowest in poorest quintiles and highest in richest quintiles. This finding is in agreement with evidences from China: highest in richest quintiles, lowest in second-poorest quintiles.30
Furthermore, concentration indices of both actual (total socioeconomic-related inequality) and need-predicted (fair inequality) utilizations are positive and pro-rich. This finding is in line with a study in China,30 which indicated that the better-off utilize more outpatient care than the worse-off. However, this study's results demonstrated that outpatient care utilization was concentrated among the rich even after need standardization, and the degree of inequity was relatively small. These results differ from findings in Ireland, South Korea, and Iran, where actual and need-standardized outpatient care utilization were pro-poor.15,31,32 These discrepancies may be due to differences in achievement level of universal health coverage of countries.
The decomposition of the concentration index shows need factors clearly made a significant positive contribution to the concentration index for outpatient care utilization. This means that need factors made utilization of outpatient care more frequent among richer individuals; among need factors self-assessed health was the most positive pro-rich contributor. In contrast, chronic disease status was a negative pro-poor contributor. This is in agreement with findings from South Africa.33
On the other hand, non-need factors made a considerable negative contribution (−48%) to inequality in outpatient care utilization. This means that non-need factors made utilization of outpatient care less frequent among poor individuals and this unfair difference mostly related to educational status of the individual. This finding is in line with a study conducted in Brazil, that the non-need factors after controlling for need factors contributed to the pro-rich inequities in outpatient care utilization.13
Inequity in outpatient care utilization was measured based on the principle of equal need for equal treatment indicated by the horizontal inequity index. After controlling for the need factors the outpatient utilization was found to be pro-rich distribution, which means regardless of their need the socioeconomically advantaged groups utilize more outpatient care. This finding shows similarities with studies in China30,34 and Afghanistan10 showing that the socioeconomically advantaged group utilize more outpatient care than the disadvantaged group. This is a common phenomenon in low and middle income countries where universal health coverage is not achieved. Subsidized healthcare, high insurance coverage and low cost of healthcare are important means to achieve equitable access to outpatient care for all.35,36
Strengths and Limitations of the Study
The study utilized a nationally representative sample to estimate socioeconomic-related inequity in healthcare utilization and used standard equity measurement tools. Factors contributing to inequity in outpatient care utilization were identified by decomposition analysis.
Finally, the limitation of this study was all information about healthcare utilization and living standard was self-reported, which may have led to recall bias. Despite these limitations, this study has important policy implications for Ethiopia for reducing socioeconomic disparities in healthcare utilization.
Conclusions
This study revealed the existence of both inequality and inequity in outpatient care utilization among different SES groups. Need factors made utilization of outpatient care more frequent among rich individuals, while non-need factors made utilization of outpatient care less frequent among poor individuals.
To avoid the disparity and unfairness in outpatient care utilization the government body concerned should reconsider implementation strategies and refocus on policy prioritizations to provide gender-sensitive services and commit to strengthening the implementation of health insurance schemes for disadvantaged groups. The concentration of outpatient care services among the higher SES groups in Ethiopia has valuable health policy implications for considering other healthcare costs like transportation costs, food and other indirect medical and nonmedical costs that are challenging for lower SES groups.
Data Sharing Statement
Data that support the findings are available from the correspondence author on reasonable request.
Acknowledgments
The authors would like to thank Haramaya University College of Health and Medical Sciences for providing the opportunity to conduct this study and for intellectual and technical support throughout. We would like to acknowledge the Ethiopian Federal Ministry of Health, Cooperative and Partnership Directorate for allowing us to use the NHA dataset. We are also grateful to study participants, data collectors and supervisors who were involved in the survey.
Author Contributions
All authors contributed to conception and design of the study, acquisition of data, data analysis and interpretation, drafting and revising the manuscript, agreed on the journal to which the article would be submitted, gave their final approval for submission and the version to be published, and agreed to be accountable for all aspects of the work.
Funding
No external funding was received.
Disclosure
The authors declared that they have no conflicts of interest for this work.
References
1. Daniels N. Equity of access to health care: some conceptual and ethical issues. Milbank Mem Fund Q Health Soc. 1982;60(1):51–81. doi:10.2307/3349700
2. Fleurbaey M, Schokkaert E. Unfair inequalities in health and health care. J Health Econ. 2009;28(1):73–90. doi:10.1016/j.jhealeco.2008.07.016
3. FDRE MoH. Health Sector Transformation Plan. Addis Ababa, Ethiopia;2015:184
4. Viacava F, Porto SM, Carvalho CDC, Bellido JG, Bellido JG. Health inequalities by region and social group based on data from household surveys (Brazil, 1998–2013). Cien Saude Colet. 2019;24(7):2745–2760. doi:10.1590/1413-81232018247.15812017
5. Braveman P. Health disparities and health equity: concepts and measurement. Annu Rev Public Health. 2006;27(1):167–194. doi:10.1146/annurev.publhealth.27.021405.102103
6. Whitehead M. The concepts and principles of equity and health. Health Promot Int. 1991;6(3):217–228. doi:10.1093/heapro/6.3.217
7. Murray CJL, Gakidou EE, Frenk J. Health inequalities and social group differences: what should we measure? Bull World Health Organ. 1999;77:7.
8. Dorjdagva J, Batbaatar E, Dorjsuren B, Kauhanen J. Income-related inequalities in health care utilization in Mongolia, 2007/2008–2012. Int J Equity Health. 2015;14(1):57. doi:10.1186/s12939-015-0185-8
9. Kim D, Kang A, Chae H. Equity in Health and Health Care Utilization of the Elderly in Korea: is the income-related inequality more pronounced in the elderly population? 2014.
10. Zeng W, Kim C, Mir Ahad Saeed K, Shah Salehi A. An equity analysis of utilization of health services in Afghanistan using a national household survey. BMC Public Health. 2016.
11. Frenz P, Vega J, Universal health coverage with equity: what we know, don’t know and need to know.
12. Pandey A, Ploubidis GB, Clarke L, Dandona L. Horizontal inequity in outpatient care use and untreated morbidity: evidence from nationwide surveys in India between 1995 and 2014. Health Policy Plan. 2017;32(7):969–979. doi:10.1093/heapol/czx016
13. Szwarcwald CL, Souza-Júnior PR, Damacena GN. Socioeconomic inequalities in the use of outpatient services in Brazil according to health care need: evidence from the World Health Survey. BMC Health Serv Res. 2010;10(1):217. doi:10.1186/1472-6963-10-217
14. Gustafsson P, Nyamande F, Mosquera P, Sebastián M. Intersectional equity in health care: assessing complex inequalities in primary and secondary care utilization by gender and education in Northern Sweden. 2020.
15. Rezaeian S, Hajizadeh M, Rezaei S, Ahmadi S, Kazemi Karyani A, Salimi Y. Measuring and Explaining Socioeconomic Inequalities in Public Healthcare Utilization in Western Iran: evidence from a Cross-sectional Survey. J Res Health Sci. 2018;18:2.
16. Rezaei S, Hajizadeh M, Irandoost SF, Salimi Y. Socioeconomic inequality in dental care utilization in Iran: a decomposition approach. Int J Equity Health. 2019;18(1):161. doi:10.1186/s12939-019-1072-5
17. Saito E, Gilmour S, Yoneoka D, et al. Inequality and inequity in healthcare utilization in urban Nepal: a cross-sectional observational study. Health Policy Plan. 2016;31(7):817–824. doi:10.1093/heapol/czv137
18. Zhu D, Guo N, Wang J, Nicholas S, Chen L. Socioeconomic inequalities of outpatient and inpatient service utilization in China: personal and regional perspectives. Int J Equity Health. 2017;16(1):210. doi:10.1186/s12939-017-0706-8
19. Bobo FT, Yesuf EA, Woldie M. Inequities in utilization of reproductive and maternal health services in Ethiopia. Int J Equity Health. 2017;16(1):105. doi:10.1186/s12939-017-0602-2
20. Ayalneh AA, Fetene DM, Lee TJ. Inequalities in health care utilization for common childhood illnesses in Ethiopia: evidence from the 2011 Ethiopian Demographic and Health Survey. Int J Equity Health. 2017;16(1):1. doi:10.1186/s12939-017-0561-7
21. Harris B, Goudge J, Ataguba JE, et al. Inequities in access to health care in South Africa. J Public Health Policy. 2011;32(1):S102–S23. doi:10.1057/jphp.2011.35
22. Agency CS, ICF. Ethiopia Demographic and Health Survey 2016. Addis Ababa, Ethiopia, and Rockville, Maryland, USA: CSA and ICF; 2016.
23. World Health Organization. Health Systems in Sub-Saharan Africa: What is Their Status and Role in Meeting the Health Millennium Development Goals? World Health Organization Regional Office for Africa; 2007.
24. FMoH. Sustaining and Accelerating Primary Health Care in Ethiopia; 2019.
25. Wagstaff A, Van Doorslaer E. Measuring and testing for inequity in the delivery of health care. J Human Resources. 2000;35(4):716–733. doi:10.2307/146369
26. Trani J-F, Barbou-des-Courieres C. Measuring equity in disability and healthcare utilization in Afghanistan. Med Confl Surviv. 2012;28(3):219–246. doi:10.1080/13623699.2012.714651
27. Macinko J, Lima-Costa MF. Horizontal equity in health care utilization in Brazil, 1998–2008. Int J Equity Health. 2012;11(1):33. doi:10.1186/1475-9276-11-33
28. Bonfrer I, Van de Poel E, Grimm M, van Doorslaer E. Does health care utilization match needs in Africa? Challenging conventional needs measurement. PLoS One. 2012;7(3). doi:10.1371/journal.pone.0032638
29. Phiri J, Ataguba JE. Inequalities in public health care delivery in Zambia. Int J Equity Health. 2014;13(1):24. doi:10.1186/1475-9276-13-24
30. Zhang X, Wu Q, Shao Y, Fu W, Liu G, Coyte PC. Socioeconomic inequities in health care utilization in China. Asia Pacific J Public Health. 2015;27(4):429–438. doi:10.1177/1010539514565446
31. Layte R, Nolan B. Equity in the utilisation of health care in Ireland. Economic Soc Rev. 2004;35(2):111–134.
32. Rho Y. Socioeconomic Equity in Health Care Utilization in South Korea. University of York; 2013.
33. Zere E, McIntyre D. Equity in self-reported adult illness and use of health service in South Africa: inter-temporal comparison. J Health Popul Nutr. 2003;205–215.
34. Li C, Dou L, Wang H, Jing S, Yin A. Horizontal inequity in health care utilization among the middle-aged and elderly in China. Int J Environ Res Public Health. 2017;14(8):842. doi:10.3390/ijerph14080842
35. Hidayat B, Thabrany H, Dong H, Sauerborn R. The effects of mandatory health insurance on equity in access to outpatient care in Indonesia. Health Policy Plan. 2004;19(5):322–335. doi:10.1093/heapol/czh037
36. Kavoosi Z, Ba M, Dv R, Hatam N, Jafari A, Firuzjahantighi A. Horizontal inequity in access to outpatient services among Shiraz City residents, Iran. 2015.
 © 2021 The Author(s). This work is published and licensed by Dove Medical Press Limited. The full terms of this license are available at https://www.dovepress.com/terms.php and incorporate the Creative Commons Attribution - Non Commercial (unported, v3.0) License.
By accessing the work you hereby accept the Terms. Non-commercial uses of the work are permitted without any further permission from Dove Medical Press Limited, provided the work is properly attributed. For permission for commercial use of this work, please see paragraphs 4.2 and 5 of our Terms.
© 2021 The Author(s). This work is published and licensed by Dove Medical Press Limited. The full terms of this license are available at https://www.dovepress.com/terms.php and incorporate the Creative Commons Attribution - Non Commercial (unported, v3.0) License.
By accessing the work you hereby accept the Terms. Non-commercial uses of the work are permitted without any further permission from Dove Medical Press Limited, provided the work is properly attributed. For permission for commercial use of this work, please see paragraphs 4.2 and 5 of our Terms.