")
Back to Journals » International Journal of Nanomedicine » Volume 12
Induction of mitophagy-mediated antitumor activity with folate-appended methyl-β-cyclodextrin
Authors Kameyama K, Motoyama K, Tanaka N, Yamashita Y, Higashi T, Arima H
Received 30 January 2017
Accepted for publication 23 February 2017
Published 28 April 2017 Volume 2017:12 Pages 3433—3446
DOI https://doi.org/10.2147/IJN.S133482
Checked for plagiarism Yes
Review by Single anonymous peer review
Peer reviewer comments 2
Editor who approved publication: Dr Thomas Webster
Kazuhisa Kameyama,1,* Keiichi Motoyama,1,* Nao Tanaka,1 Yuki Yamashita,1 Taishi Higashi,1 Hidetoshi Arima1,2,*
1Department of Physical Pharmaceutics, Graduate School of Pharmaceutical Sciences, 2Program for Leading Graduate Schools “HIGO (Health Life Science: Interdisciplinary and Glocal Oriented) Program,” Kumamoto University, Kumamoto, Japan
*These authors contributed equally to this work
Abstract: Mitophagy is the specific autophagic elimination system of mitochondria, which regulates cellular survival via the removal of damaged mitochondria. Recently, we revealed that folate-appended methyl-β-cyclodextrin (FA-M-β-CyD) provides selective antitumor activity in folate receptor-α (FR-α)-expressing cells by the induction of autophagy. In this study, to gain insight into the detailed mechanism of this antitumor activity, we focused on the induction of mitophagy by the treatment of FR-α-expressing tumor cells with FA-M-β-CyD. In contrast to methyl-β-cyclodextrin, FA-M-β-CyD entered KB cells, human epithelial cells from a fatal cervical carcinoma (FR-α (+)) through FR-α-mediated endocytosis. The transmembrane potential of isolated mitochondria after treatment with FA-M-β-CyD was significantly elevated. In addition, FA-M-β-CyD lowered adenosine triphosphate (ATP) production and promoted reactive oxygen species production in KB cells (FR-α (+)). Importantly, FA-M-β-CyD enhanced light chain 3 (LC3) conversion (LC3-I to LC3-II) in KB cells (FR-α (+)) and induced PTEN-induced putative kinase 1 (PINK1) protein expression, which is involved in the induction of mitophagy. Furthermore, FA-M-β-CyD had potent antitumor activity in BALB/c nu/nu mice xenografted with KB cells (FR-α (+)) without any significant side effects. Taken together, these findings demonstrate that the autophagic cell death elicited by FA-M-β-CyD could be associated with mitophagy induced by an impaired mitochondrial function.
Keywords: mitophagy, autophagy, folate receptor, methyl-β-cyclodextrin, tumor targeting
Introduction
Autophagy is a crucial system for the degradation and recycling of unnecessary or dysfunctional components in cells.1–3 The autophagic process involves the sequestration of cytoplasmic components by lipid bilayer phagophores to form autophagosomes that then fuse with lysosomes to degrade their cargo.1 Generally, autophagy is caused by various stresses to maintain metabolic homeostasis and for the clearance of dysfunctional cellular components.3 Dysregulation of autophagy develops in various diseases, especially neurodegenerative disease and cancer.2,4,5 However, whether autophagy is protective or deleterious in cancer development has been widely debated.6 Some clinical trials and nonclinical in vivo studies indicate that a lack of autophagy predisposes the tissues to develop tumors, possibly because autophagy normally moderates oxidative stress and DNA damage by removing defective mitochondria. However, in some mouse model studies, autophagy plays a crucial role in the growth of the tumors.7,8 Consequently, there are ongoing clinical trials to evaluate the combination of autophagy inhibitors with chemotherapeutics.9,10
Mitophagy is the specific autophagic elimination of mitochondria, which regulates the number of mitochondria and maintains quality control of this important organelle.9 Mitophagy contributes to cellular survival via the removal of damaged mitochondria, thus, eliminating the source of apoptogenic signals and excessive reactive oxygen species (ROS). Mitophagy is found to be regulated by several pathways in mammalian cells, including BNIP3L, ULK1, ATG7, PTEN-induced putative kinase 1 (PINK1), and Parkin.11 Recently, Villanueva-Paz et al revealed that the activation of mitophagy by impairment of mitochondrial complex III activity induces cell death in hepatocellular carcinoma.12 Qiao et al revealed that Sirt3 activates mitophagy in hypoxic tumor cells.13 Therefore, the regulation of mitophagy in tumor tissue is a candidate for clinical treatment of cancer.
Previously, we developed the folic acid (FA)-conjugated methyl-β-cyclodextrin (FA-M-β-CyD), which is selective for folate receptor-α (FR-α)-expressing tumor cells.14–16 FA-M-β-CyD entered KB cells (FR-α (+)) through the clathrin-independent carriers/glycosylphosphatidylinositol-enriched endocytic compartments (CLIC/GEEC).16 Notably, FA-M-β-CyD did not induce depression in DNA content and drastically elevated the transmembrane potential of mitochondria in KB cells (FR-α (+)). In addition, FA-M-β-CyD elicited the formation of autophagic vacuoles.16 Taken together, these results indicate that FR-α-expressing cell-selective cytotoxic activity of FA-M-β-CyD could be mediated by the regulation of autophagy, rather than the induction of apoptosis. However, the mechanism of autophagy induction by FA-M-β-CyD remains unclear. We hypothesized that FA-M-β-CyD may have the potential to dysregulate mitochondrial functions. In this study, we focused on mitophagy after treatment with FA-M-β-CyD in FR-α-expressing tumor cells. As a result, FA-M-β-CyD impaired mitochondrial function and induced mitophagy in FR-α-expressing tumor cells. Furthermore, a single, intravenous dose of FA-M-β-CyD strikingly inhibited the tumor growth in mice xenografted with FR-α-expressing tumor cells. Collectively, FA-M-β-CyD has the potential to be a novel anticancer agent through the induction of mitophagy in FR-α-expressing tumor cells.
Materials and methods
Materials
Roswell Park Memorial Institute (RPMI)-1640 (FA-free; GIBCO, Tokyo, Japan) was used. Tetramethylrhodamine isothiocyanate (TRITC) was purchased from Funakoshi (Tokyo, Japan). Anti-folate binding protein (FBP) antibody (anti-FBP Biotin Milk, 200-106-148S) was purchased from Rockland (Gilbertsville, PA, USA). Cyto-ID® Autophagy Detection Kit (Enzo Life Sciences, NY, USA) was used. MitoTracker® Green was obtained from Invitrogen (Tokyo, Japan).
Preparation of TRITC-labeled FA-M-β-CyD
Briefly, 10 mg of FA-M-β-CyD and 1 mg of TRITC were dissolved in 400 μL of dimethyl sulfoxide (DMSO). After stirring for 24 h, the solution was gradually poured into acetone. The precipitant was obtained and dissolved with water. After freeze-drying, TRITC-FA-M-β-CyD was obtained.
Cell culture and in vitro antitumor activity
KB cells, a subline of the HeLa cells, were obtained from JCRB Cell Bank (Osaka, Japan). The identity of the cell line was performed by short tandem repeat profiling by the source. Upon receiving, the cells were expanded and subsequently stored in liquid nitrogen. The original vials were thawed for experiments and have only been passaged for up to 2 months. Cell lines were verified to be mycoplasma negative. KB cells were maintained as reported previously.14 Spheroids of KB cells were prepared using Cultrex® three-dimensional (3D) Spheroid Cell Invasion Assay (Trevigen Inc., MD, USA). Briefly, KB cells (3×10³ cells) were maintained with 10× spheroid formation extracellular matrix (ECM) at 37°C for 72 h. KB cells were treated with 5 mM M-β-CyDs for 24 h. After washing once with medium, 10 μL of 3-(4,5-dimethylthiazol-2-yl)-2,5-diphenyltetrazolium bromide (MTT) reagent and 100 μL of detergent reagent were added to plates and incubated for 24 h at 37°C. Then, the supernatant was transferred into a 96-well assay plate. The absorbance at 570 nm against a reference wavelength of 690 nm was measured by a microplate reader (Bio-Rad Model 550; Bio-Rad Laboratories, Inc, Tokyo, Japan).
Colocalization of FA-M-β-CyD with mitochondria in KB cells
KB cells (1×10⁶) were treated with 10 μM TRITC-FA-M-β-CyD at 37°C for 2 h, and then the cells were treated with MitoTracker. After washing once with medium, the cells were scanned with a confocal laser scanning microscope.
Transmembrane potential of isolated mitochondria from KB cells
Functional mitochondria were isolated from KB cells as described by Frezza et al.17 The isolated mitochondria were treated with mitochondrial membrane potential (MMP) assay buffer (MMP Activity Assay Kit [ab112147]; Abcam, Tokyo, Japan) containing 50 μM M-β-CyDs for 1 h with or without 500 μM FA, a competitor for the mitochondrial folate transporter (MFT). The isolated mitochondria were stained with rhodamine 123 and its fluorescence determined, as a readout for the transmembrane potential using a fluorescence microplate reader (Infinite M1000; Tecan Group Ltd.; Männedorf, Switzerland).
Intracellular adenosine triphosphate (ATP) quantification
Intracellular ATP levels were quantified using the IntraCellular ATP assay kit (Cosmo Bio, Tokyo, Japan) following the manufacturer’s instructions. Briefly, KB cells or A549 cells (2×10⁴/well) were cultured in 96-well culture plates. After washing with RPMI medium, the cells were incubated with 5 mM M-β-CyDs at 37°C for 2 h. Then, 100 μL of ATP determination reagent was added and further incubated for 10 min. The fluorescence derived from ATP production was quantified using a fluorescent microplate reader (Infinite M1000; Tecan, Australia).
ROS generation assay
Intracellular ROS generation was detected using ROS-ID®, a total ROS detection kit (Enzo Life Sciences). Briefly, KB cells, FR-α knockdown KB cells, or A549 cells (2×10⁵) were incubated with 5 mM M-β-CyDs at 37°C for 2 h. Then, 1 mL of total ROS detection reagent in medium was added. The fluorescence images were obtained by a microscope (Biozero BZ-8000; Keyence, Osaka, Japan). The fluorescence intensities were determined in 10 randomly selected cells per image using a BZ-II analyzer equipped with the fluorescence microscope.
Autophagosome formation
Briefly, KB cells (5×10⁵) were treated with 5 mM FA-M-β-CyD for 2 h with or without pretreatment with 100 μM N-acetyl-L-cysteine (NAC), a ROS inhibitor. Then, the cells were analyzed with Cyto-ID Autophagy Detection Kit. The fluorescence images were obtained by a microscope (Biozero BZ-8000; Keyence). The relative fluorescence intensities were determined in 10 randomly selected cells per image using a BZ-II analyzer equipped with the fluorescence microscope.
Western blotting
In brief, KB cells (1×10⁶) were treated with RPMI-1640 medium (FA-free) containing 5 mM M-β-CyD or FA-M-β-CyD for 2 h. KB cells were homogenized in 4× sample buffer (8% sodium dodecyl sulfate, 40% glycerol, and 24% β-mercaptoethanol in Tris–HCl buffer, pH 6.8) and boiled for 5 min. The protein concentration was detected, with bovine serum albumin as standard, using the bicinchoninic acid reagent from Pierce Chemical (Rockford, IL, USA). Equal amounts of protein from each sample were separated using 12% sodium dodecyl sulfate-polyacrylamide gel electrophoresis and transferred to Immobilon P membranes using the wet electrical transfer method. After blocking with 5% skim milk (Sigma, Tokyo, Japan) in 1× Tris-buffered saline (TBST) for 1 h, the primary antibodies (polyclonal rabbit anti-human LC3B 1:1,000, polyclonal rabbit anti-human Beclin-1 1:1,000, polyclonal rabbit anti-human PINK1 1:1,000, and β-actin 1:1,000; Abcam) were incubated overnight at 4°C, and then treated with secondary antibodies (anti-rabbit IgG-conjugated horseradish peroxidase 1:1,000; Abcam) for 1 h at 25°C. The bands detected by enhanced chemiluminescence Western blotting kit (Amersham Bioscience, Tokyo, Japan) and observed using the LAS-1000 plus Lumino-image analyzer (Fujifilm, Tokyo, Japan). The protein levels were quantified using ImageJ software.
Determination of mitochondrial DNA (mtDNA) content
Total DNA extraction from KB cells was performed using the phenol/chloroform extraction method. After quantification of DNA content using Epoch microplate photometer (BioTek Instruments, Winooski, VT, USA), the mtDNA content was measured using real-time polymerase chain reaction (PCR) using Human mtDNA Monitoring Primer Set® (TaKaRa Bio, Tokyo, Japan) following the manufacturer’s instructions. The Human mtDNA Monitoring Primer Set is designed to quantify the relative number of copies of human mtDNA using nuclear DNA (nDNA) content as a standard using real-time PCR (Bio-Rad CFX Connect™, Tokyo, Japan).
Detection of mitophagy
Mitophagy in KB cells was detected using the Mitophagy detection kit® (Dojindo Molecular Technologies, Kumamoto, Japan) containing Mtphagy Dye® and Lyso Dye®. Briefly, KB cells (5×10⁵/35 mm glass bottom dish) were treated with 100 nM Mtphagy Dye for 15 min. After washing with the medium, the cells were treated with 5 mM M-β-CyDs for 2 h. After washing with the medium, 1 μM Lyso Dye was added and further incubated for 10 min. After washing with Hanks’ balanced salt solution, the cells were scanned with Biozero BZ-8000, a fluorescence microscope (Keyence).
In vivo antitumor activity
KB cell suspension (1×10⁶ cells/100 μL) was subcutaneously xenografted to BALB/c nu/nu mice (male, 4 weeks old, and ca. 20 g, Japan SLC, Shizuoka, Japan). After 14 days, 20 mg/kg of M-β-CyDs in mannitol solution (5%) were administered via a single intravenous injection to KB cell-xenografted mice. The tumor volumes were determined as reported previously.15 The tumor volume and body weight changes of the tumor-bearing mice were monitored for 42 days. A total of 30 male BALB/c nu/nu mice were used in this study. The animals were treated with one of the following procedures: 5% mannitol group (n=5), M-β-CyD group (20 mg/kg, n=5), FA-M-β-CyD group (1, 5, 10, and 20 mg/kg, n=5 for each group). All animal experiments above were approved by the Ethics Committee for Animal Care and Use of Kumamoto University (Approval ID: 24–286) and were carried out in accordance with the Animal Care Guidelines approved by the ethical committee.
Blood chemistry values
After 24 h of intravenous injection of M-β-CyDs (20 mg/kg) in mannitol solution (5%) to KB cells-xenografted mice, the blood was collected. The blood chemistry data of lactate dehydrogenase (LDH), aspartate aminotransferase (AST), alanine aminotransferase (ALT), creatinine (CRE), and blood urea nitrogen (BUN) in serum were analyzed using JCA-BM2250, a clinical chemistry analyzer (JEOL, Tokyo, Japan).
Statistics
All experiments were performed at least three times for statistical significance. The data are expressed as the mean ± standard error of the mean. Statistical analysis was performed using the Scheffe’s test. A value of P<0.05 was considered to indicate a statistically significant difference.
Results
Cytotoxicity of FA-M-β-CyD in the spheroids of KB cells
The 3D structures of spheroid cell cultures develop multiple cell-to-cell contacts and many other characteristics of in vivo tumor tissues. Therefore, the spheroids can be used to closely mimic a solid in vivo tumor.18,19 We established spheroids of KB cells (FR-α (+)) and evaluated the in vitro cytotoxic activity of FA-M-β-CyD by MTT assay (Figure 1). From macroscopic observation, the spheroids of KB cells (FR-α (+)) treated with FA-M-β-CyD but not with methyl-β-cyclodextrin (M-β-CyD) for 24 h were partially fragmented at the surface (Figure 1A). Meanwhile, the spheroids of KB cells (FR-α (+)) treated with FA-M-β-CyD in the presence of 1 mM FA, as a competitor of FR-α, maintained their spherical shape and size, compared to the control (Figure 1A). In addition, the MTT assay revealed the potent cytotoxicity of FA-M-β-CyD in the spheroids of KB cells (FR-α (+)) (Figure 1B). On the contrary, M-β-CyD had no effect on cell viability of the spheroids. In addition, the cytotoxic activity of FA-M-β-CyD was significantly inhibited by the presence of FA. These results indicate the FR-α-mediated cytotoxicity of FA-M-β-CyD in the spheroids of KB cells.
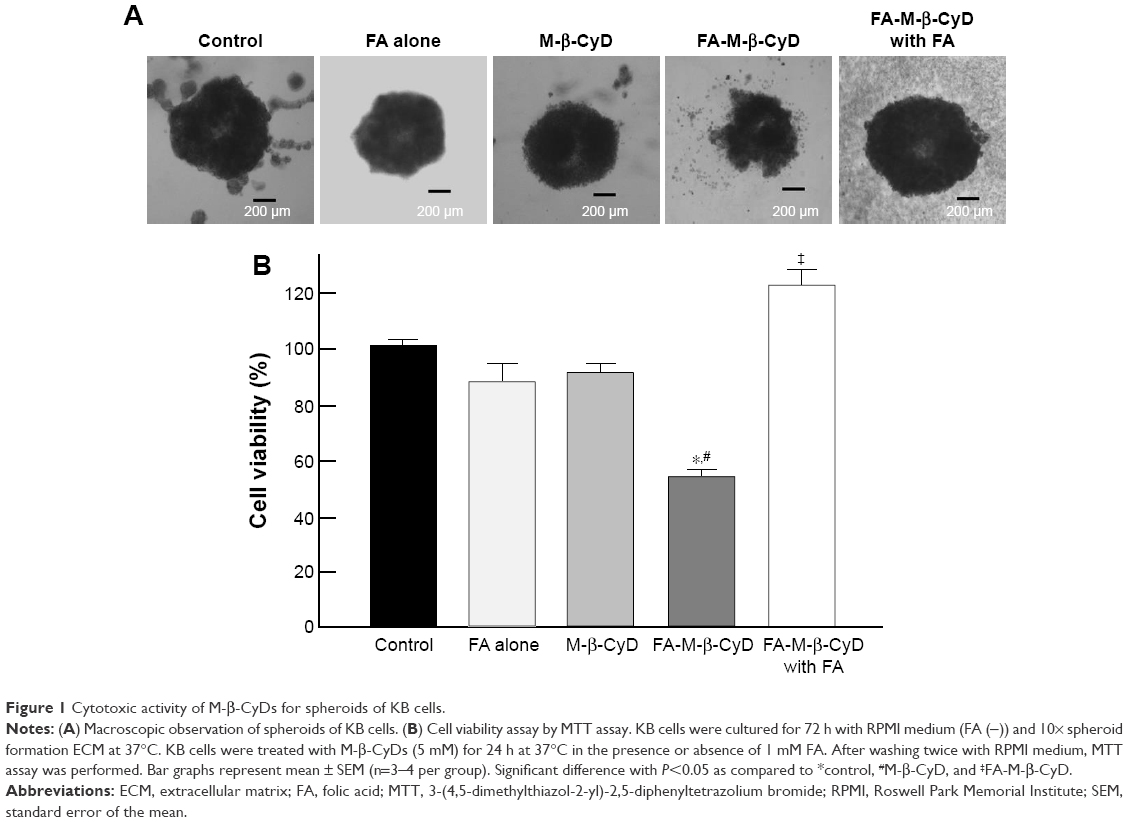 | Figure 1 Cytotoxic activity of M-β-CyDs for spheroids of KB cells. |
Impairment of mitochondrial function by FA-M-β-CyD
Mitochondria have a crucial role in cellular energy generation, metabolic integration, and initiation of cell death. Therefore, we next investigated whether FA-M-β-CyD localized to the mitochondria after FR-α-mediated endocytosis in KB cells. Here, mitochondria were stained by MitoTracker. As shown in Figure 2A, TRITC-FA-M-β-CyD existed in cytoplasm and the edge of nucleus, and it was partially colocalized with mitochondria in cytoplasm of KB cells (FR-α (+)). Meanwhile, TRITC-M-β-CyD could not enter the cells, probably due to a lack of FA. These findings indicate that FA-M-β-CyD colocalized with mitochondria in KB cells after FR-α-mediated endocytosis.
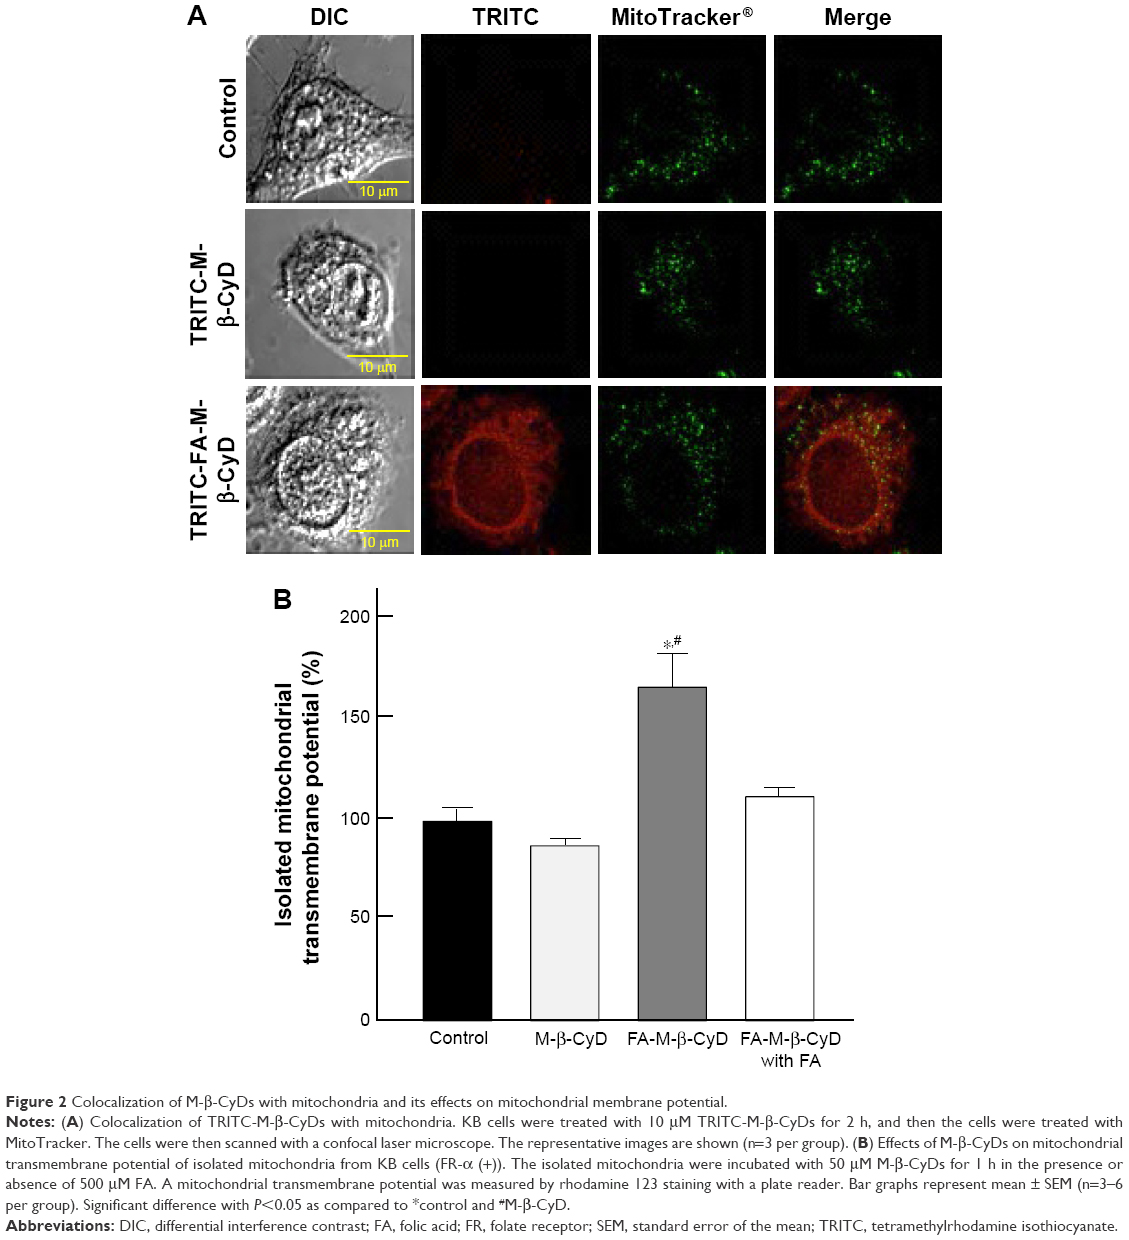 | Figure 2 Colocalization of M-β-CyDs with mitochondria and its effects on mitochondrial membrane potential. |
The mitochondrial transmembrane potential is a key indicator of cell health or injury. Rhodamine 123 is commonly used for measuring the mitochondrial transmembrane potential to assess mitochondrial function, particularly in the context of cell fate determination. We next examined the effects of FA-M-β-CyD on mitochondrial transmembrane potential of isolated mitochondria using rhodamine 123 (Figure 2B). The transmembrane potential of the isolated mitochondria treated with M-β-CyD did not change much, compared to the control. On the contrary, FA-M-β-CyD drastically elevated the transmembrane potential. Recently, it has been reported that mitochondria possess a MFT on their membrane for uptake of FA, as a cofactor for mitochondrial glycine synthesis.20 Notably, the increment of transmembrane potential by the addition of FA-M-β-CyD in isolated mitochondria decreased to the control level in the presence of FA, a competitor for MFT (Figure 2B). These findings suggest that FA-M-β-CyD upregulated mitochondrial transmembrane potential in KB cells via MFT.
As the energy power plants of cells, the mitochondria generate ATP. Next, we examined the effect of FA-M-β-CyD on ATP production in KB cells (Figure 3). FA-M-β-CyD significantly suppressed ATP production in KB cells (FR-α (+)), compared to the control and M-β-CyD (Figure 3A). Meanwhile, there was no significant change in ATP production in A549 cells (FR-α (+)) after treatment with FA-M-β-CyD (Figure 3B). These results suggest that FA-M-β-CyD inhibited ATP production in FR-α-expressing cancer cells but not in FR-α-negative cancer cells.
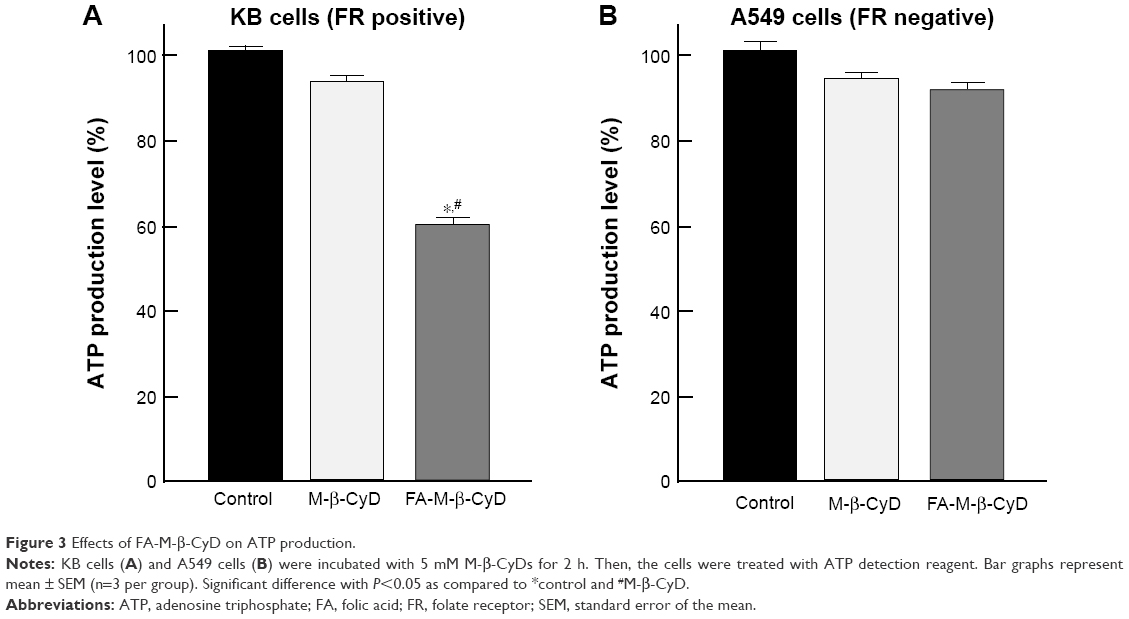 | Figure 3 Effects of FA-M-β-CyD on ATP production. |
Mitochondria are a major source for ROS production in cells. Recently, it has been reported that ROS elicit autophagy,21,22 and that autophagy, in turn, serves to reduce oxidative damage.23–25 Therefore, the effects of FA-M-β-CyD on ROS production in KB cells (FR-α (+)) were examined (Figure 4). As shown in Figure 4A and B, FA-M-β-CyD, but not M-β-CyD, significantly enhanced ROS production in KB cells (FR-α (+)). Meanwhile, the ROS production ability of FA-M-β-CyD was drastically diminished in FR-α-knockdown KB cells (Figure 4C and D). In addition, there was no effect of FA-M-β-CyD on ROS production in A549 cells (FR-α (−)) after treatment with FA-M-β-CyD (Figure 4E and F). These experiments demonstrated that FA-M-β-CyD had the potential to enhance FR-α-mediated ROS production in KB cells.
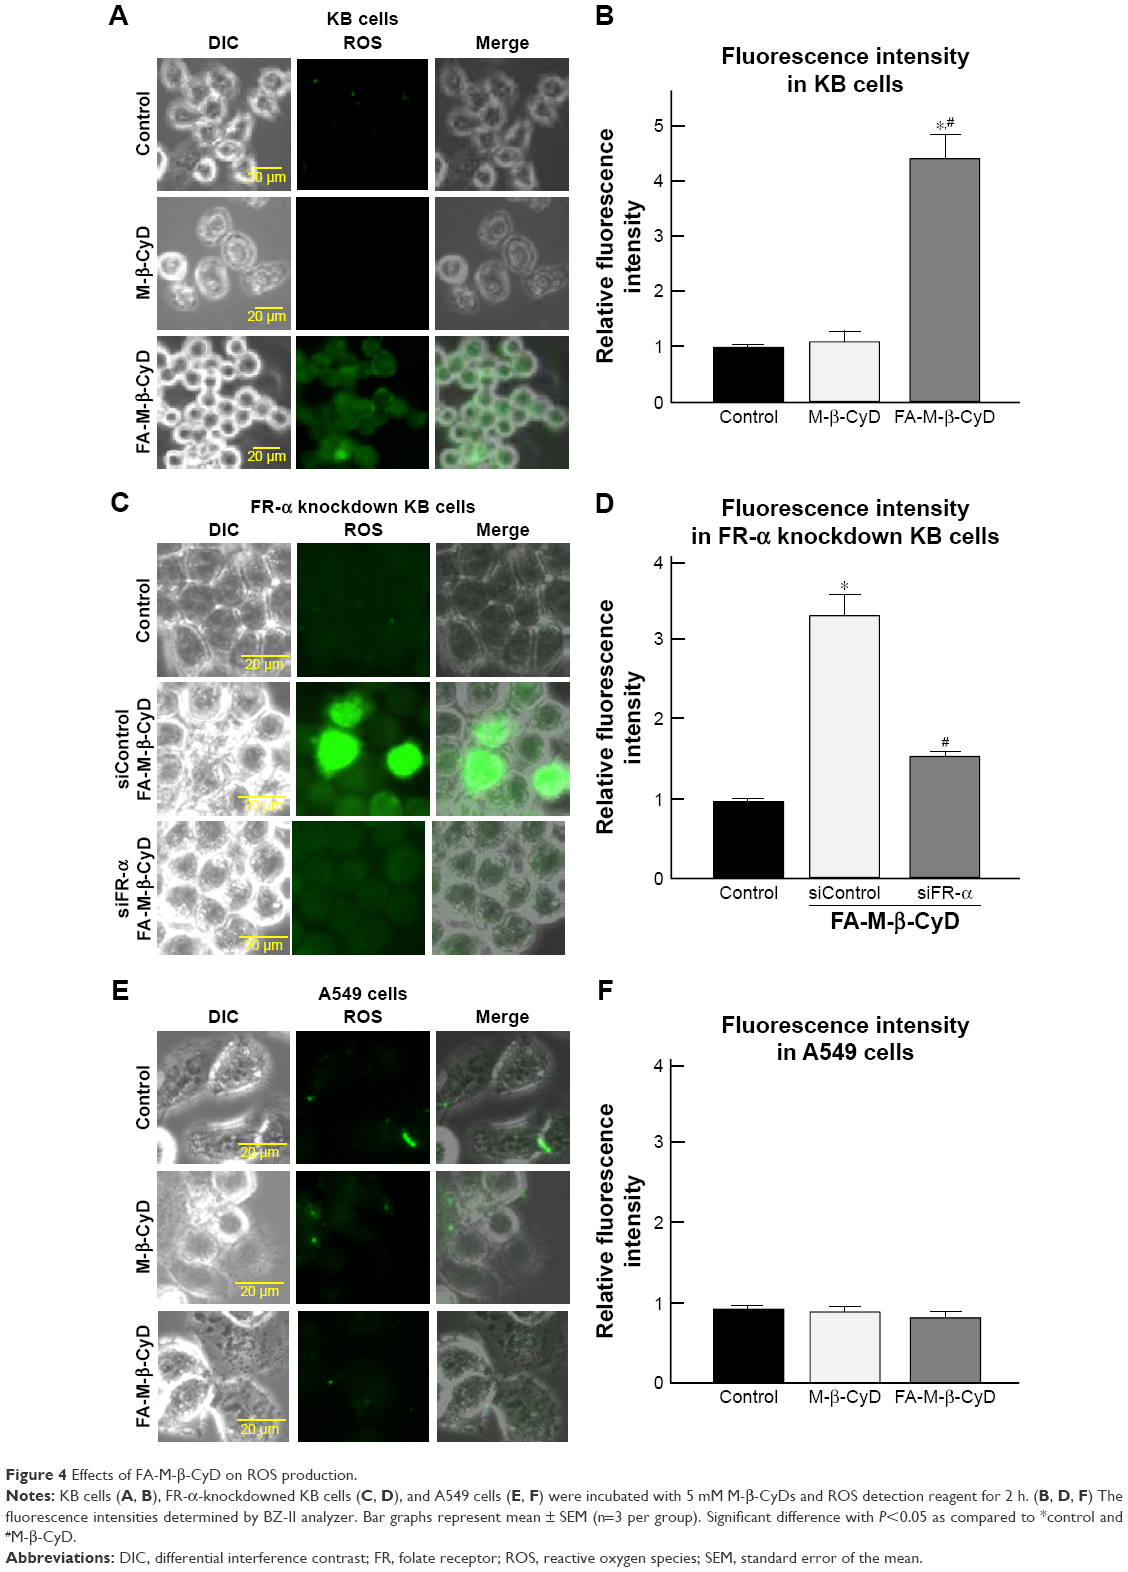 | Figure 4 Effects of FA-M-β-CyD on ROS production. |
Effects of autophagosomes formation on ROS production
There are several reports on induction of autophagy or autophagic cell death in various tumor cells after treatment with anticancer drugs.26 Meanwhile, it is generally accepted that ROS induce autophagy.21,22 Next, we examined the effect of ROS production induced by FA-M-β-CyD on autophagosome formation in KB cells (FR-α (+)). We used NAC as an ROS inhibitor. For the detection of autophagic vacuoles in KB cells (FR-α (+)), an autophagy detection kit (Cyto-ID) was used. As shown in Figure 5A and B, FA-M-β-CyD elicited the autophagic vacuoles in KB cells (FR-α (+)). Importantly, these autophagic vacuoles induced by FA-M-β-CyD were overwhelmingly lowered in the presence of NAC, a ROS inhibitor. These findings suggest that FA-M-β-CyD induced the formation of autophagic vacuoles through ROS production in KB cells.
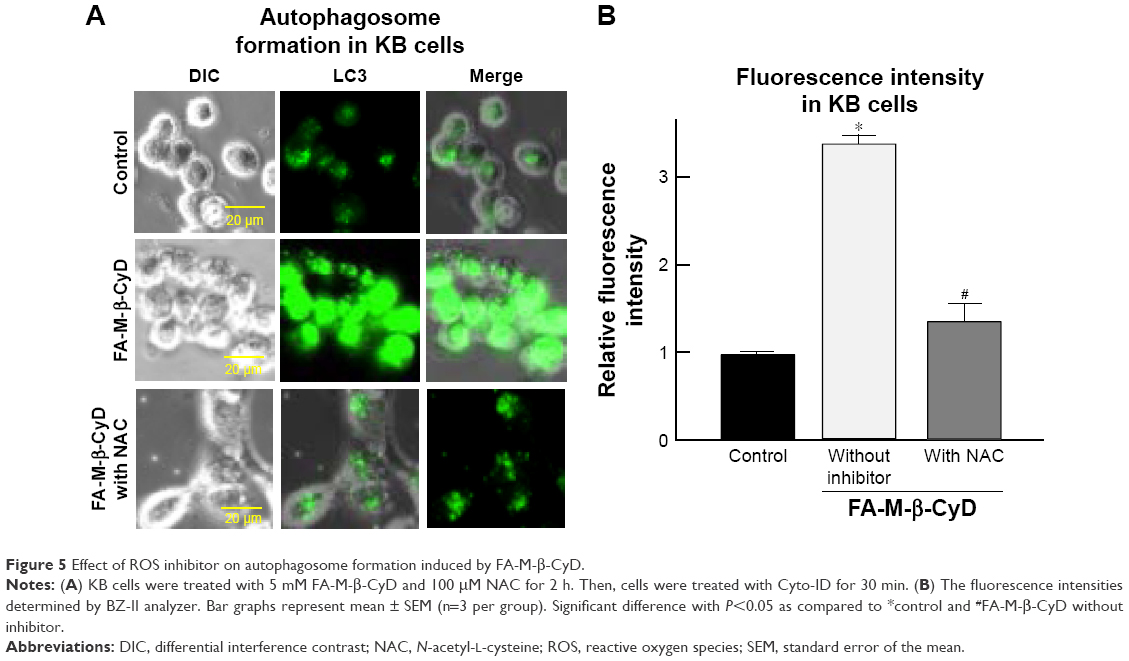 | Figure 5 Effect of ROS inhibitor on autophagosome formation induced by FA-M-β-CyD. |
Effects of FA-M-β-CyD on the expression of LC3-II and Beclin-1
To monitor the autophagy process in cells, the detection of microtubule-associated protein light chain 3 (LC3) conversion from LC3-I to LC3-II by Western blotting is one of common approaches, because the amount of LC3-II is correlated with the number of autophagosomes.27 In addition, Beclin-1 is an important autophagy regulator in the subsequent recruitment of Atg proteins to promote the autophagosome formation.28 Therefore, next we investigated LC3-II and Beclin-1 protein expression by Western blotting. As shown in Figure 6A, 5 mM FA-M-β-CyD induced the conversion from LC3-I to LC3-II. In addition, the expression of Beclin-1 was also enhanced by the treatment with 5 mM FA-M-β-CyD (Figure 6B). These results indicate that FA-M-β-CyD elicits autophagy via upregulation of Beclin-1 in KB cells (FR-α (+)).
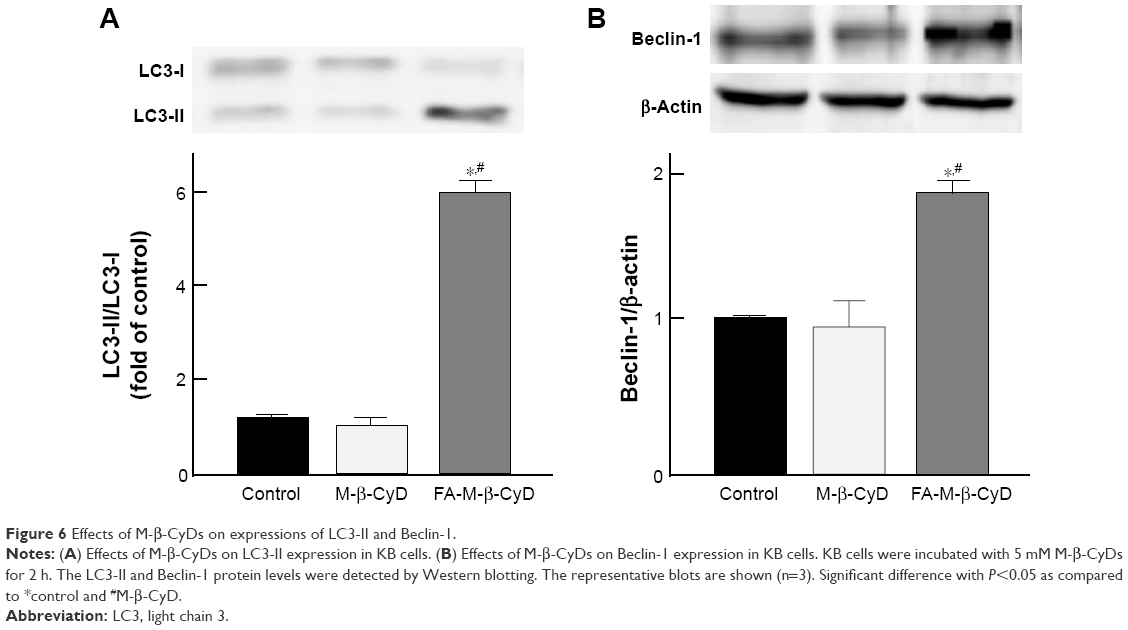 | Figure 6 Effects of M-β-CyDs on expressions of LC3-II and Beclin-1. |
Induction of mitophagy by FA-M-β-CyD
Mitophagy, the specific autophagic elimination of mitochondria, regulates mitochondrial number and maintains quality control of this important organelle.9 In the promotion of mitophagy, PINK1 accumulates on the outer membrane of damaged mitochondria followed by the recruitment of Parkin.29–31 Therefore, to examine whether FA-M-β-CyD causes mitophagy in KB cells (FR-α (+)), we evaluated PINK1 protein expression on mitochondria by Western blotting (Figure 7A). Notably, FA-M-β-CyD, but not M-β-CyD, elevated the expression of PINK1 on mitochondria. Furthermore, to examine the mitochondrial number in KB cells after treatment with FA-M-β-CyD, we determined the mtDNA copy number by real-time PCR. The mtDNA copy number in KB cells (FR-α (+)) was significantly decreased by the treatment with FA-M-β-CyD (Figure 7B).
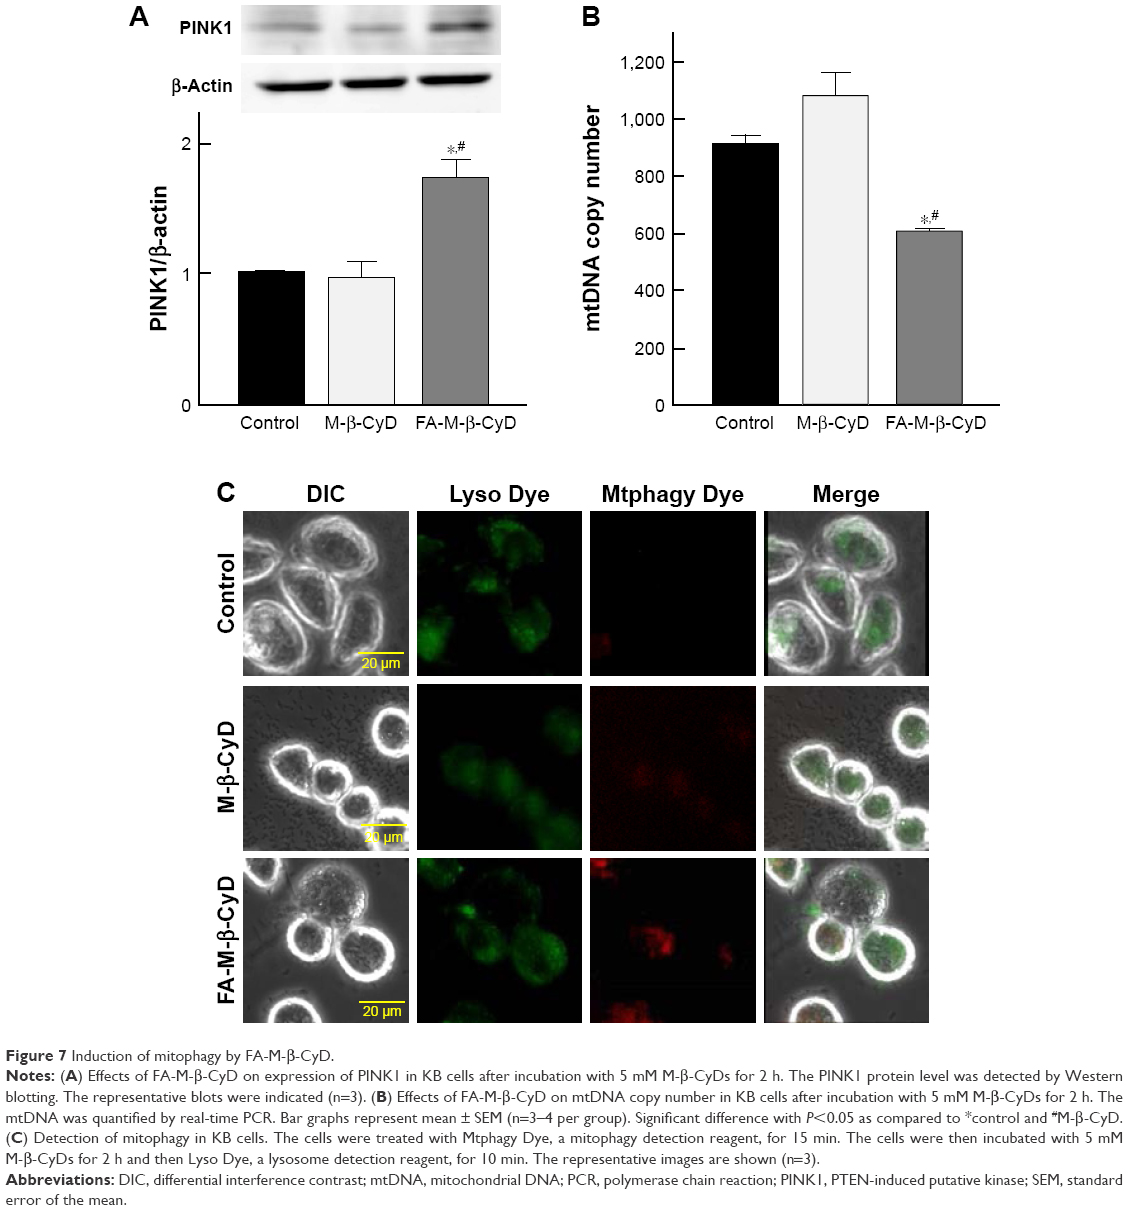 | Figure 7 Induction of mitophagy by FA-M-β-CyD. |
Previously, we revealed that FA-M-β-CyD induced autophagosome formation and its co-localization of mitochondria in KB cells, suggesting the mitophagy induction.16 However, in the previous study, the autophagosomes were just detected by Cyto-ID, a LC-3 detector in cells. Meanwhile, in this study, we used Mtphagy Dye, a mitophagy-specific detection kit commercialized most recently by Dojindo Molecular Technologies, Inc., namely, Mtphagy Dye, which accumulates in intact mitochondria, is immobilized on it by a chemical bond and exhibits a weak fluorescence. Given mitophagy occurs in cells, the damaged mitochondria fuse with lysosomes, and then Mtphagy Dye emits strong fluorescence intensity. Therefore, to directly and evidently detect mitophagy in KB cells (FR-α (+)), we performed the experiments using Mtphagy Dye. As shown in Figure 7C, the mitophagic vacuoles and lysosomes, stained by Mtphagy Dye and Lyso Dye, respectively, were partially colocalized in KB cells (FR-α (+)) after treatment with FA-M-β-CyD. Taken together, these findings indicate that the autophagic cell death caused by FA-M-β-CyD could be associated with mitophagy in KB cells (FR-α (+)).
In vivo antitumor activity of FA-M-β-CyD
Previously, we demonstrated the in vivo antitumor activity of FA-M-β-CyD in mice allografted with Colon-26 cells, a colon adenocarcinoma cell line derived from BALB/c mice.15 However, human xenograft models have shown better results than murine allograft models in drug development.32 Therefore, we investigated the antitumor effect of FA-M-β-CyD in mice xenografted with KB cells (FR-α (+)). As shown in Figure 8A and B, a single, intravenous dose of FA-M-β-CyD showed a potent inhibitory effect on tumor growth in BALB/c nu/nu mice xenografted with KB cells (FR-α (+)) compared to M-β-CyD. Furthermore, the antitumor activity of FA-M-β-CyD was dose dependent (Figure 8C). Importantly, the mice intravenously administered with FA-M-β-CyD did not show any significant change in their body weight (Figure 8D) or blood chemistry values such as CRE, BUN, AST, ALT, and LDH after 24 h (Table 1). These results indicate the potent antitumor activity of FA-M-β-CyD in BALB/c nu/nu mice xenografted with KB cells (FR-α (+)) without any significant side effects.
 | Figure 8 Effects of intravenous administration of FA-M-β-CyD on tumor growth and body weight in KB cells xenografted BALB/c nu/nu mice. |
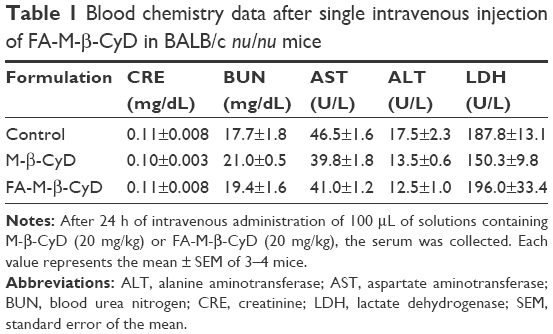 | Table 1 Blood chemistry data after single intravenous injection of FA-M-β-CyD in BALB/c nu/nu mice |
Discussion
Antitumor agents with a targeting ability not only provide effective cancer chemotherapy but also reduce the risk of side effects. In this study, we revealed that FA-M-β-CyD, but not M-β-CyD, showed a strong cytotoxic effect in the spheroids of KB cells (FR-α (+)) (Figure 1). It is important to note that the cytotoxic effect of FA-M-β-CyD was thought to be associated with FR-α-mediated endocytosis. Generally, it is believed that CyDs cannot enter the cells because of their hydrophilicity and high molecular weight. However, FA-M-β-CyD entered KB cells and partially colocalized with mitochondria (Figure 2A). Meanwhile, FA was internalized via CLIC/GEEC, a FR-α-mediated endocytosis pathway.33 Actually, to clarify the role of the FA moiety of FA-M-β-CyD for the binding to FR-α, we determined the dissociation constant of FA-M-β-CyD with FBP, as a model of FR-α, using the quartz crystal microbalance (QCM). The dissociation constant between FA-M-β-CyD and FBP was 8.56×10⁻⁷ M. In contrast, M-β-CyD did not show any response in the QCM frequency of the detection unit, indicating the negligible interaction of M-β-CyD with FBP (data not shown). Therefore, FR-α may have a crucial role in internalization of FA-M-β-CyD in tumor cells. This was strongly supported by our previous report that FA-M-β-CyD was highly internalized in KB cells but not in FR-α-knockdown KB cells.15
Generally, two major sources of ROS production are known. One source is mitochondria as a by-product of respiration, and the other is NADPH oxidase (NOX), which produces superoxide across the membranes of neutrophils and phagosomes. Several lines of evidence indicate that mitochondria can regulate autophagy by production of mitochondrial ROS,21,22,34–36 meanwhile NOX activates bacterial autophagy.37 Furthermore, the mitochondrial ROS have drawn considerable interest because they amplify the tumorigenic phenotype and accelerate the accumulation of additional mutations, leading to metastatic behavior in cancer.38 In this study, we demonstrated the FR-α-expressing cell selective ROS production by FA-M-β-CyD (Figure 4). Therefore, the induction of mitochondrial ROS by FA-M-β-CyD may contribute to induction of autophagy and suppression of tumorigenesis in KB cells.
The mitochondrial ROS is mainly generated in the mitochondrial electron transport chain (ETC) expressed on the inner mitochondrial membranes during the process of oxidative phosphorylation. The oxidative phosphorylation is an important cellular event that uses oxygen and simple sugars to produce ATP. Of the five ETC complexes in mitochondria, the ETC complex V plays an important role in ATP synthesis using proton-motive force.39 In our study, FA-M-β-CyD elevated membrane potential in isolated mitochondria and lowered ATP production (Figures 2B and 3A). Therefore, it is possible that FA-M-β-CyD may interfere with the function of ETC complex V in the mitochondria of KB cells (FR-α (+)). There are many reports on the disruption of lipid rafts by M-β-CyD, resulting from the extraction of cell membrane constituents such as cholesterol.40 Therefore, further studies regarding not only the effect of FA-M-β-CyD on ETC complex V in mitochondria but also the effect of CyD structure on mitochondrial membrane components would be necessary.
Mitophagy is a form of macroautophagy that selectively degrades damaged mitochondria to maintain cell homeostasis.9 Recently, several pathways involved in mitophagy regulation have been identified in mammalian cells, including BNIP3L, ULK1, ATG7, PINK1, and Parkin.11 As shown in Figure 7, FA-M-β-CyD elevated PINK1 expression and significantly decreased the number of mitochondria in KB cells (FR-α (+)), suggesting that PINK1-mediated mitophagy contributes to the antitumor effect of FA-M-β-CyD. Generally, mitophagy allows cellular survival by targeting the removal of damaged mitochondria, eliminating the source of apoptotic signals, or reducing mitochondrial ROS levels.9 However, once an excessive amount of mitochondrial ROS is accumulated in cells, the mitophagy-mediated digestion of mitochondria is insufficient for survival. Collectively, FA-M-β-CyD induced mitophagy-mediated cell death by an excessive accumulation of mitochondrial ROS in KB cells (FR-α (+)) (Figure 9).
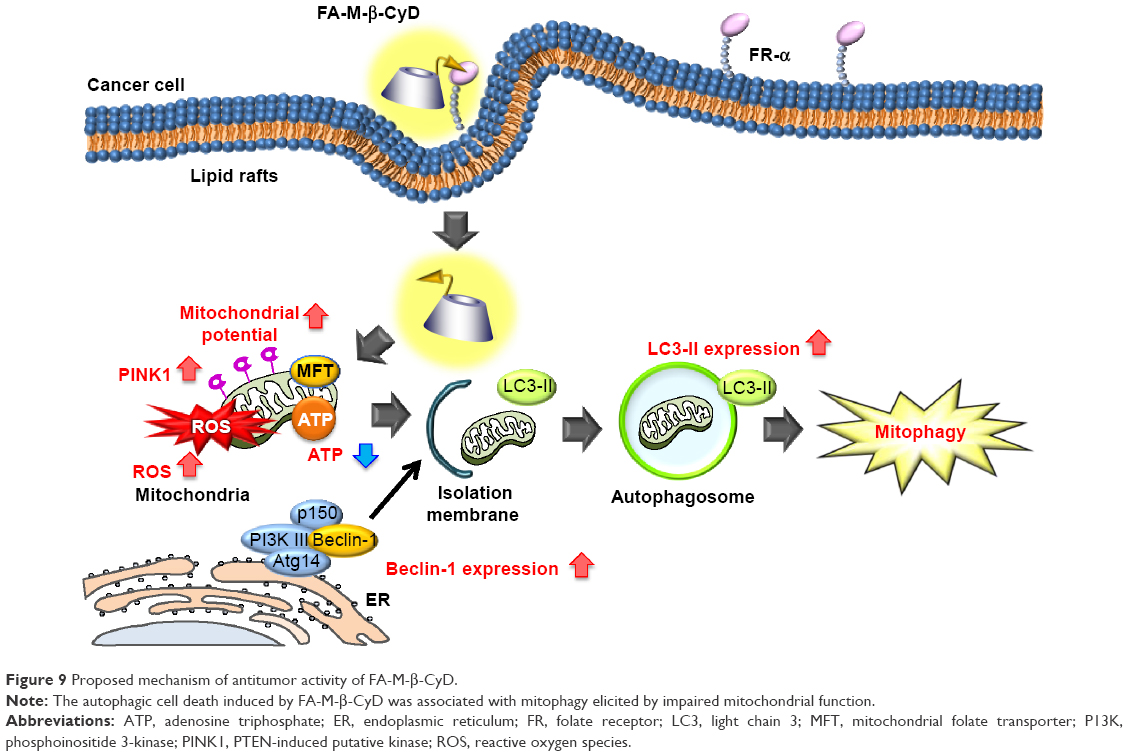 | Figure 9 Proposed mechanism of antitumor activity of FA-M-β-CyD. |
Notably, FA-M-β-CyD showed a potent in vivo antitumor activity in mice xenografted with KB cells (FR-α (+)) after intravenous administration, compared to M-β-CyD (Figure 8). Previously, it is reported that M-β-CyD provided antitumor activity in tumor xenografted athymic mice.41 However, due to the lack of tumor cell selectivity, the antitumor activity of M-β-CyD was insufficient, compared with FA-M-β-CyD (Figure 8A and B). In these in vivo experiments, neither M-β-CyD nor FA-M-β-CyD showed any significant side effects. Thereafter, more data at higher dose of M-β-CyD and FA-M-β-CyD, however, should be necessary to confirm its safety.
In general, blood vessels around tumors are leaky42,43 and poorly organized.44,45 This can cause the enhancement of the interstitial fluid pressure of tumor tissues and inhibition of the blood supply to them, resulting in the poor drug accumulation.46,47 Recently, it is reported that nanoparticles with ca. 12 nm size are promising as anticancer drug carriers because of their superior tumor penetration, rather than those with a larger size (>125 nm).48 The size of FA-M-β-CyD was determined as <10 nm,15 suggesting the efficient penetration of FA-M-β-CyD into interstitial space of tumor tissues after an intravenous administration. Furthermore, FA-M-β-CyD may actively and selectively enter the FR-α-expressing tumor cells via CLIC/GEEC endocytosis to provide its great antitumor effects (Figure 9). To validate the in vitro results that FA-M-β-CyD induced mitophagy in FR-α-positive tumor cells, further detailed experiments are in progress.
FR-α is acknowledged to be a valuable therapeutic target because it is highly expressed on various tumor tissues. Recently, Parker et al reported that FR-α was expressed in ~89% of human ovarian carcinomas but was negligible in both mucinous ovarian carcinomas and normal ovary.49 In addition, the expression of FR-α was also significant in carcinomas of the kidney, breast, endometrium, bladder, lung, and pancreas, indicating that FA-M-β-CyD can target these carcinomas in clinical. Meanwhile, Parker et al49 reported that FR-α was also expressed in normal kidney, suggesting the accumulation of FA-M-β-CyD in normal kidney. Fortunately, an intravenous administration of FA-M-β-CyD did not induce significant change in blood chemistry values such as CRE, BUN, and LDH, suggesting the safety of FA-M-β-CyD in vivo. Interestingly, we clarified that FA-M-β-CyD did not show cytotoxicity in HK2 cells, a proximal tubular cell line derived from normal kidney (FR-α (+)) under the same experimental conditions where it provides cytotoxic activity in KB cells (FR-α (+)). Hence, it is likely that FA-M-β-CyD provides tumor-selective cytotoxic activity. Anyhow, to reveal the further safety of FA-M-β-CyD, preliminary toxicity and pharmacokinetics studies including biodistribution in tumor tissues as well as in normal tissues after single- and multiple-dose administration should be necessary.
Conclusion
We revealed the role of mitophagy in the FR-α-expressing cell-selective antitumor effect of FA-M-β-CyD. These findings will contribute to the development of FA-M-β-CyD as a novel mitophagy inducer for cancer chemotherapy.
Acknowledgments
This work was partially supported by a Grant-in-Aid for Scientific Research (C) from the Japan Society for the Promotion of Science (16K08198), Center for Clinical and Translational Research of Kyushu University, and a Ministry of Health, Labor, and Welfare Grant-in-Aid for Third Term Comprehensive Control Research for Cancer program (24100701).
Disclosure
The authors report no conflicts of interest in this work.
References
Galluzzi L, Pietrocola F, Bravo-San Pedro JM, et al. Autophagy in malignant transformation and cancer progression. EMBO J. 2015;34(7):856–880. | ||
Levine B, Kroemer G. Autophagy in the pathogenesis of disease. Cell. 2008;132(1):27–42. | ||
White E. The role for autophagy in cancer. J Clin Invest. 2015;125(1):42–46. | ||
Choi AM, Ryter SW, Levine B. Autophagy in human health and disease. N Engl J Med. 2013;368(7):651–662. | ||
Jiang P, Mizushima N. Autophagy and human diseases. Cell Res. 2014;24(1):69–79. | ||
Rebecca VW, Amaravadi RK. Emerging strategies to effectively target autophagy in cancer. Oncogene. 2016;35(1):1–11. | ||
Strohecker AM, Guo JY, Karsli-Uzunbas G, et al. Autophagy sustains mitochondrial glutamine metabolism and growth of BrafV600E-driven lung tumors. Cancer Discov. 2013;3(11):1272–1285. | ||
Yang S, Wang X, Contino G, et al. Pancreatic cancers require autophagy for tumor growth. Genes Dev. 2011;25(7):717–729. | ||
Cheng Y, Ren X, Hait WN, Yang JM. Therapeutic targeting of autophagy in disease: biology and pharmacology. Pharmacol Rev. 2013;65(4):1162–1197. | ||
Swampillai AL, Salomoni P, Short SC. The role of autophagy in clinical practice. Clin Oncol (R Coll Radiol). 2012;24(6):387–395. | ||
Youle RJ, Narendra DP. Mechanisms of mitophagy. Nat Rev Mol Cell Biol. 2011;12(1):9–14. | ||
Villanueva-Paz M, Cordero MD, Pavon AD, et al. Amitriptyline induces mitophagy that precedes apoptosis in human HepG2 cells. Genes Cancer. 2016;7(7–8):260–277. | ||
Qiao A, Wang K, Yuan Y, et al. Sirt3-mediated mitophagy protects tumor cells against apoptosis under hypoxia. Oncotarget. 2016;7(28):43390–43400. | ||
Onodera R, Motoyama K, Arima H. Design and evaluation of folate-appended methyl-β-cyclodextrin as a new antitumor agent. J Incl Phenom Macrocycl Chem. 2011;70(3):321–326. | ||
Onodera R, Motoyama K, Okamatsu A, Higashi T, Arima H. Potential use of folate-appended methyl-β-cyclodextrin as an anticancer agent. Sci Rep. 2013;3:1104. | ||
Onodera R, Motoyama K, Tanaka N, et al. Involvement of autophagy in antitumor activity of folate-appended methyl-β-cyclodextrin. Sci Rep. 2014;4:4417. | ||
Frezza C, Cipolat S, Scorrano L. Organelle isolation: functional mitochondria from mouse liver, muscle and cultured fibroblasts. Nat Protoc. 2007;2(2):287–295. | ||
Breslin S, O’Driscoll L. Three-dimensional cell culture: the missing link in drug discovery. Drug Discov Today. 2013;18(5–6):240–249. | ||
Mehta G, Hsiao AY, Ingram M, Luker GD, Takayama S. Opportunities and challenges for use of tumor spheroids as models to test drug delivery and efficacy. J Control Release. 2012;164(2):192–204. | ||
McCarthy EA, Titus SA, Taylor SM, Jackson-Cook C, Moran RG. A mutation inactivating the mitochondrial inner membrane folate transporter creates a glycine requirement for survival of Chinese hamster cells. J Biol Chem. 2004;279(32):33829–33836. | ||
Azad MB, Chen Y, Gibson SB. Regulation of autophagy by reactive oxygen species (ROS): implications for cancer progression and treatment. Antioxid Redox Signal. 2009;11(4):777–790. | ||
Moore MN. Autophagy as a second level protective process in conferring resistance to environmentally-induced oxidative stress. Autophagy. 2008;4(2):254–256. | ||
Jain A, Lamark T, Sjottem E, et al. p62/SQSTM1 is a target gene for transcription factor NRF2 and creates a positive feedback loop by inducing antioxidant response element-driven gene transcription. J Biol Chem. 2010;285(29):22576–22591. | ||
Pandit L, Narayanappa G, Bhat IG, Thomas V. Autosomal recessive tubular aggregate myopathy in an Indian family. Eur J Paediatr Neurol. 2009;13(4):373–375. | ||
Scherz-Shouval R, Elazar Z. ROS, mitochondria and the regulation of autophagy. Trends Cell Biol. 2007;17(9):422–427. | ||
Kondo Y, Kanzawa T, Sawaya R, Kondo S. The role of autophagy in cancer development and response to therapy. Nat Rev Cancer. 2005;5(9):726–734. | ||
Mizushima N, Yoshimori T. How to interpret LC3 immunoblotting. Autophagy. 2007;3(6):542–545. | ||
Wirawan E, Lippens S, Vanden Berghe T, et al. Beclin1: a role in membrane dynamics and beyond. Autophagy. 2012;8(1):6–17. | ||
Geisler S, Holmstrom KM, Treis A, et al. The PINK1/Parkin-mediated mitophagy is compromised by PD-associated mutations. Autophagy. 2010;6(7):871–878. | ||
Matsuda N, Sato S, Shiba K, et al. PINK1 stabilized by mitochondrial depolarization recruits Parkin to damaged mitochondria and activates latent Parkin for mitophagy. J Cell Biol. 2010;189(2):211–221. | ||
Narendra D, Tanaka A, Suen DF, Youle RJ. Parkin is recruited selectively to impaired mitochondria and promotes their autophagy. J Cell Biol. 2008;183(5):795–803. | ||
Mittal VK, Bhullar JS, Jayant K. Animal models of human colorectal cancer: current status, uses and limitations. World J Gastroenterol. 2015;21(41):11854–11861. | ||
Doherty GJ, McMahon HT. Mechanisms of endocytosis. Annu Rev Biochem. 2009;78:857–902. | ||
Chen Y, McMillan-Ward E, Kong J, Israels SJ, Gibson SB. Mitochondrial electron-transport-chain inhibitors of complexes I and II induce autophagic cell death mediated by reactive oxygen species. J Cell Sci. 2007;120(Pt 23):4155–4166. | ||
Djavaheri-Mergny M, Amelotti M, Mathieu J, et al. NF-kB activation represses tumor necrosis factor-a-induced autophagy. J Biol Chem. 2006;281(41):30373–30382. | ||
Scherz-Shouval R, Shvets E, Fass E, Shorer H, Gil L, Elazar Z. Reactive oxygen species are essential for autophagy and specifically regulate the activity of Atg4. EMBO J. 2007;26(7):1749–1760. | ||
Huang J, Canadien V, Lam GY, et al. Activation of antibacterial autophagy by NADPH oxidases. Proc Natl Acad Sci U S A. 2009;106(15):6226–6231. | ||
Shida M, Kitajima Y, Nakamura J, et al. Impaired mitophagy activates mtROS/HIF-1a interplay and increases cancer aggressiveness in gastric cancer cells under hypoxia. Int J Oncol. 2016;48(4):1379–1390. | ||
Li X, Fang P, Mai J, Choi ET, Wang H, Yang XF. Targeting mitochondrial reactive oxygen species as novel therapy for inflammatory diseases and cancers. J Hematol Oncol. 2013;6:19. | ||
Galbiati F, Razani B, Lisanti MP. Emerging themes in lipid rafts and caveolae. Cell. 2001;106:403–411. | ||
Grosse PY, Bressolle F, Pinguet F. Antiproliferative effect of methyl-b-cyclodextrin in vitro and in human tumour xenografted athymic nude mice. Br J Cancer. 1998;78:1165–1169. | ||
Hobbs SK, Monsky WL, Yuan F, et al. Regulation of transport pathways in tumor vessels: role of tumor type and microenvironment. Proc Natl Acad Sci U S A. 1998;95:4607–4612. | ||
Nagy JA, Dvorak AM, Dvorak HF. VEGF-A and the induction of pathological angiogenesis. Annu Rev Pathol. 2007;2:251–275. | ||
Carmeliet P, Jain RK. Molecular mechanisms and clinical applications of angiogenesis. Nature. 2011;473:298–307. | ||
Nagy JA, Chang SH, Dvorak AM, Dvorak HF. Why are tumour blood vessels abnormal and why is it important to know? Br J Cancer. 2009;100:865–869. | ||
Chauhan VP, Stylianopoulos T, Boucher Y, Jain RK. Delivery of molecular and nanoscale medicine to tumors: transport barriers and strategies. Annu Rev Chem Biomol Eng. 2011;2:281–298. | ||
Jain RK. Normalization of tumor vasculature: an emerging concept in antiangiogenic therapy. Science. 2005;307:58–62. | ||
Chauhan VP, Stylianopoulos T, Martin JD, et al. Normalization of tumour blood vessels improves the delivery of nanomedicines in a size-dependent manner. Nat Nanotechnol. 2012;7:383–388. | ||
Parker N, Turk MJ, Westrick E, Lewis JD, Low PS, Leamon CP. Folate receptor expression in carcinomas and normal tissues determined by a quantitative radioligand binding assay. Anal Biochem. 2005;338:284–293. |
 © 2017 The Author(s). This work is published and licensed by Dove Medical Press Limited. The full terms of this license are available at https://www.dovepress.com/terms.php and incorporate the Creative Commons Attribution - Non Commercial (unported, v3.0) License.
By accessing the work you hereby accept the Terms. Non-commercial uses of the work are permitted without any further permission from Dove Medical Press Limited, provided the work is properly attributed. For permission for commercial use of this work, please see paragraphs 4.2 and 5 of our Terms.
© 2017 The Author(s). This work is published and licensed by Dove Medical Press Limited. The full terms of this license are available at https://www.dovepress.com/terms.php and incorporate the Creative Commons Attribution - Non Commercial (unported, v3.0) License.
By accessing the work you hereby accept the Terms. Non-commercial uses of the work are permitted without any further permission from Dove Medical Press Limited, provided the work is properly attributed. For permission for commercial use of this work, please see paragraphs 4.2 and 5 of our Terms.