")
Back to Journals » Drug Design, Development and Therapy » Volume 9
Induction of apoptosis and autophagy via sirtuin1- and PI3K/Akt/mTOR-mediated pathways by plumbagin in human prostate cancer cells
Authors Zhou Z, Li X, He Z, Pan S, Yang Y, Zhang X, Chow K, Yang T, Qiu J, Zhou Q, Tan J, Wang D, Zhou S
Received 17 October 2014
Accepted for publication 11 November 2014
Published 12 March 2015 Volume 2015:9 Pages 1511—1554
DOI https://doi.org/10.2147/DDDT.S75976
Checked for plagiarism Yes
Review by Single anonymous peer review
Peer reviewer comments 3
Editor who approved publication: Prof. Dr. Wei Duan
This paper has been retracted.
Zhi-Wei Zhou,1,2 Xing-Xiao Li,1 Zhi-Xu He,2 Shu-Ting Pan,1,3 Yinxue Yang,4 Xueji Zhang,5 Kevin Chow,1 Tianxin Yang,6 Jia-Xuan Qiu,3 Qingyu Zhou,1 Jun Tan,7 Dong Wang,8 Shu-Feng Zhou1,2
1Department of Pharmaceutical Sciences, College of Pharmacy, University of South Florida, Tampa, FL, USA; 2Guizhou Provincial Key Laboratory for Regenerative Medicine, Stem Cell and Tissue Engineering Research Center and Sino–US Joint Laboratory for Medical Sciences, Guizhou Medical University, Guiyang, Guizhou, People’s Republic of China; 3Department of Oral and Maxillofacial Surgery, The First Affiliated Hospital of Nanchang University, Nanchang, Jiangxi, People’s Republic of China; 4Department of Colorectal Surgery, General Hospital of Ningxia Medical University, Yinchuan City, Ningxia, People’s Republic of China; 5Research Center for Bioengineering and Sensing Technology, University of Science and Technology Beijing, Beijing, People’s Republic of China; 6Department of Internal Medicine, University of Utah and Salt Lake Veterans Affairs Medical Center, Salt Lake City, UT, USA; 7Department of Psychiatry and Behavioral Neurosciences, Silver Child Development Center, Rashid Laboratory for Developmental Neurobiology, Morsani College of Medicine, University of South Florida, Tampa, FL, USA; 8Cancer Center, Daping Hospital and Research Institute of Surgery, Third Military Medical University, Chongqing, People’s Republic of China
Abstract: Plumbagin (PLB) has been shown to have anticancer activities in animal models, but the role of PLB in prostate cancer treatment is unclear. This study aimed to investigate the effects of PLB on apoptosis and autophagy and the underlying mechanisms in human prostate cancer cell lines PC-3 and DU145. Our study has shown that PLB had potent pro-apoptotic and pro-autophagic effects on PC-3 and DU145 cells. PLB induced mitochondria-mediated apoptosis and autophagy in concentration- and time-dependent manners in both PC-3 and DU145 cells. PLB induced inhibition of phosphatidylinositol 3-kinase (PI3K)/protein kinase B (Akt)/mammalian target of rapamycin (mTOR) and p38 mitogen-activated protein kinase (MAPK) pathways and activation of 5'-AMP-dependent kinase (AMPK) as indicated by their altered phosphorylation, contributing to the pro-autophagic activity of PLB. Modulation of autophagy altered basal and PLB-induced apoptosis in both cell lines. Furthermore, PLB downregulated sirtuin 1 (Sirt1), and inhibition of Sirt1 enhanced autophagy, whereas the induction of Sirt1 abolished PLB-induced autophagy in PC-3 and DU145 cells. In addition, PLB downregulated pre-B cell colony-enhancing factor/visfatin, and the inhibition of pre-B cell colony-enhancing factor/visfatin significantly enhanced basal and PLB-induced apoptosis and autophagy in both cell lines. Moreover, reduction of intracellular reactive oxygen species (ROS) level attenuated the apoptosis- and autophagy-inducing effects of PLB on both PC-3 and DU145 cells. These findings indicate that PLB promotes apoptosis and autophagy in prostate cancer cells via Sirt1- and PI3K/Akt/mTOR-mediated pathways with contribution from AMPK-, p38 MAPK-, visfatin-, and ROS-associated pathways.
Keywords: AMPK, visfatin, PC-3, DU145, ROS
Introduction
Prostate cancer is the second most common cancer in men worldwide, after lung cancer, with a contribution of ~10% fatalities to cancer-related death.1,2 Globally, 903,500 men were diagnosed with prostate cancer, including 648,400 new cases from developed countries with an estimated 258,400 deaths from this disease (including 136,500 deaths from the developed countries) in 2008.3 It is predicted that the number of new cases will almost double to 1.7 million by 2030. Incidence rates for prostate cancer are highest in Australia, New Zealand, Western and Northern Europe, and North America but lowest in Asia.3 Prostate cancer may be less common in developing countries, but its incidence and mortality have been on the rise. In 2010, 196,038 men were diagnosed with prostate cancer and 28,560 men died from prostate cancer in the US.4 About one in six men will be diagnosed with prostate cancer during their lifetime. In the UK, 40,975 men were diagnosed with prostate cancer in 2010 (accounting for 25% of all new cancer cases of men), and 10,793 men died from it (accounting for 13% of all cancer-caused death in males) in 2011.5 Over 98% of men with early prostate cancer survive for 10 years in the US because of use of screening test for early diagnosis and therapies including surgical, radiation, hormone, and chemotherapy.3 Androgen-deprivation therapy with antiandrogens remains the main treatment for late-stage prostate cancer, and can effectively suppress prostate cancer growth during the first 12–24 months.6,7 However, androgen-deprivation therapy eventually fails and tumors may relapse despite the absence of androgenic stimulation progressing into the castration-resistant (ie, hormone-refractory) stage, accounting for the failure of current therapies and the increase in prostate mortality.6 Although chemotherapy is not a standard treatment for early prostate cancer, many patients are still treated with anticancer drugs such as docetaxel, prednisone, cabazitaxel, mitoxantrone, estramustine, and doxorubicin. However, chemotherapy is often accompanied by tumor resistance and severe adverse reactions. Therefore, new anticancer drugs that can kill prostate cancer cells with improved efficacy and reduced side effects are certainly needed.
Curing prostate cancer requires a better understanding of distinct biological events at cellular and subcellular levels including cell survival, cell death, cell invasion, activation of oncogenes, loss of tumor suppressor genes, and disrupted signaling pathways. The resulting new knowledge will help identify new therapies and targets for prostate cancer treatment. Targeting programmed cell death has become a promising approach to fighting prostate cancer, which mainly includes modulation of apoptosis and autophagy. Both apoptosis and autophagy are often observed in prostate cancer,8 but the therapeutic and clinical implications are unclear. During apoptosis, the B-cell lymphoma 2 (Bcl-2) family-regulated intrinsic apoptosis is initiated by the release of cytochrome c from mitochondria into cytosol, which can promote the formation of the apoptotic complex in cytosol and subsequently activate the caspase cascade.9 Autophagy, the mammalian target of rapamycin (mTOR)-mediated cell death, involves a number of autophagy-related (Atg) proteins and other regulating molecules.10,11 Autophagy may inhibit or promote prostate cancer progression depending on the cell type and androgen receptor status.
The sirtuin family of proteins (Sirt1–7) encodes a group of evolutionarily conserved, class III, nicotinamide adenine dinucleotide (NAD+)-dependent histone deacetylases, involving many critical cellular processes including cell cycle regulation, cell differentiation, genomic stability, tumorigenesis, oxidative stress response, aging, and energy metabolism.12 Sirt1 deacetylates histones, p300, p53, forkhead box class O (FoxO) family members, and nuclear factor-κB (NF-κB), which regulate cellular stress response and cell survival.12 It also regulates peroxisome proliferator-activated receptor-γ, 5′-AMP-dependent kinase (AMPK), and mTOR that regulate cellular energy metabolism and autophagy.12 Sirt1 may play a critical role in prostate cancer cell survival and death through deacetylation of its target proteins and modulation of apoptosis and autophagy. Thus, Sirt1 may represent a new therapeutic target for prostate cancer.
Plumbagin (PLB, 5-hydroxy-2-methyl-1,4-naphthoquinone, Figure 1A) is an active naphthoquinone constituent that occurs in Plumbago zeylanica L, Juglans regia, J. cinerea, and J. nigra.13 A variety of pharmacological activities of PLB, including anti-inflammatory, neuroprotective, anticancer, hypolipidemic, antiatherosclerotic, antibacterial, and antifungal effects, have been reported in in vitro and in vivo models.13 The anticancer effects of PLB are mainly attributed to the induction of intracellular reactive oxygen species (ROS) generation, apoptosis, autophagy, and cell cycle arrest,13 although the underlying mechanisms are not fully understood. In vitro and in vivo studies by our laboratory and other groups have shown that PLB induced cancer cell apoptosis and autophagy via modulation of cellular redox status, inhibition of NF-κB activation, upregulation of p53 via c-Jun N-terminal kinase (JNK) phosphorylation, and inhibition of the phosphatidylinositide 3-kinase (PI3K)/protein kinase B (Akt)/mTOR pathway.14–21 Several previous studies have found that PLB kills prostate cancer cells and inhibits prostate cancer growth in tumor-bearing nude mice via ROS-mediated apoptotic pathways.22–24 Our recent quantitative proteomic study has shown that PLB upregulates and downregulates a number of functional proteins involved in cell cycle distribution, apoptosis, autophagy, and ROS generation.25 However, the molecular mechanisms for the anticancer effects of PLB on prostate cancer are not fully elucidated. In this study, we investigated the effects of PLB on the apoptosis and autophagy in human prostate cancer PC-3 and DU145 cells and the role of Sirt1- and PI3K/Akt/mTOR-mediated pathways.
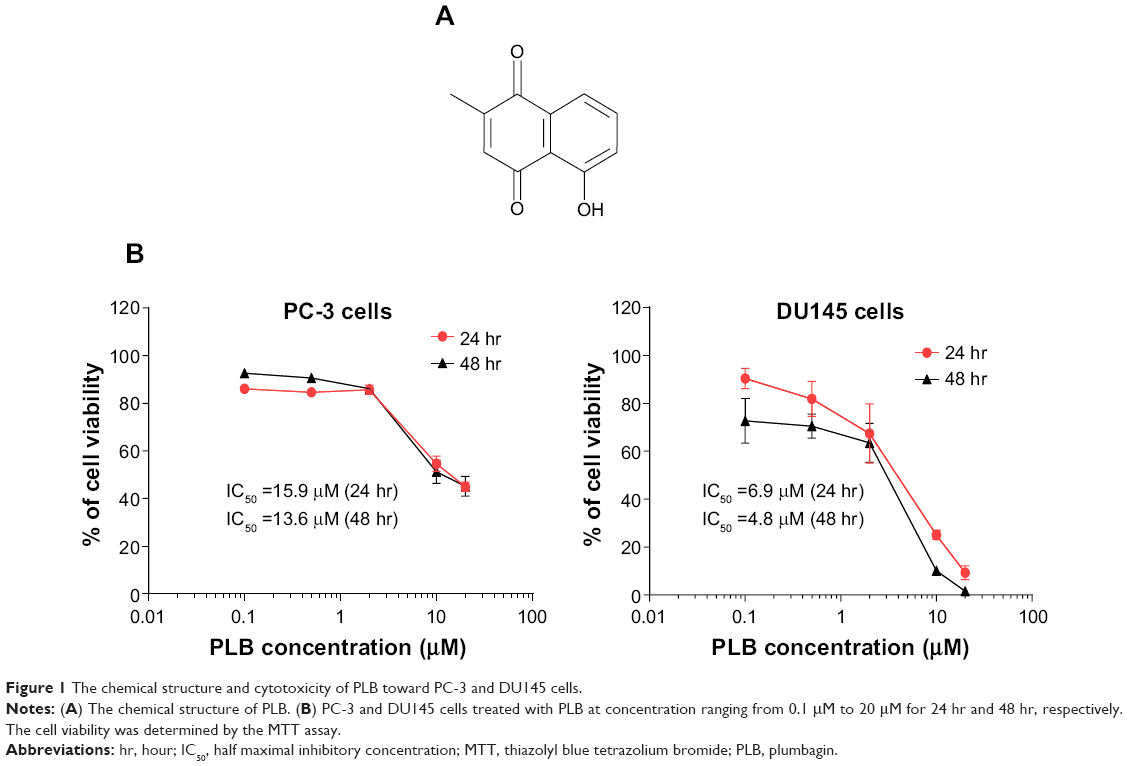 | Figure 1 The chemical structure and cytotoxicity of PLB toward PC-3 and DU145 cells. |
Materials and methods
Chemicals and reagents
4′,6-Diamidino-2-phenylindole (DAPI), 5-(and 6)-chloromethyl-2′,7′-dichlorodihydrofluorescein diacetate (CM-H2DCFDA), SB202190 (4-(4-fluorophenyl)-2-(4-hydroxyphenyl)-5-(4-pyridyl)1H-imidazole, a selective inhibitor of p38 mitogen-activated protein kinase [MAPK] used as an autophagy inducer), wortmannin (WM, a potent, irreversible, and selective PI3K inhibitor and a blocker of autophagosome formation), phenol red-free culture medium, and fetal bovine serum (FBS) were bought from Invitrogen Inc. (Carlsbad, CA, USA). Dulbecco’s Modified Eagle’s Medium (DMEM) and Roswell Park Memorial Institute (RPMI) 1640 medium were obtained from Corning Cellgro Inc. (Herndon, VA, USA). PLB, thiazolyl blue tetrazolium bromide (MTT), N-acetyl-L-cysteine (NAC, an ROS scavenger), apocynin (Apo, 4′-hydroxy-3′-methoxyacetophenone, an inhibitor of NADPH oxidase), 4-(2-hydroxyethyl)piperazine-1-ethanesulfonic acid (HEPES), ethylenediaminetetraacetic acid (EDTA), and Dulbecco’s phosphate buffered saline (PBS) were purchased from Sigma-Aldrich Co. (St Louis, MO, USA). Bafilomycin A1 (an autophagy inhibitor inhibiting fusion between autophagosomes and lysosomes) and chloroquine (an autophagy inhibitor inhibiting endosomal acidification) were purchased from Invivogen Inc. (San Diego, CA, USA). SRT1720 (SRT, a selective Sirt1 activator, N-(2-(3-(piperazin-1-ylmethyl)imidazo[2,1-b]thiazol-6-yl)phenyl)quinoxaline-2-carboxamide hydrochloride) and FK866 ((E)-N-(4-(1-benzoylpiperidin-4-yl)butyl)-3-(pyridin-3-yl)acrylamide, a highly specific noncompetitive inhibitor of pre-B cell colony-enhancing factor (PBEF)/visfatin were purchased from Selleckchem Inc. (Houston, TX, USA). Sirtinol (STL, a specific Sirt1 and Sirt2 inhibitor, (E)-2-((2-hydroxynaphthalen-1-yl)methyleneamino)-N-(1-phenylethyl)benzamide) was bought from BioVision Inc. (Milpitas, CA, USA). Rapamycin was from Enzo Life Sciences Inc. (Farmingdale, NY, USA). The annexinV:PE apoptosis detection kit was purchased from BD Pharmingen Biosciences Inc. (San Jose, CA, USA). The polyvinylidene difluoride (PVDF) membrane and methyl-2-cyano-3,12-dioxooleana-1,9(11)-dien-28-oate (NSC 713200, bardoxolone methyl or CDDO-Me, a nuclear factor erythroid 2-related factor [Nrf2] activator) were purchased from EMD Millipore Inc. (Bedford, MA, USA). Western blot substrate was obtained from Thermo Fisher Scientific Inc. (Hudson, NH, USA). Primary antibodies against human Sirt1, the p53 upregulated modulator of apoptosis (PUMA), Bcl-2-like protein 4/Bcl-2-associated X protein (Bax), B-cell lymphoma-extra-large (Bcl-xl), Bcl-2, cytochrome c, cleaved caspase 9, cleaved caspase 3, p38 MAPK, phosphorylated (p-) p38 MAPK at Thr180/Tyr182, AMPK, p-AMPK at Thr172, Akt, p-Akt at Ser473, mTOR, p-mTOR at Ser2448, PI3K, p-PI3K/p85 at Tyr458, phosphatase and tensin homolog (PTEN), beclin 1, microtubule-associated protein 1A/1B-light chain 3 (LC3-I), and LC3-II were all purchased from Cell Signaling Technology Inc. (Beverly, MA, USA). Z-VAD(OMe)-FMK (an irreversible pan-caspase inhibitor, methyl 5-fluoro-3-[2-[[3-methyl-2-(phenylmethoxycarbonylamino)butanoyl]amino]propanoylamino]-4-oxopentanoate) and the antibodies against human β-actin and PBEF/visfatin were obtained from Santa Cruz Biotechnology Inc. (Santa Cruz, CA, USA).
Cell lines and cell culture
The prostate cancer cell lines PC-3 and DU145 were obtained from American Type Culture Collection (Manassas, VA, USA) and cultured in RPMI-1640 and DMEM medium containing l-glutamine, phenol red, l-cysteine, l-methionine, sodium bicarbonate, and sodium pyruvate supplemented with 10% heat-inactivated FBS. The cells were maintained at 37°C in a 5% CO2/95% air-humidified incubator. PLB was dissolved in dimethylsulfoxide (DMSO) at a stock concentration of 100 mM and was freshly diluted to the predetermined concentration with the culture medium. The final concentration of DMSO was at 0.05% (v/v). The control cells received the vehicle only. PC-3 cells have a high metastatic potential compared to DU145 cells and do not respond to androgens, glucocorticoids, or epidermal or fibroblast growth factors. DU145 cells are also not responsive to hormones. Both PC-3 and DU145 cells were chosen in this study because both cell lines share many biochemical similarities but with remarkable differences. They are reported to be androgen receptor (AR)-negative but a recent study has shown that both cell lines express ARs, but lower than in LNCaP, an AR-positive cell line.26 A recent study indicates that DU145 cells have no detectable autophagy upon autophagic stimulation with valproic acid, indicating a defect of autophagy in this cell line.27
Cell viability assay
The MTT assay was performed to examine the effect of PLB on cell viability. Briefly, PC-3 and DU145 cells were seeded into a 96-well culture plate at a density of 8,000 cells/well. After 24-hour incubation, the cells were treated with PLB at concentration ranging from 0.1 μM to 20 μM for 24 hours or 48 hours. Cell viability was determined by reduction of MTT. The absorbance was measured using a Synergy™ H4 Hybrid microplate reader (BioTek Inc., Winooski, VT, USA) at 450 nm wavelength. The IC50 values were determined using the relative viability over PLB concentration curve.
Quantification of cellular apoptosis using flow cytometry
Annexin V is a 35 kDa Ca2+-dependent phospholipid-binding protein that has a high affinity for negatively charged phospholipid phosphatidylserine, and binds to cells that are actively undergoing apoptosis with exposed phospholipid phosphatidylserine. Apoptotic cells were quantitated using the annexinV:PE apoptosis detection kit after cells were treated with PLB at 0.1 μM, 1 μM, and 5 μM for 24 hours as described previously.19 In separate experiments, PC-3 and DU145 cells were treated with 5 μM PLB for 4 hours, 8 hours, 12 hours, 24 hours, and 48 hours. In order to investigate the mechanism for PLB-induced apoptosis, cells were pretreated with 20 μM Z-VAD(OMe)-FMK (a pan-caspase inhibitor), 10 μM WM (a PI3K inhibitor and autophagy blocker), 10 μM bafilomycin A1 (an autophagy inhibitor), 30 μM chloroquine (an autophagy inhibitor), 10 μM SB202190 (a selective inhibitor of p38 MAPK used as an autophagy inducer), 100 μM NAC (an ROS scavenger), 1 μM Apo (an NADPH oxidase inhibitor), 10 nM FK866 (a PBEF/visfatin inhibitor), 25 μM STL (an inhibitor of Sirt1), or 1 μM SRT (in inducer of Sirt1) for 1 hour, then treated with 5 μM PLB for a further 24 hours. Groups of cells treated with these compounds alone were also included. All compounds were dissolved in DMSO at a final concentration of 0.05% (v/v). Briefly, cells were trypsinized and washed twice with cold PBS. Then, the cells were resuspended in 1× binding buffer with 5 μL of annexin V:PE and 5 μL of 7-amino-actinomycin D (7-AAD, used as a nucleic acid dye) (1×10⁵ cells/mL) in a total volume of 100 μL. The cells were gently mixed and incubated in the dark for 15 minutes at room temperature. A quota of 1× binding buffer (400 μL) was then added to a clean test tube, and the number of apoptotic cells was quantified using a flow cytometer (Becton Dickinson Immunocytometry Systems, San Jose, CA, USA) within 1 hour. The flow cytometer collected 10,000 events. Cells that stain positive for annexin V:PE and negative for 7-AAD are undergoing apoptosis; cells that stain positive for both annexin V:PE and 7-AAD are either in the end stage of apoptosis, are undergoing necrosis, or are already dead; and cells that stain negative for both annexin V:PE and 7-AAD are alive and not undergoing measurable apoptosis.
Quantification of cellular autophagy
For autophagy detection, each sample was washed by resuspending the cell pellet in 1× assay buffer (Enzo Life Sciences Inc., Farmingdale, NY, USA; No. ENZ-51031-K200) and cells were collected by centrifugation as described previously.19 After 24-hour incubation, the cells were treated with fresh medium alone, control vehicle alone (0.05% DMSO, v/v), or PLB (0.1 μM, 1 μM, and 5 μM) for 24 hours at 37°C. In separate experiments, PC-3 and DU145 cells were treated with 5 μM PLB for 4 hours, 8 hours, 12 hours, 24 hours, and 48 hours. To investigate the mechanisms for PLB-induced autophagy, cells were pretreated with 20 μM Z-VAD(OMe)-FMK, 10 μM WM, 10 μM bafilomycin A1, 30 μM chloroquine, 10 μM SB202190, 100 μM NAC, 1 μM Apo, 10 nM FK866, 25 μM STL, or 1 μM SRT for 1 hour, and then co-treated with 5 μM PLB for a further 24 hours. Groups of cells treated with these compounds alone were also included. All inducers and inhibitors were dissolved in DMSO at a final concentration of 0.05% (v/v). Rapamycin (0.5 μM) was included as a positive control. Cells were resuspended in 250 μL of phenol red-free culture medium containing 5% FBS, and 250 μL of the diluted Cyto-ID® Green stain solution (Enzo Life Sciences Inc.; No ENZ-51031-K200) was added to each sample and mixed well. Cells were incubated for 30 minutes at 37°C in the dark, collected by centrifugation, washed with 1× assay buffer, and resuspended in 500 μL fresh 1× assay buffer. Cells were analyzed using the green (FL1) channel of a flow cytometer (Becton Dickinson Immunocytometry Systems). The flow cytometer collected 10,000 events. To explore the potential crosstalk between PLB-induced apoptosis and autophagy, we further determined the two modes of programmed cell death simultaneously.
Measurement of intracellular ROS levels
The intracellular level of ROS was measured using CM-H2DCFDA according to the manufacturer’s instruction. The nonfluorescent substrate CM-H2DCFDA can passively diffuse into prostate cancer cells and be retained in the cells after cleavage by intracellular esterases. Upon oxidation by ROS, CM-H2DCFDA is converted to the CM-DCF, which is highly fluorescent. Briefly, cells were seeded into a 96-well plate at a density of 1×10⁴ cells/well. After 24-hour treatment with PLB at predetermined concentrations, the cells were incubated with CM-H2DCFDA at 5 μM in PBS for a further 30 minutes. In separate experiments, the intracellular ROS level was measured when PC-3 and DU145 cells were treated with 5 μM PLB for 4 hours, 8 hours, 12 hours, 24 hours, 48 hours, and 72 hours. In addition, the effect of Apo on PLB-induced ROS generation was examined. Cells were pretreated with 0.1 μM Apo for 1 hour with or without addition of 5 μM PLB followed by further incubation for 24 hours. The fluorescence intensity was detected at wavelength 485 nm (excitation) and 530 nm (emission).
Western blotting analysis
The levels of various cellular proteins were determined using Western blotting assays as described previously.19 PC-3 and DU145 cells were washed with PBS after 24-hour treatment with PLB, lysed with the radioimmunoprecipitation assay (RIPA) buffer (50 mM HEPES at pH 7.5, 150 mM NaCl, 10% glycerol, 1.5 mM MgCl2, 1% Triton-X 100, 1 mM EDTA at pH 8.0, 10 mM sodium pyrophosphate, and 10 mM sodium fluoride) containing the protease inhibitor and phosphatase inhibitor cocktails. Protein concentrations were measured by Pierce™ bicinchoninic acid protein assay kit (Thermo Scientific Inc.). Equal amounts of the protein samples were electrophoresed on 7%-12% sodium dodecyl sulfate polyacrylamide gel electrophoresis (SDS-PAGE) mini-gel after thermal denaturation for 5 minutes at 95°C. Proteins were transferred onto Immobilon PVDF membrane at 100 V for 2 hours at 4°C. Membranes were probed with the indicated primary antibody overnight at 4°C and then blotted with respective secondary antibody. Visualization was performed using a Bio-Rad ChemiDoc™ XRS system (Hercules, CA, USA) with enhanced chemiluminescence substrate, and the blots were analyzed using Image Lab 3.0 (Bio-Rad Inc.). The protein level was normalized to the matching densitometric value of internal control.
Confocal fluorescence microscopy
The cellular autophagy level was examined using the Cyto-ID® autophagy detection kit according to the manufacturer’s instructions. Briefly, PC-3 and DU145 cells were seeded into an eight-well chamber slide at 30% confluence. The cells were treated with PLB at 0.1 μM, 1 μM, and 5 μM for 24 hours. In some experiments, cells were pretreated with SRT or STL for 1 hour, and then 5 μM of PLB was added. After incubation for a further 24 hours, cells reached ~60% of confluence and were washed by 1× assay buffer, followed by incubation with 100 μL of microscopy dual detection reagent for 30 minutes at 37°C in the dark. After the incubation, the cells were washed by 1× assay buffer to remove the detection reagent, and then the cells were examined using a Leica TCS SP2 laser scanning confocal microscope (Wetzlar, Germany) using a standard fluorescein isothiocyanate filter set for imaging the autophagic signal at 405/488 nm wavelengths.
Statistical analysis
Data are presented as the mean ± standard deviation (SD) of the mean. Multiple comparisons were evaluated by one-way analysis of variance (ANOVA) followed by Tukey’s multiple comparison. A value of P<0.05 was considered statistically significant.
Results
PLB induces apoptosis of PC-3 and DU145 cells via activation of mitochondria-dependent pathway
First, we tested the cytotoxicity of PLB in PC-3 and DU145 cells using MTT assays. Both cell lines were incubated with PLB at concentrations ranging from 0.1 μM to 20 μM for 24 hours and 48 hours. The cellular viability of PC-3 cells was 86.1%–45.0% and 92.6%–44.1%, respectively, and that of DU145 cells was 90.3%–9.3% and 72.6%–1.6%, respectively (Figure 1B). The IC50 values were 15.9 μM and 13.6 μM for PC-3 cells after 24-hour and 48-hour incubation with PLB, respectively. For DU145 cells, the IC50 values were 6.9 μM and 4.8 μM after 24-hour and 48-hour treatment of PLB, respectively (Figure 1B).
To further examine the anticancer effect of PLB in PC-3 and DU145 cells, the effect of PLB on cellular apoptosis was quantified by flow cytometric analysis. In order to examine the apoptosis-inducing effect of PLB in PC-3 and DU145 cells, the number of apoptotic cells was first quantified, and the results are shown in Figures 2A, 2B and 3A. The number of apoptotic cells at basal level was 4%-5%, and the number of apoptotic cells was 4%-6% in PC-3 cells treated with the control vehicle only (0.05% DMSO, v/v). While PC-3 cells were treated with PLB at 0.1 μM, 1 μM, and 5 μM for 24 hours, the total percentage of apoptotic cells (early + late apoptosis) was 7.9%, 8.2%, and 9.0%, respectively. There was a twofold increase when treated with 5 μM PLB, compared to the control cells (P<0.05; Figure 2A and B). In DU145 cells, the number of apoptotic cells was 2%-3% at basal level and 2%-3% in cells treated with the control vehicle only (0.05% DMSO, v/v). When DU145 cells were treated with PLB at 5 μM for 24 hours, the total percentage of apoptotic cells were increased 1.6-fold compared to the control cells (P<0.05; Figures 2A, 2B and 3A). In addition, the effect of PLB on the apoptosis of PC-3 and DU145 cells was examined when the cells were treated for 4-48 hours. Incubation of PC-3 and DU145 cells with 5 μM PLB time-dependently increased the number of apoptotic cells. In PC-3 cells, the apoptotic percentage increased from 5.8% at basal level (zero time) to 6.3%, 6.5%, 10.0%, and 24.8% with the treatment of 5 μM PLB for 8 hours, 12 hours, 24 hours, and 48 hours, respectively (P<0.05; Figures 2C, 2D and 3B). In DU145 cells, the apoptotic percentage increased from 4.8% at basal level to 11.2%, 10.0%, and 69.2% with the treatment of 5 μM PLB for 4 hours, 12 hours, and 24 hours, respectively (P<0.05; Figures 2C, 2D and 3B). The percentage of apoptotic cells declined to 13.0% when DU145 cells were treated with 5 μM PLB for 48 hours. Taken together, the results clearly showed that PLB remarkably induced apoptotic cell death of both PC-3 and DU145 cells.
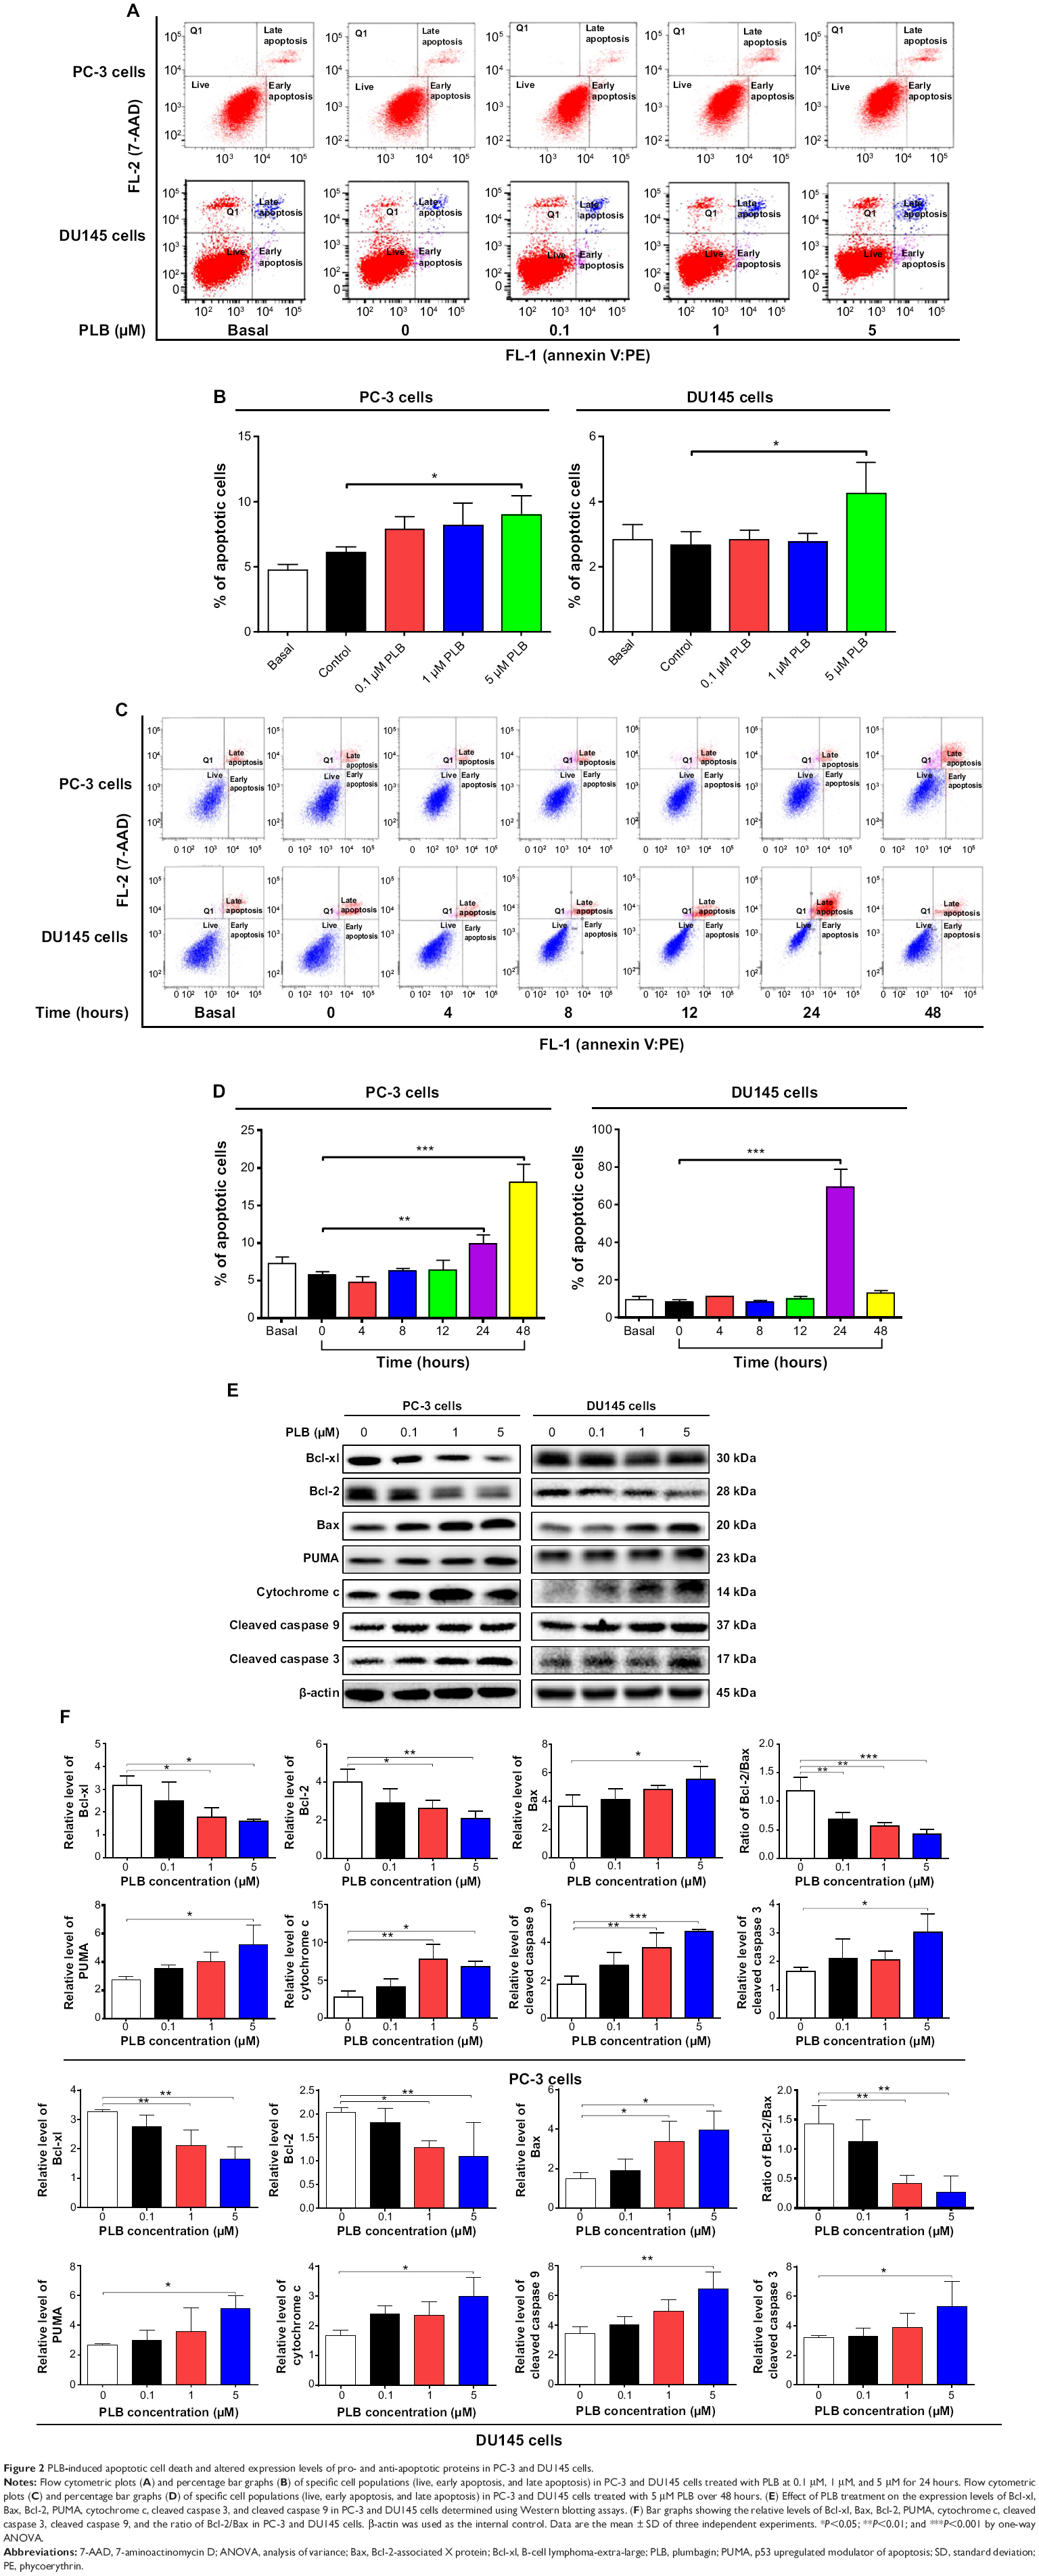 | Figure 2 PLB- induced apoptotic cell death and altered expression levels of pro- and anti-apoptotic proteins in PC-3 and DU145 cells. |
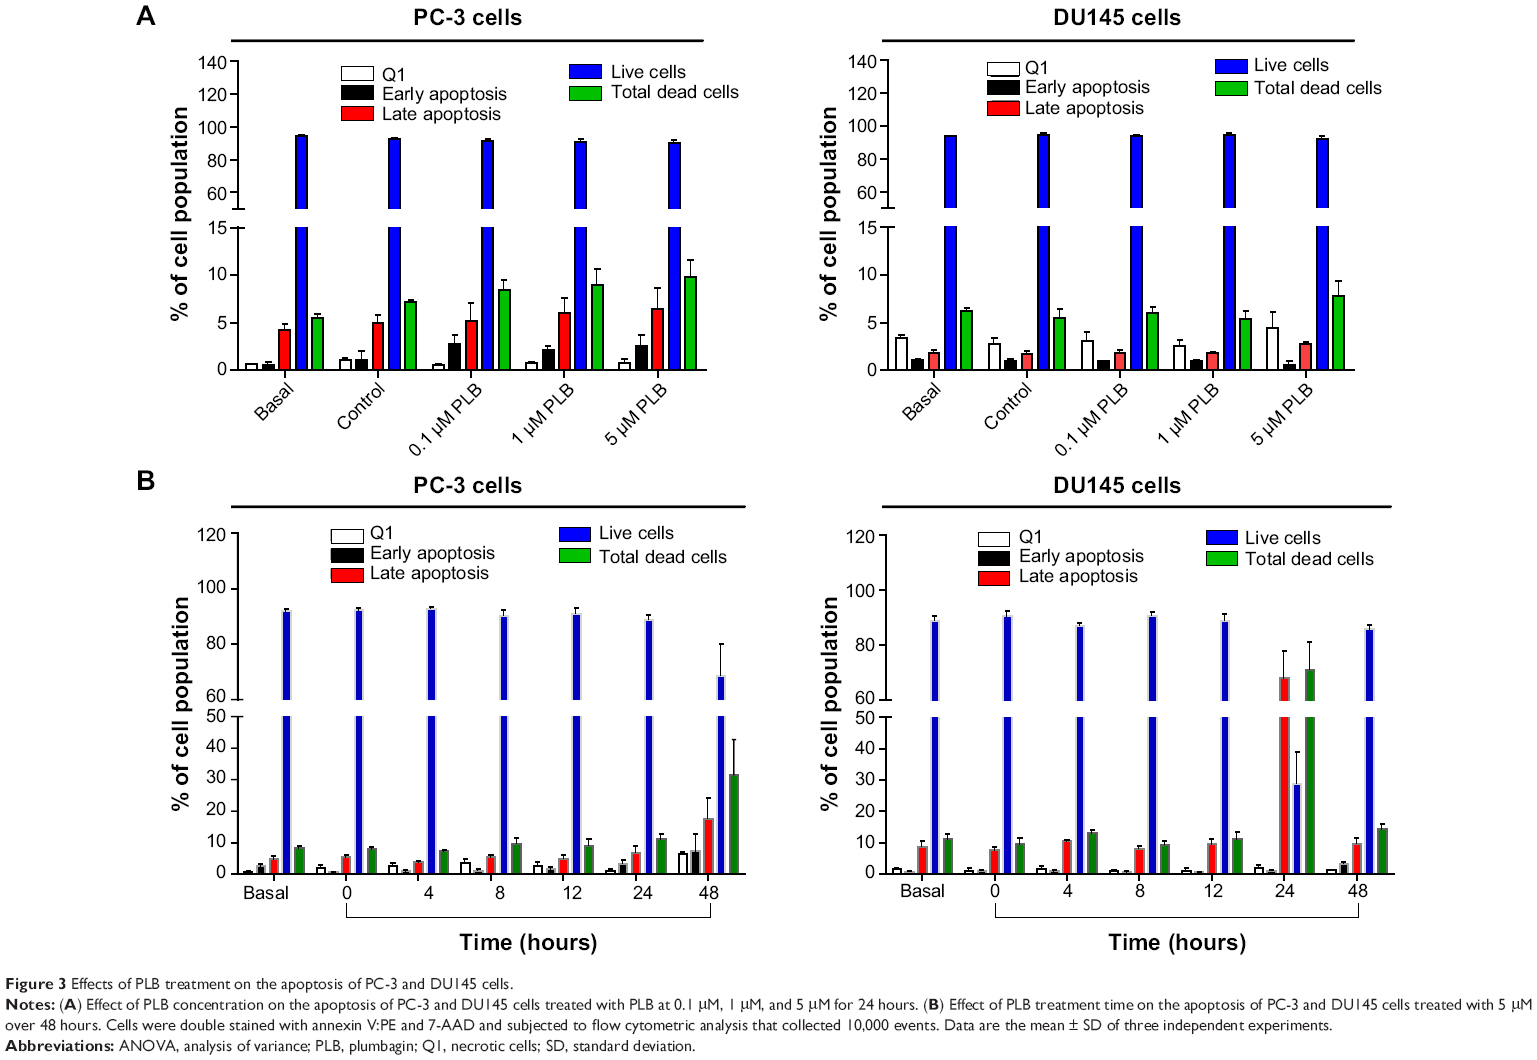 | Figure 3 Effects of PLB treatment on the apoptosis of PC-3 and DU145 cells. |
In order to elucidate the mechanism for the pro-apoptotic effect of PLB on PC-3 and DU145 cells, we first examined the effects of PLB treatment on the expression levels of the pro-apoptotic protein Bax and the anti-apoptotic proteins Bcl-2 and Bcl-xl (Figure 2E and F). In the mitochondria/cytochrome c-mediated apoptotic pathway, various stimuli converge at the mitochondria and activate one or more members of the BH3-only protein family, which are tightly regulated by Bcl-2 family members.9 This will promote the assembly of Bcl-2-antagonist/killer-1 (Bak) and Bax oligomers within mitochondrial outer membranes, leading to cytochrome c release to cytosol, which in turn induces the apoptotic protease-activating factor-1 to generate apoptosome and activates caspase 9 and subsequently activates the downstream caspases 2, 3, 6–8, and 10.9,28 PC-3 and DU145 cells were treated with PLB at 0.1 μM, 1 μM, and 5 μM for 24 hours. The expression level of Bax was concentration-dependently increased in two cell lines (P<0.05; Figure 2E and F). Incubation of PC-3 cells with 5 μM PLB significantly increased the Bax expression (1.5-fold), and treatment of DU145 cells with 1 μM and 5 μM of PLB for 24 hours resulted in a remarkable increase in the expression of Bax (2.2- and 2.6-fold, respectively). In contrast, the expression level of Bcl-2 decreased by 34.7% and 47.6% in PC-3 cells and 36.8% and 45.7% in DU145 cells when treated with PLB at 1 μM and 5 μM, respectively (Figure 2E and F). A significant increase in the expression level of Bax and reduction of Bcl-2 resulted in a significant decrease in the Bcl-2/Bax ratio in both cell lines with a 42.4%, 51.9%, and 63.7% reduction in PC-3 cells and 21.2%, 70.5%, and 80.9% reduction in DU145 cells when treated with PLB at 0.1 μM, 1 μM, and 5 μM for 24 hours, respectively (P<0.01; Figure 2E and F). In addition, the expression level of Bcl-xl was suppressed after treatment of PLB at 0.1 μM, 1 μM, and 5 μM in both cell lines in a concentration-dependent manner. Compared to the control cells, the expression level of Bcl-xl was reduced by 21.5%, 44.1%, and 49.7% in PC-3 cells and 15.6%, 35.0%, and 49.3% in DU145 cells when treated with PLB at 0.1 μM, 1 μM, and 5 μM for 24 hours, respectively. Moreover, the effect of PLB on the expression of PUMA was also examined due to its important role in the regulation of anti-apoptotic proteins. Incubation of PC-3 and DU145 cells with PLB increased the expression level of PUMA in a concentration-dependent manner. Treatment of 5 μM PLB for 24 hours significantly increased the expression level of PUMA 1.9-fold in both cell lines (Figure 2E and F).
Besides, the effect of PLB treatment on the mitochondria-related apoptotic pathway was further examined in PC-3 and DU145 cells. The release of cytochrome c from mitochondria to cytosol initiates the caspase-dependent apoptotic cascade.9 The release of cytochrome c from the mitochondrial intermembrane space is the early event during apoptotic cell death.29 Upon apoptotic stimulation, cytochrome c released from mitochondria associates with procaspase 9/Apaf 1 to form a complex that processes caspase 9 from inactive proenzyme to its active form, eventually triggering caspase 3 activation and apoptosis.29 As such, we evaluated the effect of PLB treatment on the release of cytochrome c in both PC-3 and DU145 cells. Treatment of PC-3 and DU145 cells with PLB for 24 hours significantly increased the release of cytochrome c from mitochondria in a concentration-dependent manner (Figure 2E and F). Subsequently, we observed a significant increase in the activation of caspases 9 and 3. Compared to the control cells, treatment of PC-3 and DU145 cells with PLB at 0.1 μM, 1 μM, and 5 μM for 24 hours significantly increased the level of cleaved caspases 9 and 3 (Figure 2E and F). These results indicated that PLB induced remarkable activation of caspases 9 and 3 and eventually led to apoptotic death of both PC-3 and DU145 cells.
PLB induces autophagy in both PC-3 and DU145 cells via inhibition of the PI3K/Akt/mTOR axis
Since we observed PLB-induced apoptosis in PC-3 and DU145 cells, we next examined the effect of PLB on the autophagy of PC-3 and DU145 cells using flow cytometric analysis and confocal microscopy. The percentage of autophagic cells at basal level was 5.2% and 2.0% for PC-3 and DU145 cells, respectively (Figure 4A and B). Rapamycin significantly induced the autophagy of PC-3 cells. Incubation of PC-3 and DU145 cells with PLB for 24 hours significantly increased the percentage of autophagic cells. In PC-3 cells, there was a 2.2-fold increase in the percentage of autophagic cells when treated with 5 μM PLB for 24 hours compared to the control cells (4.6% vs 10.0%; P<0.05; Figure 4A and B). In addition, treatment of DU145 cells with 5 μM PLB for 24 hours resulted in a 6.8-fold increase in the percentage of autophagic cells (1.5% vs 10.4%; P<0.001; Figure 4C and D). Treatment of PC-3 and DU145 cells with 0.1 μM and 1 μM PLB for 24 hours only slightly increased the autophagic death.
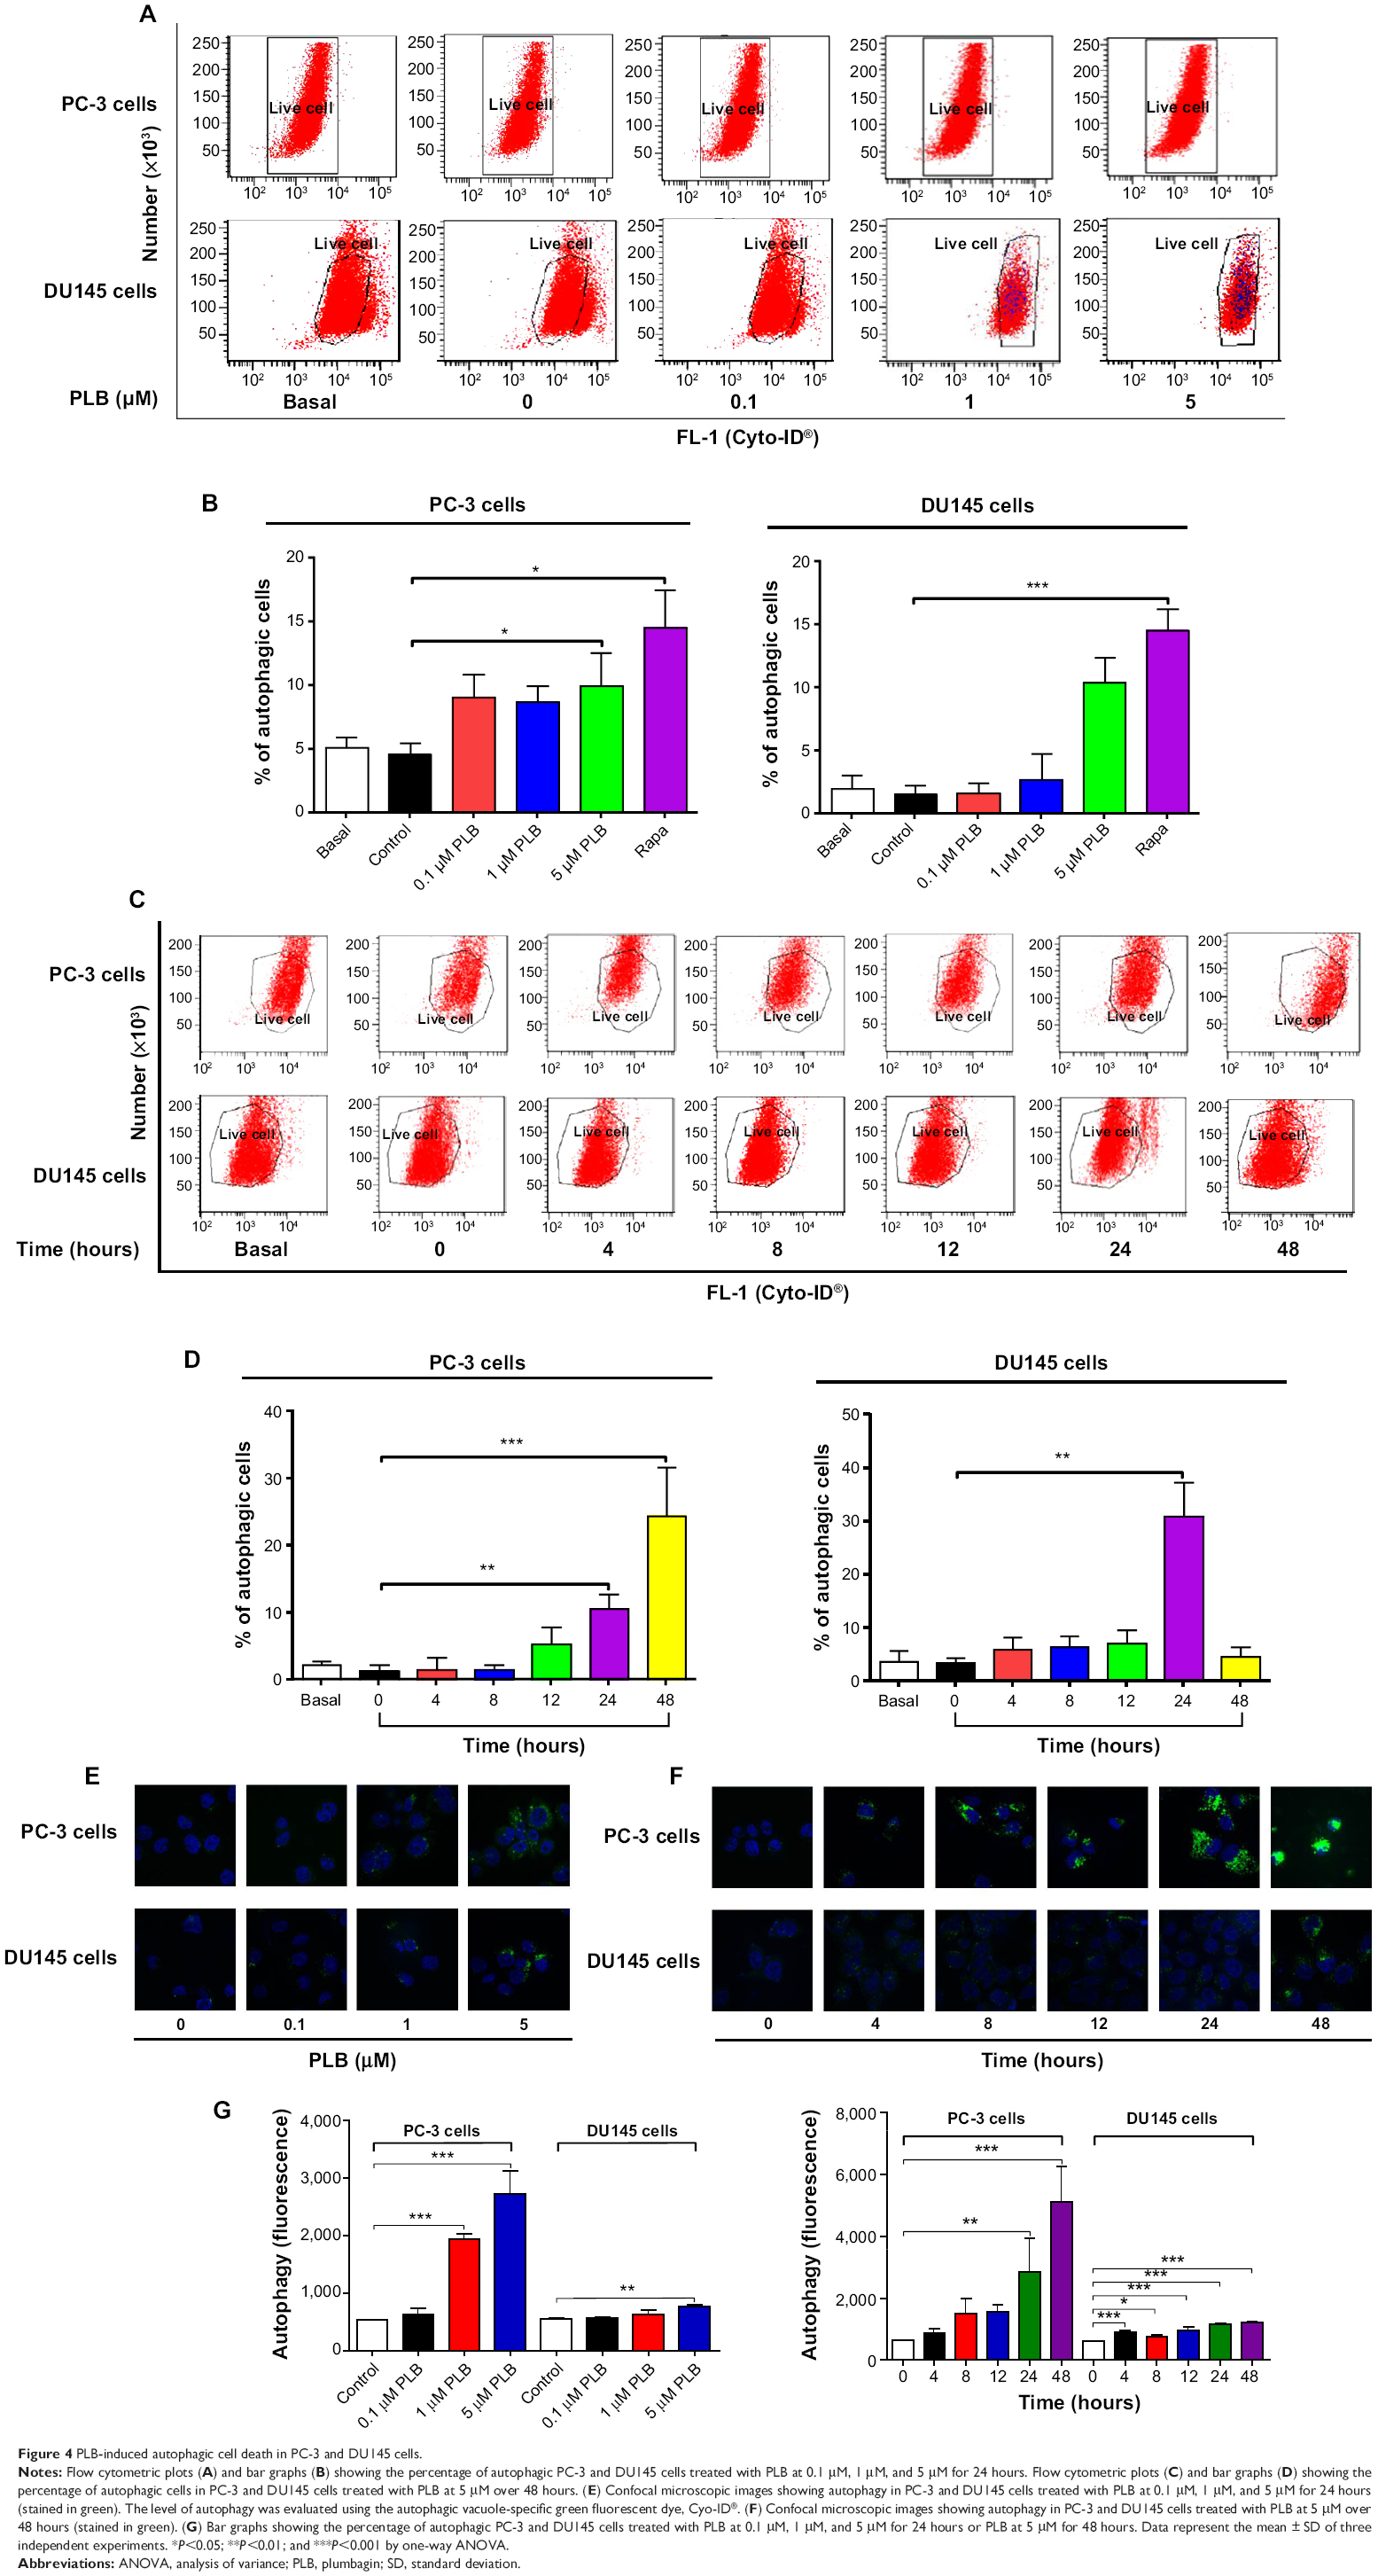 | Figure 4 PLB- induced autophagic cell death in PC-3 and DU145 cells. |
In separate experiments, the effect of PLB on the autophagy of PC-3 and DU145 cells was examined when cells were treated for 4-48 hours. Treatment of PC-3 and DU145 cells with 5 μM PLB induced marked autophagy (Figure 4C and D). In PC-3 cells, the percentage of autophagic cells was increased from 1.4% at basal level (zero time) to 1.6%, 1.6%, 5.3%, 10.6%, and 24.3% when the cells were treated for 4 hours, 8 hours, 12 hours, 24 hours, and 48 hours, respectively (P<0.05; Figure 4C and D). Treatment of DU145 cells with 5 μM PLB increased the percentage of autophagic cells from 3.4% at basal level (zero time) to 6.0%, 6.3%, 7.1%, and 31.1% when the cells were treated for 4 hours, 8 hours, 12 hours, and 24 hours, respectively; while the percentage of autophagic cells dropped down to the basal level (4.6%) after a 48-hour treatment of 5 μM PLB (Figure 4C and D).
We further confirmed the autophagy-inducing effects of PLB on PC-3 and DU145 cells using confocal microscopic examination. In comparison to the control cells, PLB treatment caused a significant increase in the autophagy in a concentration-dependent manner in PC-3 and DU145 cells (Figure 4E, F and G). There was a 3.7- and 5.2-fold increase in the autophagic death of PC-3 cells when treated with PLB at 1 μM and 5 μM for 24 hours, respectively (P<0.001; Figure 4E, F and G). In DU145 cells, there was a 39.2% increase in autophagy when treated with 5 μM PLB (P<0.01; Figure 4E, F and G). A lower concentration of PLB (0.1 μM) did not significantly affect the autophagy in PC-3 and DU145 cells. In separate experiments, the autophagy-inducing effects of PLB on PC-3 and DU145 cells over 48 hours were examined. There was a time-dependent increase in autophagy when PC-3 cells were treated with 5 μM PLB. Compared to the control cells, treatment with 5 μM PLB resulted in 4.5- and 8.1-fold increase in the autophagic death of PC-3 cells after 24-hour and 48-hour incubation, respectively (P<0.01; Figure 4E, F and G). In DU145 cells, treatment with 5 μM PLB significantly increased the autophagy over 48 hours (Figure 4E, F and G). These results demonstrate that PLB induces autophagy in both PC-3 and DU145 cells. Both PC-3 and DU145 cells are largely sensitive to high concentrations of PLB.
Next, we investigated the mechanisms for the autophagy-inducing effect of PLB in PC-3 and DU145 cells. First we examined the phosphorylation levels of PI3K at Tyr199, AMPK at Thr172, and p38 MAPK at Thr180/Tyr182 that are upstream signaling molecules of Akt/mTOR pathway and play an important role in the regulation of cell proliferation and death.10,11 PI3K catalyzes the formation of phosphatidylinositol-3,4,5-triphosphate via phosphorylation of phosphatidylinositol, phosphatidylinositol-4-phosphate, and phosphatidylinositol-4,5-bisphosphate.30 Growth factors and hormones trigger this phosphorylation event, which in turn coordinates cell growth, cell cycle, cell migration, and cell survival. In this study, PLB significantly inhibited the phosphorylation of PI3K at Tyr199 in both cell lines in a concentration-dependent manner compared to the control cells (Figure 5A and B). Exposure of PC-3 cells to 5 μM PLB for 24 hours decreased the phosphorylation level of PI3K at Tyr199 by 38.2% (P<0.05; Figure 5A and B). Treatment of DU145 cells with 5 μM PLB for 24 hours reduced the phosphorylation level of PI3K at Tyr199 by 16.0% (P<0.01; Figure 5A and B). However, incubation of both cell lines with PLB did not significantly affect the expression of total PI3K. The ratio of p-PI3K over total PI3K was concentration-dependently decreased by PLB in both cell lines compared to the control cells. In PC-3 cells, the p-PI3K/PI3K ratio decreased from 2.3 at basal level to 2.0, 1.7, and 1.5, when PC-3 cells were treated with PLB at 0.1 μM, 1 μM, and 5 μM, respectively (P<0.05 or 0.01; Figure 5A and B). In DU145 cells, treatment with 5 μM PLB decreased the ratio of p-PI3K/PI3K by 27.1% compared to the control cells (2.0 vs 2.7) (P<0.05; Figure 5A and B).
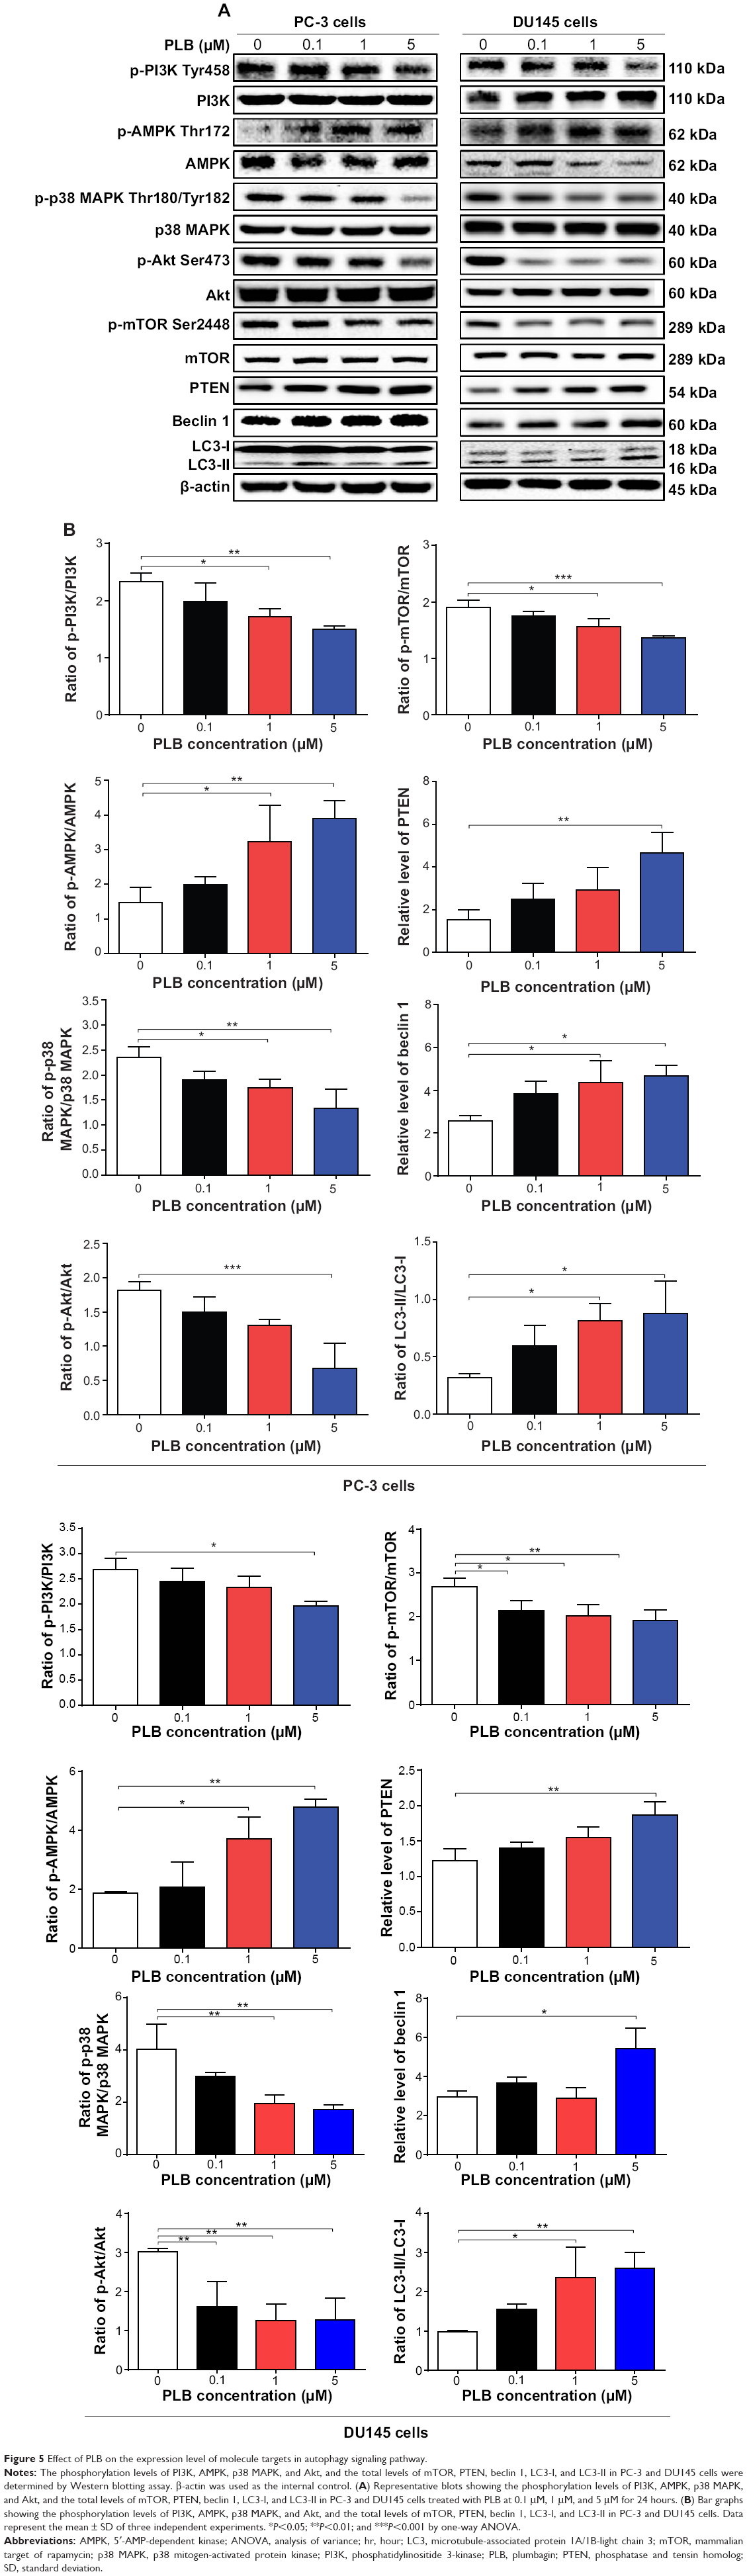 | Figure 5 Effect of PLB on the expression level of molecule targets in autophagy signaling pathway. |
AMPK is highly conserved from yeast to plants and animals and plays a key role in the regulation of energy homeostasis, cell survival, and cell death.31 AMPK is a heterotrimeric complex composed of a catalytic α subunit and regulatory β and γ subunits. The kinase is activated by an elevated AMP/ATP ratio due to cellular and environmental stress, such as heat shock, hypoxia, and ischemia. The tumor suppressor liver kinase B1, in association with accessory proteins STE20-related adaptor protein and calcium-binding protein 39, phosphorylates AMPK at Thr172 in the activation loop, and this phosphorylation is required for AMPK activation.31 Under glucose starvation, AMPK promotes autophagy by directly activating Unc-51-like kinase 1 (ULK1, a homologue of yeast Atg1) through the phosphorylation of Ser317 and Ser777.32 Under nutrient sufficiency, high mTOR activity prevents ULK1 activation by phosphorylating ULK1 Ser757 and disrupting the interaction between ULK1 and AMPK.32 PLB exhibited a promoting effect on the phosphorylation of AMPK at Thr172 in both cell lines (Figure 5A and B). Incubation of PC-3 cells with PLB for 24 hours activated the phosphorylation of AMPK at Thr172 in a concentration-dependent manner. In comparison to the control cells, there was a 1.9-fold increase in the phosphorylation level of AMPK at Thr172 in PC-3 cells when treated with PLB at 1 μM and 5 μM for 24 hours (P<0.05 or 0.01; Figure 5A and B). However, there was no significant change in the expression of total AMPK compared to the control cells. Exposure of DU145 cells to 0.1 μM PLB increased the phosphorylation level of AMPK at Thr172 by 1.3-fold (P<0.05; Figure 5A and B). In comparison to the control cells, treatment of DU145 cells with 1 μM and 5 μM PLB resulted in a 45.4% and 47.1% decrease in the expression level of AMPK, respectively (P<0.05; Figure 5A and B). Of note, with increasing concentration of PLB, an increased ratio of p-AMPK/AMPK was observed in both cell lines. In PC-3 cells, the p-AMPK/AMPK ratio increased from 1.5 at basal level to 2.0, 3.2, and 4.0 when treated with PLB at 0.1 μM, 1 μM, and 5 μM, respectively (P<0.05 or 0.01; Figure 5A and B). Similarly, treatment of DU145 cells with 0.1 μM, 1 μM, and 5 μM PLB resulted in an increase in the ratio of p-AMPK/AMPK from 1.9 at basal level to 2.1, 3.7, and 4.8, respectively (P<0.05; Figure 5A and B).
p38 MAPK regulates cellular responses to cytokines and stress, and thus controls cell differentiation, cell death, cell migration, and invasion.33 It includes four isoforms, namely, p38α, β, γ, and δ. Similar to the stress-activated protein kinase (SAPK)/JNK pathway, p38 MAPK is activated by a variety of cellular stresses including osmotic shock, inflammatory cytokines, lipopolysaccharide, UV light, and growth factors. MAP kinase kinase 3 (MKK3), MKK6, and MKK4 activate p38 MAPK by phosphorylation at Thr180 and Tyr182. Activated p38 MAPK can phosphorylate MAP kinase-activated protein kinase 2, several transcription factors including activating transcription factor, Myc-associated factor X, and myocyte enhancer factor-2, and induce the expression of a number of target genes.33 p38 MAPK plays a dual role as a regulator of cell death, and it can either mediate cell survival or cell death depending not only on the type of stimulus but also in a cell-type-specific manner.34 In contrast to the promoting effects on AMPK phosphorylation at Thr172 by PLB exposure, we observed an inhibitory effect of PLB on the activation of p38 MAPK at Thr180/Tyr182 in both PC-3 and DU145 cells (Figure 5A and B). In PC-3 cells, there was a concentration-dependent inhibition in the phosphorylation of p38 MAPK at Thr180/Tyr182. In comparison to the control cells, there was a 34.4% and 44.7% reduction in the phosphorylation of p38 MAPK at Thr180/Tyr182 in PC-3 cells treated with 1 μM and 5 μM of PLB for 24 hours, respectively (P<0.05; Figure 5A and B). In DU145 cells, a concentration-dependent inhibition of p38 MAPK phosphorylation at Thr180/Tyr182 was also observed with a 27.4% and 24.4% reduction when treated with 1 μM and 5 μM PLB for 24 hours, respectively (P<0.05; Figure 5A and B). Exposure of both cell lines to PLB only slightly increased the expression level of total p38 MAPK. Notably, a decreased ratio of p-p38 MAPK/p38 MAPK was observed in both cell lines with increasing concentration of PLB. In comparison to the control cells, the ratio of p-p38 MAPK/p38 MAPK was decreased from 2.4 at basal level to 1.9, 1.7, and 1.3, when PC-3 cells were treated with PLB at 0.1 μM, 1 μM, and 5 μM, respectively (P<0.05; Figure 5A and B). Incubation of DU145 cells with PLB at 0.1 μM, 1 μM, and 5 μM resulted in a decrease in the ratio of p-p38 MAPK/p38 MAPK from 4.0 at basal level to 3.0, 1.9, and 1.7, respectively (P<0.05; Figure 5A and B). These findings demonstrated that PLB inhibited the phosphorylation of PI3K Tyr199 and p38 MAPK Thr180/Tyr182 but enhanced the phosphorylation of AMPK Thr172 in PC-3 and DU145 cells, contributing to the increase in autophagy flux.
We further examined the regulatory effect of PLB on the phosphorylation of Akt at Ser473 and mTOR at Ser2448 and the expression of PTEN in PC-3 and DU145 cells (Figure 5A and B). Akt is involved in the regulation of various signaling downstream pathways including metabolism, cell proliferation, survival, growth, and angiogenesis.35 As a downstream effector of PI3K, Akt can activate mTOR, while mTORC2 phosphorylates Akt at Ser473 and stimulates Akt phosphorylation at Thr308 by 3-phosphoinositide dependent protein kinase-1 leading to full Akt activation.35 mTOR plays a key role in cell growth, autophagic cell death, and homeostasis.36 mTOR is phosphorylated at Ser2448 via the PI3K/Akt signaling pathway and autophosphorylated at Ser2481.36 mTOR inhibition promotes dissociation of mTOR from the complex of Atg13 with ULK1 and ULK2. This releases ULK1/2 to activate focal adhesion kinase-interacting protein of 200 kDa, a protein critical for autophagosome formation and autophagy initiation.36 PTEN, a dual-specificity phosphatase and tumor suppressor gene, inhibits Akt/mTOR and MAPK signaling, leading to cell death and growth regulation.37 In comparison to the control cells, the phosphorylation level of Akt at Ser473 was decreased by 25.2%, 29.2%, and 40.1% in PC-3 cells with the treatment of PLB at 0.1 μM, 1 μM, and 5 μM for 24 hours, respectively (P<0.01; Figure 5A and B). Similarly, there was a 36.0%, 33.7%, and 42.4% reduction in the phosphorylation level of Akt at Ser473 observed in PLB-treated DU145 cells compared to the control cells (P<0.001; Figure 5A and B). However, there was no significant alteration in the expression of Akt in both cell lines, except for a decrease in the expression level of Akt in PC-3 cells treated with 0.1 μM PLB for 24 hours (P<0.05; Figure 5A and B). However, the ratio of p-Akt/Akt was significantly decreased in both cell lines treated with PLB. In PC-3 cells, the ratio of p-Akt/Akt decreased from 1.8 at basal level to 1.5, 1.3, and 0.7 when cells were treated with PLB at 0.1 μM, 1 μM, and 5 μM for 24 hours, respectively. In DU145 cells, the ratio of p-Akt/Akt decreased from 3.0 to 1.6, 1.3, and 1.3 with the treatment of PLB at 0.1 μM, 1 μM, and 5 μM, respectively (Figure 5A and B).
In addition, the expression level of PTEN, which is the negative regulator of PI3K/Akt signaling pathway, was significantly increased when PC-3 and DU145 cells were treated with 5 μM PLB for 24 hours (P<0.01; Figure 5A and B). Exposure of PC-3 cells to 5 μM PLB resulted in a 36.0% decrease in the phosphorylation level of mTOR at Ser2448 (P<0.05; Figure 5A and B). Treatment of PC-3 cells with 0.1 μM and 1 μM PLB for 24 hours reduced mTOR phosphorylation by 22.2% and 27.1%, respectively, but did not achieve statistical significance. In DU145 cells, there was a 15.5%, 22.4%, and 20.4% reduction in the phosphorylation level of mTOR at Ser2448 when treated with 0.1 μM, 1 μM, and 5 μM PLB for 24 hours, respectively (P<0.001; Figure 5A and B). There was no significant change in the expression of total mTOR in both cell lines when treated with PLB for 24 hours. However, a decreased ratio of p-mTOR/mTOR was observed in both cell lines when treated with increasing concentrations of PLB. In PC-3 cells, the ratio of p-mTOR/mTOR decreased from 1.9 at basal level to 1.7, 1.5, and 1.3 when treated with 0.1 μM, 1 μM, and 5 μM PLB, respectively (P<0.05 or 0.001; Figure 5A and B). In DU145 cells, the ratio of p-mTOR/mTOR decreased from 2.7 at basal level to 0.8, 0.8, and 0.7 with treatment of PLB at 0.1 μM, 1 μM, and 5 μM, respectively (P<0.05 or 0.01; Figure 5A and B).
Next, we examined the effect of PLB on the expression level of beclin 1 and LC3-I/II. Autophagy is tightly regulated by beclin 1 (a mammalian homologue of yeast Atg6), which forms a complex with vacuolar protein sorting 34 (Vps34, also called class III PI3K), and serves as a platform for recruitment of other Atgs that are critical for autophagosome formation.38,39 Upon autophagy initiation, LC3 is cleaved at the C-terminus by Atg4 to form the cytosolic LC3-I.40 LC3-I is consequently proteolytically cleaved and lipidated by Atg3 and Atg7 to form LC3-II, which localizes to the autophagosome membrane. Treatment of PC-3 and DU145 cells with PLB for 24 hours significantly increased the expression of beclin 1 (Figure 5A and B). There was a 1.8-fold increase of beclin 1 in both cell lines treated with 5 μM PLB for 24 hours (P<0.05; Figure 5A and B). Besides, a significant increase in the expression of beclin 1 was observed in PC-3 cells treated with 1 μM PLB for 24 hours.
After 24-hour treatment with PLB, our Western blotting analysis revealed two clear bands of LC3-I and II in PC-3 and DU145 cells (Figure 5A). LC3-II migrated faster than LC3-I on SDS-PAGE, leading to the appearance of two bands after immunoblotting – LC3-I with an apparent mobility of about 18 kDa and LC3-II with an apparent mobility of 16 kDa. In both PC-3 and DU145 cells, there was a concentration-dependent increase in the expression of LC3-II (Figure 5A and B). Compared to the control cells, there was a 1.6-fold and 1.7-fold increase in the LC3-II level in PC-3 cells treated with PLB at 1 μM and 5 μM for 24 hours, respectively. In DU145 cells, 5 μM PLB resulted in a 3.6-fold increase in the expression of LC3-II. In addition, treatment of PC-3 and DU145 cells with PLB decreased the expression of LC3-I, although it was not significantly different. In addition, the ratio of LC3-II to LC3-I remarkably increased 2.7- and 2.8-fold in both cell lines with treatment of PLB at 1 μM and 5 μM, respectively. These findings indicated that PLB exhibited a strong autophagy-inducing effect on PC-3 and DU145 cells via inhibition of the PI3K/Akt/mTOR pathway.
PLB-induced apoptosis and autophagy interact at multiple levels in PC-3 and DU145 cells
To further examine the crosstalk between apoptosis and autophagy in PC-3 and DU145 cells treated with PLB, we simultaneously determined cellular apoptosis and autophagy using a flow cytometer. As shown in Figure 6A, B, and C, the percentage of basal apoptosis and autophagy in both PC-3 and DU145 cells ranged from 2.8% to 4.7%. Incubation of PC-3 cells with PLB induced both apoptosis and autophagy. In DU145 cells, PLB exhibited a predominant effect on autophagy induction. The ratio of autophagy over apoptosis in PC-3 cells treated with PLB was slightly higher than that in the control cells. The sum of apoptosis plus autophagy increased from 9.9% at basal level to 17.0%, 16.9%, and 19.0% when PC-3 cells were treated with 0.1 μM, 1 μM, and 5 μM PLB, respectively. In DU145 cells, 5 μM PLB increased the ratio of autophagy over apoptosis 2.4-fold (P<0.05). The sum of apoptosis plus autophagy increased from 4.9% at basal level to 4.5%, 5.5%, and 14.7% when DU145 cells were treated with 0.1 μM, 1 μM, and 5 μM PLB for 24 hours, respectively (Figure 6A and B). In addition, when the cells were treated with 5 μM for 12 hours, 24 hours, and 48 hours, the sum of apoptosis plus autophagy increased from 9.6% at basal level to 11.8%, 20.6%, and 49.2% in PC-3 cells (Figure 7). In DU145 cells, the value increased from 13.1% at basal level to 17.2%, 14.8%, 17.1%, and 17.6% when cells were treated for 4 hours, 8 hours, 12 hours, and 48 hours, respectively (Figure 7). The ratio of autophagy over apoptosis increased 2.5-, 3.5-, and 3.5-fold when PC-3 cells were treated with 5 μM PLB for 12 hours, 24 hours, and 48 hours, respectively. In DU145 cells, the ratio of autophagy over apoptosis increased 1.3-, 1.9-, 1.8-, and 1.2-fold when PC-3 cells were treated with 5 μM PLB for 4 hours, 8 hours, 12 hours, and 24 hours, respectively (Figure 7).
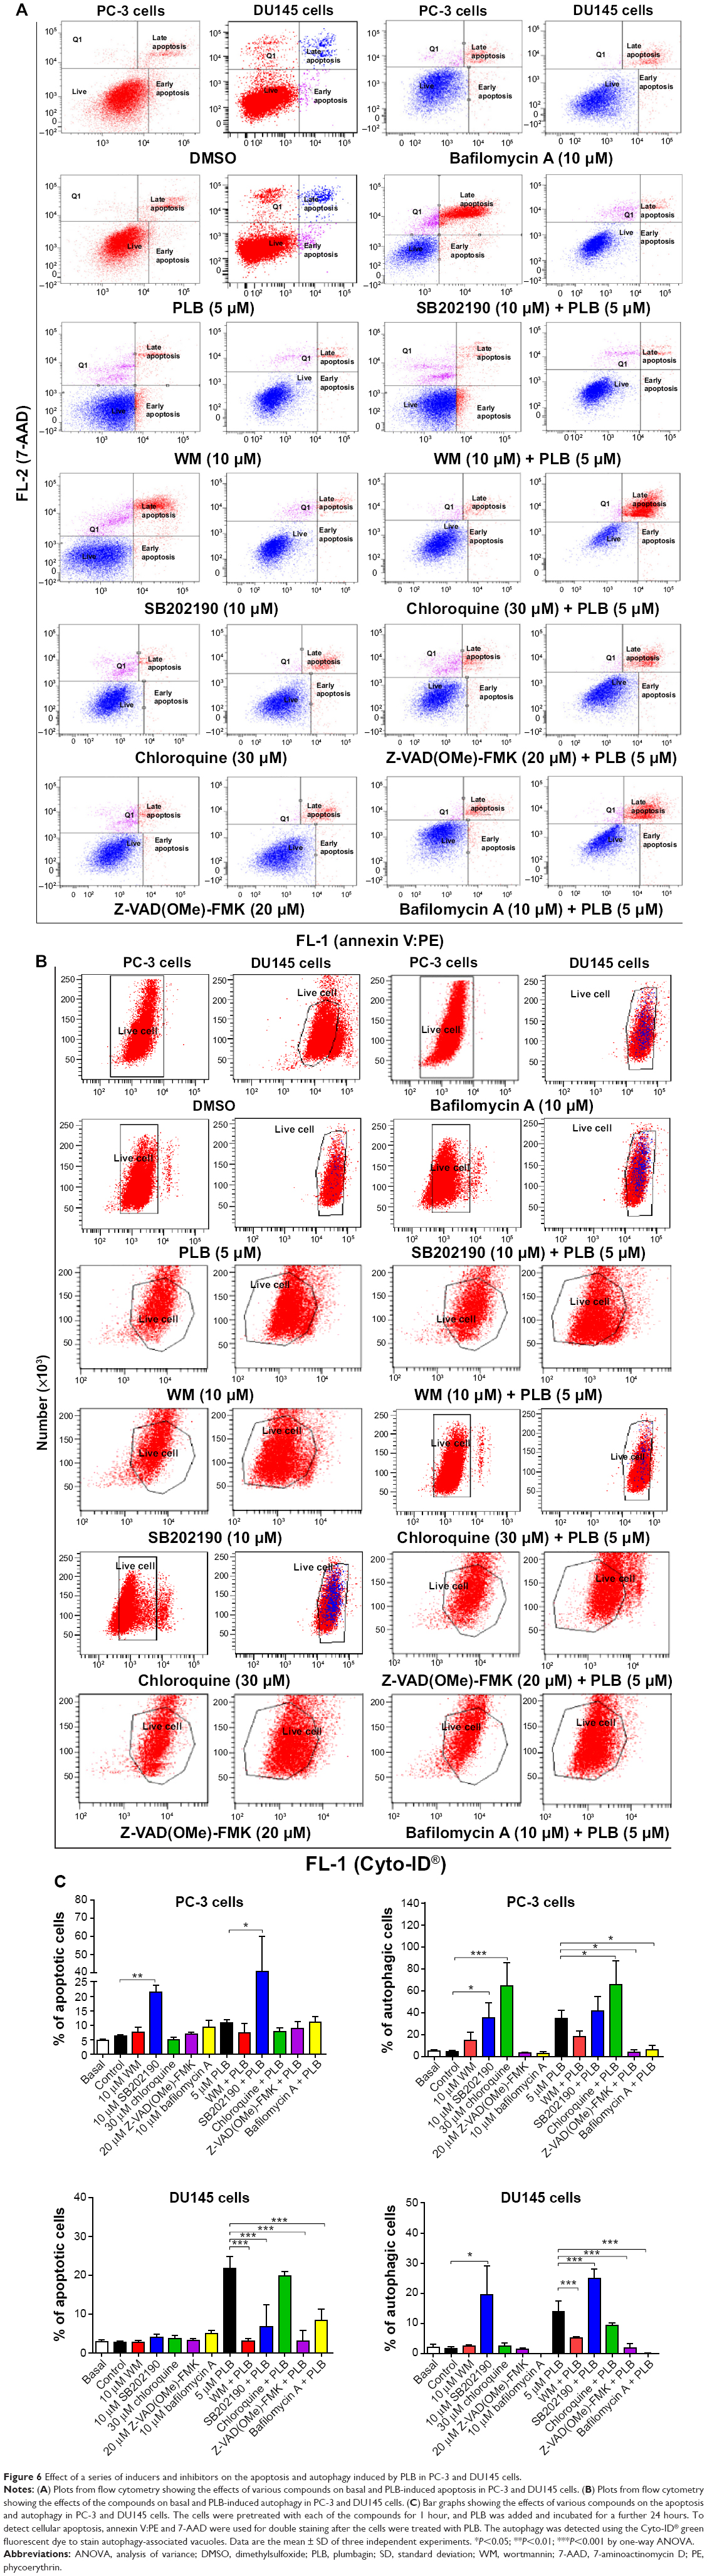 | Figure 6 Effect of a series of inducers and inhibitors on the apoptosis and autophagy induced by PLB in PC-3 and DU145 cells. |
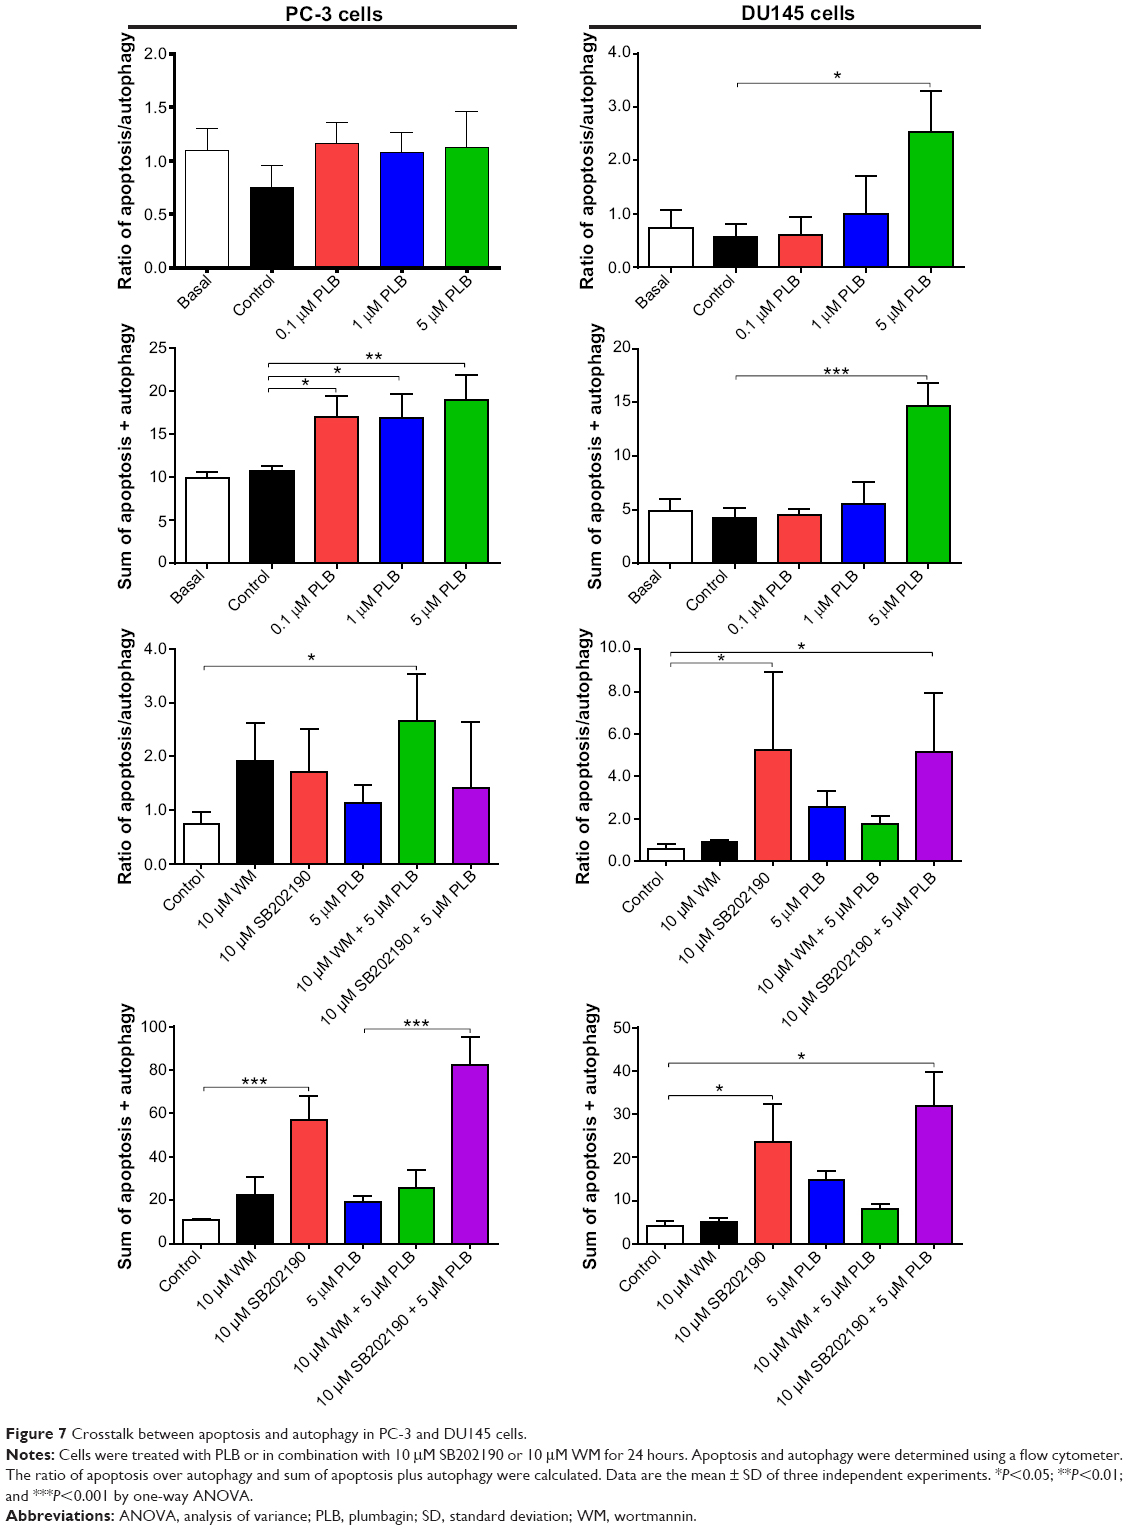 | Figure 7 Crosstalk between apoptosis and autophagy in PC-3 and DU145 cells. |
Next, we evaluated the effect of induction or inhibition of autophagy on basal and PLB-induced apoptosis in PC-3 and DU145 cells. Treatment of PC-3 cells with 10 μM SB202190 (a selective p38 MAPK inhibitor and autophagy inducer) alone for 24 hours significantly induced apoptosis (6.3% vs 21.4%, P<0.001) and 10 μM bafilomycin A1 slightly increased the percentage of apoptosis (9.4%), while incubation of the cells with 10 μM WM (a PI3K inhibitor and autophagy blocker), 20 μM Z-VAD(OMe)-FMK (a pan-caspase inhibitor), or 30 μM chloroquine (an autophagy inhibitor) for 24 hours had no significant effect on the apoptosis of PC-3 cells (Figure 6A). In addition, co-incubation with 10 μM SB202190 significantly increased PLB-induced apoptosis (10.8% vs 40.6%, P<0.001; Figure 6A), whereas treatment of PC-3 cells with 10 μM WM, 30 μM chloroquine, 20 μM Z-VAD(OMe)-FMK, or 10 μM bafilomycin A1 only slightly altered PBL-induced apoptosis. In DU145 cells, treatment with 10 μM WM, 10 μM SB202190, 30 μM chloroquine, 20 μM Z-VAD(OMe)-FMK, or 10 μM bafilomycin A1 alone only slightly increased the apoptosis, while 10 μM WM, 10 μM SB202190, 10 μM bafilomycin A1, or 20 μM Z-VAD(OMe)-FMK significantly suppressed PLB-induced apoptosis. However, chloroquine at 30 μM only slightly decreased PLB-induced apoptosis (Figure 6A).
In PC-3 cells, pretreatment with 10 μM SB202190 or 30 μM chloroquine for 24 hours induced a 7.7- and 14.2-fold increase in basal autophagy compared to the control cells, respectively (P<0.01; Figure 6B and C). Pretreatment with Z-VAD(OMe)-FMK (20 μM) or bafilomycin A1 (10 μM) only slightly decreased the autophagy. Preincubation with SB202190 at 10 μM increased PLB-induced autophagy 3.1-fold in PC-3 cells (P<0.001; Figure 6B and C), while pretreatment with 20 μM Z-VAD(OMe)-FMK or 10 μM bafilomycin A1 significantly reduced PLB-induced autophagy (1.3% and 1.8%, respectively). Chloroquine significantly enhanced PLB-induced autophagy. Pretreatment with WM did not significantly change basal and PLB-induced autophagy in PC-3 cells. In DU145 cells, a similar effect of 10 μM SB202190 pretreatment on basal autophagy was observed (P<0.001). Bafilomycin A1 at 10 μM diminished basal autophagy, but pretreatment with 30 μM chloroquine or 20 μM Z-VAD(OMe)-FMK did not affect basal autophagy. Notably, pretreatment with WM, chloroquine, Z-VAD(OMe)-FMK, or bafilomycin A1 significantly reduced PLB-induced autophagy in DU145 cells (Figure 6B and C). These findings demonstrate that modulation of p38 MAPK by SB202190 and PI3K by WM may alter PLB-induced autophagy and apoptosis in both PC-3 and DU145 cells with differential effects depending on the cell type. Both PC-3 and DU145 cells responded well to the autophagy inducer SB202190, while the autophagy blocker WM increased PLB-induced autophagy in PC-3 cells but suppressed it in DU145 cells.
Preincubation of PC-3 cells with 10 μM WM, 10 μM SB202190, or 30 μM chloroquine induced a 2.6-, 2.3-, and 18.0-fold increase in the ratio of autophagy over apoptosis compared to the control cells, respectively. In comparison to cells treated with 5 μM PLB alone, preincubation of PC-3 cells with 30 μM chloroquine increased the ratio of PLB-induced autophagy over apoptosis 7.6-fold, while pretreatment with WM resulted in a 2.4-fold increase in the ratio of autophagy over apoptosis, although there was no statistical significance. There was a slight change in the ratio of autophagy over apoptosis observed when PC-3 cells were pretreated with 20 μM Z-VAD(OMe)-FMK or 20 μM bafilomycin A1. In DU145 cells, pretreatment with 10 μM SB202190 increased the ratio of autophagy over apoptosis 9.1- and 2.1-fold compared to control cells and PLB-treated cells, respectively. There was no significant effect on basal or PLB-induced ratio of autophagy over apoptosis when treated with 30 μM chloroquine or 20 μM Z-VAD(OMe)-FMK. Of note, pretreatment with 10 μM bafilomycin A1 diminished the basal and PLB-induced ratio of autophagy over apoptosis (Figure 6A, B and C).
In addition, treatment of PC-3 cells with 10 μM WM, 10 μM SB202190, or 30 μM chloroquine alone for 24 hours increased the sum of apoptosis plus autophagy from 10.9% at basal level to 22.4%, 56.8%, and 24.4%, respectively (Figure 6A, B and C). In DU145 cells, the addition of 10 μM SB202190 increased the sum of apoptosis plus autophagy from 4.2% at basal level to 23.6%. There was no significant effect of 10 μM WM, 30 μM chloroquine, 20 μM Z-VAD(OMe)-FMK, and 10 μM bafilomycin A1 on the sum of autophagy plus apoptosis compared to the control cells (Figure 6A, B and C). In comparison to PC-3 cells pretreated with 20 μM 5 μM PLB alone, addition of 10 μM WM or 10 μM WM or SB202190 increased the sum of apoptosis plus autophagy from 19.0% to 25.6%, and 82.3%, respectively (Figure 6A and B). In DU145 cells, pretreatment with 10 μM WM decreased the sum of apoptosis plus autophagy compared to cells treated with 5 μM PLB alone (14.7% vs 8.1%), while pretreatment with SB202190 doubled it (14.7% vs 31.8%) (Figure 6A and B). Addition of 20 μM Z-VAD(OMe)-FMK or 10 μM bafilomycin A1 significantly reduced PLB-induced sum of apoptosis and autophagy (Figure 6A and B). These findings showed that modulation of p38 MAPK by SB202190 and PI3K by WM alters basal and PLB-induced ratio of apoptosis over autophagy and the sum of apoptosis and autophagy in both PC-3 and DU145 cells with differential effects depending on the cell type. Taken together, there are interactions between the apoptotic and autophagic pathways in PC-3 and DU145 cells subjected to PLB treatment.
Sirt1 plays a role in PLB-induced apoptosis and autophagy in PC-3 and DU145 Cells
Sirt1 plays an important role in the regulation of cellular autophagy through two major mechanisms: Sirt1 could influence autophagy directly via its deacetylation of key components of the autophagy induction network, such as Atgs 5, 7, and 8; and nucleus-localized Sirt1 is also known to induce the expression of autophagy pathway components through the activation of FoxO transcription factor family members.41 Therefore, we speculated that PLB might regulate Sirt1 expression in PC-3 and DU145 cells, and examined the effect of PLB on the expression level of Sirt1 in both cell lines. As shown in Figure 8A and B, there was a concentration-dependent reduction in the expression of Sirt1 in PC-3 and DU145 cells. Incubation of PC-3 cells with PLB at 5 μM for 24 hours reduced the expression of Sirt1 by 32.4%; in DU145 cells, treatment with PLB at 0.1 μM, 1 μM, and 5 μM for 24 hours significantly suppressed the expression level of Sirt1 by 39.2%, 45.75%, and 57.1%, respectively (Figure 8A and B). The downregulation of Sirt1 by PLB may partially contribute to its autophagy-inducing effect.
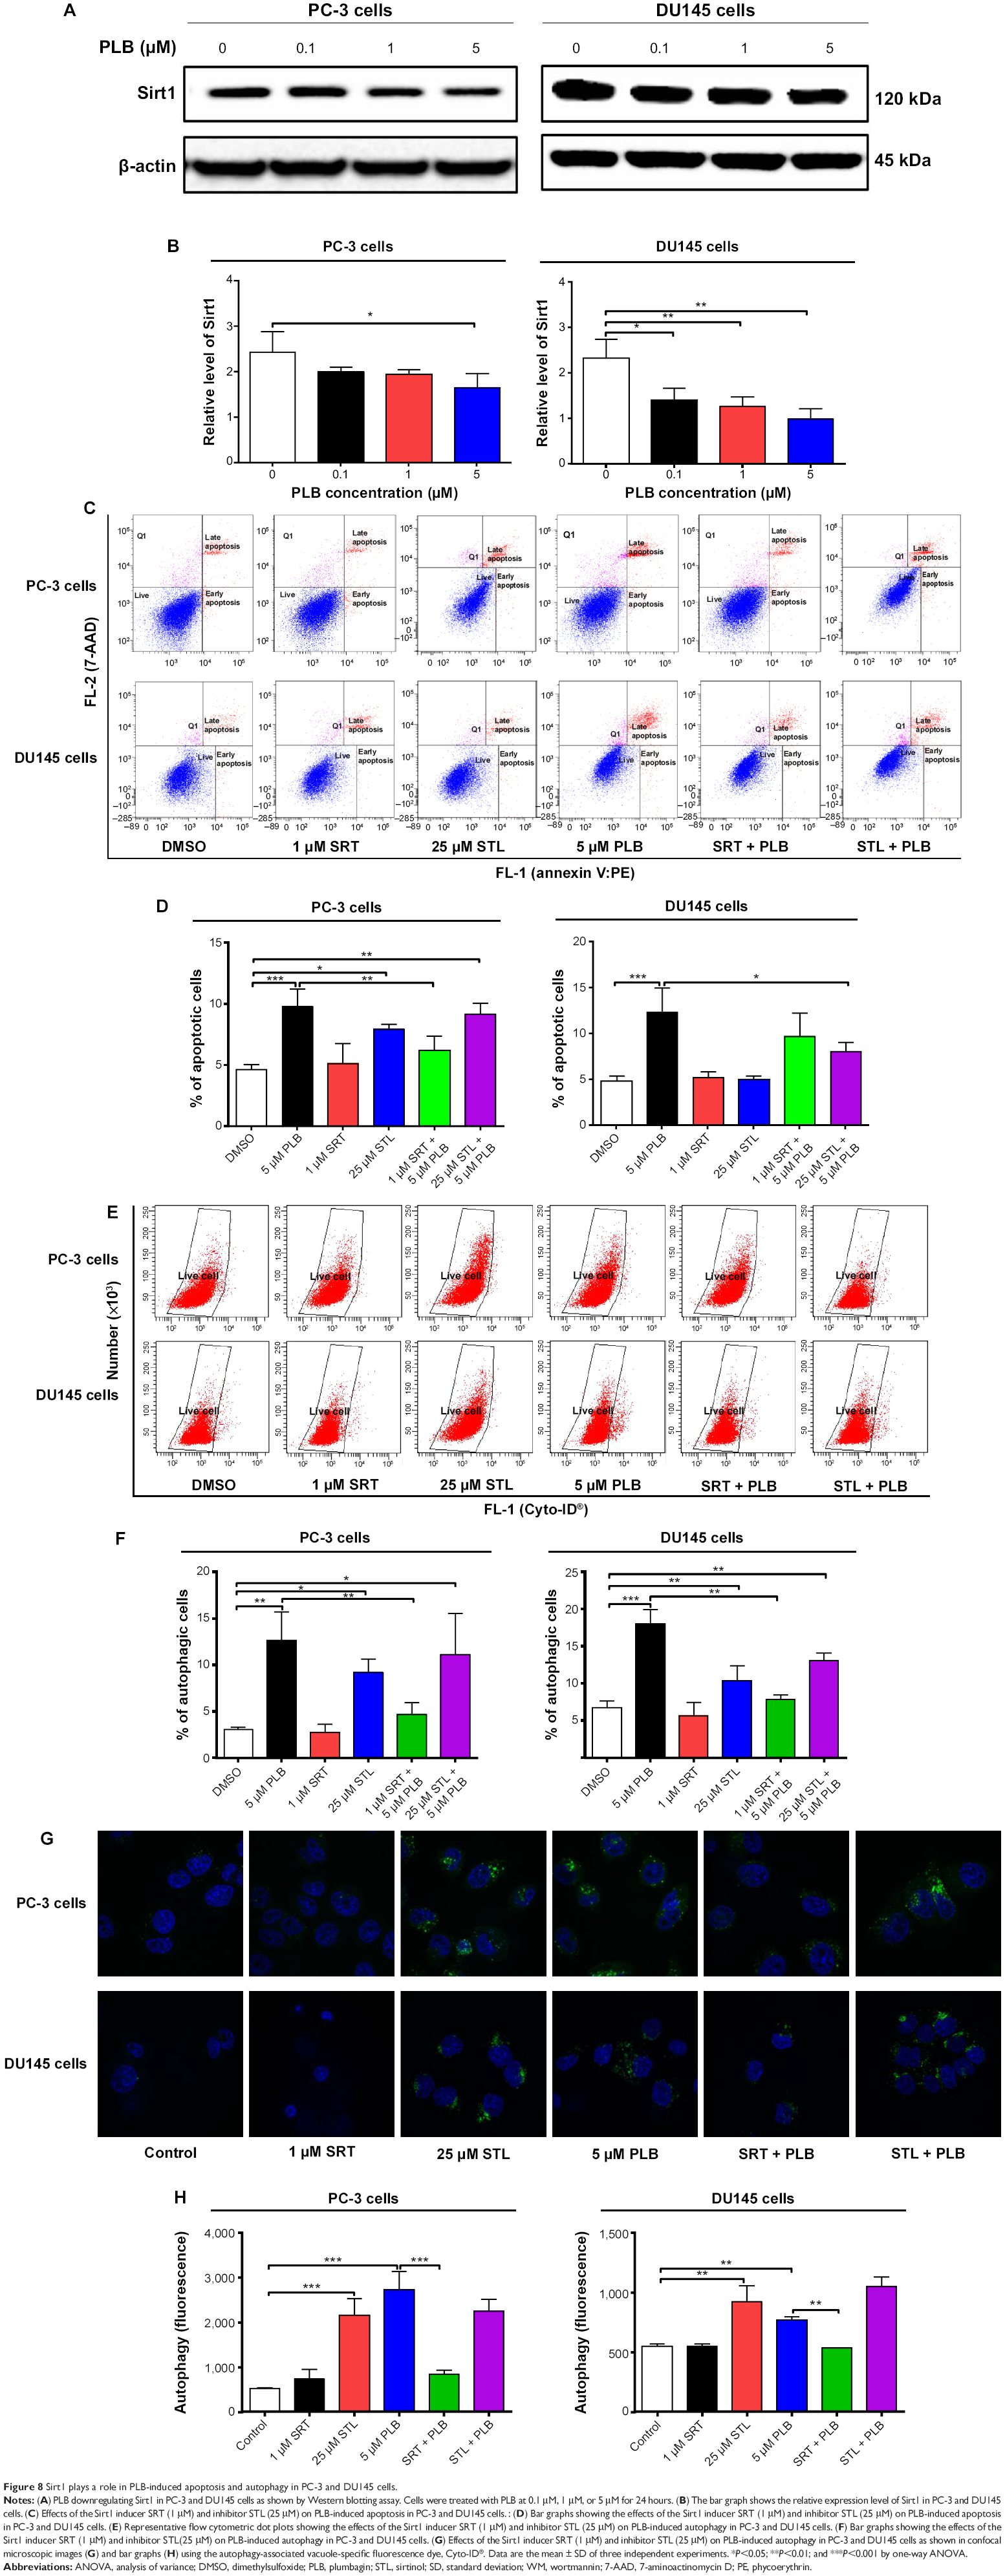 | Figure 8 Sirt1 plays a role in PLB-induced apoptosis and autophagy in PC-3 and DU145 cells. |
Following the observation of the inhibitory effect of PLB on the expression of Sirt1 in PC-3 and DU145 cells, we tested the role of Sirt1 in the apoptosis- and autophagy-inducing effects of PLB on both cell lines using flow cytometry. Known inducer and inhibitor of Sirt1 were used. STL, an inhibitor of Sirt1, increased the percentage of apoptotic PC-3 cells by 1.7-fold compared to the control cells. SRT, an inducer of Sirt1, did not affect the basal apoptosis in PC-3 cells but decreased PLB-induced PC-3 cells’ apoptosis by 36.4%; while STL did not affect PLB-induced apoptosis in PC-3 cells (Figure 8C and D). In DU145 cells, there was no effect of SRT and STL on basal apoptosis, but STL decreased PLB-induced apoptosis by 35.0% (Figure 8C and D). With regard to the involvement of Sirt1 in PLB-induced autophagy in both cells, we observed that SRT did not affect the basal autophagy in both cell lines but STL significantly increased the basal autophagy by 3.0- and 1.6-fold in PC-3 and DU145 cells, respectively (Figure 8E and F). Moreover, SRT remarkably attenuated the autophagy-inducing effect of PLB on PC-3 and DU145 cells by 63.3% and 56.5%, respectively. However, there was no significant effect of STL on PLB-induced autophagy in both cell lines (Figure 8E and F).
We further examined the role of Sirt1 in the autophagy-inducing effect of PLB on PC-3 and DU145 cells using confocal microscopy. STL remarkably increased basal autophagy in PC-3 and DU145 cells by 4.1- and 1.7-fold, respectively (P<0.001; Figure 8G and H). STL only slightly decreased or increased PLB-induced autophagy in PC-3 and DU145 cells. Treatment of cells with SRT did not significantly affect basal autophagy in both cell lines. However, SRT almost abolished PLB-induced autophagy in PC-3 cells (P<0.001; Figure 8G and H). SRT decreased the autophagy induced by PLB in DU145 cells by 30.6%. These results showed that inhibition of Sirt1 significantly enhanced basal autophagy but did not affect PLB-induced autophagic death in PC-3 and DU145 cells. In contrast, induction of Sirt1 suppressed PLB-induced autophagy but did not change the basal autophagy in PC-3 and DU145 cells. Sirt1 played a role in the regulation of autophagy, and upregulation of Sirt1 conferred resistance to PLB-induced autophagy in prostate cancer cells.
PBEF/visfatin plays a role in PLB-induced apoptosis and autophagy in PC-3 and DU145 cells
PBEF/visfatin is involved in the catalysis of nicotinamide with 5-phosphoribosyl-1-pyrophosphate, yielding nicotinamide mononucleotide, which is important in NAD+ biosynthesis.42 This is a rate-limiting step in the NAD+ biosynthesis salvage pathway. NAD+ serves as a substrate for cellular enzymes, including poly(ADP-ribose) polymerase (PARP)-1 and Sirt1. Cancer cells and activated immune cells express high levels of PBEF/visfatin and are highly susceptible to PBEF/visfatin inhibitors.42 It has been reported that FK866 (Apo866, daporinad), a PBEF/visfatin inhibitor with a Ki of 0.4 nM, induces autophagy (but not apoptosis) in multiple myeloma cells.43
Therefore, we examined the effects of PLB exposure on the expression level of PBEF/visfatin in both prostate cancer cell lines. In comparison to the control cells, the expression level of PBEF/visfatin was significantly suppressed by 27.7% and 33.8% by treatment of 1 μM and 5 μM PLB for 24 hours in PC-3 cells, respectively (P<0.01; Figure 9A and B). In DU145 cells, 5 μM PLB significantly decreased the expression level of PBEF/visfatin by 19.1% compared to the control cells (P<0.05; Figure 9A and B). We also examined the role of PBEF/visfatin in the apoptosis- and autophagy-inducing effect of PLB on PC-3 and DU145 cells using flow cytometry. Incubation of PC-3 cells with 25 nM of FK866 increased the basal apoptosis by 3.2-fold compared to the control cells, and FK866 significantly enhanced PLB-induced apoptosis in PC-3 cells with a 3.6-fold increase (Figure 9C and D). In DU145 cells, there was 2.0- and 4.2-fold increase in basal level and PLB-induced apoptosis when cells were treated with 25 nM FK866, respectively. Moreover, there was a 10.5- and 3.7-fold increase in PC-3 cells and 2.9- and 7.3-fold increase in DU145 cells in basal and PLB-induced autophagy, respectively, when treated with 25 nM FK866 (Figure 9E and F). These findings demonstrated that PLB downregulated PBEF/visfatin and thereby inhibited NAD+ biosynthesis, probably contributing to the autophagy-inducing activity of PLB in both PC-3 and DU145 cells.
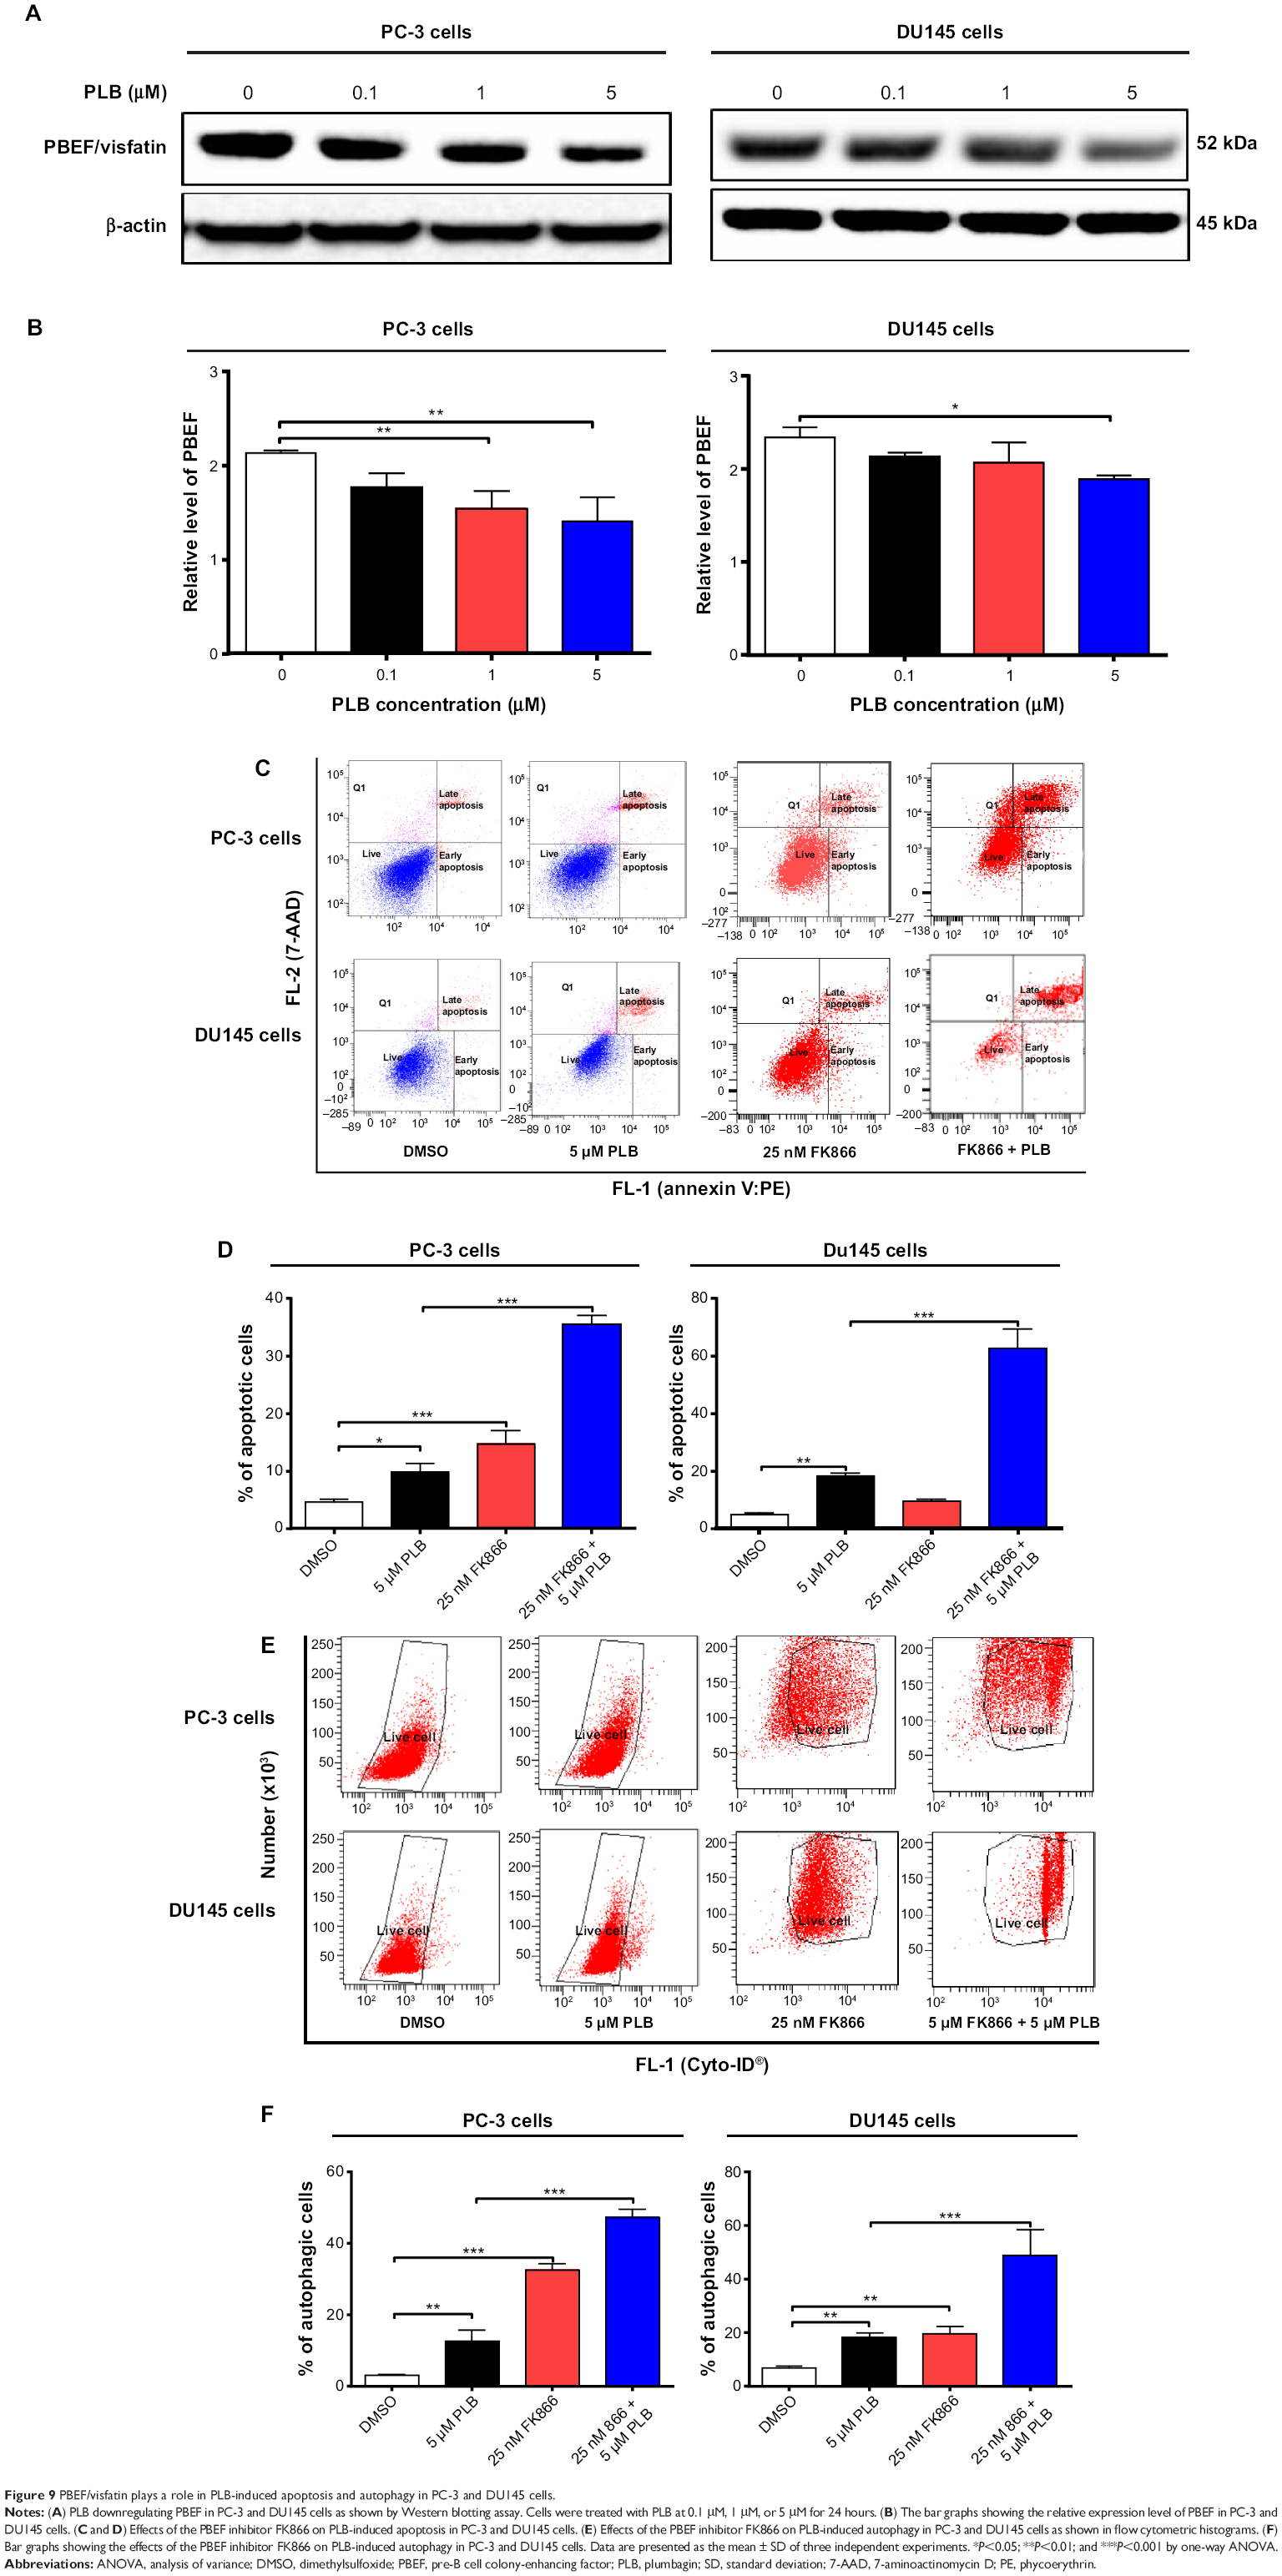 | Figure 9 PBEF/visfatin plays a role in PLB-induced apoptosis and autophagy in PC-3 and DU145 cells. |
Intracellular ROS generation plays a critical role in PLB-induced apoptosis and autophagy in PC-3 and DU145 cells
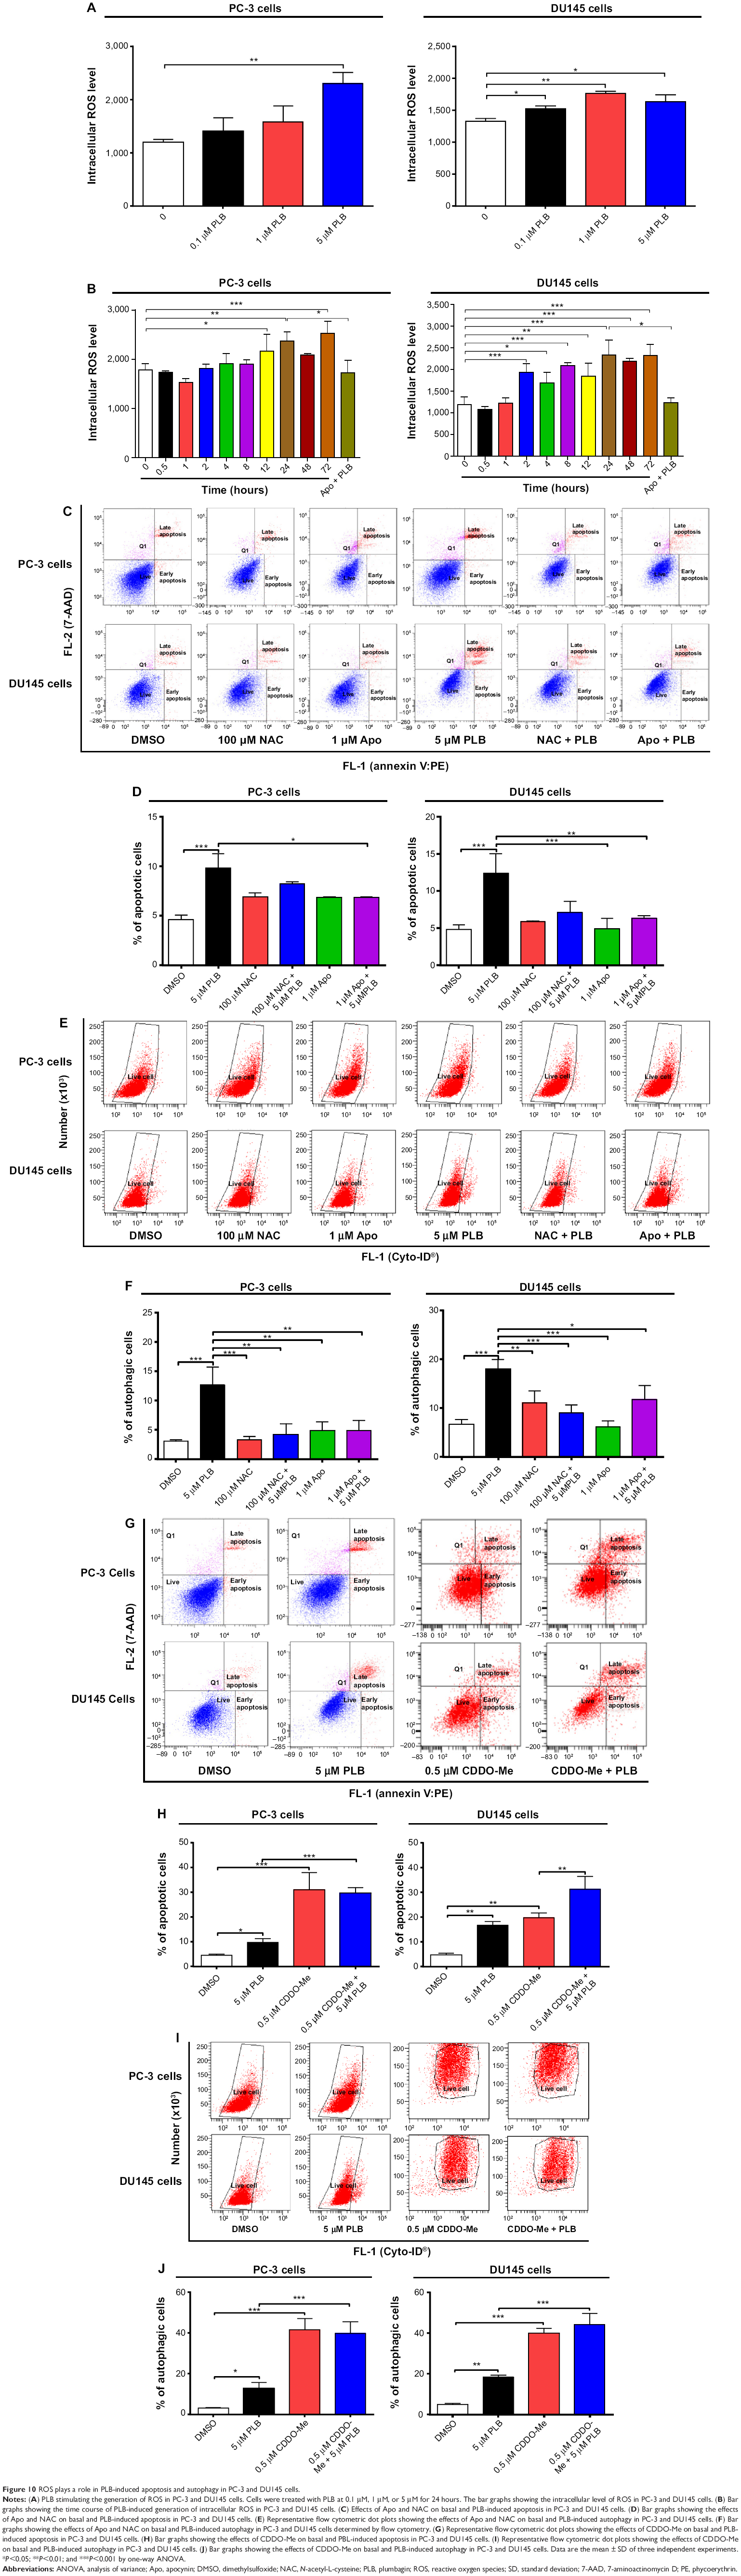
To determine the effect of PLB on intracellular ROS production in PC-3 and DU145 cells, cells were treated with PLB at 0.1 μM, 1 μM, and 5 μM for 24 hours. In PC-3 cells, the intracellular level of ROS was significantly increased in a concentration-dependent manner (Figure 10A). There was a twofold increase in intracellular ROS level at 5 μM of PLB compared to the control PC-3 cells (P<0.01). In DU145 cells, there was a significant increase in intracellular ROS production after PLB treatment at 0.1 μM, 1 μM, and 5 μM for 24 hours (P<0.01; Figure 10A). In addition, co-incubation with 0.1 μM Apo, an NADPH oxidase inhibitor, significantly suppressed intracellular ROS production induced by PLB treatment in both PC-3 and DU145 cells (P<0.05; Figure 10B). In separate experiments, the ROS-inducing effect of PLB on PC-3 and DU145 cells was examined from 0 to 72 hours. There was a time-dependent increase in intracellular ROS production with 5 μM PLB treatment in both cell lines (Figure 10B). Incubation of PC-3 cells with PLB for 12 hours, 24 hours, and 72 hours increased intracellular ROS level by 20.9%, 32.5% and 41.2%, respectively. In DU145 cells, 5 μM PLB resulted in 62.4%, 42.1%, 75.4%, 54.6%, 96.0%, 83.7%, and 95.0% increase for the treatment of 2 hours, 4 hours, 8 hours, 12 hours, 24 hours, 48 hours, and 72 hours (Figure 10B).
 | Figure 10 ROS plays a role in PLB-induced apoptosis and autophagy in PC-3 and DU145 cells. |
Since we observed the effect of PLB on intracellular ROS generation in PC-3 and DU145 cells, we next explored the role of ROS in apoptosis- and autophagy-inducing effect of PLB on both cell lines using flow cytometry. Incubation with 1 μM Apo or 100 μM NAC (an ROS scavenger) did not significantly affect basal apoptosis in both PC-3 and DU145 cells. Incubation with 1 μM Apo significantly suppressed PLB-induced apoptosis in PC-3 cells, and NAC only slightly brought down PLB-induced apoptosis, while both Apo and NAC significantly attenuated the pro-apoptotic effect of PLB in DU145 cells with a 48.8% and 42.3% reduction, respectively (Figure 10C and D). Moreover, treatment with Apo or NAC significantly reduced PLB-induced autophagy in both cell lines but without significant effect on basal autophagy (Figure 10E and F). In PC-3 cells, Apo and NAC decreased PLB-induced autophagy by 61.6% and 66.7%, respectively. In DU145 cells, treatment with Apo and NAC reduced PLB-induced autophagy by 34.6% and 49.7%, respectively (Figure 10E and F).
In addition, the effect of CDDO-Me on basal and PLB-induced apoptosis and autophagy in PC-3 and DU145 cells was investigated. CDDO is a synthetic oleanane triterpenoid and CDDO-Me is its C-28 methyl ester, and both act as Nrf2 activators and induce differentiation, growth inhibition, and apoptosis in various cancer cells and inhibit tumor growth in animal models.44–46 Incubation with 0.5 μM CDDO-Me significantly increased the basal apoptotic and autophagic death of PC-3 and DU145 cells (Figure 10G and H). Moreover, treatment of PC-3 and DU145 cells with CDDO-Me significantly enhanced the pro-apoptotic and pro-autophagic activities of PLB (Figure 10G and H). These results indicated that PLB induced the generation of ROS in both PC-3 and DU145 cells and that the inducing effect of PLB on intracellular ROS generation could be ascribed, at least in part, to NADPH oxidase and PBEF/visfatin activity in PC-3 and DU145 cells.
Discussion
Treatment of advanced prostate cancer remains a major challenge because of poor efficacy of current therapies and chemotherapy. There is an increased interest in seeking new, effective drugs for prostate cancer based on natural compounds. PLB has been found to exhibit anticancer activities in vitro and in vivo, which are attributed to its effects on multiple signaling pathways related to apoptosis, autophagy, and ROS generation.13–17,19,20,47–49 In this benchmarking study, we found that PLB promoted cell apoptosis and autophagy via PI3K/Akt/mTOR-mediated pathway and that Sirt1 was involved in the apoptosis- and autophagy-inducing effects of PLB in both PC-3 and DU145 cells.
Apoptosis is executed by members of the caspase family of cysteine proteases, which can be activated by two main pathways: the extrinsic death receptor pathway, and the intrinsic mitochondria/cytochrome c-mediated pathway.9,28 The two pathways are linked, and both trigger the activation of caspases 3, 6, and 7. In the death receptor pathway, binding of extracellular death ligands to members of the tumor necrosis factor and nerve growth factor receptor superfamily induces activation of caspase 8, which in turn activates caspases 3 and 7, resulting in further caspase activation events and finally cell death.9,28 The pro-apoptotic effect of PLB has been reported in various cancer cell lines from non-small-cell lung cancer (NSCLC), breast cancer, melanoma, and leukemia.16,17,19 In the present study, we observed a concentration-dependent apoptosis induced by PLB in PC-3 and DU145 cells. It is known that mitochondrial disruption and the subsequent release of cytochrome c initiates the process of apoptosis.9 The release of cytochrome c from the mitochondria was initiated by pro-apoptotic members of the Bcl-2 family but antagonized by anti-apoptotic members of this family. Ant-apoptotic members of Bcl-2 can be inhibited by posttranslational modification and/or by increased expression of PUMA, which is an essential regulator of p53-mediated cell apoptosis.9 In addition, the cytosolic cytochrome c released from mitochondria following an apoptotic stimulus serves as a main trigger of caspase enzyme activation.9 In our study, we found that the cytosolic level of cytochrome c was significantly increased after PLB treatment, which subsequently activated caspase 9. Activated caspase 9 in turn activated caspase 3. The activated caspase 3 ultimately induced apoptosis with a decrease in Bcl-2 level. Moreover, we noted a concentration-dependent increase in the expression of PUMA in PC-3 and DU145 cells. These results indicate that PLB induces mitochondria-dependent apoptosis in both PC-3 and DU145 cells with the involvement of p53. Of note, there was a discrepancy between the dose–response effect and time course of PLB on DU145 cells. This discrepancy may be ascribed, at least in part, to the different passages and batches of DU145 cells used for separate experiments. As shown in Figure 2, the basal level of apoptosis for the dose–response effect and time course was different. In the time-course experiments, the basal level was twofold more than that in the dose–response experiment. However, the statistical result did not show any significant difference between two different experiments.
Autophagy (also known as type II cell death) is a primary morphologically distinctive mode of programmed cell death, which is an important conserved catabolic process involving the engulfment and degradation of nonessential or abnormal cellular organelles and proteins in living cells.10,11 Autophagy has been known to promote cellular survival during nutrient depletion and is essential for maintaining cellular hemostasis by degrading damaged organelles and proteins.10,11,50 This complicated process is executed through a multistep intracellular membrane/vesicle reorganization to form double-membraned autophagosomes that fuse with lysosome to form autophagolysosomes, which in turn degrade the contents via acidic lysosomal hydrolases. The PI3K/Akt/mTOR signaling pathway is a central pathway promoting cell growth, motility, protein synthesis, survival, and metabolism in response to hormones, growth factors, and nutrients.9,28,51 PI3K activates the serine/threonine kinase Akt, which in turn through a cascade of regulators results in the phosphorylation and activation of the serine/threonine kinase mTOR.51 Targeting apoptosis and autophagy concurrently has emerged as a potential approach in prostate cancer treatment.52 In this study, PLB induced autophagy in both PC-3 and DU145 cells, which may contribute to its anticancer activity. In fact, previous studies have shown the autophagy-inducing effect of PLB in various cancer cell lines via the regulation of the PI3K/Akt/mTOR axis.19,53 Moreover, our previous study had revealed that PLB predominantly induced autophagy rather than apoptosis, through inhibition of PI3K/Akt/mTOR pathway in NSCLC cells.19 In the present study, we also observed that the autophagy-inducing effect of PLB overweighed the apoptosis-inducing effect of PLB. The inhibition of PI3K/Akt/mTOR contributes to the autophagy-inducing effect of PLB in PC-3 and DU145 cells. Although the role of autophagy in cancer is multifaceted, which can function as a tumor suppressor at early stage of tumor development, it can also be used by cancer cells as a cytoprotection mechanism to promote survival in established tumors.10,11
AMPK, the master energy sensor, is an important regulator of cell death under various conditions, through activation JNK and p53 and inhibition of mTOR.11 In the present study, there was a significant activation of AMPK with PLB treatment, which may contribute to the inhibition of mTOR. Previous studies have demonstrated that a number of compounds including incristine, taxol, temozolomide, doxorubicin, ursolic acid, honokiol, quercetin, and fisetin can activate AMPK to promote cancer cell apoptosis and autophagy. ROS is known to activate AMPK. In our study, we observed a concentration-dependent increase in intracellular ROS generation, which may be a contributing factor to the activation of AMPK in PC-3 and DU145 cells. Furthermore, PLB significantly suppressed the phosphorylation of p38 MAPK. SB202190, a p38 MAPK inhibitor, remarkably increased the apoptotic and autophagic cell death. p38 MAPK is responsive to stress stimuli such as cytokines, ultraviolet irradiation, heat shock, and osmotic shock, and regulates cell differentiation, apoptosis, and autophagy.9,11 Moreover, it has been reported that p38 MAPK inhibitor-induced p38 MAPK inhibition is not sufficient for the autophagic response, indicating that other autophagy-related signaling pathways are regulated by the p38 MAPK inhibitor.54 Taken together, both AMPK and p38 MAPK may play an important role in PLB-induced prostate cancer cell autophagy.
It has been shown that PLB increased the intracellular level of ROS, contributing to the cell death observed in various cancer cell lines.16,17,19 In this study, we found a significant inducing effect of PLB on ROS generation in PC-3 and DU145 cells. However, the mechanism of how PLB induces ROS generation is unclear. The quinone core in PLB has the capability to transfer electrons in the mitochondria respiratory pathways.13 NADPH oxidase is the major intracellular enzymatic source of ROS, which can be a potential target of PLB. In the present study, we observed that pretreatment with Apo, an NADPH oxidase inhibitor, significantly suppressed PLB-induced intracellular ROS level in PC-3 and DU145 cells. This result suggests that PLB may upregulate NADPH oxidase activity or expression to exhibit its capability of inducing ROS generation. Moreover, we also examined the role of ROS in PLB-induced apoptosis and autophagy in PC-3 and DU145 cells. Our results showed that NAC (an ROS scavenger) and Apo attenuated the apoptosis- and autophagy-inducing effect of PLB on PC-3 and DU145 cells, which suggests that PLB-induced ROS generation contributed, at least partially, to the apoptotic and autophagic effect of PLB. In addition, the effect of CDDO-Me, a Nrf2 activator, on cell apoptosis and autophagy was examined. It has been reported that the ROS generation-inducing effect of CDDO-Me explains, at least in part, the potent growth inhibitory and pro-apoptotic activities in various cancer cells.44–46 In the present study, we observed that the CDDO-Me significantly induced apoptosis and autophagy in both PC-3 and DU145 cells and enhanced PLB-induced apoptosis and autophagy in DU145 cells. Taken together, it indicates that ROS has an important role in PLB-induced apoptosis and autophagy in PC-3 and DU145 cells. However, further studies are needed to elucidate how PLB induces ROS generation and modulates redox homeostasis.
Sirt1 is an NAD+-dependent DNA repair enzyme originally discovered in yeast (Sir2), and is involved in a myriad of cellular processes.12 Recently, studies have shown that Sirt1 has an important role in the regulation of apoptosis and autophagy and that Sirt1 deacetylates both histone and non-histone proteins, such as p53 and FoxOs.12 Deacetylation of p53 and inhibition of p53-regulated cell death indicate Sirt1 is a negative regulator of p53.12 In the present study, the inducer of Sirt1, namely, SRT, abolished the autophagic effect of PLB in PC-3 and DU145, whereas the inhibitor of Sirt1, namely, STL, enhanced the autophagic effect of PLB in both cell lines. Sirt1 can affect autophagy via directly regulating the autophagy machinery, including deacetylation of Atg5, Atg7, and Atg8.55 Moreover, we found that PLB significantly decreased the expression level of Sirt1 and PBEF. PBEF, a rate limiting enzyme responsible for the NAD+ biosynthesis pathway, plays an essential role in the regulation of Sirt1 activation.56 Taken together, PLB-induced cell apoptosis and autophagy in prostate cancer cells may be via a Sirt1-mediated pathway.
The crosstalk between apoptosis and autophagy is very perplexing. It has been showed that autophagy has cytoprotective effect and negatively regulates apoptosis under physiological condition. On the contrary, apoptosis inhibits the process of autophagy. Mitochondria play an essential role in the process of apoptosis and autophagy. Mitochondrial dysfunction and loss of mitochondrial membrane potential lead to the release of pro-apoptotic molecules, which in turn initiate the process of apoptosis. However, autophagy can, to some extent, eliminate the dysfunctional mitochondria. In the present study, the crosstalk between apoptosis and autophagy was also tested. We used bafilomycin A1 (an autophagy inhibitor inhibiting fusion between autophagosomes and lysosomes), chloroquine (an autophagy inhibitor inhibiting endosomal acidification), SB202190 (a selective inhibitor of p38 MAPK used as an autophagy inducer), WM (a blocker of autophagosome formation), and Z-VAD(OMe)-FMK (an irreversible pan-caspase inhibitor) to examine the crosstalk between apoptosis and autophagy. The results showed similar regulatory effects of these chemical modulators on apoptosis and autophagy in PC-3 and DU145 cells.
Moreover, we have found that the PLB exerted both apoptosis- and autophagy-inducing effects in PC-3 and DU145 cells, with the former being less important. Inhibition or induction of autophagy inhibited PLB-induced apoptosis. We speculate that these two key processes of cell death initiated by PLB can be coordinated by some important molecules including ROS, Sirt1, p53, beclin 1, and Akt. PLB can induce apoptosis and autophagy in a coordinated manner. The two cell death pathways can interact at multiple levels and signaling pathways, eg, via PI3K/Akt/mTOR, p38 MAPK, AMPK, p53, and ROS-associated pathways, when cancer cells are exposed to PLB. From a standpoint of optimized cancer therapy, PLB can serve as a promising anticancer agent that targets both apoptosis and autophagy.
Our study has indicated that PLB downregulates the expression of PBEF/visfatin in PC-3 and DU145 cells. In mammals, NAD+ is replenished from nicotinamide, tryptophan, or nicotinic acid, with PBEF/visfatin being the rate-limiting enzyme in NAD+ synthesis from nicotinamide.42 The expression of this enzyme is upregulated in activated immune cells and often overexpressed in tumor cells, which show a significant dependence on NAD+ in rapid cell proliferation.42 FK866, a specific chemical inhibitor of PBEF/visfatin, exhibits a broad antitumor activity both in vitro and in vivo against cell lines derived from several tumors.57 In the present study, we found that inhibition of PBEF/visfatin by FK866 dramatically increased the apoptosis and autophagy in PC-3 and DU145 cells. Furthermore, the inhibition of PBEF/visfatin by FK866 significantly enhanced PLB-induced apoptosis and autophagy in both cell lines. Taken together, PLB appears to suppress this enzyme and thus reduce the biosynthesis of NAD+, contributing to PLB-induced cell death.
In summary, we dissected the potential molecular mechanisms of PLB for its anticancer effect in human prostate cancer PC-3 and DU145 cells. The action of PLB was mainly related to ROS generation, mitochondria function, apoptosis, and autophagy and their associated signaling pathways. PLB increased the intracellular level of ROS, activated mitochondria-dependent apoptotic pathway, and induced autophagy in PC-3 and DU145 cells. PLB induced the inhibition of PI3K/Akt/mTOR and p38 MAPK signaling pathways and activation of AMPK, contributing to the autophagy-inducing activities of PLB. Modulation of autophagy altered basal and PLB-induced apoptosis in both cell lines. PLB also downregulated PBEF/visfatin, and inhibition of PBEF/visfatin significantly enhanced basal and PLB-induced apoptosis and autophagy in both cell lines. Moreover, reduction of intracellular ROS level attenuated the apoptosis- and autophagy-inducing effects of PLB on both PC-3 and DU145 cells. PLB may represent a new anticancer drug that can kill prostate cancer cells (Figure 11). More studies are needed to reveal the underlying mechanisms and other potential targets of PLB in the treatment of prostate cancer.
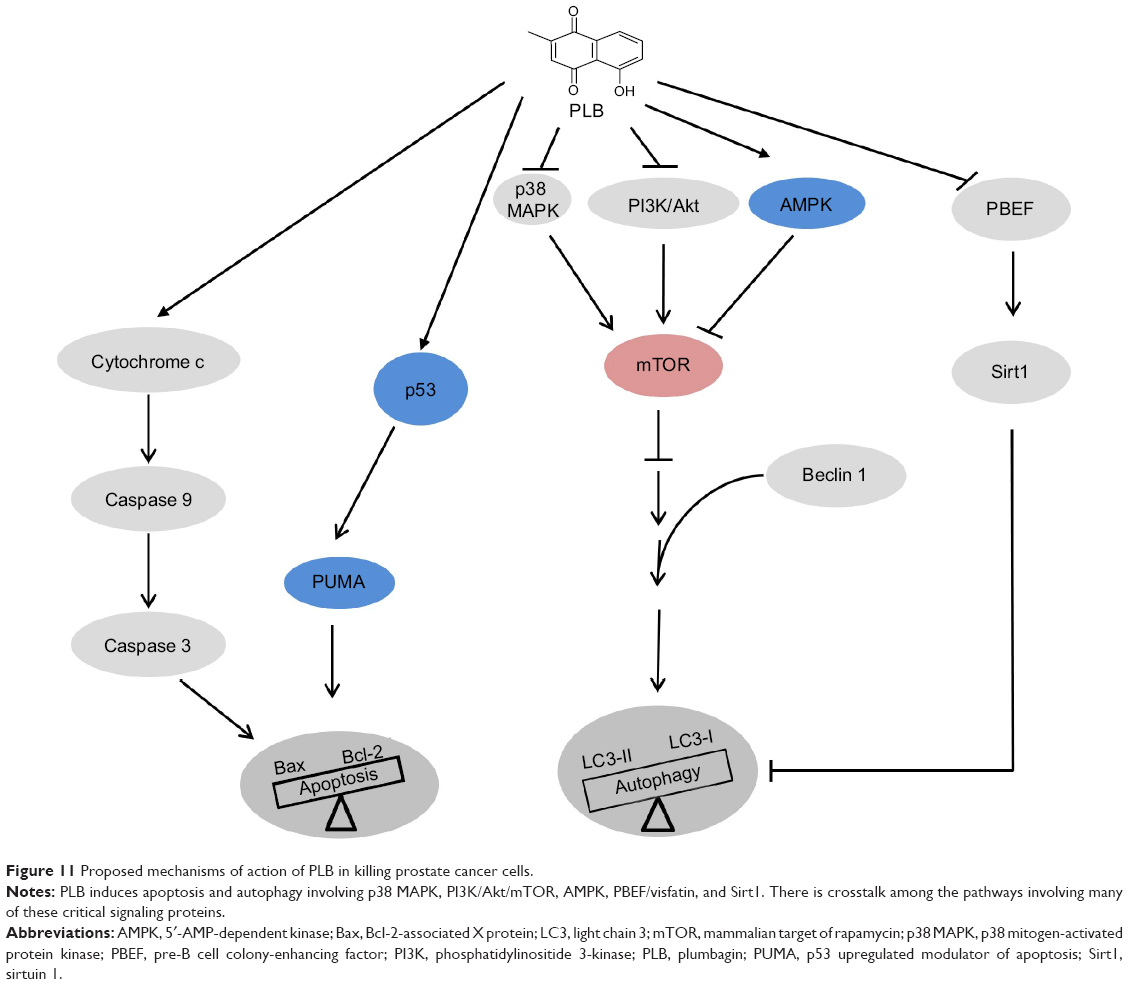 | Figure 11 Proposed mechanisms of action of PLB in killing prostate cancer cells. |
Acknowledgments
The authors appreciate the financial support from the Startup Funds of the College of Pharmacy, University of South Florida, Tampa, Florida, USA. Dr Zhi-Wei Zhou is a holder of a postdoctoral scholarship from the College of Pharmacy, University of South Florida, Tampa, Florida, USA.
Disclosure
The authors declare no conflicts of interest in this work.
References
Siegel R, Naishadham D, Jemal A. Cancer statistics, 2013. CA Cancer J Clin. 2013;63(1):11–30. | ||
Ahmed HU. Prostate cancer: time for active surveillance of intermediate-risk disease? Nat Rev Urol. 2013;10(1):6–8. | ||
American Cancer Society. Global Cancer Facts and Figures. Atlanta: American Cancer Society; 2011. | ||
U.S., Cancer Statistics Working Group, United States cancer statistics: 1999–2011 incidence and mortality web-based report, Centers for Disease Control and Prevention and National Cancer Institute. 2014; Atlanta, GA. | ||
Cancer mortality statistics: Cancer mortality for common cancers. London: Cancer Research UK [updated September 15, 2014]. Available from: http://www.cancerresearchuk.org/cancer-info/cancerstats/mortality/cancerdeaths/uk-cancer-mortality-statistics-for-common-cancers#Ten. Accessed November 6, 2014. | ||
Saylor PJ. Prostate cancer: the androgen receptor remains front and centre. Nat Rev Clin Oncol. 2013;10(3):126–128. | ||
Wen S, Niu Y, Lee SO, Chang C. Androgen receptor (AR) positive vs negative roles in prostate cancer cell deaths including apoptosis, anoikis, entosis, necrosis and autophagic cell death. Cancer Treat Rev. 2014; 40(1):31–40. | ||
Giatromanolaki A, Sivridis E, Mendrinos S, Koutsopoulos AV, Koukourakis MI. Autophagy proteins in prostate cancer: relation with anaerobic metabolism and Gleason score. Urol Oncol. 2014;32(1):e11–e18. | ||
Taylor RC, Cullen SP, Martin SJ. Apoptosis: controlled demolition at the cellular level. Nat Rev Mol Cell Biol. 2008;9(3):231–241. | ||
Klionsky DJ, Emr SD. Autophagy as a regulated pathway of cellular degradation. Science. 2000;290(5497):1717–1721. | ||
Denton D, Nicolson S, Kumar S. Cell death by autophagy: facts and apparent artefacts. Cell Death Differ. 2012;19(1):87–95. | ||
Preyat N, Leo O. Sirtuin deacylases: a molecular link between metabolism and immunity. J Leukoc Biol. 2013;93(5):669–680. | ||
Padhye S, Dandawate P, Yusufi M, Ahmad A, Sarkar FH. Perspectives on medicinal properties of plumbagin and its analogs. Med Res Rev. 2012;32(6):1131–1158. | ||
Subramaniya BR, Srinivasan G, Sadullah SS, et al. Apoptosis inducing effect of plumbagin on colonic cancer cells depends on expression of COX-2. PLoS One. 2011;6(4):e18695. | ||
Nazeem S, Azmi AS, Hanif S, et al. Plumbagin induces cell death through a copper-redox cycle mechanism in human cancer cells. Mutagenesis. 2009;24(5):413–418. | ||
Xu KH, Lu DP. Plumbagin induces ROS-mediated apoptosis in human promyelocytic leukemia cells in vivo. Leuk Res. 2010;34(5):658–665. | ||
Sun J, McKallip RJ. Plumbagin treatment leads to apoptosis in human K562 leukemia cells through increased ROS and elevated TRAIL receptor expression. Leuk Res. 2011;35(10):1402–1408. | ||
Shieh JM, Chiang TA, Chang WT, et al. Plumbagin inhibits TPA-induced MMP-2 and u-PA expressions by reducing binding activities of NF-κB and AP-1 via ERK signaling pathway in A549 human lung cancer cells. Mol Cell Biochem. 2010;335(1–2):181–193. | ||
Li YC, He SM, He ZX, et al. Plumbagin induces apoptotic and autophagic cell death through inhibition of the PI3K/Akt/mTOR pathway in human non-small cell lung cancer cells. Cancer Lett. 2014;344(2):239–259. | ||
Sinha S, Pal K, Elkhanany A, et al. Plumbagin inhibits tumorigenesis and angiogenesis of ovarian cancer cells in vivo. Int J Cancer. 2013;132(5): 1201–1212. | ||
Checker R, Gambhir L, Sharma D, Kumar M, Sandur SK. Plumbagin induces apoptosis in lymphoma cells via oxidative stress mediated glutathionylation and inhibition of mitogen-activated protein kinase phosphatases (MKP1/2). Cancer Lett. 2015;357(1):265–278. | ||
Aziz MH, Dreckschmidt NE, Verma AK. Plumbagin, a medicinal plant-derived naphthoquinone, is a novel inhibitor of the growth and invasion of hormone-refractory prostate cancer. Cancer Res. 2008;68(21): 9024–9032. | ||
Powolny AA, Singh SV. Plumbagin-induced apoptosis in human prostate cancer cells is associated with modulation of cellular redox status and generation of reactive oxygen species. Pharm Res. 2008;25(9):2171–2180. | ||
Abedinpour P, Baron VT, Chrastina A, Welsh J, Borgstrom P. The combination of plumbagin with androgen withdrawal causes profound regression of prostate tumors in vivo. Prostate. 2013;73(5):489–499. | ||
Qiu JX, Zhou ZW, He ZX, et al. Plumbagin elicits differential proteomic responses mainly involving cell cycle, apoptosis, autophagy, and epithelial to mesenchymal transition pathways in human prostate cancer PC-3 and DU145 cells. Drug Des Devel Ther. 2015;9:349–417. | ||
Alimirah F, Chen J, Basrawala Z, Xin H, Choubey D. DU-145 and PC-3 human prostate cancer cell lines express androgen receptor: implications for the androgen receptor functions and regulation. FEBS Lett. 2006;580(9):2294–2300. | ||
Ouyang DY, Xu LH, He XH, et al. Autophagy is differentially induced in prostate cancer LNCaP, DU145 and PC-3 cells via distinct splicing profiles of ATG5. Autophagy. 2013;9(1):20–32. | ||
Estaquier J, Vallette F, Vayssiere JL, Mignotte B. The mitochondrial pathways of apoptosis. Adv Exp Med Biol. 2012;942:157–183. | ||
Li P, Nijhawan D, Budihardjo I, et al. Cytochrome c and dATP-dependent formation of Apaf-1/caspase-9 complex initiates an apoptotic protease cascade. Cell. 1997;91(4):479–489. | ||
Cantley LC. The phosphoinositide 3-kinase pathway. Science. 2002;296(5573):1655–1657. | ||
Dunlop EA, Tee AR. The kinase triad, AMPK, mTORC1 and ULK1, maintains energy and nutrient homoeostasis. Biochem Soc Trans. 2013;41(4):939–943. | ||
Kim J, Kundu M, Viollet B, Guan KL. AMPK and mTOR regulate autophagy through direct phosphorylation of Ulk1. Nat Cell Biol. 2011;13(2):132–141. | ||
Arthur JS, Ley SC. Mitogen-activated protein kinases in innate immunity. Nat Rev Immunol. 2013;13(9):679–692. | ||
Koul HK, Pal M, Koul S. Role of p38 MAP kinase signal transduction in solid tumors. Genes Cancer. 2013;4(9–10):342–359. | ||
Zhang X, Tang N, Hadden TJ, Rishi AK. Akt, FoxO and regulation of apoptosis. Biochim Biophys Acta. 2011;1813(11):1978–1986. | ||
Rabinowitz JD, White E. Autophagy and metabolism. Science. 2010;330(6009):1344–1348. | ||
Mester J, Eng C. When overgrowth bumps into cancer: the PTEN-opathies. Am J Med Genet C Semin Med Genet. 2013;163C(2):114–121. | ||
Kang R, Zeh HJ, Lotze MT, Tang D. The Beclin 1 network regulates autophagy and apoptosis. Cell Death Differ. 2011;18(4):571–580. | ||
Maiuri MC, Criollo A, Kroemer G. Crosstalk between apoptosis and autophagy within the Beclin 1 interactome. EMBO J. 2010;29(3):515–516. | ||
Kabeya Y, Mizushima N, Ueno T, et al. LC3, a mammalian homologue of yeast Apg8p, is localized in autophagosome membranes after processing. EMBO J. 2000;19(21):5720–5728. | ||
Ng F, Tang BL. Sirtuins’ modulation of autophagy. J Cell Physiol. 2013;228(12):2262–2270. | ||
Montecucco F, Cea M, Bauer I, et al. Nicotinamide phosphoribosyltransferase (NAMPT) inhibitors as therapeutics: rationales, controversies, clinical experience. Curr Drug Targets. 2013;14(6):637–643. | ||
Cea M, Cagnetta A, Fulciniti M, et al. Targeting NAD+ salvage pathway induces autophagy in multiple myeloma cells via mTORC1 and extracellular signal-regulated kinase (ERK1/2) inhibition. Blood. 2012;120(17):3519–3529. | ||
Zou W, Liu X, Yue P, et al. c-Jun NH2-terminal kinase-mediated up-regulation of death receptor 5 contributes to induction of apoptosis by the novel synthetic triterpenoid methyl-2-cyano-3,12-dioxooleana-1, 9-dien-28-oate in human lung cancer cells. Cancer Res. 2004;64(20):7570–7578. | ||
Gao X, Liu Y, Deeb D, et al. ROS mediate proapoptotic and antisurvival activity of oleanane triterpenoid CDDO-Me in ovarian cancer cells. Anticancer Res. 2013;33(1):215–221. | ||
Jutooru I, Chadalapaka G, Abdelrahim M, et al. Methyl 2-cyano-3,12-dioxooleana-1,9-dien-28-oate decreases specificity protein transcription factors and inhibits pancreatic tumor growth: role of microRNA-27a. Mol Pharmacol. 2010;78(2):226–236. | ||
Wang CC, Chiang YM, Sung SC, Hsu YL, Chang JK, Kuo PL. Plumbagin induces cell cycle arrest and apoptosis through reactive oxygen species/c-Jun N-terminal kinase pathways in human melanoma A375.S2 cells. Cancer Lett. 2008;259(1):82–98. | ||
Hsu YL, Cho CY, Kuo PL, Huang YT, Lin CC. Plumbagin (5-hydroxy-2-methyl-1,4-naphthoquinone) induces apoptosis and cell cycle arrest in A549 cells through p53 accumulation via c-Jun NH2-terminal kinase-mediated phosphorylation at serine 15 in vitro and in vivo. J Pharmacol Exp Ther. 2006;318(2):484–494. | ||
Yang SJ, Chang SC, Wen HC, Chen CY, Liao JF, Chang CH. Plumbagin activates ERK1/2 and Akt via superoxide, Src and PI3-kinase in 3T3-L1 cells. Eur J Pharmacol. 2010;638(1–3):21–28. | ||
Chen Y, Yu L. Autophagic lysosome reformation. Exp Cell Res. 2013; 319(2):142–146. | ||
Rodon J, Dienstmann R, Serra V, Tabernero J. Development of PI3K inhibitors: lessons learned from early clinical trials. Nat Rev Clin Oncol. 2013;10(3):143–153. | ||
Zielinski RR, Eigl BJ, Chi KN. Targeting the apoptosis pathway in prostate cancer. Cancer J. 2013;19(1):79–89. | ||
Kuo PL, Hsu YL, Cho CY. Plumbagin induces G2-M arrest and autophagy by inhibiting the AKT/mammalian target of rapamycin pathway in breast cancer cells. Mol Cancer Ther. 2006;5(12):3209–3221. | ||
Menon MB, Kotlyarov A, Gaestel M. SB202190-induced cell type-specific vacuole formation and defective autophagy do not depend on p38 MAP kinase inhibition. PLoS One. 2011;6(8):e23054. | ||
Lee IH, Cao L, Mostoslavsky R, et al. A role for the NAD-dependent deacetylase Sirt1 in the regulation of autophagy. Proc Natl Acad Sci U S A. 2008;105(9):3374–3379. | ||
Skokowa J, Lan D, Thakur BK, et al. NAMPT is essential for the G-CSF-induced myeloid differentiation via a NAD+-sirtuin-1-dependent pathway. Nat Med. 2009;15(2):151–158. | ||
Hasmann M, Schemainda I. FK866, a highly specific noncompetitive inhibitor of nicotinamide phosphoribosyltransferase, represents a novel mechanism for induction of tumor cell apoptosis. Cancer Res. 2003;63(21):7436–7442. |
 © 2015 The Author(s). This work is published and licensed by Dove Medical Press Limited. The full terms of this license are available at https://www.dovepress.com/terms.php and incorporate the Creative Commons Attribution - Non Commercial (unported, v3.0) License.
By accessing the work you hereby accept the Terms. Non-commercial uses of the work are permitted without any further permission from Dove Medical Press Limited, provided the work is properly attributed. For permission for commercial use of this work, please see paragraphs 4.2 and 5 of our Terms.
© 2015 The Author(s). This work is published and licensed by Dove Medical Press Limited. The full terms of this license are available at https://www.dovepress.com/terms.php and incorporate the Creative Commons Attribution - Non Commercial (unported, v3.0) License.
By accessing the work you hereby accept the Terms. Non-commercial uses of the work are permitted without any further permission from Dove Medical Press Limited, provided the work is properly attributed. For permission for commercial use of this work, please see paragraphs 4.2 and 5 of our Terms.