")
Back to Journals » Neuropsychiatric Disease and Treatment » Volume 18
Individuals with Bipolar Disorder Have a Higher Level of Homocysteine Than Major Depressive Disorder: A Retrospective Chart Review and Observational Study
Authors Zhao M, Liu T, Qi S, Li W, Liu X, Li X, Xun G
Received 30 August 2022
Accepted for publication 4 November 2022
Published 15 November 2022 Volume 2022:18 Pages 2671—2682
DOI https://doi.org/10.2147/NDT.S387063
Checked for plagiarism Yes
Review by Single anonymous peer review
Peer reviewer comments 2
Editor who approved publication: Dr Yuping Ning
Miao Zhao, Tengteng Liu, Sufang Qi, Wenjie Li, Xin Liu, Xinming Li, Guanglei Xun
Department of Psychiatry, Shandong Mental Health Center, Shandong University, Jinan, People’s Republic of China
Correspondence: Guanglei Xun, Department of Psychiatry, Shandong Mental Health Center, Shandong University, No. 49 Wenhua Eastern Road, Jinan, People’s Republic of China, Tel +86 15069053599, Email [email protected]; [email protected]
Purpose: Previous studies suggest that homocysteine (Hcy) may be involved in the pathogenesis of bipolar disorder (BD) and major depressive disorder (MDD) by influencing glutamatergic transmission, inflammation, and other mechanisms. There are no established biomarkers to distinguish BD from MDD. This study aims to compare Hcy levels between BD and MDD.
Patients and Methods: We collected medical records of patients aged 14– 75 admitted to the hospital from January 1 to July 1, 2022 with a discharge diagnosis of MDD or BD, including all examinations of patients at admission (acute phase) and discharge (non-acute phase). We measured Hcy levels in healthy controls (HC).
Results: The analysis included 104 patients with MDD, 103 patients with BD, and 80 HC. Hcy levels were higher in the MDD and BD group than in the HC group and higher in the BD group than in the MDD group, both in the acute and non-acute phases (all P < 0.05). There was no significant difference in Hcy levels between the psychotropic medication users and non-users in the BD or MDD group (all P > 0.05). Multivariate logistic regression analysis only for the MDD and BD group indicated that the likelihood of BD diagnosis was significantly associated with Hcy levels (in the acute phase: OR = 1.052, P = 0.016; in the non-acute phase: OR = 1.101, P < 0.001) after controlling for gender, age, and metabolic indicators.
Conclusion: Our study suggests that Hcy levels were elevated in MDD and BD patients and were higher in BD patients than in MDD patients, which provides evidence for a possible relationship between one-carbon metabolism and the pathogenesis of BD. Besides, Hcy may be one of the potential biomarkers to distinguish BD from MDD.
Keywords: affective disorder, biomarker, pathophysiology, differential diagnosis
Introduction
In clinical practice, it is challenging to distinguish bipolar disorder (BD) from major depressive disorder (MDD) because the early onset of BD is often characterized by depressive episodes, which seem similar to MDD.1 The misdiagnosis of patients with BD may lead to subsequent use of a single antidepressant rather than combining mood stabilizers, which can cause BD individuals to switch to mania, hypomania, or recurrent episodes of depression.2 A recent study suggested that demographics, clinical characteristics, and several validated, easy-to-use screening tools (for example, using the Mood Disorder Questionnaire) can help clinicians improve the ability to identify patients with BD.3 However, most tools still find it difficult to distinguish BD and MDD patients efficiently, and there are rarely laboratory indicators or imaging techniques diagnosing BD or distinguishing BD and MDD. Significantly, compared with adults, clinical presentations of adolescents are atypical, which makes the diagnosis of the pediatric-adolescent population remain a challenge.4
Homocysteine (Hcy) is known as a sulfur-containing amino acid produced during methionine metabolism,5 which is degraded via the remethylation pathway or trans-sulfuration pathway. In one-carbon metabolism, folate is converted to 5-methyltetrahydrofolate (5-methylTHF) by methylenetetrahydrofolate reductase (MTHFR), and then 5-methylTHF is used by methionine synthase and vitamin B12 to remethylate Hcy into methionine.6 Thus, decreased MTHFR activity or deficiencies of folic acid or B12 may contribute to elevated Hcy levels. Hcy is degraded to cysteine during the trans-sulfuration pathway, and in most organizations, Hcy is either remethylated or exported out of the cell.7 Hcy was found to induce hyperactivity in rats, which may be involved in the pathogenesis of attention deficit hyperactivity disorder (ADHD).8 As a mixed excitatory agonist at the N-methyl-D-aspartate (NMDA) receptor, Hcy affects glutamatergic transmission.9–12 Moreover, research published recently found that mood stabilizers may act on BD by inhibiting glutamatergic neurotransmission.13 The metabolism of Hcy may have some relationship with BD. In addition, elevated Hcy levels promote its neurotoxic effects by several studied mechanisms, including mitochondrial dysfunction, oxidative stress induction, inflammation, mediated neuronal apoptosis, and aberrant DNA methylation.14–18 These pathways overlap with the current biological hypothesis of BD as well as relevant pathophysiological mechanisms.19
Since the discovery of Hcy in 1932, scholars have widely accepted that Hcy is an independent risk factor for cardiovascular disease (CVD).20 In recent years, it has been found that MDD is often co-morbid with CVD and the mechanism of this co-morbidity is bidirectional. Pathophysiological factors underlying these co-morbid mechanisms include dysregulation of the balance between the sympathetic and parasympathetic systems, loss of heart rate variability (HRV) in depressed individuals, sympathetic activation, hypothalamic-pituitary-adrenal (HPA) axis activation, immune system dysregulation leading to a pro-inflammatory state, platelet activation, and endothelial dysfunction. These abnormalities have been demonstrated in most individuals diagnosed with MDD.21 Some studies have shown that Hcy causes endothelial dysfunction by increasing oxidative stress and inhibiting endothelial nitric oxide synthase (eNOS) activity as well as decreasing nitric oxide (NO) production.22 Moreover, elevated Hcy levels have been repeatedly reported in MDD and BD.23–26 Out of interest in whether Hcy may be a peripheral biological marker for BD, Chiarani and others conducted a small sample size case-control study, which found significantly higher levels of Hcy in patients with BD than HC, both in the manic phase and in reaching remission. However, when body mass index (BMI) was adjusted as a covariate, there was no significant difference between patients and controls.27 Another study showed that serum levels of C-reactive protein, C3, C4, and Hcy were higher in BD patients than MDD patients.28 Furthermore, Ozdogan and others found that more BD mixed episodes happened in patients with hyperhomocysteinemia (HHcy) than those without HHcy.29
Although the correlations of Hcy levels with MDD and BD patients have been discussed in many studies, to some extent, studies on the comparison of Hcy levels between patients with MDD and BD remain less available and controversial. This current study aimed to compare Hcy levels between BD and MDD more explicitly and to explore whether Hcy levels can distinguish between patients with MDD and BD.
Patients and Methods
Study Design
The hospital where the study was conducted had excellent quality medical records. In clinical practice, blood biochemical parameters are checked on admission and discharge of inpatients to observe medication side effects, metabolic syndrome, and prevention of cardiovascular and cerebrovascular disease accidents, including Hcy.
The study examined the medical records of inpatients admitted to Shandong Mental Health Center between January 1 and July 1, 2022 aged 14–75 years with a primary discharge diagnosis of MDD (F32.0–33.9) or BD (F31.0–31.9) according to ICD-10 (International Statistical Classification of Diseases and Related Health Problems—10th Revision) and with a condition improved. A non-probability consecutive sampling technique was used. General information such as gender, age, date of birth, date of admission, past history, family history, and discharge diagnosis was recorded in this study. Both admission (acute phase) and discharge (non-acute phase) examinations were recorded, including serum Hcy levels, triglycerides (TG), high-density lipoprotein (HDL), low-density lipoprotein (LDL), total cholesterol (CHOL), glucose (GLU), creatinine (CREA), and body mass index (BMI). The use of medication was also recorded at the two examinations. Besides, for those patients with multiple admissions, only clinical data from the most recent were used. In addition, HHcy was defined when Hcy concentration exceeded 15.0 µmol/L, and BMI was calculated as weight divided by the height squared (kg/m2).
Healthy individuals with no family history of psychiatric disorders were also included in the study as the healthy control group (HC). Inclusion criteria for HC: (1) without any mental disorders and family history of mental disorders; (2) age 18–60 years; (3) HAMD-17 < 7, YMRS < 6; (4) no cardiovascular disease/cerebrovascular disease; (5) no harmful use of alcohol/tobacco; (6) understand research content and provide written informed consent.
Patients with cardiovascular disease, cerebrovascular disease, psoriasis, harmful use of alcohol/tobacco, a vegetarian diet, and using of medications that may affect serum Hcy were excluded based on Past Medical History and dietary medical orders in the electronic medical record system. We also read in detail the description of the patient’s diet in the physician’s progress notes and physical examinations, and patients who refused food were not included in the study. The flow chart of sample selection is shown in Figure 1.
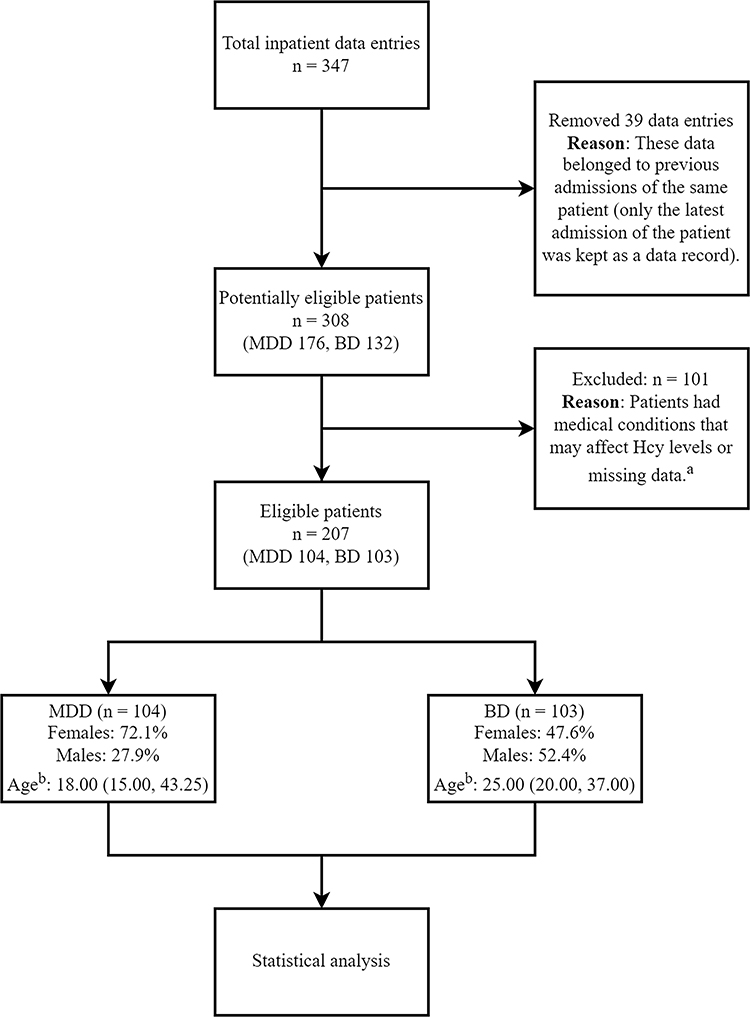 |
Figure 1 Flowchart of sample selection. aMedical conditions: cardiovascular disease, cerebrovascular disease, psoriasis, harmful use of alcohol/tobacco, refusal of food, and use of medications that may affect serum Hcy. bAge was described by median (P25, P75). Abbreviations: MDD, major depressive disorder; BD, bipolar disorder. |
Each patient’s psychotropic medication use prior to Hcy screening was recorded, and the results were categorized into two conditions: no medication/medication use.
The antidepressant agents include escitalopram, vortioxetine, bupropion, sertraline, paroxetine, fluoxetine, desvenlafaxine, venlafaxine, duloxetine, nortriptyline, trazodone, mirtazapine, and fluvoxamine. The antipsychotic agents include risperidone, aripiprazole, haloperidol, clozapine, olanzapine, quetiapine, sulpiride, paliperidone, and ziprasidone. The mood stabilizer agents include lithium, valproate, oxcarbazepine, topiramate, lamotrigine, and pregabalin.
This study was approved by the Clinical Research Ethics Committee of Shandong Mental Health Center and compliant with the Code of Ethics of the World Medical Association (Declaration of Helsinki) (2021-R69). Since patients’ blood sample data were obtained from a pre-existing biosample, no blood sample collection was involved. There was no intervention and no contact with any patients. The study results have removed any patient subject identifier characters to ensure that personal privacy was not leaked. The Ethics Committee waived the requirement for informed consent from patients. All healthy volunteers provided informed consent.
How Serum Hcy and Other Blood Biochemical Indicators are Measured
We collected Hcy screening results and other indicators from inpatients’ medical records and did not perform interventional blood sample collection from patients. Serum Hcy levels of healthy individuals in this study were performed after enrollment. Our hospital used Beckman Coulter AU5800 Automated Clinical Chemistry Analyzer (BECKMAN COULTER, United States) to analyze blood.
Statistical Analysis
The statistical software involved in this study included IBM SPSS Statistics for Windows, Version 25, and R language 4.1.3 software, and a two-sided P < 0.05 was considered a statistically significant difference. All measurements were checked for normality by the Kolmogorov–Smirnov test. Mann–Whitney U-test was used to compare the differences in age, TG, CHOL, HDL, LDL, CREA, GLU, and BMI. General information, such as gender, family history, and presence of psychotic symptoms, was analyzed by Pearson’s χ2 test. Mann–Whitney U-test was constructed to examine the difference in Hcy levels between the medicated and non-medicated groups. For MDD and BD groups, BD diagnosis was taken as the dependent variable, and certain factors such as Hcy levels, age, gender, TG, HDL, CREA, and BMI as covariates for Binary Logistic regression. Restricted cubic splines (RCS) were used to determine whether a linear correlation existed between Hcy levels and the BD diagnosis only for MDD and BD groups. In addition, the possibility of Hcy as a biomarker was investigated by receiver operating characteristic (ROC) analysis. Multiple sample rank-sum tests were performed using the Kruskal–Wallis test and multiple test corrections for significance p-values using Bonferroni in post-hoc tests.
Results
Demographic and Clinical Data in MDD, BD, and HC Groups
Overall, we collected the data from 357 inpatients. After excluding ineligible patients and those with missing data, 207 were eligible in the end, including 103 BD patients and 104 MDD patients.
The percentage of females in the BD group was 47.6%, 72.1% in the MDD group, and 50% in the HC group. The difference in gender among the three groups was significant (P < 0.001). Post-hoc analysis showed that the percentage of females was higher in the MDD group than in the BD and HC group (all P < 0.05), but there was no gender difference between the BD and HC group. The age of the BD group was 25.00 (20.00, 37.00) years, the age of the MDD group was 18.00 (15.00, 43.25) years, and the age of the HC group was 48.50 (40.00, 55.75) years. There was a difference in age among the three groups (P < 0.001). Post-hoc analysis showed that the HC group was older than the BD and MDD group (all P <0.001), and there was no age difference between the BD and MDD group. Besides, the differences in family history and psychotic symptoms between the BD and MDD group were not significant.
In the acute phase, the level of TG did not differ between the BD group and the MDD group, while in the non-acute phase, the level of TG was higher in the BD group than in the MDD group (Pb = 0.032). In the acute phase, HDL levels were lower in the BD group than in the MDD group (Pa = 0.015), whereas in the non-acute phase, there was no significant difference between the two groups. Whether in the acute phase or the non-acute phase, CREA levels (Pa = 0.001, Pb = 0.030) and BMI levels (Pa < 0.001, Pb < 0.001) were both higher in the BD group than that in the MDD one. There was no difference in CHOL, GLU, and LDL levels between the two groups in the two phases (Table 1).
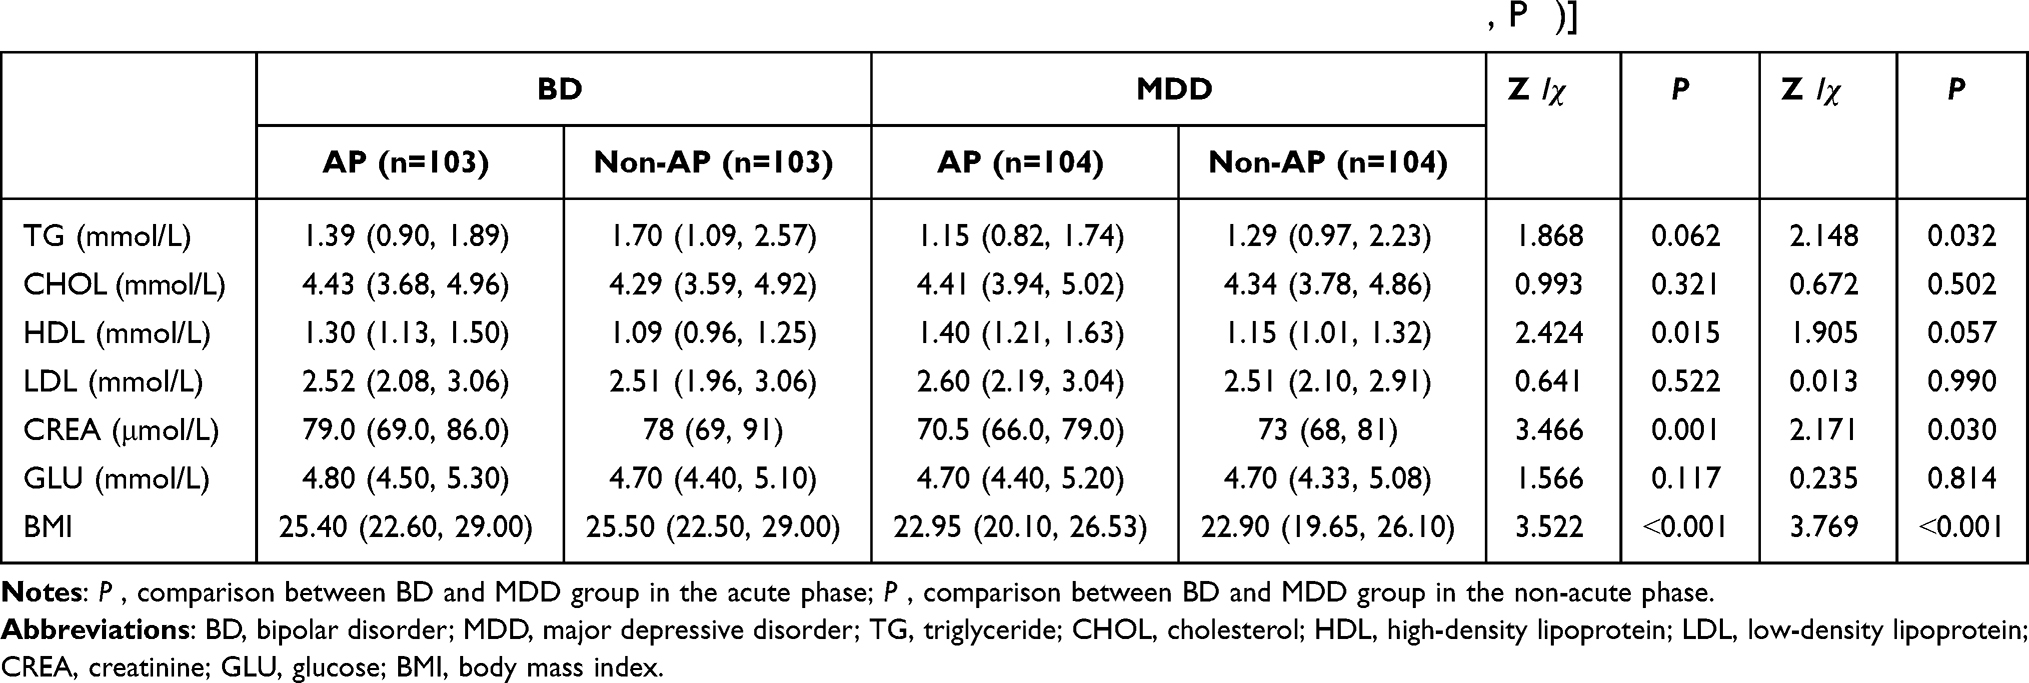 |
Table 1 Clinical Data of MDD and BD Group in the Acute and Non-Acute Phases [Median (P25, P75)] |
Effects of Drug-Use on Hcy Levels in MDD and BD Groups
To assess whether psychotropic medication use would be a confounding factor for Hcy levels in the two groups. Mann–Whitney U-test was performed on Hcy levels at admission in the unmedicated and medicated group. The result showed no significant difference in Hcy levels between the unmedicated and medicated patients (in the BD group: P = 0.836; in the MDD group: P = 0.464) (Table 2). Therefore, we did not consider the use of psychotropic medications (antidepressants, antipsychotics, mood stabilizers) to be a relevant confounding variable in the analysis of our sample.
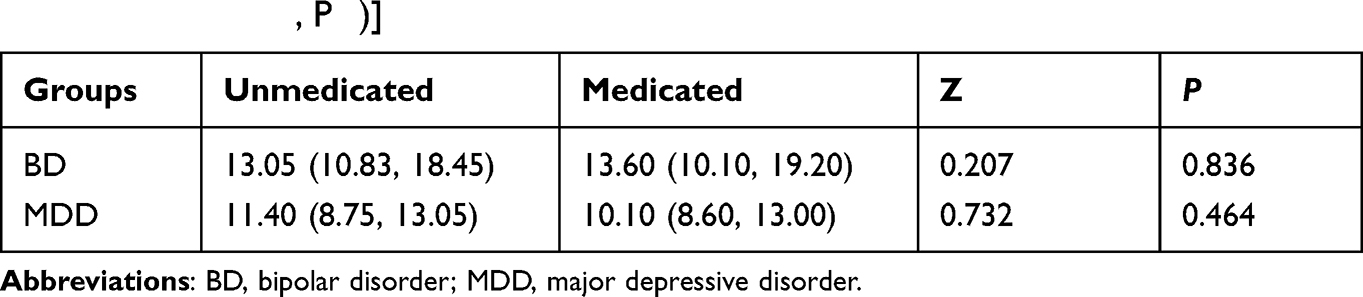 |
Table 2 Hcy Levels in the Unmedicated and Medicated Population in the BD and MDD Group [Median (P25, P75)] |
Differences in Hcy Levels Among MDD, BD, and HC Groups
There were significant differences in Hcy levels and the number of participants with HHcy among the three groups in the acute and non-acute phases. Post-hoc analysis showed that Hcy levels and the number of participants with HHcy in the BD group were higher than that in MDD and HC group adjusted by the Bonferroni test, and the Hcy levels and number of participants with HHcy in the MDD group were higher than in the HC group (Tables 3 and 4).
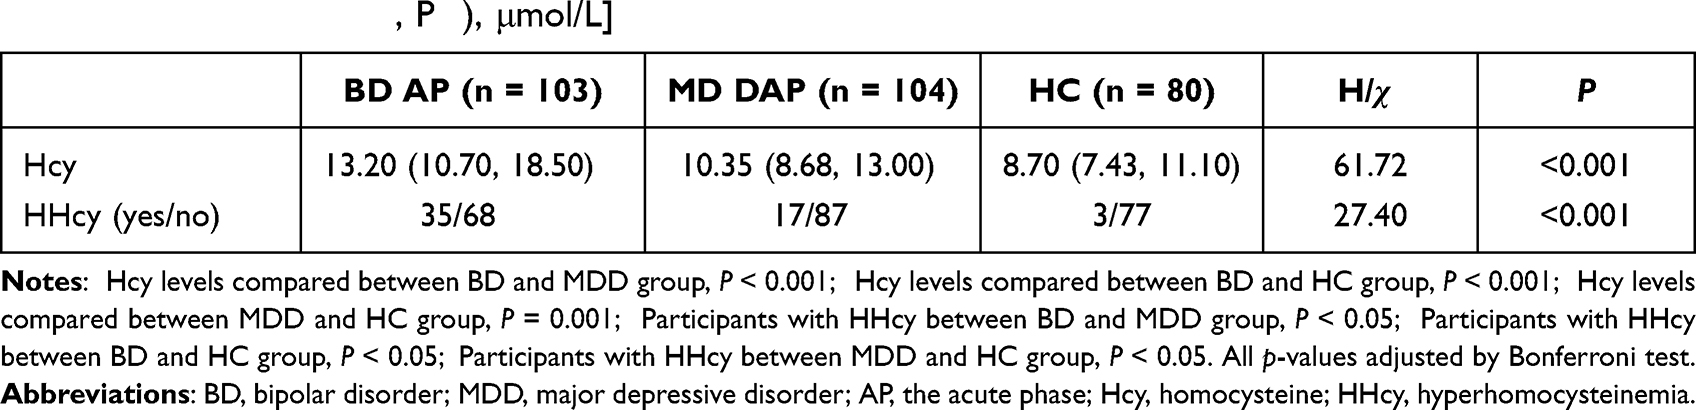 |
Table 3 Comparison of Hcy Levels and the Number of Participants with HHcy Among the Three Groups in the Acute Phase [Median (P25, P75), μmol/L] |
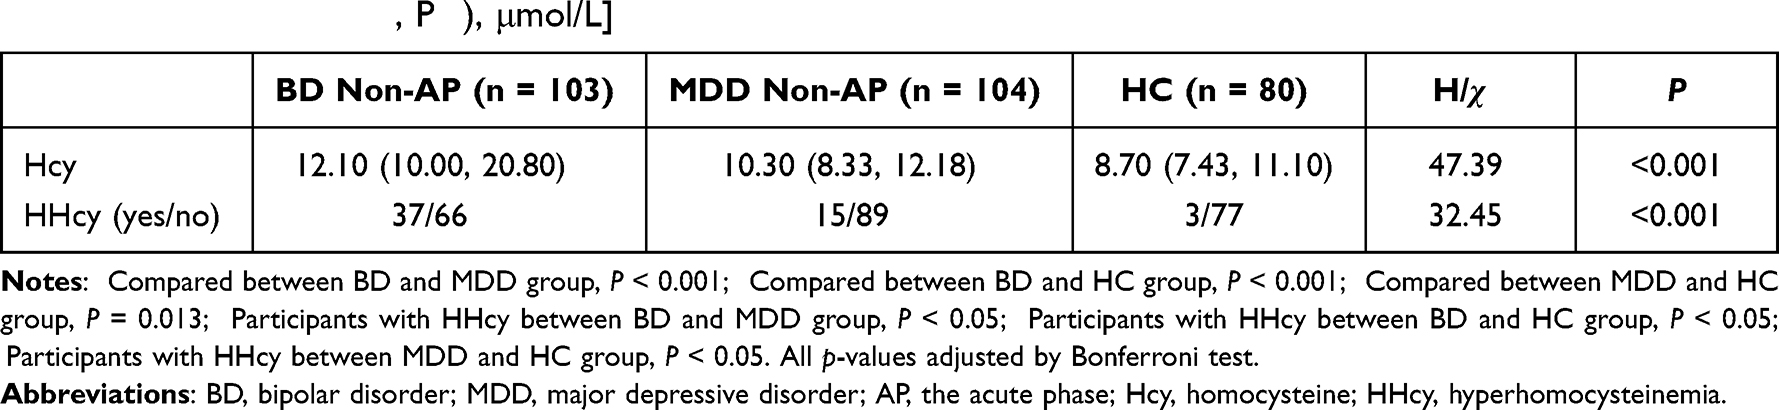 |
Table 4 Comparison of Hcy Levels and the Number of Participants with HHcy Among the Three Groups in the Non-Acute Phase [Median (P25, P75), μmol/L] |
Comparison of Hcy Levels in Patients Between the Acute and Non-Acute Phases
After the disease improvement, there was no significant difference in non-acute Hcy levels compared to acute Hcy levels in the MDD group (P = 0.378) and the BD group (P = 0.347).
Multivariate Logistic Analysis Between MDD and BD Groups
In the acute phase, the result of binary logistic regression analysis showed that higher Hcy levels remained significantly associated with the likelihood of a BD diagnosis (odds ratio [OR] = 1.052, 95% confidence interval [CI]: 1.010–1.097; P = 0.016) after controlling for gender, age, HDL, CREA, and BMI.
In the non-acute phase, after controlling for gender, age, TG, CREA, and BMI, higher Hcy levels likewise remained significantly associated with the likelihood of a BD diagnosis as well (odds ratio [OR] = 1.101, 95% confidence interval [CI]: 1.046–1.159; P < 0.001) (Table 5). Because the above variables were statistical significance in univariate analyses or potential confounders impacting the results, the variables above were included in the regression analysis.30
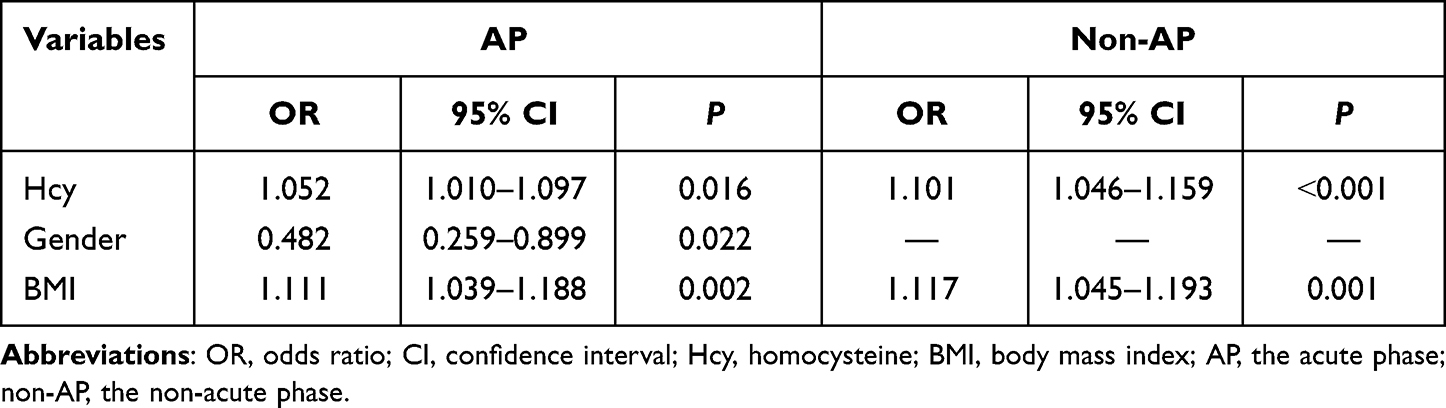 |
Table 5 Stepwise Logistic Regression Results |
After adjusting for gender, age, HDL, CREA, and BMI in the acute phase, a restricted cubic spline analysis (RCS) was performed to determine whether there was a linear relationship between the Hcy level and the likelihood of BD diagnosis rather than a “U” shaped relationship. The results showed a linear relationship between the Hcy level and the likelihood of BD diagnosis (P for nonlinearity = 0.079). After adjusting for gender, age, TG, CREA, and BMI in the non-acute phase, RCS analysis showed a linear relationship between the Hcy level and the likelihood of BD diagnosis (P for nonlinearity = 0.716) (Figure 2).
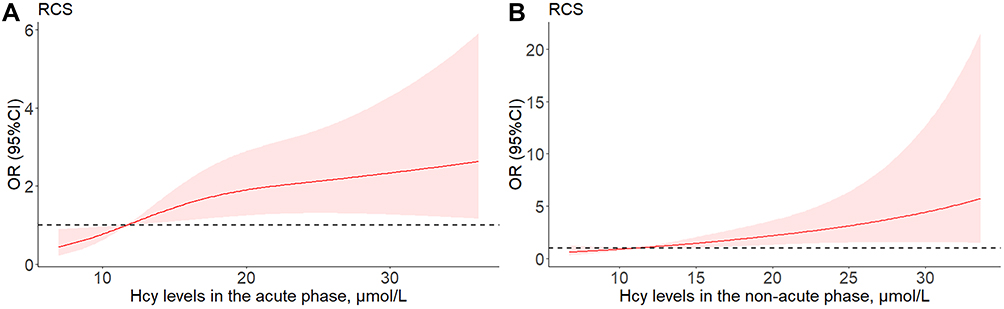 |
Figure 2 Restricted cubic spline model of the odds ratios (OR) with Hcy levels. (A), the acute phase. (B), the non-acute phase. Abbreviations: RCS, restricted cubic spline; OR (95% CI), odds ratios with 95% confidence intervals; Hcy, homocysteine. |
ROC Analysis of Hcy as a Biomarker to Distinguish BD and MDD
ROC analysis was used to examine the predictive ability of Hcy levels to distinguish between MDD and BD groups. In the acute phase, ROC analysis showed the area under the curve (AUC) = 0.692 (P < 0.001). In the non-acute phase, ROC analysis showed AUC = 0.676 (P < 0.001) (Figure 3).
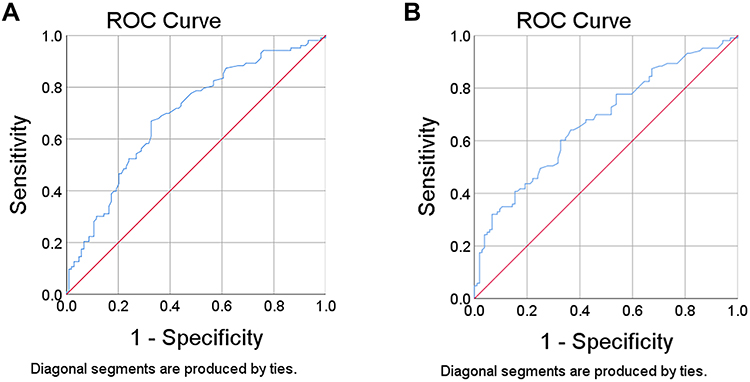 |
Figure 3 Receiver operating characteristic (ROC) curves for the diagnostic ability of Hcy (MDD vs BD). (A), the acute phase. (B), the non-acute phase. Abbreviation: ROC, receiver operating characteristic. |
Comparison of Hcy Levels in Adolescent Affective Disorder and Adult Affective Disorder
Sixty-nine adolescents aged 14–17 and 138 adults aged 18–75 were included in this sample. Without considering other confounding factors, the Kruskal–Wallis test was used to compare the Hcy levels among four groups: adolescent MDD, adolescent BD, adult MDD, and adult BD. Bonferroni was used to conduct post-hoc tests for multiple comparisons.
There were significant differences among the four groups above (in the acute phase: H = 24.295, P < 0.001; in the non-acute phase: H = 21.266, P ˂ 0.001). Among these groups, Hcy levels in the adolescent BD group were higher than that in the adolescent MDD group (in the acute phase: P = 0.003; in the non-acute phase: P = 0.004) and the adult MDD group (in the acute phase: P = 0.014; in the non-acute phase P = 0.045), and had no significant difference compared with the adult BD group (In the acute phase: P = 1.000; in the non-acute phase: P = 1.000). In addition, Hcy levels in the adult BD group were higher than that in the adult MDD group (in the acute phase: P = 0.010; in the non-acute phase: P = 0.046) and the adolescent MDD group (in the acute phase: P = 0.001; in the non-acute phase: P = 0.001). Hcy levels in the adolescent MDD group were not significantly different compared with the adult MDD group (in the acute phase: P = 1.000; in the non-acute phase: P = 1.000) (Table 6: the acute phase; Table 7: the non-acute phase).
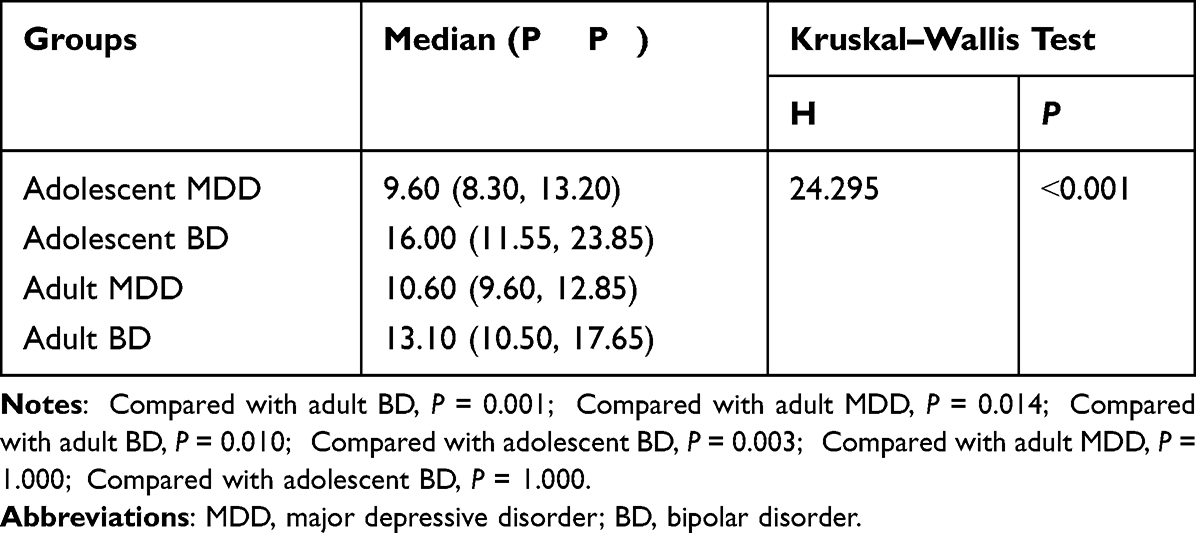 |
Table 6 Comparison of Hcy Levels Between the Four Groups in the Acute Phase |
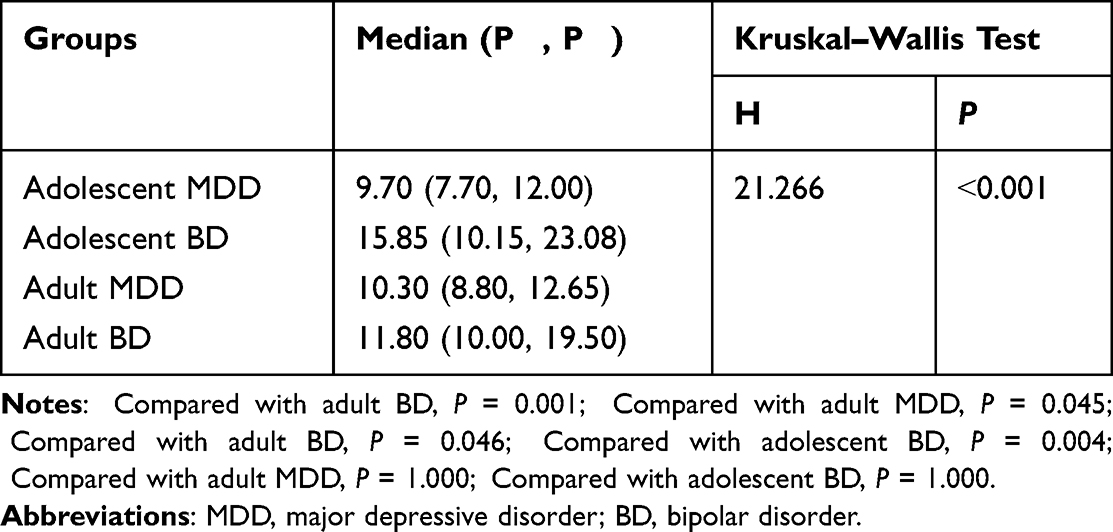 |
Table 7 Comparison of Hcy Levels Between the Four Groups in the Non-Acute Phase |
Discussion
We found that higher Hcy levels significantly indicate the possibility of a BD diagnosis rather than an MDD diagnosis, both in the acute and non-acute phases. Hcy may be a trait biomarker for BD rather than a state biomarker. However, we did not make long-term observations of Hcy levels in patients with BD, so this opinion is only taken as a hypothetical inference. Lyu and others also found that serum Hcy levels were higher in the BD group than in the MDD group.28 Similarly, a Mendelian randomization (MR) study discovered that elevated plasma Hcy levels might increase the risk of BD-I. However, no causal relationship was found between plasma Hcy levels and the risk of MDD and BD-II.31 Nevertheless, there are several limitations of the MR study that need to be considered carefully. For example, the number of genetic instruments used in the MR analysis was limited, and the risk of BD may be affected by exposure to higher Hcy levels at a particular time, whereas their MR analysis investigated lifelong elevated Hcy levels in BD. Ozdogan found a strong relationship between HHcy and the number of mixed episodes, and patients with HHcy experienced more mixed episodes than those without HHcy.29 However, Vargas found no significant differences in Hcy levels among MDD, BD, and HC, which implies that metabolic biomarkers are not necessarily specific in MDD or BD.32 Differences in sample characteristics, the choice of control variables, or research methods in each study may be reasons why there exist such apparent differences. Hcy is easily measured in clinical practice, making it a good utility as a biomarker in actual application.
This present study showed that Hcy levels were higher in the BD group than in the MDD group, supporting the argument that one-carbon metabolic dysfunction is associated with BD. A recent animal study displayed that a week-long high methionine diet in adult mice increased cerebrospinal fluid methionine levels and total Hcy levels and caused bipolar disorder-like behavior in mice,33 which echoes our clinical findings. Serum Hcy is associated with psychiatric disorders, but the precise molecular mechanisms remain unclear.34–37 Ezzaher found that although 5,10-methylenetetrahydrofolate reductase (MTHFR) C677T genotype was the main factor influencing Hcy levels, after adjusting for 5,10-methylenetetrahydrofolate reductase (MTHFR) C677T genotype, hyperbilirubinemia, hypovitaminosis B12, and for potential confounders, the odds of BD diagnosis were associated with higher hcy levels still remained significant. It suggests that HHcy is more common in patients with BD and is not associated with the C677T polymorphism, agreeing with Kevere.38,39 Previous studies have revealed that Hcy and its oxidized metabolites were agonists of NMDA receptors,11–14 which may explain the relevance of Hcy with psychiatric disorders. However, the neurotoxic effects of Hcy are quietly complex. Certain studies have reported that Hcy can induce oxidative reactions,40,41 which supports the oxidative stress theory of BD.42 Another study has revealed that Hcy affects the structure and function of normal mitochondria,43 which provides evidence for the thesis that mitochondrial bioenergetics are stage-dysregulated in BD patients.44 The pathophysiological mechanism of BD is not homogeneous. The relationship between Hcy and BD still needs to be explored through a large number of experimental animal studies in the future.45,46
To investigate whether other metabolic indicators also showed differences between MDD and BD patients, we compared TG, HDL, LDL, GLU, CREA, and BMI. In the univariate analysis in the acute phase, significant differences were observed in HDL, CREA, and BMI. However, no significant differences were observed in HDL and CREA after inclusion in multivariate logistic regression analysis. Significant differences in TG, CREA, and BMI were observed in univariate analysis in the non-acute phase. After the inclusion of multivariate logistic regression analysis, however, no significant differences in TG and CREA were observed. It suggests that TG, HDL, and CREA are only indirectly associated with the likelihood of BD diagnosis. They may be covariate with other variable factors and are not influential on the likelihood of BD diagnosis. After controlling gender, age, and metabolic indicators by logistic regression, Hcy levels in the acute/non-acute phase remained significantly associated with the likelihood of BD diagnosis. A linear relationship, not a “U” shaped relationship, between Hcy levels and the likelihood of BD diagnosis, was demonstrated by the method of RCS analysis. We drew a figure showing the distribution of patients in the interval of Hcy (divided into four groups by quartiles); it clearly showed that the BD group included a higher percentage of patients with higher Hcy levels than the MDD group (Figure 4). We performed a ROC analysis to investigate the possibility of using Hcy as a clinical biomarker. The results showed that the AUC = 0.692 in the acute phase and the AUC = 0.676 in the non-acute phase. This result indicates that Hcy has some predictive effect but with an average accuracy (AUC < 0.7), which is suboptimal.
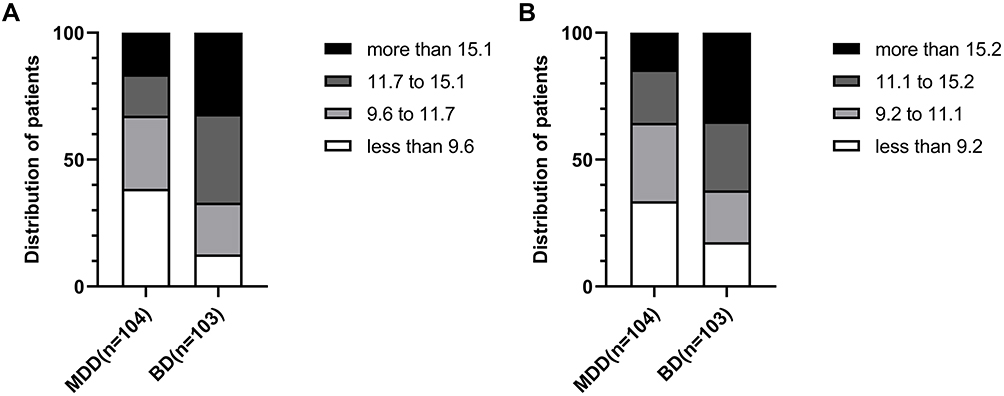 |
Figure 4 The distribution of patients in the MDD and BD group within each quartile interval of Hcy levels. The BD group included a higher percentage of patients with higher Hcy levels than the MDD group. (A), the acute phase. (B), the non-acute phase. Abbreviations: BD, bipolar disorder; MDD, major depressive disorder. |
The sample in this study contained adolescents aged 14–17 years. After stratification by adolescents/adults, we compared the differences in Hcy levels among adolescent MDD, adolescent BD, adult MDD, and adult BD, respectively. Hcy levels in the adolescent BD group were higher than those in the adolescent MDD group and those in the adult MDD group. There was no significant difference in Hcy levels between the adolescent BD and adult BD group. The Hcy levels in the adult BD group were higher than those in the adult MDD group and those in the adolescent MDD group. The Hcy levels in the adolescent MDD group were not significantly different compared with the adult MDD group, which is consistent with the finding that Hcy levels were higher in BD patients than in MDD patients in the overall sample.
Antidepressants, antipsychotics, and mood stabilizers are the most commonly prescribed medications for people with BD and MDD, and most patients use these medications in combination. Therefore, in this study, we only explored whether there was a difference in Hcy levels between the medicated and non-medicated group. It was found that psychiatric medications did not affect Hcy levels. However, recent studies have shown that BD patients with HHcy use lithium more frequently and valproate less frequently.47 Exploring the effects of commonly prescribed psychotropic medications on serum Hcy is meaningful and interesting. However, there is no comprehensive review of the effects of each psychiatric medication on Hcy levels and other metabolic parameters. Future researches need to explore more precisely whether the different mechanisms of drugs affect Hcy levels.
The strengths of this study were the inclusion of a sample of adolescent patients for the first time, the use of RCS to verify a linear rather than a “U” shaped relationship between Hcy levels and the likelihood of a BD diagnosis, and ROC to explore the possibility of Hcy as a biomarker to distinguish BD between MDD. In addition, we separately compared Hcy levels in the same population in the acute and non-acute phases in our study design and found no change in Hcy levels in either the BD or MDD group. Finally, we considered whether the use of psychotropic medications would have an impact on Hcy levels.
There were some limitations in this study. First, electronic medical records cannot derive the severity of a patient’s condition, so we were not able to explore whether Hcy levels could predict the severity of symptoms. Second, admitted patients had balanced diets, but our hospital did not check for folic acid and B12. Nevertheless, Ezzaher showed that after adjustment for B12 levels and folic acid levels, higher Hcy levels remained significantly associated with the likelihood of BD diagnosis.38 Third, this study was a cross-sectional design and could not explore whether there existed a causal relationship between Hcy and BD.
Conclusion
Except for the finding of elevated Hcy levels in patients with BD and MDD, our study suggests that serum Hcy levels may be significantly higher in patients with BD than in those with MDD, which provides evidence of a relationship between the one-carbon metabolism and the pathogenesis of BD. We found a positive linear relationship between Hcy levels and the likelihood of the BD diagnosis. Hcy may be one of the potential biomarkers to distinguish BD from MDD. However, this discovery should be further warranted in future studies.
Data Sharing Statement
The datasets used and/or analyzed during the current study are available from the corresponding author on reasonable request.
Ethics Approval and Informed Consent
This study was approved by the Clinical Research Ethics Committee of Shandong Mental Health Center (2021-R69). Since patients’ blood sample data were obtained from a pre-existing biosample, no blood sample collection was involved. There was no intervention and no contact with any patients. The study results have removed any patient subject identifier characters to ensure that personal privacy was not leaked. The Ethics Committee waived the requirement for informed consent from patients. All healthy volunteers provided informed consent.
Acknowledgments
The authors would like to thank all patients and healthy volunteers who supported and participated in this study.
Funding
The study was funded by Shandong Province Key R&D Program Project (Science and Technology Demonstration Project; grant number: 2021SFGC0504).
Disclosure
The authors report no conflicts of interest in this work.
References
1. Grande I, Berk M, Birmaher B, Vieta E. Bipolar disorder. Lancet. 2016;387(10027):1561–1572. doi:10.1016/S0140-6736(15)00241-X
2. Liu B, Zhang Y, Fang H, Liu J, Liu T, Li L. Efficacy and safety of long-term antidepressant treatment for bipolar disorders - A meta-analysis of randomized controlled trials. J Affect Disord. 2017;223:41–48. doi:10.1016/j.jad.2017.07.023
3. Hirschfeld RM. Differential diagnosis of bipolar disorder and major depressive disorder. J Affect Disord. 2014;169(Suppl 1):S12–S16. doi:10.1016/S0165-0327(14)70004-7
4. Ryles F, Meyer TD, Adan-Manes J, MacMillan I, Scott J. A systematic review of the frequency and severity of manic symptoms reported in studies that compare phenomenology across children, adolescents and adults with bipolar disorders. Int J Bipolar Disord. 2017;5(1):4.
5. Smith AD, Refsum H. Homocysteine, B vitamins, and cognitive impairment. Annu Rev Nutr. 2016;36:211–239.
6. Murray LK, Jadavji NM. The role of one-carbon metabolism and homocysteine in Parkinson’s disease onset, pathology and mechanisms. Nutr Res Rev. 2019;32(2):218–230.
7. Moretti R, Caruso P. The controversial role of homocysteine in neurology: from labs to clinical practice. Int J Mol Sci. 2019;20(1):231.
8. De la Torre-Iturbe S, Vázquez-Roque RA, De la Cruz-López F, Flores G, Garcés-Ramírez L. Dendritic and behavioral changes in rats neonatally treated with homocysteine; A proposal as an animal model to study the attention deficit hyperactivity disorder. J Chem Neuroanat. 2022;119:102057.
9. Shaw PJ. Excitatory amino acid receptors, excitotoxicity, and the human nervous system. Curr Opin Neurol Neurosurg. 1993;6(3):414–422.
10. Klancnik JM, Cuénod M, Gähwiler BH, Jiang ZP, Do KQ. Release of endogenous amino acids, including homocysteic acid and cysteine sulphinic acid, from rat hippocampal slices evoked by electrical stimulation of Schaffer collateral-commissural fibres. Neuroscience. 1992;49(3):557–570. doi:10.1016/0306-4522(92)90226-R
11. Zhang D, Lipton SA. L-homocysteic acid selectively activates N-methyl-D-aspartate receptors of rat retinal ganglion cells. Neurosci Lett. 1992;139(2):173–177. doi:10.1016/0304-3940(92)90545-I
12. Lipton SA, Kim WK, Choi YB, et al. Neurotoxicity associated with dual actions of homocysteine at the N-methyl-D-aspartate receptor. Proc Natl Acad Sci USA. 1997;94(11):5923–5928. doi:10.1073/pnas.94.11.5923
13. Ramadan E, Basselin M, Rao JS, et al. Lamotrigine blocks NMDA receptor-initiated arachidonic acid signalling in rat brain: implications for its efficacy in bipolar disorder. Int J Neuropsychopharmacol. 2012;15(7):931–943. doi:10.1017/S1461145711001003
14. Kolling J, Scherer EB, Siebert C, et al. Severe hyperhomocysteinemia decreases respiratory enzyme and Na(+)-K(+) ATPase activities, and leads to mitochondrial alterations in rat amygdala. Neurotox Res. 2016;29(3):408–418. doi:10.1007/s12640-015-9587-z
15. Hu H, Wang C, Jin Y, et al. Alpha-lipoic acid defends homocysteine-induced endoplasmic reticulum and oxidative stress in HAECs. Biomed Pharmacother. 2016;80:63–72. doi:10.1016/j.biopha.2016.02.022
16. Elsherbiny NM, Sharma I, Kira D, et al. Homocysteine induces inflammation in retina and brain. Biomolecules. 2020;10(3):393. doi:10.3390/biom10030393
17. Wu H, Wang J, Cao M, et al. Effects of homocysteine-induced endoplasmic reticulum protein on endoplasmic reticulum stress, autophagy, and neuronal apoptosis following intracerebral hemorrhage. IBRO Rep. 2020;9:207–217. doi:10.1016/j.ibror.2020.08.004
18. Mill J, Tang T, Kaminsky Z, et al. Epigenomic profiling reveals DNA-methylation changes associated with major psychosis. Am J Hum Genet. 2008;82(3):696–711. doi:10.1016/j.ajhg.2008.01.008
19. Sigitova E, Fišar Z, Hroudová J, Cikánková T, Raboch J. Biological hypotheses and biomarkers of bipolar disorder. Psychiatry Clin Neurosci. 2017;71(2):77–103. doi:10.1111/pcn.12476
20. Ganguly P, Alam SF. Role of homocysteine in the development of cardiovascular disease. Nutr J. 2015;14(6). doi:10.1186/1475-2891-14-6
21. Halaris A. Inflammation-associated co-morbidity between depression and cardiovascular disease. Curr Top Behav Neurosci. 2017;31:45–70.
22. Cheng Z, Jiang X, Pansuria M, et al. Hyperhomocysteinemia and hyperglycemia induce and potentiate endothelial dysfunction via μ-calpain activation. Diabetes. 2015;64(3):947–959. doi:10.2337/db14-0784
23. Folstein M, Liu T, Peter I, et al. The homocysteine hypothesis of depression. Am J Psychiatry. 2007;164(6):861–867. doi:10.1176/ajp.2007.164.6.861
24. Yapislar H, Aydogan S, Ozüm Ü. Biological understanding of the cardiovascular risk associated with major depression and panic disorder is important. Int J Psychiatry Clin Pract. 2012;16(1):27–32. doi:10.3109/13651501.2011.620127
25. Delport D, Schoeman R, van der Merwe N, et al. Significance of dietary folate intake, homocysteine levels and MTHFR 677 C>T genotyping in South African patients diagnosed with depression: test development for clinical application. Metab Brain Dis. 2014;29(2):377–384. doi:10.1007/s11011-014-9506-7
26. Baek JH, Bernstein EE, Nierenberg AA. One-carbon metabolism and bipolar disorder. Aust N Z J Psychiatry. 2013;47(11):1013–1018. doi:10.1177/0004867413502091
27. Chiarani F, Tramontina JF, Ceresér KM, et al. Homocysteine and other markers of cardiovascular risk during a manic episode in patients with bipolar disorder. Braz J Psychiatry. 2013;35(2):157–160. doi:10.1590/1516-4446-2012-0797
28. Lyu N, Xing G, Yang J, et al. Comparison of inflammatory, nutrient, and neurohormonal indicators in patients with schizophrenia, bipolar disorder and major depressive disorder. J Psychiatr Res. 2021;137:401–408. doi:10.1016/j.jpsychires.2021.03.010
29. Ozdogan MG, Aydin EF, Ustundag MF, Ceyhun HA, Oral E, Bakan E. Homocysteine, chronotype and clinical course in bipolar disorder patients. Nord J Psychiatry. 2020;74(5):340–345. doi:10.1080/08039488.2019.1710250
30. Greenland S. Modeling and variable selection in epidemiologic analysis. Am J Public Health. 1989;79(3):340–349.
31. Yu J, Xue R, Wang Q, Yu H, Liu X. The effects of plasma homocysteine level on the risk of three major psychiatric disorders: a Mendelian randomization study. Front Psychiatry. 2022;13:841429.
32. Vargas HO, Nunes SO, Barbosa DS, et al. Castelli risk indexes 1 and 2 are higher in major depression but other characteristics of the metabolic syndrome are not specific to mood disorders. Life Sci. 2014;102(1):65–71.
33. Ishii I, Kamata S, Ito S, et al. A high-methionine diet for one-week induces a high accumulation of methionine in the cerebrospinal fluid and confers bipolar disorder-like behavior in mice. Int J Mol Sci. 2022;23(2):928.
34. Scott TM, Tucker KL, Bhadelia A, et al. Homocysteine and B vitamins relate to brain volume and white-matter changes in geriatric patients with psychiatric disorders. Am J Geriatr Psychiatry. 2004;12(6):631–638.
35. Karababa İF, Savas SN, Selek S, et al. Homocysteine levels and oxidative stress parameters in patients with adult ADHD. J Atten Disord. 2017;21(6):487–493.
36. Wan L, Li Y, Zhang Z, Sun Z, He Y, Li R. Methylenetetrahydrofolate reductase and psychiatric diseases. Transl Psychiatry. 2018;8(1):242.
37. Lok A, Mocking RJ, Assies J, et al. The one-carbon-cycle and methylenetetrahydrofolate reductase (MTHFR) C677T polymorphism in recurrent major depressive disorder; influence of antidepressant use and depressive state? J Affect Disord. 2014;166:115–123.
38. Ezzaher A, Mouhamed DH, Mechri A, et al. Hyperhomocysteinemia in Tunisian bipolar I patients. Psychiatry Clin Neurosci. 2011;65(7):664–671.
39. Kevere L, Purvina S, Bauze D, et al. Elevated serum levels of homocysteine as an early prognostic factor of psychiatric disorders in children and adolescents. Schizophr Res Treatment. 2012;2012:373261.
40. Olas B, Kedzierska M, Wachowicz B. Comparative studies on homocysteine and its metabolite-homocysteine thiolactone action in blood platelets in vitro. Platelets. 2008;19(7):520–527.
41. Carluccio MA, Ancora MA, Massaro M, et al. Homocysteine induces VCAM-1 gene expression through NF-kappaB and NAD(P)H oxidase activation: protective role of Mediterranean diet polyphenolic antioxidants. Am J Physiol Heart Circ Physiol. 2007;293(4):H2344–H2354.
42. Assies J, Mocking RJ, Lok A, Ruhé HG, Pouwer F, Schene AH. Effects of oxidative stress on fatty acid- and one-carbon-metabolism in psychiatric and cardiovascular disease comorbidity. Acta Psychiatr Scand. 2014;130(3):163–180.
43. Kaplan P, Tatarkova Z, Sivonova MK, Racay P, Lehotsky J. Homocysteine and mitochondria in cardiovascular and cerebrovascular systems. Int J Mol Sci. 2020;21(20):7698.
44. Morris G, Walder K, McGee SL, et al. A model of the mitochondrial basis of bipolar disorder. Neurosci Biobehav Rev. 2017;74(Pt A):1–20.
45. Won E, Kim YK. An oldie but goodie: lithium in the treatment of bipolar disorder through neuroprotective and neurotrophic mechanisms. Int J Mol Sci. 2017;18(12):2679.
46. Young AH, Juruena MF. The neurobiology of bipolar disorder. Curr Top Behav Neurosci. 2021;48:1–20.
47. Zhou SJ, Zhang LG, Chen HM, et al. Prevalence and clinical-demographic correlates of hyperhomocysteinemia in inpatients with bipolar disorder in a Han Chinese population. Psychiatry Res. 2018;259:364–369.
 © 2022 The Author(s). This work is published and licensed by Dove Medical Press Limited. The full terms of this license are available at https://www.dovepress.com/terms.php and incorporate the Creative Commons Attribution - Non Commercial (unported, v3.0) License.
By accessing the work you hereby accept the Terms. Non-commercial uses of the work are permitted without any further permission from Dove Medical Press Limited, provided the work is properly attributed. For permission for commercial use of this work, please see paragraphs 4.2 and 5 of our Terms.
© 2022 The Author(s). This work is published and licensed by Dove Medical Press Limited. The full terms of this license are available at https://www.dovepress.com/terms.php and incorporate the Creative Commons Attribution - Non Commercial (unported, v3.0) License.
By accessing the work you hereby accept the Terms. Non-commercial uses of the work are permitted without any further permission from Dove Medical Press Limited, provided the work is properly attributed. For permission for commercial use of this work, please see paragraphs 4.2 and 5 of our Terms.