")
Back to Journals » Journal of Pain Research » Volume 8
Individually based measurement of temporal summation evoked by a noxious tonic heat paradigm
Authors Suzan E, Aviram J , Treister R, Eisenberg E, Pud D
Received 23 February 2015
Accepted for publication 22 March 2015
Published 16 July 2015 Volume 2015:8 Pages 409—415
DOI https://doi.org/10.2147/JPR.S83352
Checked for plagiarism Yes
Review by Single anonymous peer review
Peer reviewer comments 2
Editor who approved publication: Dr Michael Schatman
Erica Suzan,1,2 Joshua Aviram,3 Roi Treister,4 Elon Eisenberg,1,2 Dorit Pud3
1Rappaport Faculty of Medicine, Technion–Israel Institute of Technology, 2Institute of Pain Medicine, Rambam Health Care Campus, 3Faculty of Social Welfare and Health Sciences, University of Haifa, Haifa, Israel; 4Department of Neurology, Massachusetts General Hospital and Harvard Medical School, Boston, MA, USA
Background: A model for measuring temporal summation (TS) by tonic noxious stimulation was recently proposed. However, methodological variations between studies make it difficult to reach a consensus regarding the way TS should be applied and calculated. The present study aimed to present a calculation method of TS magnitude produced by a tonic heat model in a large cohort of healthy subjects.
Methods: Noxious heat stimulation (46.5°C/2 minutes) was applied to the forearm of 154 subjects who continuously rated pain intensity using a computerized visual analog scale. TS was calculated by “mean group” and “individual” approaches.
Results: A “typical” pattern of pain response, characterized by a peak pain followed by a decrease in intensity to a nadir and subsequently a progressive increase in pain scores, was exhibited by 86.4% of the subjects. Using the "mean group" and "individual" calculation approaches, the mean ± standard deviation magnitudes of TS were 31.4±27.5 and 41.0±26.0, respectively (P<0.001). Additionally, using the individualized approach, we identified a different ("atypical") response pattern among the rest of the subjects (13.6%).
Conclusion: The results support the tonic heat model of TS for future utilization. The individualized TS calculation method seems advantageous since it better reflects individual magnitudes of TS.
Keywords: heat pain, healthy volunteers, individual differences, pain perception, temporal summation
Introduction
Temporal summation (TS) is regarded as the human experimental correlate of the electrophysiological “wind up” phenomenon which was first introduced by Mendell in 1966.1 This phenomenon is believed to be a key excitatory pain mechanism of the superficial dorsal horn in the spinal cord. TS is commonly elicited by repetitive mechanical, electrical, or heat phasic pain stimuli administrated at >0.3 Hz.2–11 Yet, some studies have shown that prolonged heat (tonic) nociceptive stimulation at C-fiber–activating intensity can also elicit TS.7,9,12–16 Despite the similarity in the evoked pain modality that was used, it should be noted that there were large variations between these studies in terms of temperature and stimuli duration.
In a series of papers, a novel experimental model for measuring TS was introduced.15,17,18 The model consisted of two stages: First, a temperature that elicited a pain intensity rating of 50/100 was individually predetermined. Then, following a gradual increase (ramp) of temperature to the level determined in the first stage, a tonic constant pain was administrated to the forearm for 2 minutes, during which participants continuously rated their pain intensity by using a computerized visual analog scale (Co-VAS). This procedure allowed the study of three pain-related phenomena, each occurring at specific time frames during the stimulation period: 1) heat–pain coupling (HPC), which occurred simultaneously with the gradual increase in the temperature from baseline to the fixed temperature level. This phenomenon reflects the coupling between temperature rise and pain intensity increase; 2) peak pain, which was recorded soon after the thermode had reached its fixed temperature. The peak pain was characterized by a sharp and brief increase in pain intensity, typically followed by a decrease in pain intensity to a nadir after approximately 60 seconds (T60); 3) TS, a progressive increase in pain perception scores along the remaining minute of stimulation while the thermode temperature remains constant (T120). The authors suggested that the magnitude of TS, for the group studied, should be determined by subtracting the mean group pain intensity at T60 from the mean group pain intensity at T120. This suggested method is simple and sensitive and can be easily applied to both healthy subjects and patients with chronic pain. Moreover, the authors argued that an administration of a tonic rather than a phasic painful stimulus better mimics clinical pain.18 This model seems to have enriched the “pain research tool box” by allowing a consistent means of testing TS. Yet, although the constant heat temperature is set individually, the overall calculation of TS is based on “average” pain intensities recorded in cohorts of subjects at two separate and fixed time points. Therefore, in its suggested form, the model is set to test TS in “groups” rather than in individual subjects (or patients). In an era of “individualized pain medicine”, this way of calculating TS may overlook differences in TS between individual subjects or patients. Hence, the present study suggests an alternative method of individually calculating TS magnitude produced by tonic heat pain model in a relatively large sample size of healthy subjects.
Methods
Subjects
Data from 154 healthy subjects (95 male [M]/59 female [F]) ranging in age from 18 to 39 years (mean ± SD [standard deviation] 25.3±4.1) were retrieved from a pooled data of four different studies conducted at the experimental pain laboratory at the University of Haifa between the years 2009 and 2013. All these studies used the same procedure of tonic heat pain model to produce TS. Subjects were enrolled after meeting the following inclusion criteria: aged between 18 and 40 years, free from any type of pain, not taking medication (except for oral contraceptives), and able to understand the purpose and instructions of the studies. All studies were approved by the Ethics Committee at the University of Haifa, Israel. Prior to the beginning of the experiments, a detailed explanation of the study designs and purposes was given and a written informed consent was obtained from all the participants.
Instruments and measures for tonic TS induction
Tonic TS was applied by using a modification of the original method.18 A thermal testing analyzer (TSA; Medoc TSA-2001 device, Ramat Yishai, Israel) with a 30×30 mm Peltier thermode was used for the assessment of TS. Tonic noxious heat stimulation was applied to the dominant volar using a ramp-and-hold method. The baseline temperature was set to 32.0°C and was increased at a rate of 1°C/s up to a destination temperature of 46.5°C and then remained constant for 120 seconds. Along the entire test duration (a total duration of 135 seconds), subjects continuously rated the magnitude of their perceived pain using a Co-VAS (0–100) which automatically recorded every 0.1 seconds. Prior to the tests, each subject was exposed to a training session. The modifications from the original method included the following: 1) the test temperature in the original method was adjusted individually to elicit pain intensity of 50/100, whereas in the present study, a fixed, supra-pain threshold temperature of 46.5°C was administrated to all subjects and 2) temperature ramping rate in the HPC was faster in the present study (1°C/s vs 0.3°C/s).
Statistical analyses
All analyses were conducted using the SPSS for Windows Version 19 statistical package (SPSS, Inc., Chicago, IL, USA). Data of the recorded pain ratings during the heat stimulation were sampled every 5 seconds, providing 28 readings for the entire test period (ie, time 0–135 seconds). Based on the response to the tonic heat stimulation, the cohort was divided into two subgroups. Subgroup I (typical) consisted of subjects who responded in a similar pattern of pain ratings as was demonstrated by Tousignant-Laflamme et al18 (ie, HPC, followed by peak pain intensity, nadir, and increased intensity up to a second peak toward the end of the stimuli). Subgroup II (atypical) consisted of individuals in whom the typical pattern of response could not be identified. TS was separately calculated for each subgroup.
For subgroup I (typical), the magnitude of TS was calculated by using the following two methods:
- Mean group TS (according to Tousignant-Laflamme et al)18
After averaging each of the 28 pain readings for the entire cohort, the lowest heat pain rating (nadir) and the highest heat pain intensity (second peak) “of the entire group” were identified. A significant difference between these two points (t-test) indicated the presence of TS. The following formula depicts this method of calculation:
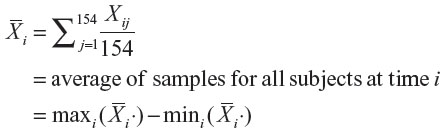
where i = pain readings across the 135 seconds of the heat pain stimuli; j = subject number (n=154); Xij = sample for subject j at time i.
- Individual TS
The previously mentioned two pain readings (ie, nadir and second peak) were identified for “each subject individually”. The recorded intensities were then averaged for the entire group. A significant difference between these two points (t-test) indicated the presence of TS. Individual TS was calculated by subtracting the nadir from the second peak “for each subject”. The following formula depicts this method of calculation:
where R = the individual difference between maximal and minimal samples of a given subject; i = pain readings across the 135 seconds of the heat pain stimuli; j = subject number (n=154).
Paired sample t-tests were performed to test the differences in TS between the two methods of calculation and between sexes.
For subgroup II (atypical), where no nadir and/or second peak pain could be determined, TS magnitude was calculated by subtracting the first pain rating after temperature stabilization from the very last pain rating (T120–T0).
Results were considered significant at the 0.05 level. Values are presented as mean ± SD unless otherwise specified.
Results
From a total cohort of 154 subjects, 133 (86.4%; 82 M/51 F) ranging in age from 18 to 39 years (25.4±4.2) exhibited the “typical” pattern of pain response as was demonstrated by Tousignant-Laflamme et al.18 The other 21 subjects (13.6%; 13 M/8 F) ranging in age from 20 to 33 years (24.8±3.1) demonstrated a different (“atypical”) pattern of response. Sixteen of those 21 subjects rated their pain intensity as constantly increasing throughout the entire stimulation (with no nadir), while the five subjects (3.2% from the entire cohort) exhibited a pattern of a very mild peak pain (9/100 VAS points) followed by a constant decline down to “no pain” (0.2/100 VAS points). The two groups (“typical” and “atypical”) did not differ from each other in their age (independent t-test, P=0.069) or in the M/F ratio (chi-square test, P=0.982).
Subgroup I (n=133)
Calculation of “mean group TS”
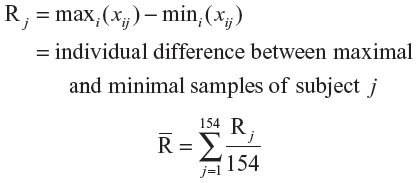
The pattern of the average pain ratings during the entire test is exhibited in Figure 1. As can be seen, the primary peak pain occurred simultaneously with temperature stabilization at the destination temperature of 46.5°C. The nadir and the second peak pain points can be seen at 25 and 115 seconds, respectively, after temperature stabilization. Therefore, to calculate the “mean group TS”, the “average” nadir and second peak pain ratings for subgroup I (T25 and T115) were selected. The pain intensities at T25 and T115 were 28.6±25.8 and 60.0±32.4, respectively (t-test, P<0.001), and the mean group TS was 31.4±27.5.
 | Figure 1 Pain ratings of subgroup I (“typical”) (n=133). |
Calculation of “individual TS”
For calculation of “individual TS”, the “individual” nadir and second peak pain ratings were identified for each subject. Using the individualized method, the mean ± SD pain intensity of all individual nadir points was 21.4±22.1 and the mean ± SD pain intensity of all individual second peak pain points was 62.4±31.7 (t-test, P<0.001). The calculated magnitude of TS according to the individual method of calculation was 41.0±26.0.
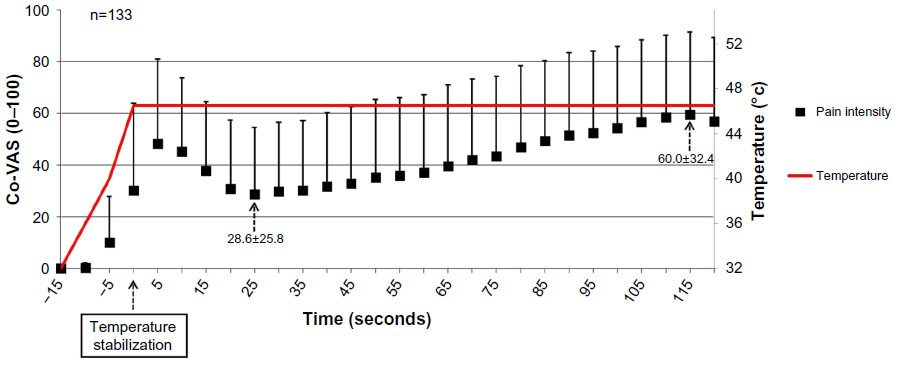
A t-test for comparison between the magnitudes of TS calculated by the two methods revealed a significant difference of 9.7 points (P<0.001; Figure 2).
 | Figure 2 TS magnitudes as calculated by the “mean group TS” and the “individual TS” methods for subgroup I (“typical”). |
Subgroup II (n=21): calculation of TS
For the “atypical” subgroup, the first and last pain ratings after temperature stabilization were identified. For the subjects who exhibited a constant increase in pain ratings throughout the entire stimulation (n=16), the mean ± SD of first and last pain ratings after temperature stabilization were 32.3±8.2 and 56.2±32.1, respectively (t-test, P=0.01; Figure 3A). Thus, the magnitude of TS was 23.9±32.8. A minority of subjects (n=5, 3.2%) showed no summation of pain. Rather, these subjects showed a pattern of a very mild peak pain (9/100 VAS points) followed by a constant decline down to “no pain” (0.2/100 VAS points; Figure 3B). Hence, TS could not be demonstrated.
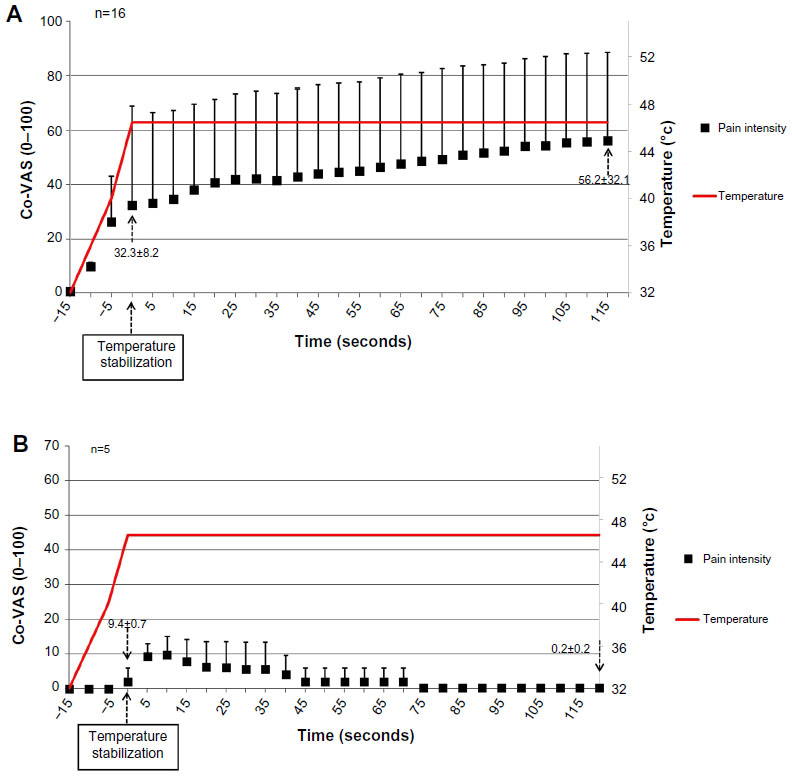 | Figure 3 Pain ratings of subgroup II (“atypical”) (n=21). |
Data analysis by sex
Additional analyses by sex were performed in the same manner. For the “typical” subgroup (n=133), it was found that females (n=51) had a significantly higher TS magnitude than males (n=82) using the “mean group TS” method (P=0.01) as well as the “individual calculation” method (P=0.002) (38.98±31.29 vs 26.56±23.86; 50.13±24.27 vs 35.84±25.58, respectively). Pain ratings for both sexes are depicted in Figure 4A. For the “atypical” subgroup (n=21), 16 subjects (six females and ten males) exhibited TS and no significant difference was found between them using the “individual TS” method (35.00±32.80 vs 17.30±37.57, respectively; P=0.12). Pain ratings for both sexes are depicted in Figure 4B. Three males and two females had no summation of pain and, therefore, TS could not be calculated.
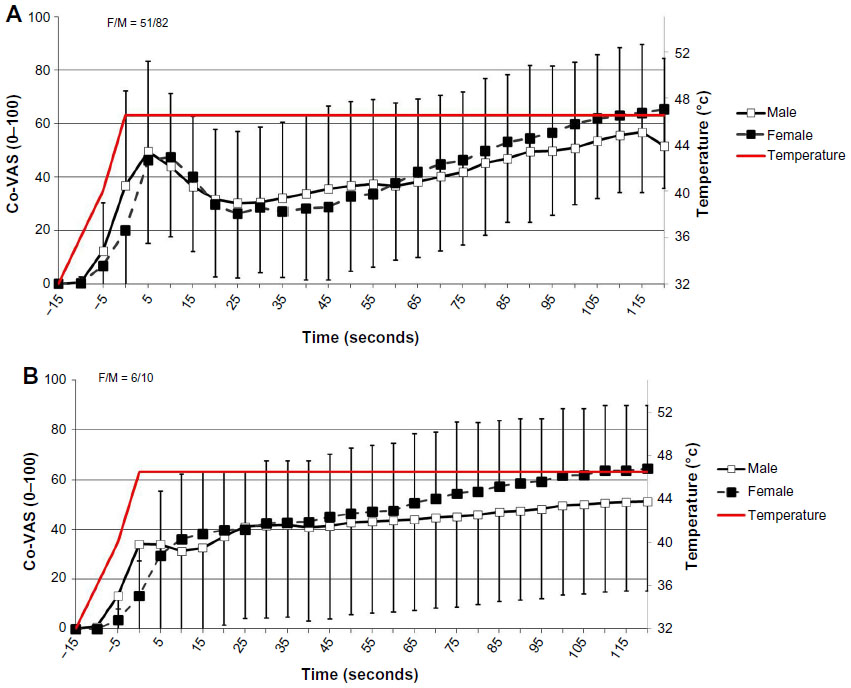 | Figure 4 Pain ratings of both sexes. |
Discussion
During the last decade, a growing body of evidence points to the importance of using advanced methods of “dynamic” quantitative sensory testing in the study of pain processing in humans. These dynamic tests are assumed to evoke complex pathways of pain processing by activating and measuring both temporal and spatial summation modulation of pain.4 One of the obstacles that limit the generalization of conclusions from one study to another emerges from the methodological diversity between different studies. Therefore, the use of replicable paradigms, standard models of calculation, and reporting the magnitude of the tested variables is extremely crucial in these quantitative sensory testing studies, both with healthy subjects and in the clinical setting.
The present study aimed to suggest an alternative calculation method of TS magnitude, induced by tonic heat pain, in a large cohort of healthy volunteers which takes into consideration in-between subject variations. The rationale for suggesting an alternative calculation method emerges from the fact that individuals vary in their pain response to a given experimental noxious stimulation whether it is phasic or tonic.
The present study demonstrated several findings. First, the majority of individuals exhibit enhanced pain ratings following a constant tonic noxious stimulation. Though the classic fashion to produce TS is by using repetitive noxious phasic stimuli administrated at >0.3 Hz,1 some studies have shown that continuous tonic nociceptive stimulation can also elicit TS.7,9,12–18
Second, the pattern of the pain summation for the vast majority of subjects (~90%) resembles the one introduced by Tousignant-Laflamme et al.18 This finding as well as the large number of subjects included in the present study (n=154 vs n=83) strengthens the use of tonic model as a valid paradigm for future utilization. Third, when analyzing the data by sex, it was found that females had higher magnitude of TS than males in the “typical” subgroup, using both calculation methods. This finding is in line with previous studies showing that females exhibit higher magnitudes of TS.19,20
Fourth, and most importantly, the main additive value of the present study is the different approach to calculating TS magnitude. This approach allowed the use of the same paradigm as Tousignant-Laflamme et al,18 but also crucially took into consideration the individual phenotype of pain response. Calculating TS by using an individual-based method perhaps better reflects the true value of “each” individual’s TS. In addition, a minority of individuals exhibited TS by a different pattern than the one expected. Specifically, this subgroup showed either sensitization throughout the test (indicating TS) or adaptation behavior with almost “no pain” response to this type of heat stimulation. It should be noted that the latter subgroup would not have been revealed using the “mean group TS” calculation. When analyzing data by the “mean group” approach, one may conclude that an entire study population responses to a certain noxious stimuli at the same pattern. Yet, by using an individualized approach, such a potential bias can be reduced with the ability to reveal different patterns and exclude certain non standard subgroups from the analysis.
A few differences should be noted between the approaches: 1) in the original report, there was an attempt to individualize the test by adjusting the temperature to each subject’s pain rating of 50/100. Several other studies also employed temperature individualization methods which elicit a predetermined VAS.7,21,22 However, experience shows a limitation to this method: despite the adjustment of the temperature to a fixed stimulus intensity, reported pain scores may vary over the course of different test sessions.21 For this reason, we have chosen to administer in our study a fixed test temperature for all participants, which was within the supra-pain threshold range. The question regarding the “ideal” approach remains open and needs to be further explored. 2) The rate of temperature increase differed between the two studies. Given the fact that one of the aims in the original study was to explore the HPC phase, it was essential to use a more gradual temperature increase rate. In contrast, the main focus of the current study was the production of TS only, and therefore this slow, time-consuming temperature increment was unnecessary.
Taken together, these outcomes emphasize the importance of examining each subject’s individual variations when analyzing different sets of data and not only the average results of the entire cohort, though it is a more time-consuming procedure. The importance of TS, if studied correctly, may enhance the identification of individual response predictors (eg, to analgesic treatments).
Acknowledgments
We kindly thank Dr Ruth Moont for her contribution and assistance in editing this manuscript. We thank Demeter Naor, from the University of Haifa, for her help with the data collection.
Disclosure
All authors declare no support from any organization for the submitted work; no financial relationships with any organizations that might have an interest in the submitted work in the previous 3 years; no other relationships or activities that could appear to have influenced the submitted. The authors report no other conflicts of interest in this work.
References
Mendell LM. Physiological properties of unmyelinated fiber projection to the spinal cord. Exp Neurol. 1966;16:316–332. | |
Arendt-Nielsen L, Graven-Nielsen T, Svensson P, Jensen TS. Temporal summation in muscles and referred pain areas: an experimental human study. Muscle Nerve. 1997;20:1311–1313. | |
Arendt-Nielsen L, Sonnenborg FA, Andersen OK. Facilitation of the withdrawal reflex by repeated transcutaneous electrical stimulation: an experimental study on central integration in humans. Eur J Appl Physiol. 2000;81:165–173. | |
Arendt-Nielsen L, Yarnitsky D. Experimental and clinical applications of quantitative sensory testing applied to skin, muscles and viscera. J Pain. 2009;10:556–572. | |
Edwards RR, Fillingim RB. Effects of age on temporal summation and habituation of thermal pain: clinical relevance in healthy older and younger adults. J Pain. 2001;2:307–317. | |
Eisenberg E, Midbary A, Haddad M, Pud D. Predicting the analgesic effect to oxycodone by ‘static’ and ‘dynamic’ quantitative sensory testing in healthy subjects. Pain. 2010;151:104–109. | |
Granot M, Granovsky Y, Sprecher E, Nir RR, Yarnitsky D. Contact heat-evoked temporal summation: tonic versus repetitive-phasic stimulation. Pain. 2006;122:295–305. | |
Nie H, Arendt-Nielsen L, Madeleine P, Graven-Nielsen T. Enhanced temporal summation of pressure pain in the trapezius muscle after delayed onset muscle soreness. Exp Brain Res. 2006;170:182–190. | |
Price DD, Hu JW, Dubner R, Gracely RH. Peripheral suppression of first pain and central summation of second pain evoked by noxious heat pulses. Pain. 1977;3:57–68. | |
Sarlani E, Greenspan JD. Gender differences in temporal summation of mechanically evoked pain. Pain. 2002;97:163–169. | |
Suzan E, Midbari A, Treister R, Haddad M, Pud D, Eisenberg E. Oxycodone alters temporal summation but not conditioned pain modulation: preclinical findings and possible relations to mechanisms of opioid analgesia. Pain. 2013;154:1413–1418. | |
Kleinböhl D, Hölzl R, Möltner A, Rommel C, Weber C, Osswald PM. Psychophysical measures of sensitization to tonic heat discriminate chronic pain patients. Pain. 1999;81:35–43. | |
Granot M, Sprecher E, Yarnitsky D. Psychophysics of phasic and tonic heat pain stimuli by quantitative sensory testing in healthy subjects. Eur J Pain. 2003;7(2):139–143. | |
Staud R, Robinson ME, Vierck CJ Jr, Price DD. Diffuse noxious inhibitory controls (DNIC) attenuate temporal summation of second pain in normal males but not in normal females or fibromyalgia patients. Pain. 2003;101:167–174. | |
Potvin S, Stip E, Tempier A, et al. Pain perception in schizophrenia: no changes in diffuse noxious inhibitory controls (DNIC) but a lack of pain sensitization. Analgesic and antihyperalgesic effects of nabilone on experimental heat pain. J Psychiatr Res. 2008;4:1010–1016. | |
Redmond WJ, Goffaux P, Potvin S, Marchand S. Analgesic and antihyperalgesic effects of nabilone on experimental heat pain. Curr Med Res Opin. 2008;24(4):1017–1024. | |
Potvin S, Paul-Savoie E, Morin M, Bourgault P, Marchand S. Temporal summation of pain is not amplified in a large proportion of fibromyalgia patients. Pain Res Treat. 2012;2012:938595. | |
Tousignant-Laflamme Y, Pagé S, Goffaux P, Marchand S. An experimental model to measure excitatory and inhibitory pain mechanisms in humans. Brain Res. 2008;230:73–79. | |
Bartley EJ, Fillingim RB. Sex differences in pain: a brief review of clinical and experimental findings. Br J Anaesth. 2013;111:52–58. | |
Fillingim RB, King CD, Ribeiro-Dasilva MC, Rahim-Williams B, Riley JL 3rd. Sex, gender, and pain: a review of recent clinical and experimental findings. J Pain. 2009;10:447–485. | |
Granot M, Weissman-Fogel I, Crispel Y, et al. Determinants of endogenous analgesia magnitude in a diffuse noxious inhibitory control (DNIC) paradigm: doconditioning stimulus painfulness, gender and personality variables matter? Pain. 2008;136:142–149. | |
Tuveson B, Leffler AS, Hansson P. Time dependent differences in pain sensitivity during unilateral ischemic pain provocation in healthy volunteers. Eur J Pain. 2006;10:225–232. |
 © 2015 The Author(s). This work is published and licensed by Dove Medical Press Limited. The full terms of this license are available at https://www.dovepress.com/terms.php and incorporate the Creative Commons Attribution - Non Commercial (unported, v3.0) License.
By accessing the work you hereby accept the Terms. Non-commercial uses of the work are permitted without any further permission from Dove Medical Press Limited, provided the work is properly attributed. For permission for commercial use of this work, please see paragraphs 4.2 and 5 of our Terms.
© 2015 The Author(s). This work is published and licensed by Dove Medical Press Limited. The full terms of this license are available at https://www.dovepress.com/terms.php and incorporate the Creative Commons Attribution - Non Commercial (unported, v3.0) License.
By accessing the work you hereby accept the Terms. Non-commercial uses of the work are permitted without any further permission from Dove Medical Press Limited, provided the work is properly attributed. For permission for commercial use of this work, please see paragraphs 4.2 and 5 of our Terms.