")
Back to Journals » Psychology Research and Behavior Management » Volume 15
Individual Differences in Hemispheric Emotional Valence by Computerized Test Correlate with Lateralized Differences in Nucleus Accumbens, Hippocampal and Amygdala Volumes
Authors Schiffer F , Khan A, Ohashi K, Hernandez Garcia LC, Anderson CM, Nickerson LD, Teicher MH
Received 5 January 2022
Accepted for publication 17 May 2022
Published 1 June 2022 Volume 2022:15 Pages 1371—1384
DOI https://doi.org/10.2147/PRBM.S357138
Checked for plagiarism Yes
Review by Single anonymous peer review
Peer reviewer comments 2
Editor who approved publication: Dr Igor Elman
Fredric Schiffer,1,2 Alaptagin Khan,1,2 Kyoko Ohashi,1,2 Laura C Hernandez Garcia,1,2 Carl M Anderson,1,2 Lisa D Nickerson,1,3 Martin H Teicher1,2
1Department of Psychiatry, Harvard Medical School, Boston, MA, USA; 2Developmental Biopsychiatry Research Program, McLean Hospital, Belmont, MA, USA; 3McLean Imaging Center, McLean Hospital, Belmont, MA, USA
Correspondence: Fredric Schiffer, Developmental Biopsychiatry Research Program, McLean Hospital, Belmont, MA, USA, Tel +1 617 855 2970, Fax +1 617 855 3712, Email [email protected]
Purpose: Conventional theories of hemispheric emotional valence (HEV) postulate fixed hemispheric differences in emotional processing. Schiffer’s dual brain psychology proposes that there are prominent individual differences with a substantial subset showing a reversed laterality pattern. He further proposed that hemispheric differences were more akin to differences in personality than in emotional processing. This theory is supported by findings that unilateral treatments, such as transcranial magnetic stimulation, are effective if they accurately target individual differences in laterality. The aim of this paper was to assess if a computer test of hemispheric emotional valence (CTHEV) could effectively identify individual differences in HEV and to ascertain if these individual differences were associated with underlying differences in brain structure and connectivity.
Patients and Methods: The CTHEV was administered to 50 (18 male/32 female) right-handed participants, aged 18– 19 years, enrolled in a study assessing the neurobiological effects of childhood maltreatment. Based on a literature review, we determined whether CTHEV correlated with lateralized volumes of the nucleus accumbens, amygdala, hippocampus, and subgenual anterior cingulate as well as volume of the corpus callosum.
Results: CTHEV scores correlated with laterality indices of the nucleus accumbens (p = 0.00016), amygdala (p = 0.0138) and hippocampus (p = 0.031). A positive left hemispheric valence was associated with a larger left-sided nucleus accumbens and hippocampus and a smaller left amygdala. We identified four eigenvector network centrality DTI measures that predict CTHEV, most notably the left amygdala, and found that CTHEV results correlated with total and segment-specific corpus callosal volumes.
Conclusion: Individual differences in HEV can be readily assessed by computer test and correlate with differences in brain structure and connectivity that could provide a mechanistic understanding. These findings provide further support for a revised understanding of HEV and provide a tool that could be used to guide lateralized brain treatments.
Keywords: cerebral laterality, brain structure, personality, Dual-Brain Psychology, corpus callosum
Introduction
Three theories have been advanced to explain differences in hemispheric emotional valence (HEV). The first is the valence hypothesis that states that the right hemisphere is associated with negative emotions and the left with positive emotions.1,2 The second is the right brain hypothesis that posits that the right brain is specialized for all emotions,3–5 and the third, the motivational hypothesis proposes that the hemispheres can be categorized as supporting approach or withdrawal emotions,6,7 with the right hemisphere specialized for the expression of emotions associated with withdrawal responses. We believe that these theories are deficient in two major ways. First, they fail to recognize that there are marked individual differences in HEV with a substantial portion of the population displaying a reversed laterality pattern. Second, they overly simplify the differences between the hemispheres, which we have proposed8 involve multifaceted differences that extend beyond positive/negative emotions or approach/withdrawal responses. This fourth theory, which Schiffer has termed Dual Brain Psychology,9 is based on extensive research,8,10–19 and proposes that each hemisphere is associated with a full array of mental properties, including emotional, cognitive, and behavioral reactions. How the hemispheres differ may best be described from a clinical perspective with one hemisphere displaying healthier and more mature aspects of personality and world view while the other presents as more childlike in its mental properties and appears to be more adversely affected by past traumas. Based on work by Wittling20,21 and split-brain studies,22–24 we found that limiting vision to one lateral visual field produces a marked differential effect on hemispheric blood oxygen level dependent (BOLD) activity that extends throughout the contralateral hemisphere14 and we believe, that this brings the stimulated hemisphere’s perspective to the forefront. In most participants shifting stimulation between right and left visual fields produces dramatic differences in their perception of the world and their response to it.9,25 We refer to this means of assessing HEV by comparing their experience of right versus left lateral visual field (LVF) stimulation, the lateral visual field test (LVFT). We proposed that this is a fundamental difference and that transcranial magnetic stimulation (rTMS), used to treat refractory major depressive disorder (MDD), would be effective if it was applied to the more positive hemisphere (at frequencies that produce stimulation) but would not be effective if applied at these frequencies to the more negative hemisphere. Traditionally, rTMS is applied to the left hemisphere based on studies reporting left hemisphere dysfunction or hypoactivity.26 We confirmed in two separate studies12,19 that we could accurately predict whether patients would respond well or poorly to a 2-week course of left hemisphere rTMS based on LVFT, with favorable responses occurring in participants with more positive left hemispheres.
A more nuanced understanding of hemispheric differences in emotional valence has emerged through detailed interviews of patients with psychiatric disorders wearing lateralizing field glasses that restrict vision to left or right visual fields. An excerpt from a published transcript25 with a patient in private practice looking out of each lateral visual field, provides a good example of the nature of hemispheric differences in emotional state, perception and expression that we have observed. When the patient looked out of his left visual field, stimulating his right brain, he reported feeling calm and well and reported that he would never use illicit drugs. When he looked out the right lateral visual field, he said that he could see himself using cocaine again. The treating psychiatrist knew that the patient’s drug problem related to his feeling that his father never respected him, causing intolerable pain that the patient and psychiatrist felt was related to his past cocaine addiction. When the patient was asked to look out of the right visual field, stimulating the left hemisphere, he reported when asked about his father, “With these glasses on it’s sort of like dealing with him again because it’s always the unknown, and it’s always a pressure and a problem.” When asked to look out of the opposite visual field, he reported, “I can deal with him on this side. I know how to handle him now.”
Clearly, this individual expressed marked differences in emotional state looking through left versus right lateralizing field glasses with stimulation of one hemisphere associated with more positive emotions and greater confidence in dealing with, or approaching, a difficult relationship, as well as in risk for drug abuse. In this individual, it was his left hemisphere that was associated with more negative emotions.
We published a paper on the importance of determining the HEV in clinical and in research settings.15 In that paper, we also reported our experience with probe auditory evoked potentials (pAEP) as a basis for determining HEV in 28 subjects. We reported that there was a significant correlation with the total volume of the corpus callosum with right negative HEV associated with a larger volume, r = 0.81, p < 0.005.
The aim of the present study was to create a rapid and reproducible test for HEV that is easier to apply than probe evoked potentials and that did not involve direct clinician or researcher participation. Hence, we sought to develop a computer administered test in which stimuli would be displayed to participants and their responses automatically captured without experimenter involvement. Such a computerized version of the HEV test (CTHEV) has the advantage over the LVFT of being more objective and appearing more constant with usual research practices. The test consists of presenting symmetrical images of an angry person to the two lateral visual fields on separate trials and having the patient rate his or her subjective state immediately after each trial. The test can be adapted for the internet for wider dissemination and can be repeated to measure a patient’s progress or response to an intervention. We then sought to test the hypothesis that lateralized differences in HEV would correlate with lateralized differences in brain volume and network organization that could provide a plausible neurobiological basis for these differences in HEV. Further, we also assessed whether differences in HEV were associated with differences in personality organization using the Revised NEO Personality Inventory.
We administered the computer test for HEV to 50 participants enrolled in a study evaluating the effects of childhood maltreatment on brain structures, function, connectivity and longitudinal risk for substance abuse. We assessed whether CTHEV scores were associated with the morphometry and connectivity of brain structures implicated in anxiety, depression, and childhood maltreatment. Oathes, et al27 reported in a review of MRI findings for anxiety and depression,
The regions most important for understanding both categorical and dimensional aspects of anxiety and depression were the amygdala, ventral striatum, hippocampus, and subgenual ACC.
Teicher et al28 reported that the developmental trajectory of each of these brain regions was altered in a review of studies of brain development in individuals with childhood maltreatment. There have also been findings of network disruptions implicated in depression and anxiety. For example, Gong, et al,29 reported that disruptions in networks involving the nucleus accumbens were related to the severity of depression in 75 patients compared to controls. Similarly, Ohashi et al30 reported that differences in structural network architecture reliably distinguished N = 310 psychiatrically symptomatic versus asymptomatic maltreated individuals and controls. Therefore, we sought to examine whether the HEV scores measured using the CTHEV were associated with the laterality indices of the nucleus accumbens, amygdala, hippocampus, and subgenual anterior cingulate derived from gray matter morphometric measures and whether CTHEV scores were associated with network architecture measures derived from white matter structural connectivity measures from diffusion MRI. Lastly, we wanted to see if we could replicate our earlier finding of a correlation between the HEV scores and the corpus callosum volumes.31
Materials and Methods
Recruitment
The addition of the CTHEV test to the maltreatment, neuroimaging and substance abuse prediction study was approved by the McLean Hospital Institutional Review Board. The study complies with the Declaration of Helsinki. All subjects provided informed written consent and were screened, recruited, and evaluated using previously described methods.32,33 Briefly, subjects for this study were recruited by advertisement using the general tag line “Memories of Childhood.” Subjects were screened by phone for age, handedness, medications, and general health. Subjects who indicated that they were medically healthy, right-handed, un-medicated and between 18–19 years of age were provided with a URL and password to a HIPAA-compliant online enrollment system, which collected detailed information on their life experiences, medical and psychiatric history, developmental history, demographics, and psychiatric symptomatology plus the MACE scale. The overall general criteria of exclusion were as follows. Subjects were excluded who had a history of known neurological disease or insult (eg, any genetic, congenital, traumatic, toxic, infectious, inflammatory, neoplastic, or vascular CNS disorder), head trauma with loss of consciousness, any skull fracture, or any physical assaults above the shoulder that involved more than open-handed slaps. Subjects were excluded with a history of premature birth or birth complications; a history of being shaken in infancy or childhood, maternal substance abuse during pregnancy; or medical disorders that could affect brain development (eg any disorder that affects growth, metabolism, or immune status, or treatment with neoplastic agents, or radiation therapy). Subjects enrolled must not had used medications (except contraceptives, thyroid hormone, or prn use of non-sedating antihistamines, albuterol inhaler, acetaminophen or NSAIDS) for at least 2 weeks (or 5 half-lives for long-acting agents) prior to enrollment. Subjects were excluded with history of alcohol or drug dependence, who had experimented with heroin, cocaine or solvent inhalation or who engaged in more than moderate use of drugs or alcohols (> 10 days per month) or binge drinking. At the time of testing, they needed to be substance free as verified by negative urine toxicology screening tests and alcohol breath testing (Intoximeters™, St. Louis, MO). They were also excluded if their full-scale IQ was < 80. These criteria were intended to avoid confounding variables that were not directly informative and could not be controlled for easily. Exclusion criteria did not include race or gender. The sample was enriched to include a preponderance of participants exposed to 3 or more types of maltreatment.
Computerized Test for Hemispheric Emotional Valence (CTHEV)
Using the program PsychoPy v1.82.01,34,35 we constructed a computerized test for HEV. First, a baseline test was given in which the subject was asked to focus on a central red dot while a friendly female face was shown on the left side of the screen for 0.4 seconds (s), after a 1 second mask, and then the subject was asked to rate his or her level of distress from 0 to 10 on a response computer screen. The response was captured by the computer program and sent to a text file in which all of the subject’s responses would be recorded. This was to acquaint the subject with the method of scoring the emotional response to the image. Then a photograph of an angry man, symmetrical around the midline, was shown to the right side of the screen while the subject was asked to focus on a centrally placed red dot. This image was presented 10 times for 0.4 s, each time following a mask of 1 second. The subject was then asked to rate his or her level of distress as before. The next trial was with a photograph of an angry woman, symmetrical around the midline, presented to the left side of the screen. The trial parameters were otherwise identical to the right sided angry man trial. This trial was followed by the angry man photograph presented to the left side of the screen, followed by a trial with the angry woman photograph presented to the right side of the screen. The entire sequence of trials was then repeated. The HEV score was computed as the difference between the left sided trials of the angry man plus the angry woman images minus the right sided trials. HEV so computed meant that a positive number represented more distress to the left sided photograph which would suggest that the left hemisphere had a more positive valence.
Assessment of Childhood Adversity
For the assessment of childhood adversity, we used the Maltreatment and Abuse, Chronology of Exposure (MACE) scale.36 The MACE assesses severity of recollected exposure to ten types of maltreatment, Emotional Neglect, Physical Neglect, Parental Verbal Abuse, Parental Physical Maltreatment, Parental Non-Verbal Emotional Abuse, Peer Emotional Abuse, Peer Physical Bullying, Witnessing Interparental Violence, Witnessing Violence to Siblings, and Familial and Non-Familial Sexual Abuse across each year of childhood. The scale provides two overall exposure scores. The MACE MULTI score indicates the number of different types of childhood adversities experienced across childhood, whereas the MACE SUM score indicates overall severity of exposure. MACE MULTI scores are similar to and correlate substantially with the Adverse Childhood Experiences (ACE) score37 (r = 0.70), while the MACE SUM score is similar to the childhood trauma questionnaire (CTQ)38 total score (r = 0.74). The MACE has high test-retest reliability (r = 0.91) and meets Bland-Altman criteria for consistency of response.
Diagnoses
Categorical clinical assessment was conducted using the Structured Diagnostic Interview for DSM-IV Axis-I and Axis-II disorders (SCID).39,40
Personality Assessment
Personality assessment was performed using the Revised NEO Personality Inventory (NEO PI-R), which is a revised version of the Costa and McRae’s NEO Personality Inventory, and has been in use widely since its inception.41 The NEO PI-R consists of 240 items and has been updated over the years, with the last updates in 2010.42 The NEO PI-R assesses the big five personality domains of Neuroticism, Extraversion, Openness to Experience, Agreeableness and Conscientiousness, along with the facets of each personality domain, such as Neurotic Depression, Neurotic Anxiety etc.
MRI Data Acquisition
Diffusion-weighted images and high-resolution T1-weighted images were acquired at the McLean Hospital Imaging Center using a 3T Siemens Trio with 32-channel coil (Siemens AG, Siemens Medical Solutions, Erlangen, Germany). An image analyst with expertise in neuroanatomy observed all scans, and scans with discernible motion artifacts were recollected while the participant was in the scanner. Diffusion-weighted images were acquired in 72 directions with scan parameters: b=1000 sec/mm2; echo time (TE)/repetition time (TR)=81 msec/6 sec; 3.5mm slice thickness (no gap); voxel size = 1.8 mm x 1.8 mm x 3.5 mm. Anatomical images were acquired in the sagittal direction using a magnetization prepared rapid gradient echo (MPRAGE) sequence with scan parameters: TE/TR/inversion time = 1⁄4 2.74 msec/2.1 sec/ 1.1 sec; flip angle = 121°; matrix = 256×256 x 128; FOV = 256×256 x 170 mm; bandwidth 48.6 kHz; scan time 4:56.
Gray Matter Morphometry
Freesurfer ver. 6.0.0 (http://surfer.nmr.mgh.harvard.edu/) was used to analyze cortical and subcortical volumes. Details of the Freesurfer’s processing pipeline are previously described43–50 and are documented online (https://surfer.nmr.mgh.harvard.edu/fswiki/FreeSurferMethodsCitation). All brain regions were segmented and labeled using the “recon-all” pipeline. Each subjects’ T1 image was processed through cortical reconstruction which included motion correction, removal of non-brain tissue using a watershed/surface hybrid deformation procedure,46 Talairach transformation, deep gray matter (including amygdala and hippocampus) and subcortical white matter volumetric segmentation,45,48 intensity normalization,51 tessellation of gray matter white matter boundaries, automated topology correction,49,52 and surface deformation following intensity gradients to optimally locate gray/CSF and gray/white borders.43,44,50 Cortical and subcortical regions were parcellated by automatically assigning anatomical label to each location on a cortical surface model. Regional volumes were calculated based on the parcellation provided in aseg.stats files and were used in the subsequent analyses.
White Matter Structural Connectivity and Network Architecture
Diffusion MRI (dMRI) data were processed using methods previously reported by Ohashi et al.53 All dMRI data were visually inspected for motion artifacts or incomplete coverage and then eddy current corrected DTI data were fit to a diffusion tensor model to generate FA images using FMRIB’s Diffusion Toolbox (FDT: FSL FMRIB Software Library, FMRIB Centre, UK). dMRI data were then aligned to the high-resolution structural image. The parcellation process for each subject was conducted in DTI native space54,55 using the resulting inverse transformation from the registration of the high-resolution structural image to standard space and the structural to dMRI transformation to transform the automated anatomical labelling (AAL) template56 from MNI space to each subject’s native space. Deterministic tractography (DTT) was performed on each subject to determine fiber streams between gray matter regions using Diffusion Toolkit and TrackVis,57 Each subject’s cerebral cortex was parcellated into 90 regions (45 per hemisphere with the cerebellum excluded) in individual subject’s DTI space using the AAL template. Each cortical region (ROI) defined a node and voxels were selected within the node as seed points if they had FA values greater than 0.2. The tracking procedure was initiated from the seed points and terminated at voxels with an FA value of less than 0.15 or when the angle between adjacent steps was greater than 45 degrees. This process was repeated for all the voxels within a node. Two AAL nodes were considered to be connected if the reconstructed fiber streams touched these two regions. Fiber streams connecting nodes were defined as edges. The number of fiber streams interconnecting nodes was used as “weights” for weighted networks. Unweighted networks were constructed based on the existence of one or more fiber streams connecting the two regions.
Eigenvector centrality, a spectral centrality network measure based on the idea that the importance of a node is recursively related to the importance of the nodes associated with it that is a measure of the level of influence a node has within a network, was calculated for each node from the weighted network using the R package igraph.58
Statistical Analyses
The primary aim was to test the hypothesis that individual differences in HEV could be accounted for by lateralized differences in the volume of brain regions involved in emotional regulation and expression. This was approached by determining the most parsimonious multiple linear regression equation for HEV that included laterality measures from the four prespecified brain regions as well as covariates for age, sex and multiplicity of exposure to childhood maltreatment. Non-significant predictors were sequentially eliminated from the model until there weew no longer any non-significant predictors, or until the removal of a predictor variable resulted in a significant worsening of the fit based on the likelihood-ratio test. The contribution of each predictor variable to the overall fit was determined by variance decomposition analysis which controls for degree of cross-correlation between predictor variables.59,60 Collinearity between variables was assessed through calculation of the correlation matrix and variable inflation factor. Statistical analyses were conducted in JMP® (version 15) and R (version 3.5.0) using packages “relaimpo” “party” “lmridge” and “caret”. The laterality index (LI) was calculated as (left – right volumes)/(left + right volumes). HEV measures for this sample were not normally distributed and a square-root transform was applied to the absolute values followed by restoration of sign, which brought the distribution as close as possible to normal given the substantial number of tied scores. We also tested the hypotheses that a thinner corpus callosum would be associated with a more negative HEV and with more extreme differences in absolute HEV. We also sought to identify the specific segment(s) of the corpus callosum that best accounted for differences in HEV. Ridge regression was used for this purpose as there was substantial collinearity in segmental volumes. Generalized cross validation was used to select an optimal ridge parameter (k).
As a further means of confirming the association with cerebral volumes we used an AI machine learning approach in which we assessed whether HEV could be predicted based on the centrality of brain regions delineated using fiber-stream network architecture.30 Briefly, we assumed that differences in hemispheric laterality may arise from differences in the centrality and importance of specific brain regions and that this may be an even more relevant parameter than the volume of the region. For this exploratory analysis, we used as potential predictor variables the eigenvector centrality measures for 90 nodes defined using the AAL template.
Conventional statistical techniques were not suitable for this analysis as there was substantial collinearity in eigenvector centrality measures and there were more predictor variables than participants. Instead, we identified the most important cross-validated predictors of HEV using random forest regression with conditional inference trees (RFR-CIT, cforest in R package party),61 a form of artificial intelligence analytics that has been reported to be resistant to collinearity and able to handle a surfeit of potential predictors, which we have used in prior studies.62–64 Random forest regression predicts outcome by creating a forest of decision trees with each tree generated from a different subset of the data and constrained in the number of predictor it can consider at each decision point.65 This “wisdom of the crowd” strategy is well suited to the analysis of collinear data sets and typically provides superior predictions than conventional regression techniques.66 The tree structure can also model interactions and does not assume a linear relationship between eigenvector centrality and HEV. For these analyses, the random forest was trained using data from 63.3% of the participants and evaluated on the withheld test set (36.7%). The variable importance (VI) of each regressor in the model was assessed by permuting the variable, refitting the forest, and calculating how much permutation of that variable increased the mean square error of the fit to the test set. Permuting important regressors produces a large increase in mean square error, whereas permuting unimportant regressors have negligible effect. We use a variant of Brieman’s original approach with conditional inference trees61 that rectifies a problem in the estimation of importance of predictors with many versus few levels or categories.61 This process was repeated 200 times to derive mean measures of VI for each variable. To gauge significance, the overall process was then repeated 2000 times using reshuffled HEV values to calculate chance mean and SD importance levels for each variable. The significance of the z-test differences between observed and chance VI measures for each variable were calculated and adjusted using false discovery rate correction to control for multiple comparisons. We used this approach as we had previously reported that random forest regression was successful in identifying alterations in nodal network centrality that differentiated susceptible maltreated individuals, resilient maltreated individuals and healthy unexposed controls with high accuracy.30
Although RFR-CIT provides an excellent means of identifying important predictors in highly collinear data sets it does not provide a direct indication of the nature of the relationship between the predictor and outcome. Hence, we used the saved random forest to predict the outcome by adjusting degree of exposure to the predictor of interest from zero to maximum while holding all other predictors constant at as close to their median values as observed in the data to ascertain direction of effect as we have done in previous studies.63,64
Results
Participants in this study consisted of the last fifty (18M/32F) individuals consecutively enrolled into the maltreatment, neuroimaging and substance use prediction protocol. All participants were between 18–19 years of age and right-handed. Overall, N=21 (8 M/13 F) were low-risk controls reporting exposure to 0.14 ± 0.36 types of maltreatment and N=29 (10 M/19 F) were members of the high-risk group and reported exposure to 4.4 ± 2.1 types of maltreatment.
Neuroimaging
HEV values ranged from −2.25 to +1.5, with positive values indicative of a more negative emotional response to images presented to the left side/right hemisphere. Overall, 11 participants had positive HEV scores, 24 had negative HEV scores and 15 subjects showed no lateralized difference in emotional response. Table 1 shows the correlation matrix between the regional laterality predictors and additional covariates. Only 2 of the 21 paired correlations were significant and the degree of collinearity was low – well within acceptable limits with a maximal variable inflation factor (VIF) of 1.354. A parsimonious linear model accounted for 34.3% of the variance in the transformed HEV values and included 3 of the 4 regions suggested from the literature: specifically, the laterality indices of the volumes of the nucleus accumbens, the amygdala, and the hippocampus. The LI of the rostral anterior cingulate did not approach significance in the model (p =0.667) and was removed followed by the MACE_MULTI score (p = 0.110). The model met requirements for normality of residuals, homogeneity of variance and was free of outliers and high leverage points. There was also no problem with collinearity as there were no significant correlations between the three significant laterality indices (all p values > 0.6) and maximum VIF was only 1.289.
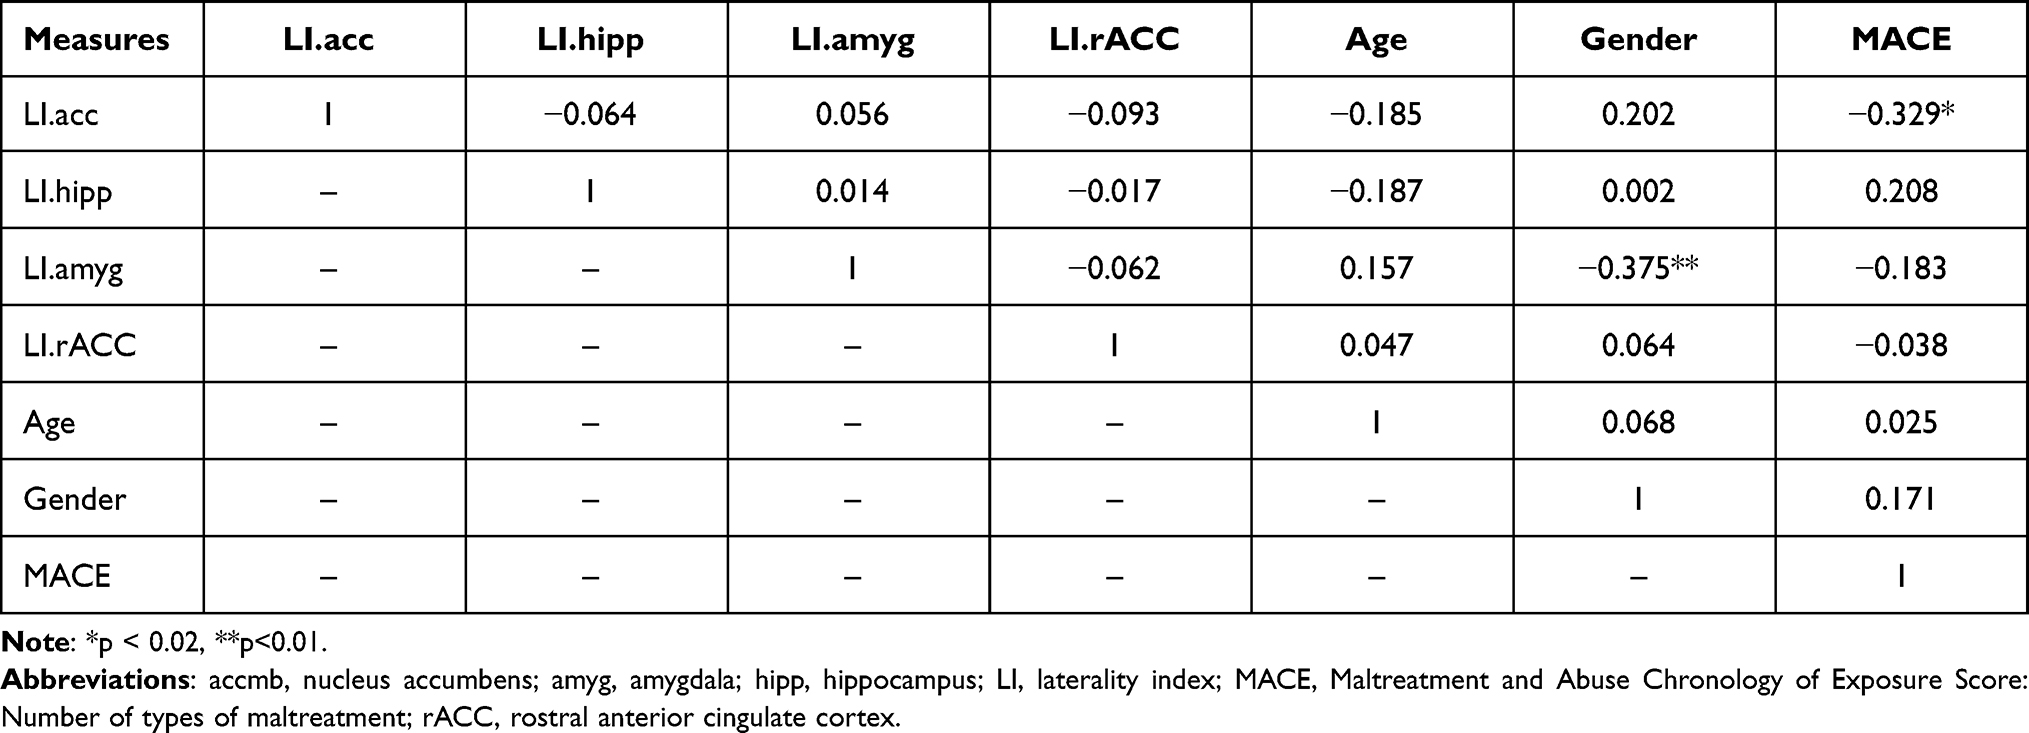 |
Table 1 Correlation Between Primary Independent Measures of Brain Laterality and Covariates |
As shown in Table 2 parameter estimates were significant for the nucleus accumbens, amygdala and hippocampus. Overall, laterality of the nucleus accumbens accounted for 17.4% of the variance in HEV while the amygdala accounted for 4.5% and the hippocampus 4.4%. Subjects with a positive left hemisphere by HEV tended to have a larger left than right sided nucleus accumbens and hippocampus, and a smaller left versus right amygdala. Subjects with a positive right hemisphere tended to have a larger right than left sided nucleus accumbens and hippocampus, and a smaller right versus left amygdala.
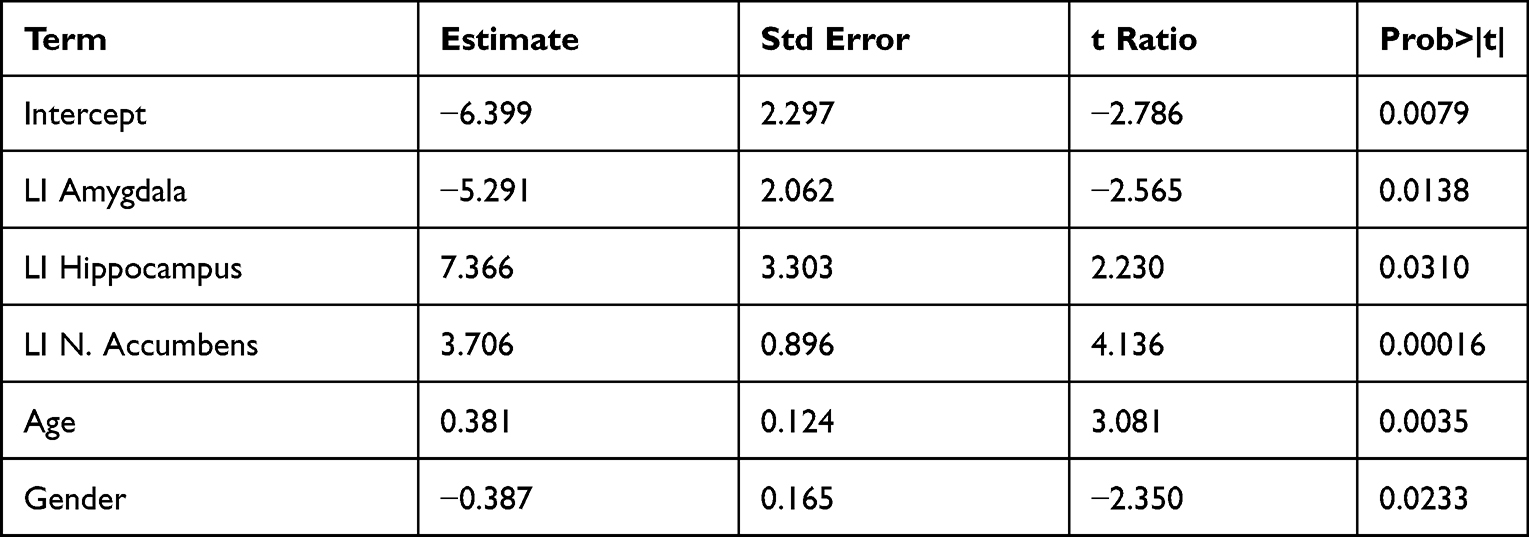 |
Table 2 Parameter Estimates for the Linear Regression Model for Hemispheric Emotional Valence and Regional Brain Laterality |
Table 3 indicates the variable importance measures and FDR-corrected significance levels for the 4 regional eigenvector centrality measures that emerged as predictors of HEV. Interestingly, all the significant predictor nodes were left-sided. Based on the RFR-CIT model greater eigenvector centrality in each of these left-sided nodes was associated with increasing HEV scores. Similarly, the correlations between eigenvector centrality and transformed HEV were all positive (left amygdala r = 0.478; p = 0.0006; left caudate r = 0.343 p = 0.015; left pallidum r = 0.370 p = 0.0081 and left thalamus r = 0.360; p = 0.010). Hence, the more central and important these predictive nodes were to the overall network the more the HEV score tended to increase, reflecting a more positive left hemisphere. One limitation of this analysis is that the AAL template does not include a nucleus accumbens node.
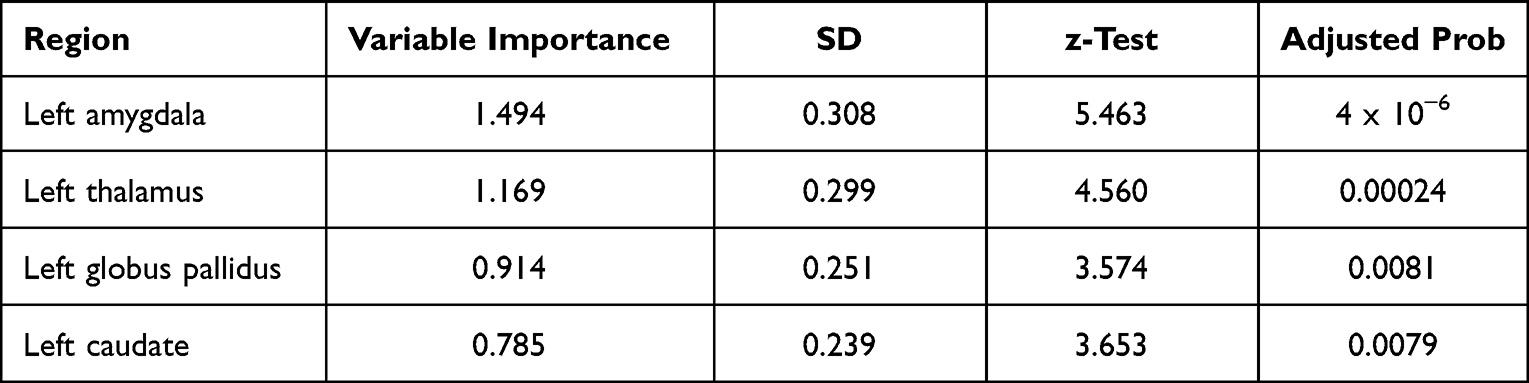 |
Table 3 Identification of Structural Networks Nodes in Which Eigenvector Centrality Was Predictive of Hemispheric Emotional Valence as Determined Using Random Forest Regression with Conditional Inference Trees and Following False Discovery Rate Correction for Multiple Comparisons |
Eigenvector centrality differences were most significant in the left amygdala, with reduced measures of eigenvector centrality in participants with negative HEVs. Figure 1 illustrates group differences in the fiber stream connections of this region in participants with positive HEV, neutral HEV and negative HEV. For these displays we required that at least 30% of participants in a group have evidence for a fiber stream connection with the target node for it to be included as an illustrated direct connection. Interestingly, tractography revealed that direct fiber stream connections between left amygdala and three left prefrontal regions were prevalent in participants with positive HEV and neutral HEV but were not prevalent between left amygdala and prefrontal regions in participants with negative HEV. For example, 37.5% and 36.3% of participants with neutral and positive HEV versus 4% of subjects with negative HEVs had discernible fiberstreams between left amygdala and the orbital part of the left superior frontal gyrus (χ2 = 7.73, p = 0.02). In addition, tractography revealed a prevalent direct fiber stream connection between the left amygdala and left insula in participants with positive (54.5%) or neutral (68.8%) HEVs that was much less apparent in participants with negative HEVs (21.7%, χ2 = 9.1, p = 0.01). Individuals with positive or neutral HEVs also had more prevalent secondary connections between the left amygdala and right prefrontal regions. There were also fewer prefrontal regions with direct connections to the left pallidum in participants with negative HEVs then in participants with neutral or positive HEVs.
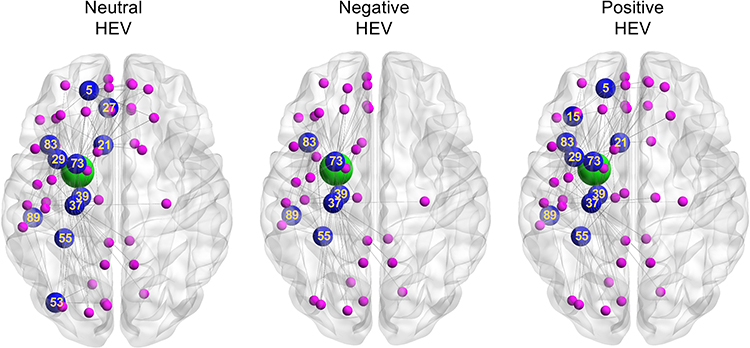 |
Figure 1 Differences in primary and secondary nodal interconnections of the left amygdala in participants with neutral, negative or positive hemispheric emotional valences (HEV). The amygdala is illustrated, as eigenvector centrality of this node emerged as the most significant predictor of HEV. The green circle identifies the location of the amygdala, blue circles indicate primary interconnections, and magenta circles indicate secondary interconnections. Numbers correspond to regions in the automated anatomical atlas. Regions: 5 – superior frontal gyrus, orbital part; 15 – inferior frontal gyrus, orbital part; 21 – subgenual cingulate/olfactory cortex; 27 – gyrus rectus; 29 – insula; 37 – hippocampus; 39 – parahippocampal gyrus; 53 – inferior occipital gyrus; 55 – fusiform gyrus; 73 – putamen; 83 – superior temporal gyrus; 89 – inferior temporal gyrus. Abbreviation: HEV, hemispheric emotional valence. |
As predicted, we found that there was a significant correlation between HEV and total corpus callosum volume (ρ48 = 0.38, p = 0.0063). To further explore this association, we assessed using ridge regression whether transformed HEV scores were associated with volume in one or more segments of the corpus callosum. Overall, transformed HEV was predicted by the volume of the mid anterior segment (scaled b = 0.431, t = 2.65 p = 0.011) and the poster segment (scaled b = 0.3573, t = 2.07, p = 0.044).
We also tested the hypothesis that participants with thinner corpus callosal segments might have more extreme HEV scores. There was a significant inverse correlation between absolute HEV and total corpus callosum volume (ρ48 = −0.29, p = 0.04). Ridge regression analysis using transformed absolute HEV values indicated that there was a significant inverse association specifically with the mid posterior segment of the corpus callosum (scaled b = −0.1196, t = 2.1286, p = 0.039).
Personality Factors
The CTHEV results correlated significantly with 2 factors of the Five-Factor Model of Personality:67 Openness (r48 = −0.352, p = 0.018) and Conscientiousness (r48 = 0.323, p = 0.030). The individual facets of openness that were most strongly associated with HEV were openness to fantasy (r48 = −0.365, p = 0.014) and openness to feelings (r48 = −0.334, p = 0.025). The inverse associations indicates that the more right positive the HEV, the more open the person. The individual facets of conscientiousness with the strongest associations to HEV were deliberation (r48 = 0.401, p = 0.006) and achievement striving (r48 = 0.350, p = 0.010). In this case the more left positive the HEV, the more conscientious and deliberate the personality.
Hemispheric Valence and Diagnoses
Overall, 48% of the sample had a lifetime history of one or more anxiety disorders (including 28% with social phobia, 24% with specific phobias, 14% with panic disorder and 12% with generalized anxiety disorder), which was the most prevalent broad diagnostic category in this sample. In addition, 44%, 22% and 26% had lifetime histories of major depressive disorder (MDD), attention deficit hyperactivity disorder (ADHD) or one or more personality disorders, respectively. As indicated in Table 4 there were no significant associations between HEV and diagnostic category, with similar prevalence rates for each diagnosis within positive, negative and neutral HEV groupings. Further, data on lifetime history of anxiety disorder, MDD, ADHD or personality disorder were not predictive of CTHEV (all p values > 0.3) and the inclusion of these clinical variables in the analysis did not alter the significant association between accumbens, amygdala, and hippocampal laterality and CTHEV.
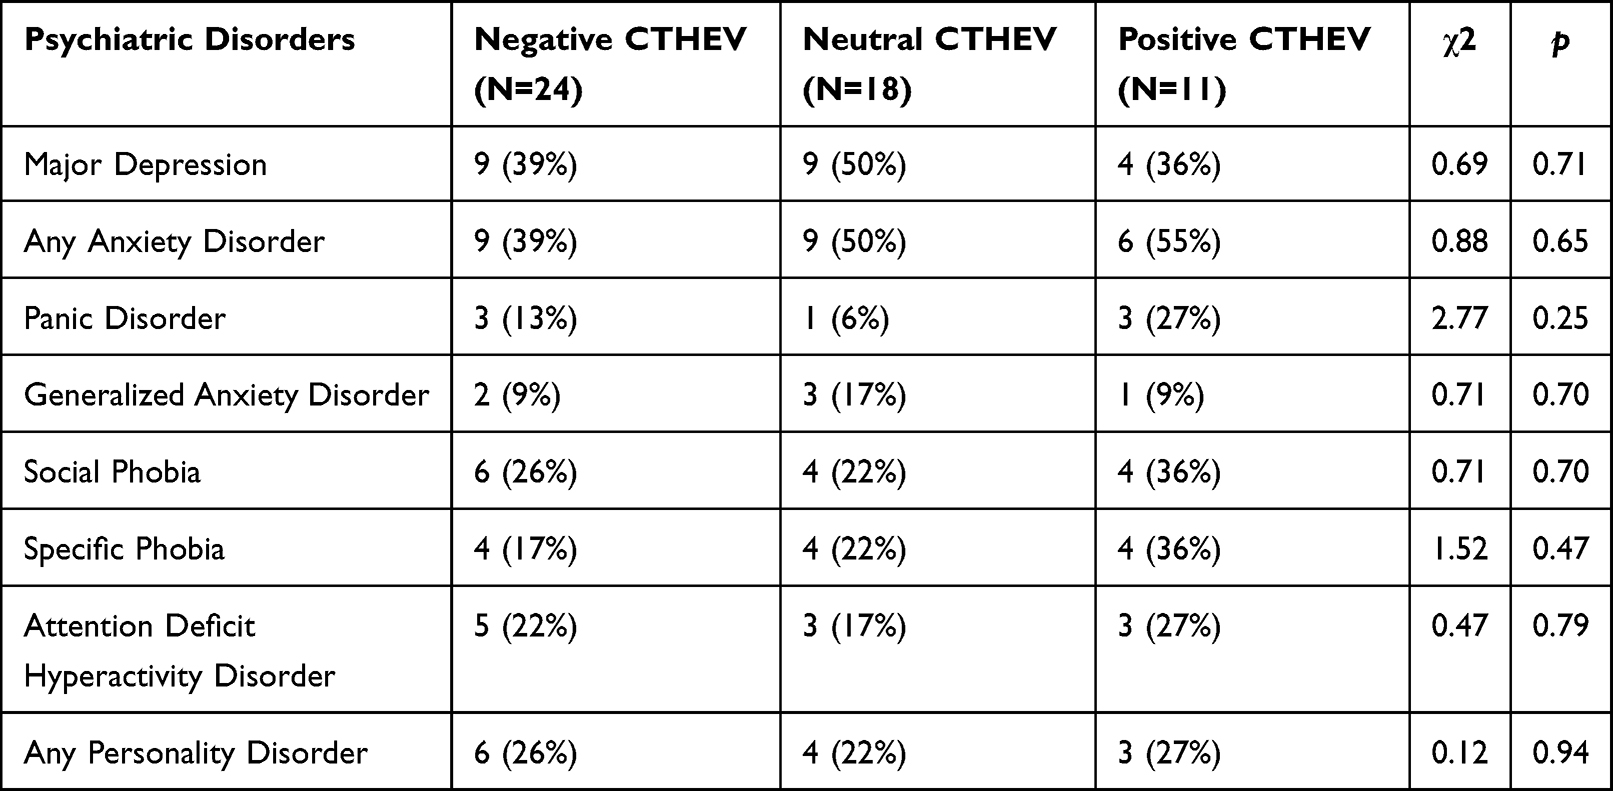 |
Table 4 Number of Participants (and Percentage) with Lifetime Histories of Psychiatric Disorders in Relationship to Hemispheric Emotional Valence as Assessed by Computer Test |
Discussion
We have developed an objective, convenient, inoffensive, computerized test for the determination of HEV as defined by Dual-Brain Psychology (DBP).8 We have found that this method correlates significantly with the lateralized volumes of a number of brain anatomical sites that are functionally related to depression, anxiety, and early life stress. The nucleus accumbens and hippocampus volumes were relatively larger, and the amygdala was relatively smaller on the left side when the HEV indicated that that side was the hemisphere with a more positive HEV. Similarly, more positive HEVs were associated with greater volume of the corpus callosum and particularly the midanterior segment, whereas thinning of the corpus callosum, specifically in the mid-posterior segment was associated with greater absolute differences in HEV. We also found that HEV, determined by the CTHEV correlated with eigenvector centrality of a number of important left-sided network nodes. Further, HEV by CTHEV correlated with 2 personality traits from the Five Factor Model of personality.
We feel that the fact that the CTHEV correlates with brain anatomy and network centrality measures by MRI and with psychological traits lends further support to the validity of the concept that HEV defined by DBP as a valid scientific construct that has important clinical18 and research15 significance. In subsequent studies we have used the CTHEV to guide a lateralized treatment using unilateral transcranial photobiomodulation (tPBM), near infrared mode in two double-blinded randomized controlled trials.13,18 We have also reported that HEV, as assessed using lateralizing field glasses, predicted response to left-sided rTMS12,19 and that CTHEV would likely work as well. The potential importance of guiding treatment based on HEV makes sense given the observation that individuals with more negative left hemisphere are as likely to have histories of MDD as individuals with more negative right hemisphere. Neurosurgeons go to great lengths to carefully localize language functions, whenever relevant, in all individuals, and psychiatrists administering targeted neuromodulatory treatments may experience greater success using a personalized medicine approach to HEV rather than assuming that all individuals are lateralized in the same way.
The use of the CTHEV test on the internet might allow its use with larger populations. Repeated use of the computer test might give an indication of the outcome of treatments, and clinically in psychotherapy it can be useful in showing patients that their emotional perceptions may depend on which hemisphere is more dominant at a given time. In clinical practice,10 the test has been used to show patients that while their anxiety might be very high in one visual field, it is often low in the opposite, and this demonstration can be very helpfully integrated into psychotherapy.
The evidence presented on the correlations of the CTHEV lends further support to the psychological hypothesis and therapeutic method articulated in Dual-Brain Psychology.9,13 HEV is a more complex concept than established hypotheses which propose that the right hemisphere is superior for emotional processing or that the right hemisphere processes negative emotion or withdrawal emotions. The dual brain hypothesis suggests that each hemisphere is associated with broad mental processes or personalities that differ in health and maturity and at the side that is healthier is a trait for an individual but varies among individuals. This means that all negative mental properties are not associated with the right hemisphere. This is a novel concept that comes out of the split-brain studies and Schiffer’s clinical and research work. This present study supports the notion that individuals vary in the side of their positive HEV because our measure of HEV shows strong anatomical and network lateralization that correlates with the individual’s HEV. A positive left hemisphere valence is associated with a larger nucleus accumbens and hippocampus and a smaller amygdala which seems consistent with that hemisphere’s broad positive psychological properties. Similarly, when the person has a positive right HEV, his or her morphologic features are consistent with a positive psychological outlook, a relatively larger right n. accumbens and hippocampus and a smaller amygdala.
The network eigenvector centrality findings indicated that a positive left HEV was associated with increased centrality of hubs consisting of the amygdala, striatum (caudate and globus pallidus) and thalamus on the left side. Conversely, centrality of these key hubs was reduced on the left side in individuals with negative left HEV. Interestingly, direct fiber stream connections between the left amygdala and the insula, subgenual cingulate, and portions of the orbital frontal cortex were less prevalent in participants with negative left HEV. These regions are recognized as primary amygdala connections that play an important role in facial emotion perception68 and suggests that a more negative left hemisphere may be a consequence of reduced top-down regulation. One limitation of the AAL template used is that it does not include a node for the nucleus accumbens, which is a small region that borders the caudate nucleus and lies in close proximity to the globus pallidus. Hence, these findings are consistent with the hypothesis that HEV is a function of lateralized differences in volume and connectivity of key subcortical regions that play a critical role in the regulation of positive69,70 and negative71 affect.
As predicted, we found that there was a significant positive correlation between HEV and total corpus callosum volume with greater corpus callosum volume associated with greater right negative hemispheric valence. Further, we found an inverse correlation between corpus callosum volume and absolute differences in hemispheric valence. One way to interpret this is that greater corpus callosum volume should facilitate interhemispheric communication and integration, and potentially limit the degree of disparity between the hemispheres in emotional valence. Conversely, reducing communication may permit greater hemispheric autonomy and enable a greater degree of hemispheric emotional disparity. Further, enhanced interhemispheric communication may support the more typical finding of greater right/non-dominant hemisphere negativity, whereas reduced interhemispheric communication may play a role in the emergence of a more positive and more emotionally mature right hemisphere.
One limitation of this study was that the sample size was modest and too small to support gender specific analyses of lateralized differences. Further, the results may not be fully generalizable given the predominance of participants who experienced moderate-to-severe exposure to childhood maltreatment. The DTI tractography analyses were limited by use of anisotropic voxel sizes.72 Overall, these findings will need to be replicated by other groups and in more representative samples. Longitudinal studies will also need to be conducted to ascertain when lateralized differences emerge and if they are stable across childhood.
Conclusion
HEV as measured by this CTHEV varied markedly between participants and correlated with brain anatomical findings including lateralized grey matter volumes, corpus callosum volumes, and measures of network centrality. These findings strongly support one of the key premises of DBP, which is that individuals markedly differ in degree and direction of lateralized differences in hemispheric valence.9 Further, this study identified an array of brain imaging findings that likely play an important role in establishing these hemispheric differences given the importance of these identified subcortical structures in positive and negative affect69–71 and the corpus callosum in hemispheric integration.73 There is potentially great value in the use of CTHEV to guide lateralized treatments such as unilateral tPBM,13,18 direct current stimulation, and rTMS.12,74 In particular, unilateral tPBM, based on DBP principals, has been shown to be effective in trials treating anxiety,11,13 depression,18 and opioid use disorder.13,18 Case reports have shown DBP to be a very effective adjunct to in-depth psychotherapy for the treatment of anxiety, depression, PTSD, and addiction.8,25,75 The fact that we have used HEV clinically and experimentally for several years with consistent results hopefully will encourage other groups to become interested in this novel finding that raises many interesting questions worthy of deep exploration.
Acknowledgments
Cynthia E. McGreenery and Elizabeth Bolger, MA, Developmental Biopsychiatry Research Program, McLean Hospital, Belmont, Massachusetts, assisted with recruitment and assessment of study participants and Michael Rohan, PhD and Gordana Vitaliano, MD, PhD, Brain Imaging Center, McLean Hospital, Belmont, Massachusetts, provided technical and clinical support. All of these individuals received compensation for their help.
Funding
The study from which these findings arose was funded, in part, by NIH RO1 award DA-017846 to MHT.
Disclosure
FS after the completion of this study has become the founder of MindLight, LLC which has been issued a NIDA/SBIR Phase I grant in September 2019. FS has also submitted an application for a US Patent covering the CTHEV and he holds 2 issued US Patents on a method of applying unilateral tPBM to the hemisphere with a more positive HEV for treatment of psychiatric disorders. None of the other authors have any potential conflicts of interest to declare.
References
1. Lee GP, Meador KJ, Loring DW, et al. Neural substrates of emotion as revealed by functional magnetic resonance imaging. Cogn Behav Neurol. 2004;17(1):9–17. doi:10.1097/00146965-200403000-00002
2. Roesmann K, Dellert T, Junghoefer M, et al. The causal role of prefrontal hemispheric asymmetry in valence processing of words - Insights from a combined cTBS-MEG study. Neuroimage. 2019;191:367–379. doi:10.1016/j.neuroimage.2019.01.057
3. Gainotti G. Emotions and the right hemisphere: can new data clarify old models? Neuroscientist. 2019;25(3):258–270. doi:10.1177/1073858418785342
4. Packheiser J, Rook N, Dursun Z, et al. Embracing your emotions: affective state impacts lateralisation of human embraces. Psychol Res. 2019;83(1):26–36. doi:10.1007/s00426-018-0985-8
5. Gainotti G. A historical review of investigations on laterality of emotions in the human brain. J Hist Neurosci. 2019;28(1):23–41. doi:10.1080/0964704X.2018.1524683
6. Harmon-Jones E. Early Career Award. Clarifying the emotive functions of asymmetrical frontal cortical activity. Psychophysiology. 2003;40(6):838–848. doi:10.1111/1469-8986.00121
7. Harmon-Jones E. On motivational influences, moving beyond valence, and integrating dimensional and discrete views of emotion. Cogn Emot. 2019;33(1):101–108. doi:10.1080/02699931.2018.1514293
8. Schiffer F. Of Two Minds: Dual-Brain Psychology.
9. Schiffer F. Of Two Minds: The Revolutionary Science of Dual-Brain Psychology. The Free Press; 1998:243.
10. Schiffer F. Unilateral transcranial photobiomodulation for opioid addiction in a clinical practice: a clinical overview and case series. J Psychiatr Res. 2021;133:134–141. doi:10.1016/j.jpsychires.2020.12.004
11. Schiffer F, Anderson CM, Teicher MH. Electroencephalogram, bilateral ear temperature, and affect changes induced by lateral visual field stimulation. Compr Psychiatry. 1999;40(3):221–225. doi:10.1016/S0010-440X(99)90007-X
12. Schiffer F, Glass I, Lord J, Teicher MH. Prediction of clinical outcomes from rTMS in depressed patients with lateral visual field stimulation: a replication. J Neuropsychiatry Clin Neurosci. 2008;20(2):194–200. doi:10.1176/jnp.2008.20.2.194
13. Schiffer F, Khan A, Bolger E, Flynn E, Seltzer WP, Teicher MH. An effective and safe novel treatment of opioid use disorder: unilateral transcranial photobiomodulation. Front Psychiatry. 2021;12:713686. doi:10.3389/fpsyt.2021.713686
14. Schiffer F, Mottaghy FM, Pandey Vimal RL, et al. Lateral visual field stimulation reveals extrastriate cortical activation in the contralateral hemisphere: an fMRI study. Psychiatry Res. 2004;131(1):1–9. doi:10.1016/j.pscychresns.2004.01.002
15. Schiffer F, Teicher MH, Anderson C, et al. Determination of hemispheric emotional valence in individual subjects: a new approach with research and therapeutic implications. Behav Brain Funct. 2007;3(1):13. doi:10.1186/1744-9081-3-13
16. Schiffer F, Teicher MH, Papanicolaou AC. Evoked potential evidence for right brain activity during the recall of traumatic memories. J Neuropsychiatry Clin Neurosci. 1995;7:169–175.
17. Schiffer F, Zaidel E, Bogen J, Chasan-Taber S. Different psychological status in the two hemispheres of two split-brain patients. Neuropsychiatry Neuropsychol Behav Neurol. 1998;11(3):151–156.
18. Schiffer F, Reichmann W, Flynn E, Hamblin MR, McCormack H. A novel treatment of opioid cravings with an effect size of 73 for unilateral transcranial photobiomodulation over sham. Front Psychiatry. 2020;11:827. doi:10.3389/fpsyt.2020.00827
19. Schiffer F, Stinchfield Z, Pascual-Leone A. Prediction of clinical response to transcranial magnetic stimulation for depression by baseline lateral visual-field stimulation. Neuropsychiatry Neuropsychol Behav Neurol. 2002;15(1):18–27.
20. Wittling W, Roschmann R. Emotion-related hemisphere asymmetry: subjective emotional responses to laterally presented films. Cortex. 1993;29(3):431–448. doi:10.1016/s0010-9452(13)80252-3
21. Wittling W, Schweiger E. Neuroendocrine brain asymmetry and physical complaints. Neuropsychologia. 1993;31(6):591–608. doi:10.1016/0028-3932(93)90054-4
22. Sperry RW, Zaidel E, Zaidel D. Self recognition and social awareness in the deconnected minor hemisphere. Neuropsychologia. 1979;17(2):153–166. doi:10.1016/0028-3932(79)90006-X
23. Zaidel E, Zaidel DW, Sperry RW. Left and right intelligence: case studies of Raven’s progressive matrices following brain bisection and hemidecortication. Cortex. 1981;17(2):167–185. doi:10.1016/S0010-9452(81)80039-1
24. Schiffer F, Zaidel E, Bogen J, Chasan-Taber S. Different psychological status in the two hemispheres of two split brain patients. Neuropsychiatry Neuropsychol Behav Neurol. 1998;11(3):151–156.
25. Schiffer F. Can the different cerebral hemispheres have distinct personalities? Evidence and its implications for theory and treatment of PTSD and other disorders. J Trauma Dissociation. 2000;1(2):83–104. doi:10.1300/J229v01n02_06
26. Pascual-Leone A, Rubio B, Pallardo F, Catala MD. Rapid-rate transcranial magnetic stimulation of left dorsolateral prefrontal cortex in drug-resistant depression. Lancet. 1996;348(9022):233–237. doi:10.1016/S0140-6736(96)01219-6
27. Oathes DJ, Patenaude B, Schatzberg AF, Etkin A. Neurobiological signatures of anxiety and depression in resting-state functional magnetic resonance imaging. Biol Psychiatry. 2015;77(4):385–393. doi:10.1016/j.biopsych.2014.08.006
28. Teicher MH, Samson JA, Anderson CM, Ohashi K. The effects of childhood maltreatment on brain structure, function and connectivity. Nat Rev Neurosci. 2016;17(10):652–666. doi:10.1038/nrn.2016.111
29. Gong L, Yin Y, He C, et al. Disrupted reward circuits is associated with cognitive deficits and depression severity in major depressive disorder. J Psychiatr Res. 2017;84:9–17. doi:10.1016/j.jpsychires.2016.09.016
30. Ohashi K, Anderson CM, Bolger EA, Khan A, McGreenery CE, Teicher MH. Susceptibility or resilience to maltreatment can be explained by specific differences in brain network architecture. Biol Psychiatry. 2019;85(8):690–702. doi:10.1016/j.biopsych.2018.10.016
31. Schiffer F, Teicher M, Anderson C, et al. Determination of hemispheric emotional valence in individual subjects: a new approach with research and therapeutic implications. Behav Brain Funct. 2007;3(1):13. doi:10.1186/1744-9081-3-13
32. Teicher MH, Anderson CM, Ohashi K, Polcari A. Childhood maltreatment: altered network centrality of cingulate, precuneus, temporal pole and insula. Biol Psychiatry. 2014;76(4):297–305. doi:10.1016/j.biopsych.2013.09.016
33. Teicher MH, Anderson CM, Polcari A. Childhood maltreatment is associated with reduced volume in the hippocampal subfields CA3, dentate gyrus, and subiculum. Proc Natl Acad Sci U S A. 2012;109(9):E563–72. doi:10.1073/pnas.1115396109
34. Peirce JW. PsychoPy–psychophysics software in python. J Neurosci Methods. 2007;162(1–2):8–13. doi:10.1016/j.jneumeth.2006.11.017
35. Peirce JW. Generating stimuli for neuroscience using psychopy. Front Neuroinform. 2008;2:10. doi:10.3389/neuro.11.010.2008
36. Teicher MH, Parigger A. The ‘Maltreatment and Abuse Chronology of Exposure’ (MACE) scale for the retrospective assessment of abuse and neglect during development. PLoS One. 2015;10(2):e0117423. doi:10.1371/journal.pone.0117423
37. Felitti VJ, Anda RF, Nordenberg D, et al. Relationship of childhood abuse and household dysfunction to many of the leading causes of death in adults. The Adverse Childhood Experiences (ACE) Study. Am J Prev Med. 1998;14(4):245–258. doi:10.1016/S0749-3797(98)00017-8
38. Bernstein DP, Fink L. Childhood Trauma Questionnaire Manual. The Psychological Corporation; 1998.
39. First MB, Gibbon M, Spitzer RL, Williams JBW, Benjamin LS. Structured Clinical Interview for DSM–IV Axis II Personality Disorders. American Psychiatric Association; 1997.
40. First MB, Spitzer RL, Gibbon M, Williams JBW. Structured Clinical Interview for DSM-IV Axis I Disorders - Clinician Version (SCID-CV). American Psychiatric Press; 1997.
41. Costa PTJ, McCrae RR. Revised NEO Personality Inventory (NEO-PI-R) and NEO Five-Factor Inventory (NEO-FF1) Professional Manual. Psychological Assessment Resources; 1992.
42. McCrae RR, Costa PT
43. Fischl B, Dale AM. Measuring the thickness of the human cerebral cortex from magnetic resonance images. Proc Natl Acad Sci U S A. 2000;97(20):11050–11055. doi:10.1073/pnas.200033797
44. Dale AM, Fischl B, Sereno MI. Cortical surface-based analysis. I. Segmentation and surface reconstruction. Neuroimage. 1999;9(2):179–194. doi:10.1006/nimg.1998.0395
45. Fischl B, Salat DH, van der Kouwe AJ, et al. Sequence-independent segmentation of magnetic resonance images. Neuroimage. 2004;23(Suppl 1):S69–84. doi:10.1016/j.neuroimage.2004.07.016
46. Segonne F, Dale AM, Busa E, et al. A hybrid approach to the skull stripping problem in MRI. Neuroimage. 2004;22(3):1060–1075. doi:10.1016/j.neuroimage.2004.03.032
47. Fischl B, van der Kouwe A, Destrieux C, et al. Automatically parcellating the human cerebral cortex. Cereb Cortex. 2004;14(1):11–22. doi:10.1093/cercor/bhg087
48. Fischl B, Salat DH, Busa E, et al. Whole brain segmentation: automated labeling of neuroanatomical structures in the human brain. Neuron. 2002;33(3):341–355. doi:10.1016/S0896-6273(02)00569-X
49. Fischl B, Liu A, Dale AM. Automated manifold surgery: constructing geometrically accurate and topologically correct models of the human cerebral cortex. IEEE Trans Med Imaging. 2001;20(1):70–80. doi:10.1109/42.906426
50. Dale AM, Sereno MI. Improved localization of cortical activity by combining EEG and MEG with MRI cortical surface reconstruction: a linear approach. J Cogn Neurosci. 1993;5(2):162–176. doi:10.1162/jocn.1993.5.2.162
51. Sled JG, Zijdenbos AP, Evans AC. A nonparametric method for automatic correction of intensity nonuniformity in MRI data. IEEE Trans Med Imaging. 1998;17(1):87–97. doi:10.1109/42.668698
52. Segonne F, Pacheco J, Fischl B. Geometrically accurate topology-correction of cortical surfaces using nonseparating loops. IEEE Trans Med Imaging. 2007;26(4):518–529. doi:10.1109/TMI.2006.887364
53. Ohashi K, Anderson CM, Bolger EA, Khan A, McGreenery CE, Teicher MH. Childhood maltreatment is associated with alteration in global network fiber-tract architecture independent of history of depression and anxiety. Neuroimage. 2017;150:50–59. doi:10.1016/j.neuroimage.2017.02.037
54. Gong G, He Y, Concha L, et al. Mapping anatomical connectivity patterns of human cerebral cortex using in vivo diffusion tensor imaging tractography. Cereb Cortex. 2009;19(3):524–536. doi:10.1093/cercor/bhn102
55. Li Y, Liu Y, Li J, et al. Brain anatomical network and intelligence. PLoS Comput Biol. 2009;5(5):e1000395. doi:10.1371/journal.pcbi.1000395
56. Tzourio-Mazoyer N, Landeau B, Papathanassiou D, et al. Automated anatomical labeling of activations in SPM using a macroscopic anatomical parcellation of the MNI MRI single-subject brain. Neuroimage. 2002;15(1):273–289. doi:10.1006/nimg.2001.0978
57. Wang R, Benner T, Sorensen AG, Wedeen V. Diffusion toolkit: a software package for diffusion imaging data processing and tractography. ISMRM Abstract Proc Intl Soc Mag Reson Med. 2007;15:3720.
58. Csardi G, Nepusz T. The igraph software package for complex network research. Int J Complex Syst. 2006;1695:1–9.
59. Grömping U. Estimators of relative importance in linear regression based on variance decomposition. Am Stat. 2007;61(2):139–147. doi:10.1198/000313007X188252
60. Lindeman RH, Merenda PF, Gold RZ. Introduction to Bivariate and Multivariate Analysis. Scott, Foresman; 1980.
61. Strobl C, Boulesteix AL, Zeileis A, Hothorn T. Bias in random forest variable importance measures: illustrations, sources and a solution. BMC Bioinform. 2007;8(1):25. doi:10.1186/1471-2105-8-25
62. Khan A, McCormack HC, Bolger EA, et al. Childhood maltreatment, depression, and suicidal ideation: critical importance of parental and peer emotional abuse during developmental sensitive periods in males and females. Front Psychiatry. 2015;6:42. doi:10.3389/fpsyt.2015.00042
63. Teicher MH, Anderson CM, Ohashi K, et al. Differential effects of childhood neglect and abuse during sensitive exposure periods on male and female hippocampus. Neuroimage. 2018;169:443–452. doi:10.1016/j.neuroimage.2017.12.055
64. Pechtel P, Lyons-Ruth K, Anderson CM, Teicher MH. Sensitive periods of amygdala development: the role of maltreatment in preadolescence. Neuroimage. 2014;97:236–244. doi:10.1016/j.neuroimage.2014.04.025
65. Breiman L. Random Forests. Mach Learn. 2001;45:5–32.
66. Liaw A, Wiener M. Classification and Regression by randomForest. R News. 2002;2/3:18–22.
67. Widiger TA, Crego C. The five factor model of personality structure: an update. World Psychiatry. 2019;18(3):271–272. doi:10.1002/wps.20658
68. Jenkins LM, Stange JP, Barba A, et al. Integrated cross-network connectivity of amygdala, insula, and subgenual cingulate associated with facial emotion perception in healthy controls and remitted major depressive disorder. Cogn Affect Behav Neurosci. 2017;17(6):1242–1254. doi:10.3758/s13415-017-0547-3
69. Forbes EE, Hariri AR, Martin SL, et al. Altered striatal activation predicting real-world positive affect in adolescent major depressive disorder. Am J Psychiatry. 2009;166(1):64–73. doi:10.1176/appi.ajp.2008.07081336
70. Berridge KC, Kringelbach ML. Neuroscience of affect: brain mechanisms of pleasure and displeasure. Curr Opin Neurobiol. 2013;23(3):294–303. doi:10.1016/j.conb.2013.01.017
71. Redlich R, Grotegerd D, Opel N, et al. Are you gonna leave me? Separation anxiety is associated with increased amygdala responsiveness and volume. Soc Cogn Affect Neurosci. 2015;10(2):278–284. doi:10.1093/scan/nsu055
72. Soares JM, Marques P, Alves V, Sousa N. A hitchhiker’s guide to diffusion tensor imaging. Front Neurosci. 2013;7:31. doi:10.3389/fnins.2013.00031
73. Luders E, Narr KL, Bilder RM, et al. Positive correlations between corpus callosum thickness and intelligence. Neuroimage. 2007;37(4):1457–1464. doi:10.1016/j.neuroimage.2007.06.028
74. Schiffer F, Stinchfield Z, Pascual-Leone A. Prediction of clinical response to transcranial magnetic stimulation for depression by baseline lateral visual stimulation. Neuropsychiatry Neuropsychol Behav Neurol. 2002;15(1):18–27.
75. Schiffer F. A dual mind approach to understanding the conscious self and its treatment. Neuroscience. 2021;2(2):224–234. doi:10.3390/neurosci2020016
 © 2022 The Author(s). This work is published and licensed by Dove Medical Press Limited. The full terms of this license are available at https://www.dovepress.com/terms.php and incorporate the Creative Commons Attribution - Non Commercial (unported, v3.0) License.
By accessing the work you hereby accept the Terms. Non-commercial uses of the work are permitted without any further permission from Dove Medical Press Limited, provided the work is properly attributed. For permission for commercial use of this work, please see paragraphs 4.2 and 5 of our Terms.
© 2022 The Author(s). This work is published and licensed by Dove Medical Press Limited. The full terms of this license are available at https://www.dovepress.com/terms.php and incorporate the Creative Commons Attribution - Non Commercial (unported, v3.0) License.
By accessing the work you hereby accept the Terms. Non-commercial uses of the work are permitted without any further permission from Dove Medical Press Limited, provided the work is properly attributed. For permission for commercial use of this work, please see paragraphs 4.2 and 5 of our Terms.