")
Back to Journals » Journal of Multidisciplinary Healthcare » Volume 13
Indicators of Abnormal Hand Grip Strength Among Older Egyptian Adults
Authors Elbedewy RMS, El Said SMS , Taha RM
Received 29 November 2019
Accepted for publication 26 February 2020
Published 28 April 2020 Volume 2020:13 Pages 387—392
DOI https://doi.org/10.2147/JMDH.S240502
Checked for plagiarism Yes
Review by Single anonymous peer review
Peer reviewer comments 2
Editor who approved publication: Dr Scott Fraser
Reem MS Elbedewy, Salma MS El Said, Rana M Taha
Geriatric Medicine and Gerontology Department, Faculty of Medicine, Ain Shams University, Cairo, Egypt
Correspondence: Salma MS El Said; Reem MS Elbedewy
Geriatric Medicine and Gerontology Department, Faculty of Medicine, Ain Shams University, Egypt
, Cairo Tel +201222202878
Email [email protected]; [email protected]
Background: Hand grip strength (HGS) is gaining the attention of researchers and clinicians, including geriatricians as a readily available, inexpensive, and useful measure of muscle strength.
Objective: To identify the indicators of abnormal HGS as measured by a Jamar handheld dynamometer in community-dwelling Egyptian senior citizens.
Study Design: The study was approved by the relevant ethical committee. This cross-sectional study included 200 randomly selected older adults of both sexes who attended geriatric and internal medicine outpatient clinics. Informed consent was obtained, and comprehensive geriatric assessment was performed, including assessment of the health-related quality of life by the 12-Item Short-Form Health Survey (SF-12).
Measurement: HGS was measured, and values of 20 kg or less in females and 30 kg or less in males were considered abnormal.
Statistical Methods: IBM SPSS statistics v25.0 was used for data analysis. Data were expressed as the mean ± SD for quantitative parametric measures and as the number and percentage for categorical data. Student’s t-test, the chi-squared test, the diagnostic validity test, and multiple logistic regression analysis were performed. The ROC (receiver operating characteristic) curve was constructed, and the AUC (area under the curve) was also calculated.
Results: The subjects’ ages ranged from 60 to 95 years with a mean age of 69 ± SD 7.1 years. The sample consisted of 117 females (58.5%) and 83 males (41.5%). The chi-squared test showed that abnormal findings for grip strength were significantly more common among females than males (67.7% vs 32.3%). Student’s t-test showed that both height and weight were significantly lower among subjects with abnormal than normal HGS, while body mass index (BMI) showed a non-significant difference. Stepwise multiple logistic regression analysis showed that there was no actual relationship between sex and abnormality of HGS.
Conclusion: The best indicators of abnormal HGS were found to be a general health score below 25 points on the SF-12 and a height of less than 178 cm. As the values of general health and height decrease below those cut-off points, HGS decreases as well, and vice versa.
Keywords: hand grip strength, quality of life, muscle weakness, senior health, body strength
Introduction
Hand grip strength (HGS) is gaining the attention and interest of researchers and clinicians, including geriatricians, as a readily available, inexpensive, and useful measure of muscle strength. Pluijm et al have stated that HGS is thought to reflect general body strength.1 Tests of HGS can be performed efficiently in older adults, and according to Andersen-Ranberg et al, measurement is easily carried out even by trained survey interviewers in nonclinical settings.2 The availability of HGS data, of course, improves clinical practice.
Body mass index (BMI) is defined as a person’s body mass divided by the square of his or her height [BMI in kg/m2 = mass in kg ÷ (height in m)2]. Because BMI is easy to measure and calculate, it is the most widely used diagnostic tool for determining whether an individual is underweight, overweight, or obese.3,4
The relationship between BMI and grip strength is unclear. Although several studies have focused on the correlation between grip strength and stature or grip strength and body weight, the covariance among sex, BMI, height, and weight has rarely been analysed statistically.5–7
Aim of the Study
To identify the indicators of abnormal HGS (20 kg or less in females and 30 kg or less in males) as measured by a Jamar handheld dynamometer in community-dwelling Egyptian senior citizens.
Methodology
Sample and Methods
The study was approved by the ethical committee of the Faculty of Medicine, Ain Shams University, Cairo, Egypt. This cross-sectional study included 200 randomly selected older adults (60 years old or above) of both sexes who attended the outpatient clinic of the geriatric medicine department and the outpatient clinic of the internal medicine department at Ain Shams University hospital. The study period was 6 months starting from April 2017 to October 2017. Before participation, oral informed consent was obtained from each participant. Then, a comprehensive geriatric assessment was performed, including an assessment of health-related quality of life using the 12-Item Short-Form (SF-12) Health Survey. This survey is a subset of the larger SF-36 and monitors health in general and specific populations; translations and adaptations of the SF-36 currently being evaluated in over 40 countries have also yielded translations of the SF-12.8 For example, selected questions from the Arabic version of the SF-36 have been used to address the domains of the SF-12 test. The SF-12 measures 8 aspects of health, namely, physical functioning, role limitations due to physical health problems, body pain, general health, vitality (energy/fatigue), social functioning, role limitations due to emotional problems, and mental health (psychological distress and psychological well-being). Two subscales are derived from the SF-12: the physical component summary (PCS) and the mental component summary (MCS).8
According to the Utah Health Status Survey,9 the mean for each summary scale in the general population is 50 points with an SD of 10 points. Higher scores indicate a better HRQoL (health-related quality of life). The number of potential participants approached was 227older adults; excluded from them twelve who refused to participate in the study and excluded also additional fifteen participants who had one or more of the other exclusion criteria for the current study which is restricted mobility of the upper limbs, functional decline due to any history of inflammatory joint diseases of the upper extremities, functional decline due to any neurological disorder that affects upper limb activity, any injury to the upper extremities, and body oedema. After the volunteers were screened according to these criteria, HGS was measured using a Jamar handheld dynamometer. According to the Southampton protocol for grip strength measurement, the following steps were performed for each participant:
- Seat the participant comfortably in a standard chair with leg, back support and fixed arms.
- Rest the participant’s forearms on the arms of the chair with each wrist in a neutral position just over the end of the armrest, thumb facing upwards.
- Demonstrate how to use the Jamar handgrip dynamometer to show that gripping very tightly registers the best score.
- Position the hand so that the thumb is around one side of the handle and the other four fingers are around the other side. The instrument should feel comfortable in the hand.
- The observer should rest the base of the dynamometer on the palm of his or her hand as the subject holds the dynamometer. The aim is to support the weight of the dynamometer (to negate the effect of gravity on peak strength), but care should be taken not to restrict its movement.
- Encourage the participant to squeeze as long and as tightly as possible or until the needle stops rising. Once the needle stops rising, the participant can be instructed to stop squeezing.
- Starting with the right hand, read grip strength in kilograms from the outside dial and record the result to the nearest 1 kg on the data entry form. Repeat measurement for the left hand.
- Collect two further measurements per hand, alternating sides to give three readings in total for each side, and then calculate the mean of the three trials for each hand.
- Record hand dominance, i.e., right, left or ambidextrous (people who can genuinely write with both hands).10
The reference values for normal grip strength are >30 kg for males and >20 kg for females, according to the European Working Group on Sarcopenia in Older People 2010.
Statistical Methods
IBM SPSS statistics (v25.0, IBM Corp., USA, 2017) was used for data analysis. Data were expressed as the mean ± SD for quantitative parametric measures and as the number and percentage for categorical data.
The following tests were performed:
- For parametric data, Student’s t-test was used to compare the means of 2 independent groups.
- For categorical data, the chi-squared test was used to examine the association between 2 variables or to compare 2 independent groups.
Results with a P value below 0.05 were considered significant, while those with P values below 0.01 were deemed highly significant.
- The diagnostic sensitivity is the percentage of diseased cases (ie, cases with abnormal HGS) truly diagnosed (true positive [TP]) among total diseased cases (TP + false negative [FN]).
- The diagnostic specificity is the percentage of non-diseased truly excluded by the test (true negative [TN]) among total non-diseased cases (TN + false positive [FP]).
- The predictive value for a positive test is the percentage of cases correctly diagnosed among all positive cases.
- The predictive value for a negative test is the percentage of cases that correctly tested negative among all negative cases.
- The effectiveness, or diagnostic accuracy, of the test is the percentage of cases correctly identified as diseased plus those correctly identified as non-diseased among all cases.
The ROC (receiver operating characteristic) curve was constructed to identify the most sensitive and specific cut-off for each indicator. AUC (area under the curve) can also be calculated to evaluate the markers that discriminate most effectively between the compared groups.
- Multiple logistic regression analysis was used to search for a panel of parameters (independent variables) that can indicate the target parameter (dependent variable). By stepwise multiple logistic regression analysis, we identified the most sensitive indicators of the dependent variable. These indicators can be sorted by P value to gauge their sensitivity in discriminating the target parameter.
Results
We tested a sample of 200 randomly selected subjects who agreed to join the study and did not meet any of the exclusion criteria. The participants comprised 117 females (58.5%) and 83 males (41.5%) and ranged from 60 to 95 years old (the mean age was 69 years ± SD 7.1).
The chi-squared test was used to study the relationship between sex and grip strength; this test showed that abnormal findings for grip strength were significantly more common among females than among males (67.7% vs 32.3%) (Table 1).
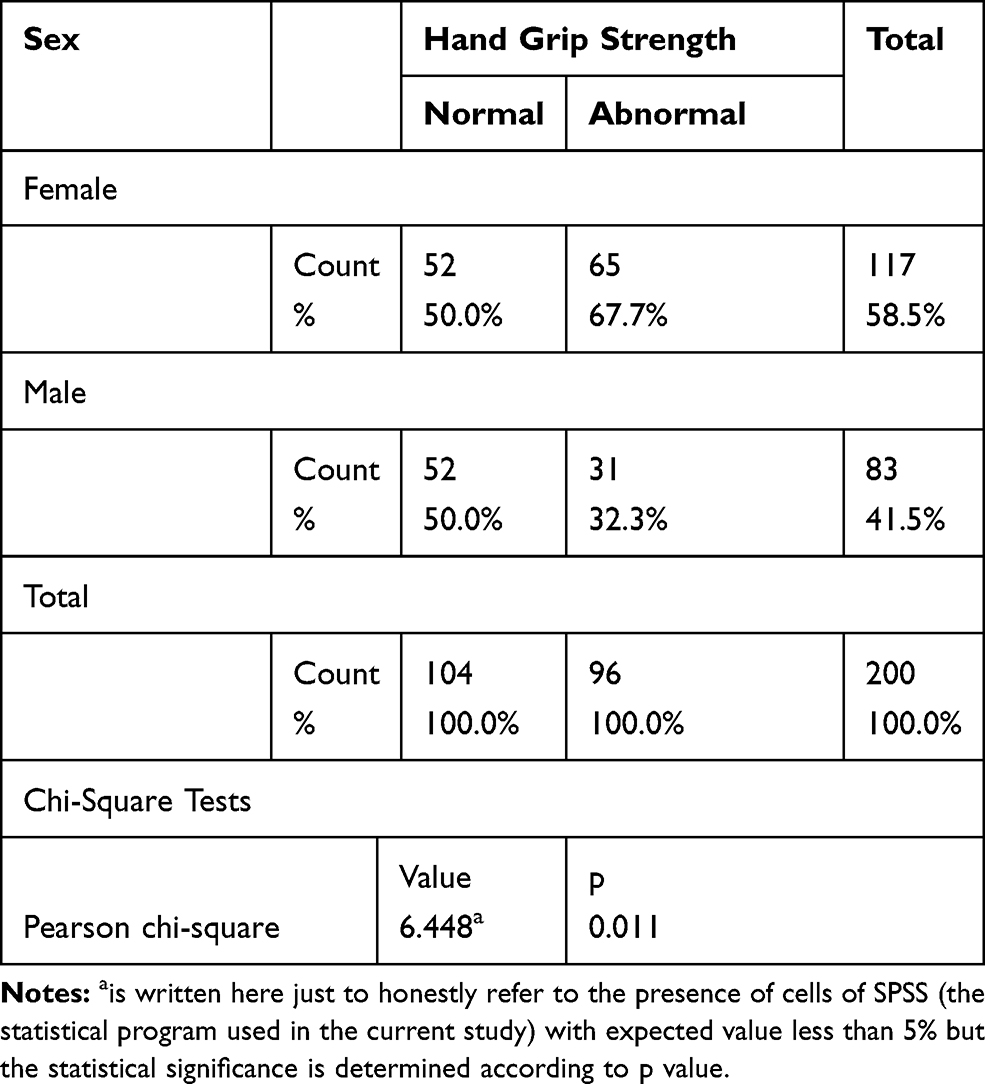 |
Table 1 Relation Between Sex and Hand Grip Strength |
Additionally, Student’s t-test was used to study the comparison between subjects with normal and abnormal grip strength; the test showed that both height and weight were decreased significantly among subjects with abnormal in comparison to normal grip strength, while BMI showed a non-significant difference (Table 2).
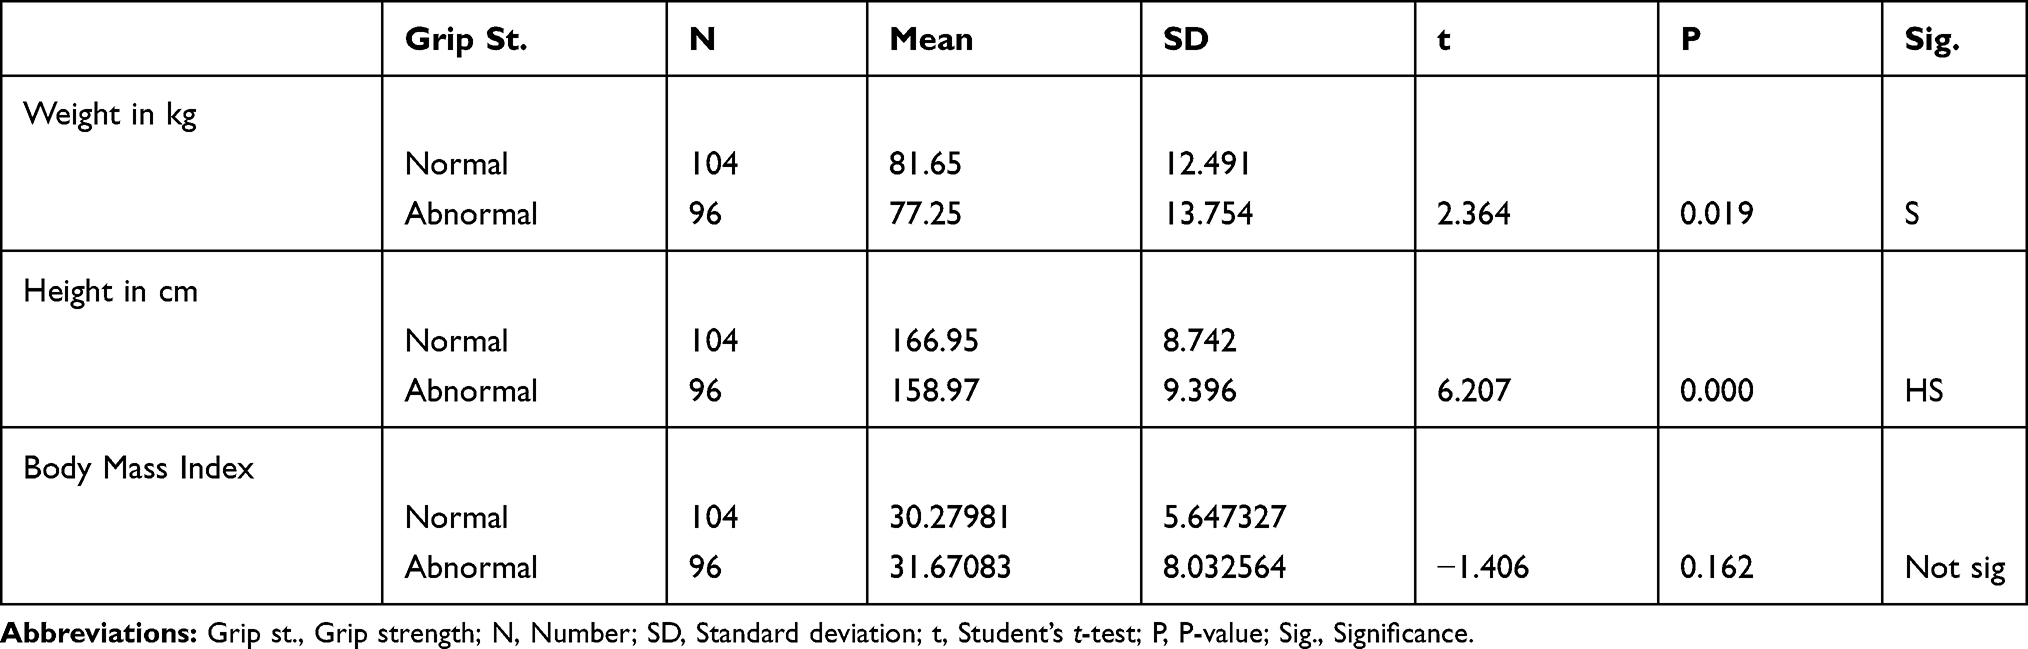 |
Table 2 Comparison Between Subjects with Normal and Abnormal Hand Grip Strength Regarding Weight, Height, and Body Mass Index |
Stepwise multiple logistic regression analysis was used to study the actual indicators of grip strength. Six serial models were used to identify and eliminate the least sensitive indicators; the final model (Model 6) revealed height and general health to be the most sensitive independent indicators of grip strength (F-ratio= 42.9, p<0.001) (Table 3).
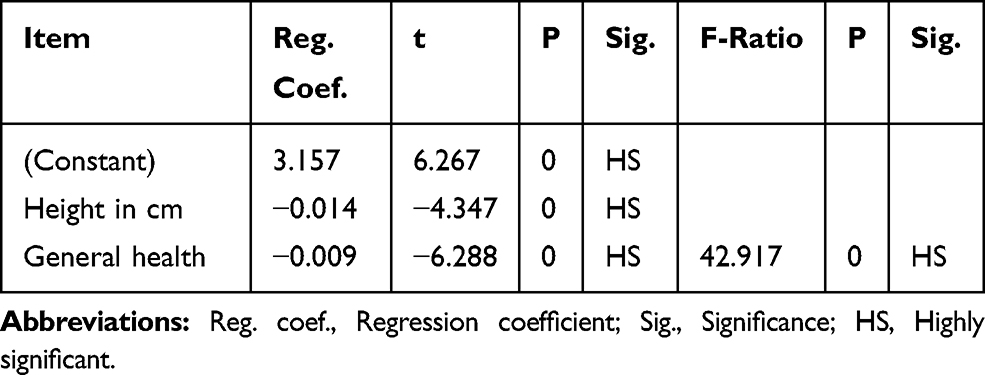 |
Table 3 Model 6 |
Finally, the results revealed no actual relation between sex and HGS abnormality; height and general health were the most sensitive determinants of abnormal HGS (Table 4).
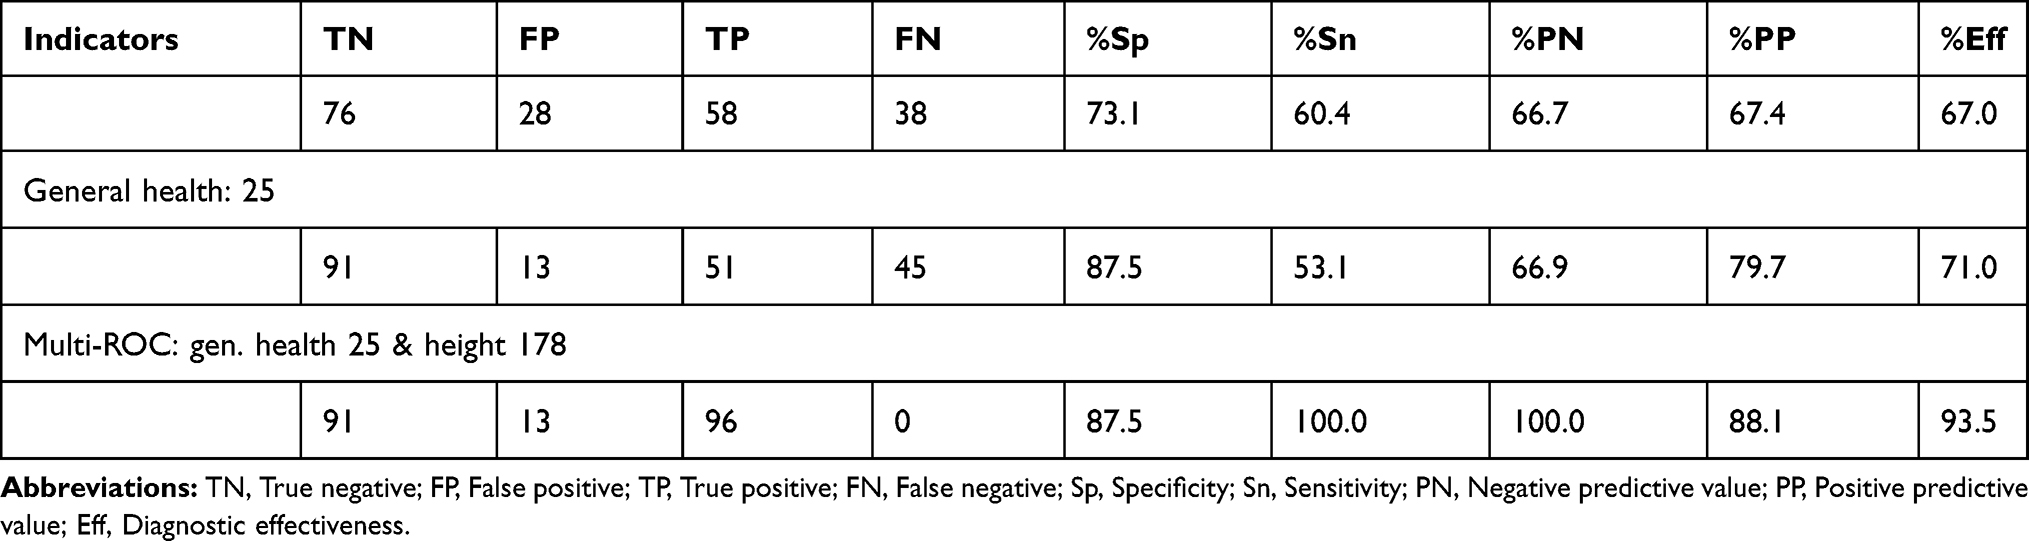 |
Table 4 Diagnostic Validity Test for Hand Grip Strength Indicators |
The area under the curve (AUC) is 0.79 for height, 0.826 for general health, and 0.902 for the ROC for both variables combined (Figure 1).
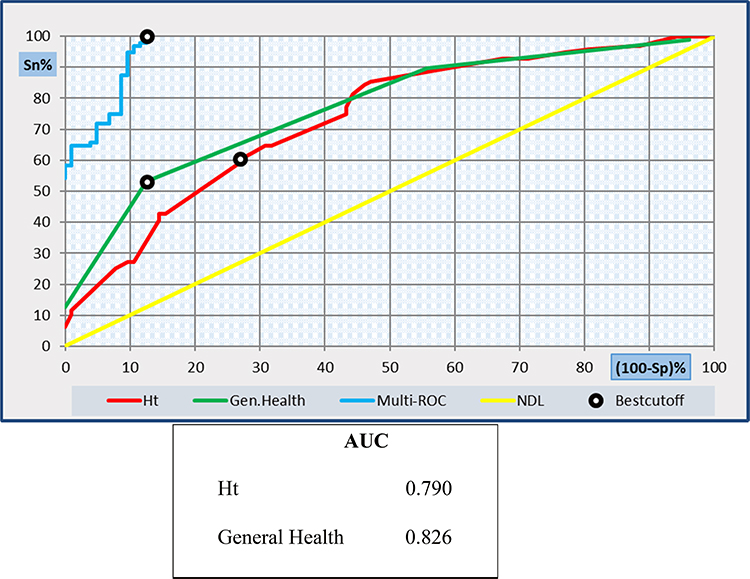 |
Figure 1 ROC curve analysis shows the diagnostic performance of height, general health and the two variables combined in discriminating between patients with abnormal and normal grip strength. |
Thus, the best indicator of abnormal hand grip strength was found to be a general health score below 25 points (as measured by the SF-12 Health Survey) combined with a height of less than 178 cm. As the values of general health and height decrease below those cutoff points, HGS decreases, and vice versa.
Discussion
The relations of both sex and BMI to HGS have been considered in previous studies such as the work of Joris et al,11 who studied children and adolescents, and Kun-Hsi Liao,12 who did not consider age. However, are these factors determinants of abnormal HGS?
These relations are still unclear. The aim of the current study was to identify determinants of abnormal HGS among older Egyptian adults. Statistical analysis of the data from the current study shows that abnormal HGS is significantly more common among females than among males (P =0.011).
This result is consistent with a study by Vianna et al,13 which showed greater handgrip strength in men than in women (p < 0.001).
A recent study by Mendes et al14 showed that handgrip strength was higher among men than among women (p < 0.001), and concerning anthropometric parameters, height was the most significantly correlated with handgrip strength (r = 0.34, p < 0.001, in women and r = 0.40, p < 0.001, in men). In children, HGS showed strong associations with height, weight and sex.11
In the current study, abnormal HGS was significantly related to weight and highly significantly related to height but not significantly related to BMI.
Additionally, stepwise multiple regression analysis was performed for the dependent variable (abnormal HGS), starting with model 1 (F-ratio 5.165), which revealed highly statistically significant relations with height, general health, vitality, and hearing impairment and a significant relation with incontinence but statistically nonsignificant relations with sex, age, weight, and BMI. Subsequent models numbered 2 to 6 were generated to identify the most sensitive indicators of abnormal HGS; the final model, with an F-ratio of 42.917, consisted of height and general health as the most sensitive indicators.
This study indicates that, among older Egyptian adults, the probability of abnormal HGS increases as height and general health decrease. The cutoff point for general health alone was 25 points on the SF-12, and the cutoff for height alone was 161 cm; however, when a general health cutoff of 25 points was combined with a height cutoff of 178 cm, the diagnostic performance improved for discriminating normal from abnormal HGS, as shown in the results and Figure 1. This combination detected all subjects with abnormal HGS (sensitivity 100%) and excluded 87.5% of subjects with normal HGS (specificity 87.5%).
This study is the first to determine cutoff values for indicators of abnormal HGS among older Egyptian adults, and no cutoff points from similar research are available for comparison.
Recommendations
Physicians can infer a high risk of abnormal HGS in older Egyptian adults shorter than 178 cm if those individuals’ general health is below 25 points (as measured by the SF-12 Health Survey).
Data Sharing Statement
The data used to support the findings of this study are available from the corresponding author; Salma M.S. El Said, upon request.
Consent
Oral informed consent was acceptable and approved by the ethical committee of the Faculty of Medicine, Ain Shams University, and that this study was conducted in accordance with the Declaration of Helsinki.
Acknowledgments
The abstract of this paper was presented during the 39th Annual Conference of Ain Shams Faculty of Medicine, 10th – 15th March 2018, as a “Poster” and will be published in the special supplement of QJM (an Oxford University Press journal).
Author Contributions
Conceptualization: Reem M.S. Elbedewy. Methodology: Salma M.S. El Said and Rana M. Taha. Formal analysis: Reem M.S. Elbedewy. Investigation: Salma M.S. El Said and Rana M. Taha. Writing, review, and editing: Reem M.S. Elbedewy. All authors contributed to data analysis, drafting or revising the article, gave final approval of the version to be published, and agree to be accountable for all aspects of the work. All the authors have approved the manuscript in its final form.
Disclosure
The authors have no conflicts of interest to disclose.
References
1. Pluijm SMF, Smit JH, Tromp EAM, et al. A risk profile for identifying community dwelling elderly with a high risk of recurrent falling: results of a 3-year prospective study. Osteoporos Int. 2006;17(3):417–425. doi:10.1007/s00198-005-0002-0
2. Andersen-ranberg K, Petersen I, Frederiksen H, Mackenbach JP, Christensen K. Cross national differences in grip strength among 50+ year-old Europeans: results from the SHARE study. Eur J Ageing. 2009;6(3):227–236. doi:10.1007/s10433-0090128-6
3. Eknoyan G. Adolphe Quetelet (1796–1874)— the average man and indices of obesity. Nephrol Dial Transplant. 2008;23(1):47–51. doi:10.1093/ndt/gfm517.
4. Lindblad A, Dahlin-ivanoff S, Bosaeus I, Rothenberg E. Body composition and hand grip strength in healthy community-dwelling older adults in Sweden. J Aging Res Clin Pract. 2015;4(1):54–58. doi:10.14283/Jarcp.2015.50
5. Shin HY, Kim SW, Kim JM, Shin IS, Yoon JS. Association of grip strength with dementia in a Korean older population. Int J Geriatr Psychiatry. 2012;27(5):500–505. doi:10.1002/gps.2742.
6. Liao KH. Experimental study on gender differences in hands and sequence of force application on grip and hand-grip control. Int J Occup Saf Ergon. 2014;20(1):77–90. doi:10.1080/10803548.2014.11077039.
7. Ibegbu AO, Baita MB, Hamman WO, Emmanuel UU, Musa SA. Evaluation of the relationship between handgrip strength with some anthropometries among Nigerian secondary school students. Anthropologist. 2014;17(3):921–927. doi:10.1080/09720073.2014.11891508
8. Ware JE, Kosinski M, Turner-bowker DM, et al. How to Score Version 2 of the SF-12® Health Survey (With a Supplement Documenting Version 1). Lincoln (RI): Quality Metric Incorporated; 2002.
9. Office of Public Health Assessment. Health status in Utah: the medical outcomes study sf-12 (2001 Utah Health Status Survey Report). Salt Lake City (UT): Utah Department of Health; 2004.
10. Roberts HC, Denison HJ, Martin HJ, et al. A review of the measurement of grip strength in clinical and epidemiological studies: towards a standardised approach. Age Ageing. 2011;40(4):423–429. doi:10.1093/ageing/afr051
11. Ploegmakers JJW, Hepping AM, Geertzen JHB, Bulstra SK, Stevens M. Grip strength is strongly associated with height, weight and gender in childhood: a cross sectional study of 2241 children and adolescents providing reference values. J Physiother. 2013;59(4):255–261. doi:10.1016/S1836-9553(13)70202-9
12. Liao K-H. Handgrip strength in low, medium, and high body mass index males and females. Middle East J Rehabil Health. 2016;3(1):e33860. doi:10.17795/mejrh-33860
13. Vianna LC, Oliveira RB, Araújo CG. Age-related decline in handgrip strength differs according to gender. J Strength Cond Res. 2007;21(4):1310–1314. doi:10.1519/R-23156.1.
14. Mendes J, Amaral TF, Borges N, et al. Handgrip strength values of Portuguese older adults: a population-based study. BMC Geriatr. 2017;17(1):191. doi:10.1186/s12877-017-0590-5
 © 2020 The Author(s). This work is published and licensed by Dove Medical Press Limited. The full terms of this license are available at https://www.dovepress.com/terms.php and incorporate the Creative Commons Attribution - Non Commercial (unported, v3.0) License.
By accessing the work you hereby accept the Terms. Non-commercial uses of the work are permitted without any further permission from Dove Medical Press Limited, provided the work is properly attributed. For permission for commercial use of this work, please see paragraphs 4.2 and 5 of our Terms.
© 2020 The Author(s). This work is published and licensed by Dove Medical Press Limited. The full terms of this license are available at https://www.dovepress.com/terms.php and incorporate the Creative Commons Attribution - Non Commercial (unported, v3.0) License.
By accessing the work you hereby accept the Terms. Non-commercial uses of the work are permitted without any further permission from Dove Medical Press Limited, provided the work is properly attributed. For permission for commercial use of this work, please see paragraphs 4.2 and 5 of our Terms.