")
Back to Journals » International Journal of General Medicine » Volume 14
Independent Risk Factors for the Dynamic Development of COVID-19: A Retrospective Study
Authors Liu M, Jiang H, Li Y, Li C, Tan Z, Jin F, Zhang T , Nan Y
Received 16 June 2021
Accepted for publication 23 July 2021
Published 10 August 2021 Volume 2021:14 Pages 4349—4367
DOI https://doi.org/10.2147/IJGM.S325112
Checked for plagiarism Yes
Review by Single anonymous peer review
Peer reviewer comments 2
Editor who approved publication: Dr Scott Fraser
Miaomiao Liu,1,* Hua Jiang,1,* Yujuan Li,1 Chunmei Li,1 Zhijun Tan,2 Faguang Jin,1 Tao Zhang,1 Yandong Nan1
1Department of Respiratory and Critical Care Medicine, Tangdu Hospital, Air Force Military Medical University, Xi’an, 710038, People’s Republic of China; 2Department of Health Statistics, Air Force Military Medical University, Xi’an, 710032, People’s Republic of China
*These authors contributed equally to this work
Correspondence: Yandong Nan; Tao Zhang Email [email protected]; [email protected]
Objective: To identify the risk factors for predicting the dynamic progression of COVID-19.
Methods: A total of 2321 eligible patients were included in this study from February 4 to April 15, 2020. Two illness conditions, including mild/moderate (M/M) subtype to severe/critical (S/C) and S/C to fatality, were classified. Clinical message was collected and compared, respectively. Kaplan–Meier method, Cox regression model and risk score system were used to predict disease progression in S/C COVID-19.
Results: A total of 112 of 1761 patients with M/M subtype were progressors (P) and 1649 non-progressors (NP). Increasing disease progression associated with higher levels of neutrophils count (HR=1.958, 95% CI=1.253– 3.059, P=0.003), CK (HR=2.203, 95% CI=1.048– 4.632, P=0.037), LDH (HR=3.309, 95% CI=2.083– 5.256, P< 0.001) and CRP (HR=2.575, 95% CI=1.638– 4.049, P< 0.001), and lower level of lymphocytes count (HR=1.549, 95% CI=1.018– 2.355, P=0.041), as well as total lesion volume ratio greater than ≥ 10% (HR=2.286, 95% CI=1.451– 3.601, P< 0.001) on admission. In progression to fatality, 56 of the 672 S/C cases died and 616 survived. Increasing fatality associated with lower level of lymphocytes count (HR:2.060, 95% CI:1.000– 4.242, P=0.050), higher levels of BUN (HR:2.715, 95% CI:1.539– 4.790, P< 0.001), CK-MB (HR:3.412, 95% CI:1.760– 6.616, P< 0.001), LDH (HR:5.578, 95% CI:2.317– 13.427, P< 0.001), and PT (HR:3.619, 95% CI:2.102– 6.231, P< 0.001). Furthermore, high risk of neutrophils count, lymphocytes count, CK, LDH, CRP, and total lesion volume ratio was powerfully correlated with the incidence of progression to S/C in patients with NS COVID-19 and high odds of lymphocytes count, BUN, CK-MB, LDH, and PT were significantly associated with death in patients with S/C COVID-19. In addition, the progression and mortality rates increased with increasing risk scores.
Conclusion: Elevated LDH level and lymphopenia were independent predictors for COVID-19 sustainable management in classifying non-severe patients who progressed to severe condition and identifying S/C patients who deteriorated to fatal outcomes as well. Total lesion volume ratio ≥ 10% may provide early predictive evidence with COVID-19 patients at high risk of developing into S/C to improve prognosis.
Keywords: COVID-19, mild/moderate, severe/critical, progression, fatality, risk factors
Introduction
In December, 2019, a coronavirus disease 2019 (COVID-19) caused by acute respiratory syndrome coronavirus 2 (SARSCoV-2) occurred.1–3 Due to its rapid spread throughout China and subsequently around the world, COVID-19 has been declared as a pandemic by the World Health Organization (WHO).4,5 The clinical spectrum of COVID-19 varied degrees, which ranging from mild to critically ill.6 Although the majority of patients suffer with mild syndrome from the onset of symptoms and have good prognosis, some cases experience progressive disease deterioration, resulting in persistently increased fatal outcomes daily.7
Accumulating studies have described clinical manifestations and underlying risk factors affecting the prognosis of COVID-19 patients, include older age, complications with hypertension, lymphopenia,8–10 etc. However, the majority of these reports have focused on predictors of disease progression or fatality in COVID-19 patients, while neglecting risk indicators associated with the whole dynamical clinical deterioration process of COVID-19 from non-severe to S/C and S/C to death. Moreover, total lesion volume ratio of CT scans analyzed by the uAI Intelligent Assistant Analysis System is of great significance to assess the association with severity grading of COVID-19.11,12 However, few studies have suggested whether it may provide the early identification information for patients with COVID-19 as the disease developed. In order to implement timely individualized therapeutics and allocate medical resources more reasonably, it is awfully important to recognize potentially S/C developing combined clinical manifestations and laboratory variables, along with radiologic features.
In this study, we retrospectively collected the accurate information from COVID-19 patients who were admitted to Huo Shen-Shan hospital. It concentrates on the clinical indicators in forecasting and monitoring disease dynamic development of these patients in diverse stages, aiming to identify independent predictors of clinical progression in initially M/M-progression patients at admission along with the prognosis in patients initially S/C condition upon admission and derived from M/M-progression during the hospitalization, so as to optimize management of the epidemic.
Methods
Study Design and Participants
This single-center, retrospective study was done at Huo Shen-Shan hospital in Wuhan city, China, which is a designated hospital to cure patients with COVID-19. From February 4 to April 15, 2020, we retrospectively analyzed 3050 patients with COVID-19 who had been diagnosed with COVID-19, of whom 729 were excluded for lack of complete clinical data and inaccurate time of progression into severe or critical COVID-19. Assessment of illness changeable course for COVID-19 ranges from M/M to S/C and S/C to death. For the first period of disease progression in non-severe COVID-19, we collected 1761 eligible patients with COVID-19 infection, 112 of whom with disease progression (Figure 1). In the second phase of prognostic outcomes in severe to critical cases, we analyzed 672 qualified patients with severely or critically ill, who comprised of 560 cases with S/C condition upon admission and 112 cases rapidly developed from M/M subtype of COVID-19, of whom 56 were developing into fatal outcomes (Figure 1). The criteria reference for diagnosis, clinical classification of COVID-19 was based on guidance developed by the National Health Commission of China (Version 7).13 The study was approved by the Ethics Committee of Tangdu hospital (Take over an intensive care unit of Huo Shen-Shan Hospital temporarily) of Xi’an city and the requirement for informed consent was waived due to the rapid emergence of COVID-19. The patients’ data in the present study were in accordance with the Declaration of Helsinki.
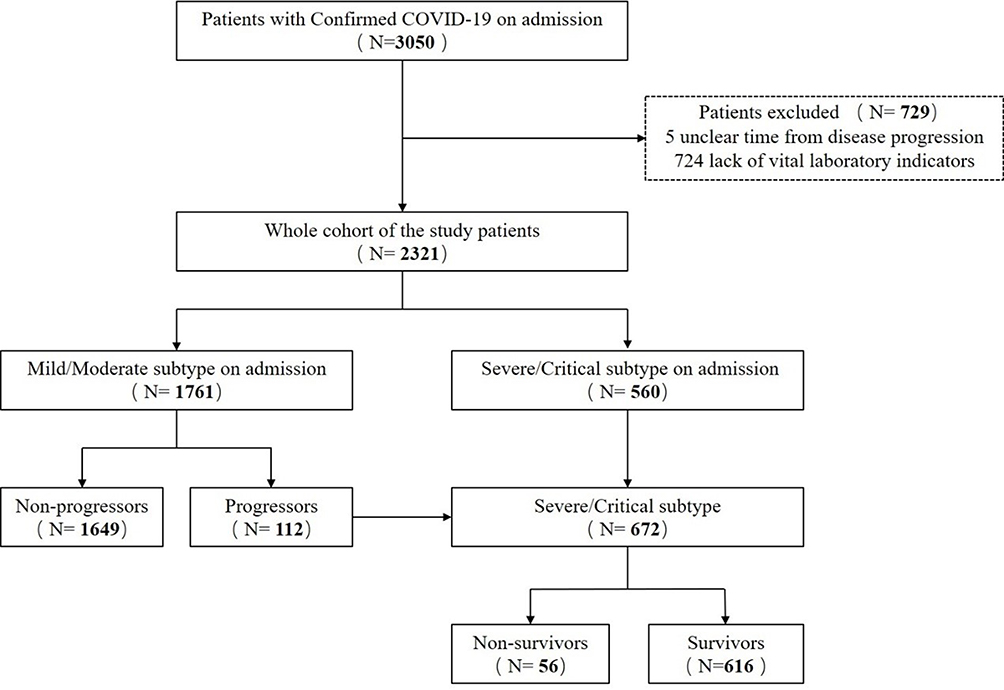 |
Figure 1 Flow chart of cases selection. |
COVID-19 Clinical Classification
The severity of COVID-19 is classified into four types, including mild type, moderate type, severe type, and critical type. Mild type refers to the clinical symptoms as mild with no abnormal radiological findings. Moderate type refers to fever, cough and other symptoms that are presented with pneumonia on chest computed tomography. The diagnosis is determined to be of severe type if one of the following conditions is present: respiratory distress, respiratory frequency ≥30 per min; oxygen saturation in room air at rest ≤93%; or partial pressure of oxygen in arterial blood (PaO2)/fraction of inspired oxygen (FiO2) ≤300 mmHg. Any of the following conditions results in a diagnosis of critical type: Respiratory failure occurs and mechanical ventilation is required; shock; or patients with other organs dysfunction needing intensive care.
Data Collection
The data of general personal information, clinical characteristic, laboratory examinations, radiologic assessments, and outcomes were extracted and crosschecked from clinical electronic medical records for all patients confirmed COVID-19. Clinical characteristics included age, gender, symptoms (fever, cough, sputum, dyspnea, myalgia, fatigue, nausea or vomiting, diarrhea, headache), and comorbidities (hypertension, diabetes, cardiovascular disease, respiratory disease, endocrine system disease, liver disease, cerebrovascular disease, malignancy, kidney disease, and other) on admission. The length of hospitalization of enrolled patients was collected. Laboratory findings comprised blood routine, liver and renal function, serum biochemistry, coagulation profile, and C-reactive protein. Total lesion volume and total lesion volume ratio of pulmonary were evaluated by chest computed tomography together with intelligent software. Definite diagnosis of COVID-19 was achieved by throat-swab specimens from the upper respiratory tract according to the protocol established by the Chinese CDC. Laboratory confirmation of COVID-19 and exclusion of other respiratory virus infections were performed using Real-time Reverse Transcription Polymerase Chain Reaction Assay (RT-PCR). All tests were performed using commercial kits at the Department of Clinical Laboratory of Huo Shen-Shan Hospital, according to the product manual.
Statistical Analysis
Continuous variables were presented as mean (standard deviation, SD) or median (interquartile range, IQR). The Student’s t-test and the Mann–Whitney U-test were used for normally distributed and non-normally distributed variables, respectively. Categorical variables were presented as number (percentage), and the chi-squared test and Fisher’s exact test were performed as appropriate. Survival curves were described using the Kaplan–Meier method and compared using the Log rank test. Cox regression analysis of univariate and multivariate was applied to estimate risk factors associated with the dynamic development of COVID-19. Risk-score systems were constructed using the significant independent clinical variables to predict progression and mortality. The risk score ranged from 0 to 6 for progression and 0 to 5 for mortality (which were chosen based on statistical significance). A value of P < 0.05 was considered statistically significant. All statistical analysis was performed using SAS (version 9.4) and R package (version 3.5.2).
Results
Clinical Characteristics in COVID-19 with Distinct Severity Classification
1761 patients with mild/moderate COVID-19 included in the process of disease deterioration, 112 (6.36%) patients were grouped into progression to severe COVID-19 and 1649 (93.64%) patients were progression-free cases. The mean age was 57.26 years (SD 14.29). Patients from the progression to severe group were older than those from the progression-free group. Male patients accounted for 49.86% of all patients. The most common symptoms of patients on admission were fever (72.57%) and cough (70.13%), followed by fatigue (54.29%), dyspnea (47.25%), myalgia (29.64%), and expectoration (16.41%). Less common clinical symptoms including diarrhea (5.85%), nausea or vomiting (3.80%), and headache (2.84%). Various comorbidities including hypertension (27.77%), diabetes (12.15%), and cardiovascular disease (5.68%) were the most frequent coexisting conditions. Compared with patients with moderate COVID-19 who did not deteriorate to severe type, patients who developed progressive state were significantly older (aged ≥80 years, 15.18% vs 4.31%, P<0.001), and had more likelihood of dyspnea symptom (61.61% vs 46.27%, P=0.002), and were more likely to have underlying comorbidities, including hypertension (45.54% vs 26.56%, P<0.001), diabetes (18.75% vs 11.70%, P=0.027), respiratory disease (8.93% vs 2.91%, P<0.001), cerebrovascular disease (15.18% vs 4.31%, P<0.001) on admission. No significant differences were observed between the two groups in terms of gender (P = 0.821). By comparing between the length of hospitalization in two groups, progressive patients had longer duration than non-progressive patients (P<0.001), as shown in Table 1.
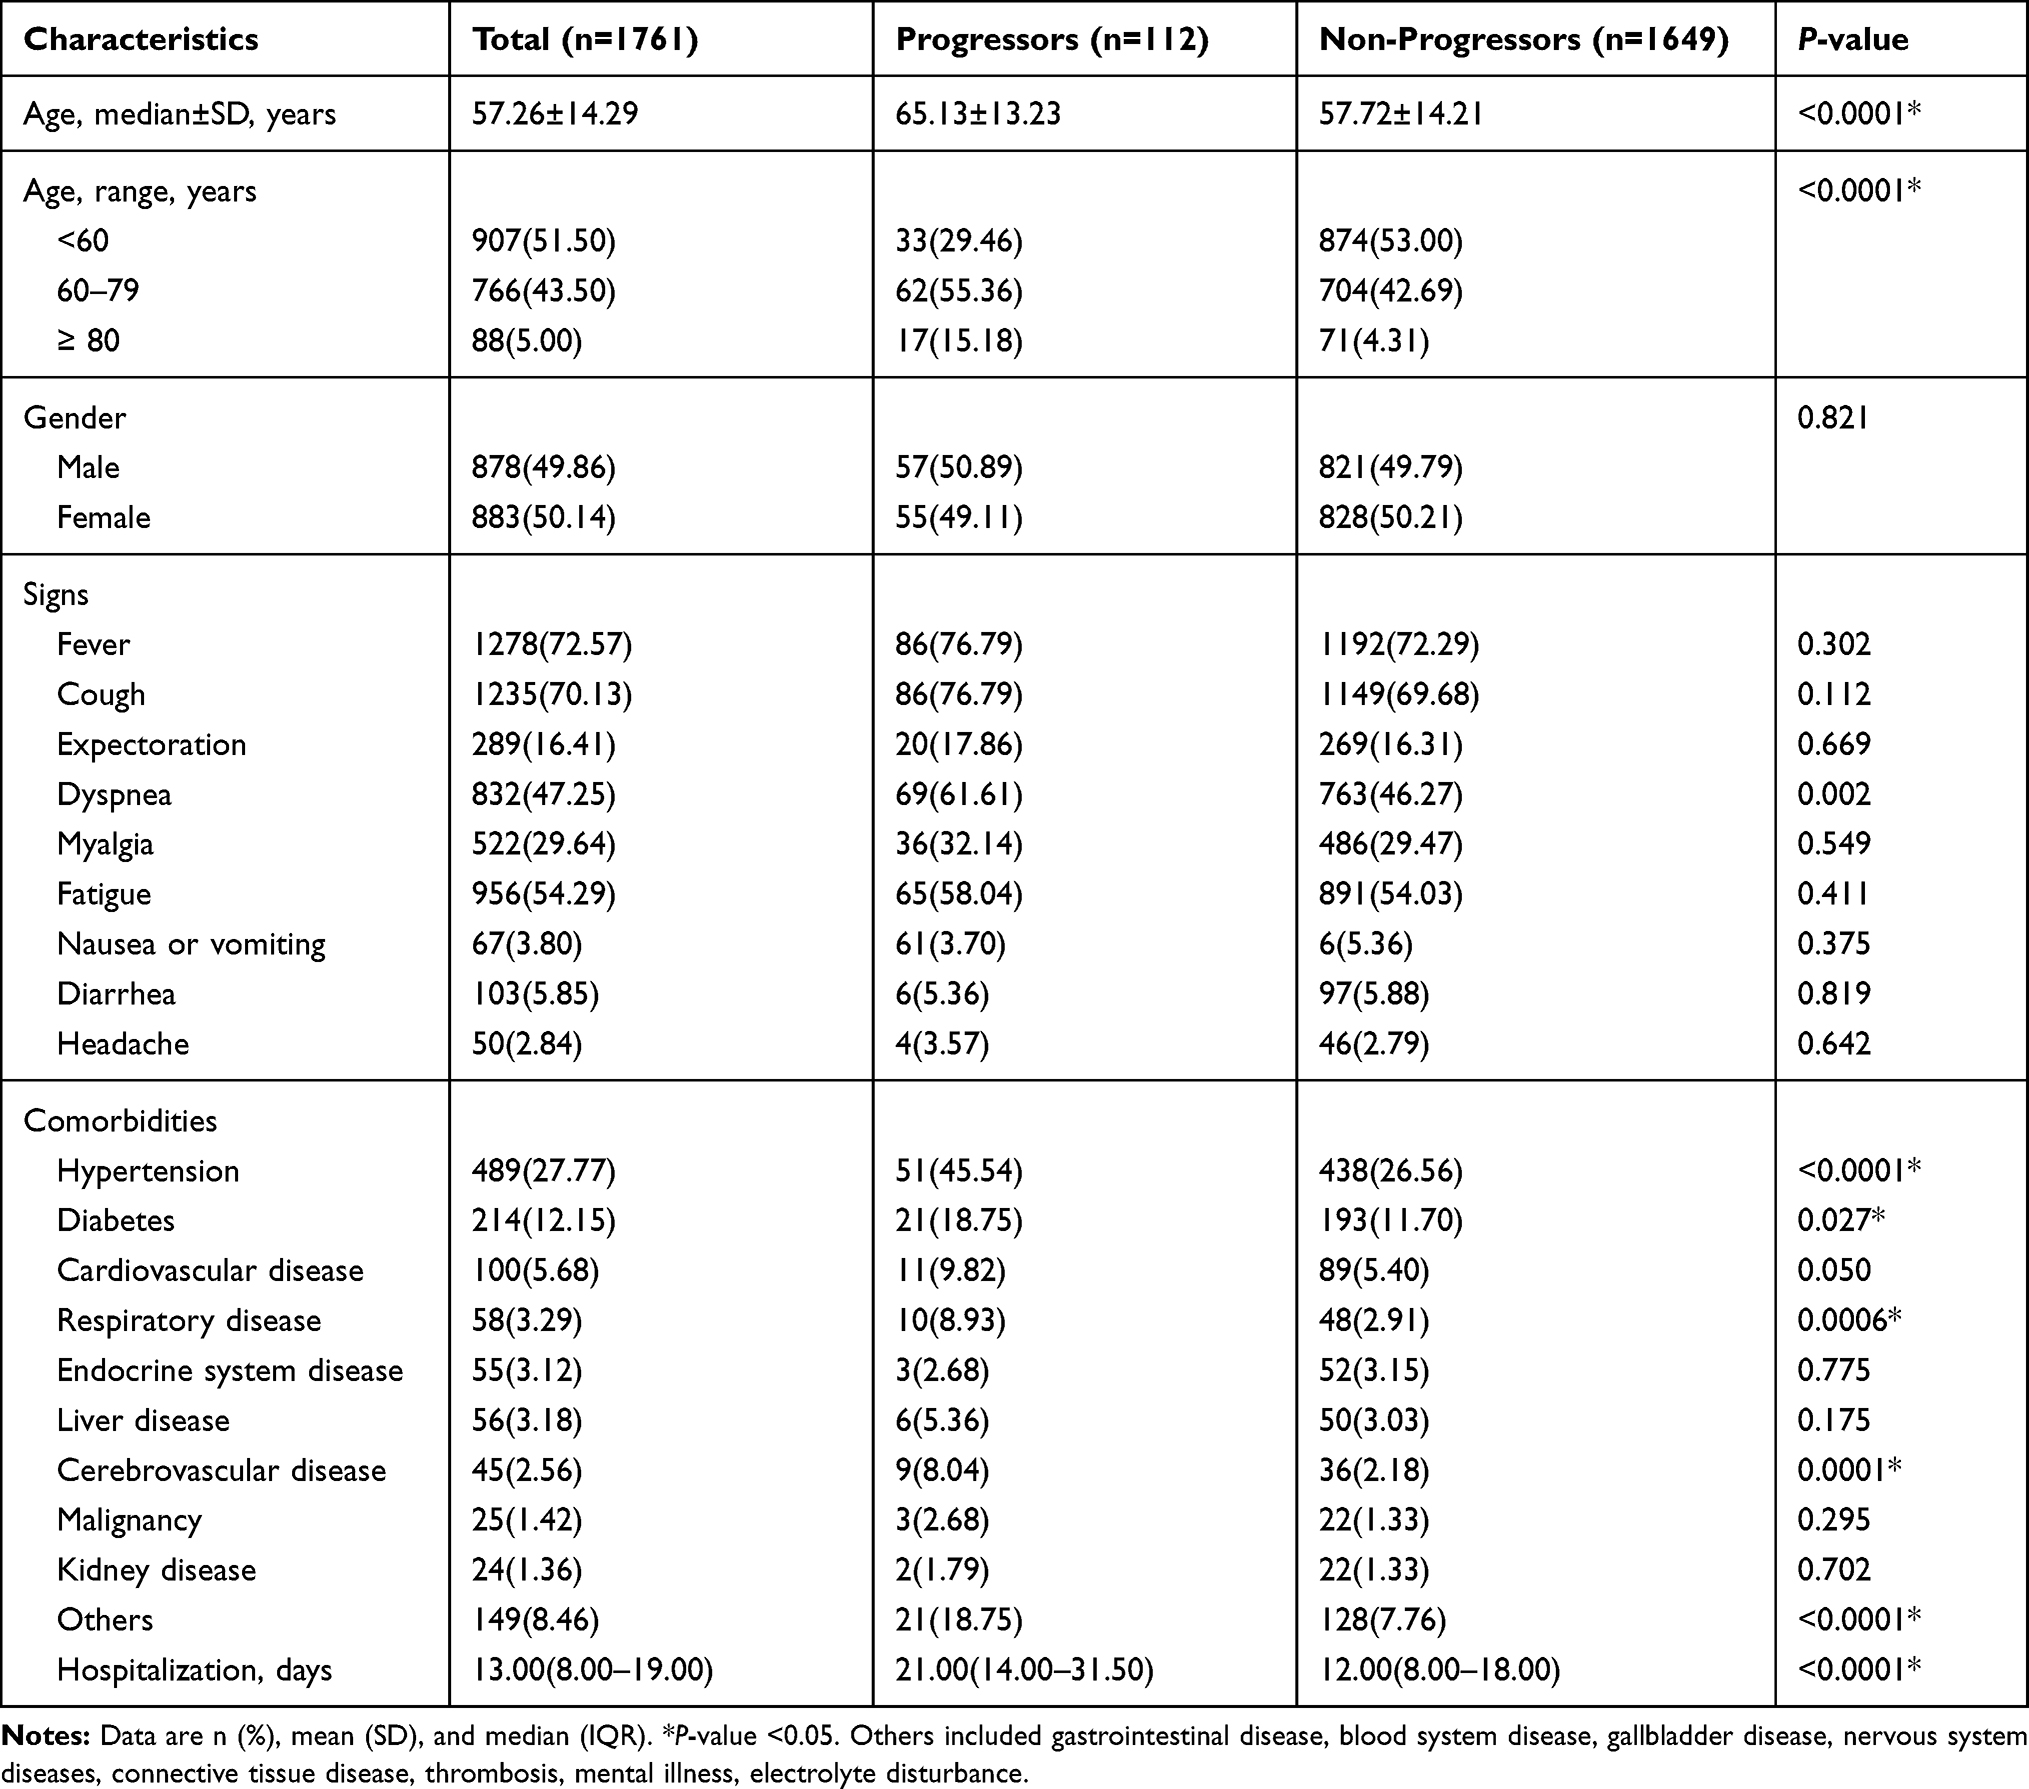 |
Table 1 Clinical Characteristics of Mild/Moderate COVID-19 Patients on Admission |
As illness condition continued to worsen, 672 (22.03%) S/C ill patients were incorporated, involving 56 patients who have died and 616 patients who survived. The median age was 64.50 years (SD 13.13), and 461 (68.60%) were older than 60 years, and those with older age were more likely to have had a death outcome (P<0.001). More than half of the infected patients were men (54.32%). Common symptoms include more common symptoms such as fever (77.83%), cough (73.69%), dyspnea (64.58%), and fatigue (59.38%) and less common symptoms such as myalgia (32.89%), expectoration (20.24%), headache (3.87%). At the same time, a proportion of patients presented with atypical symptoms, such as diarrhea (6.40%) and nausea or vomiting (4.32%). And the absence of dyspnea (P<0.001, 89.29% vs 62.34%), nausea or vomiting (P=0.014, 10.71% vs 3.73%), and headache (P=0.040, 8.93% vs 3.41%) were higher among patients who died in hospital compared with those survived. The median length of hospital stay was 15 days (IQR, 8–23). By comparing gender (P=0.118) and the length of hospital stay (P=0.498) in severely ill patients, there were no statistical difference between NS and S, as shown in Table 2.
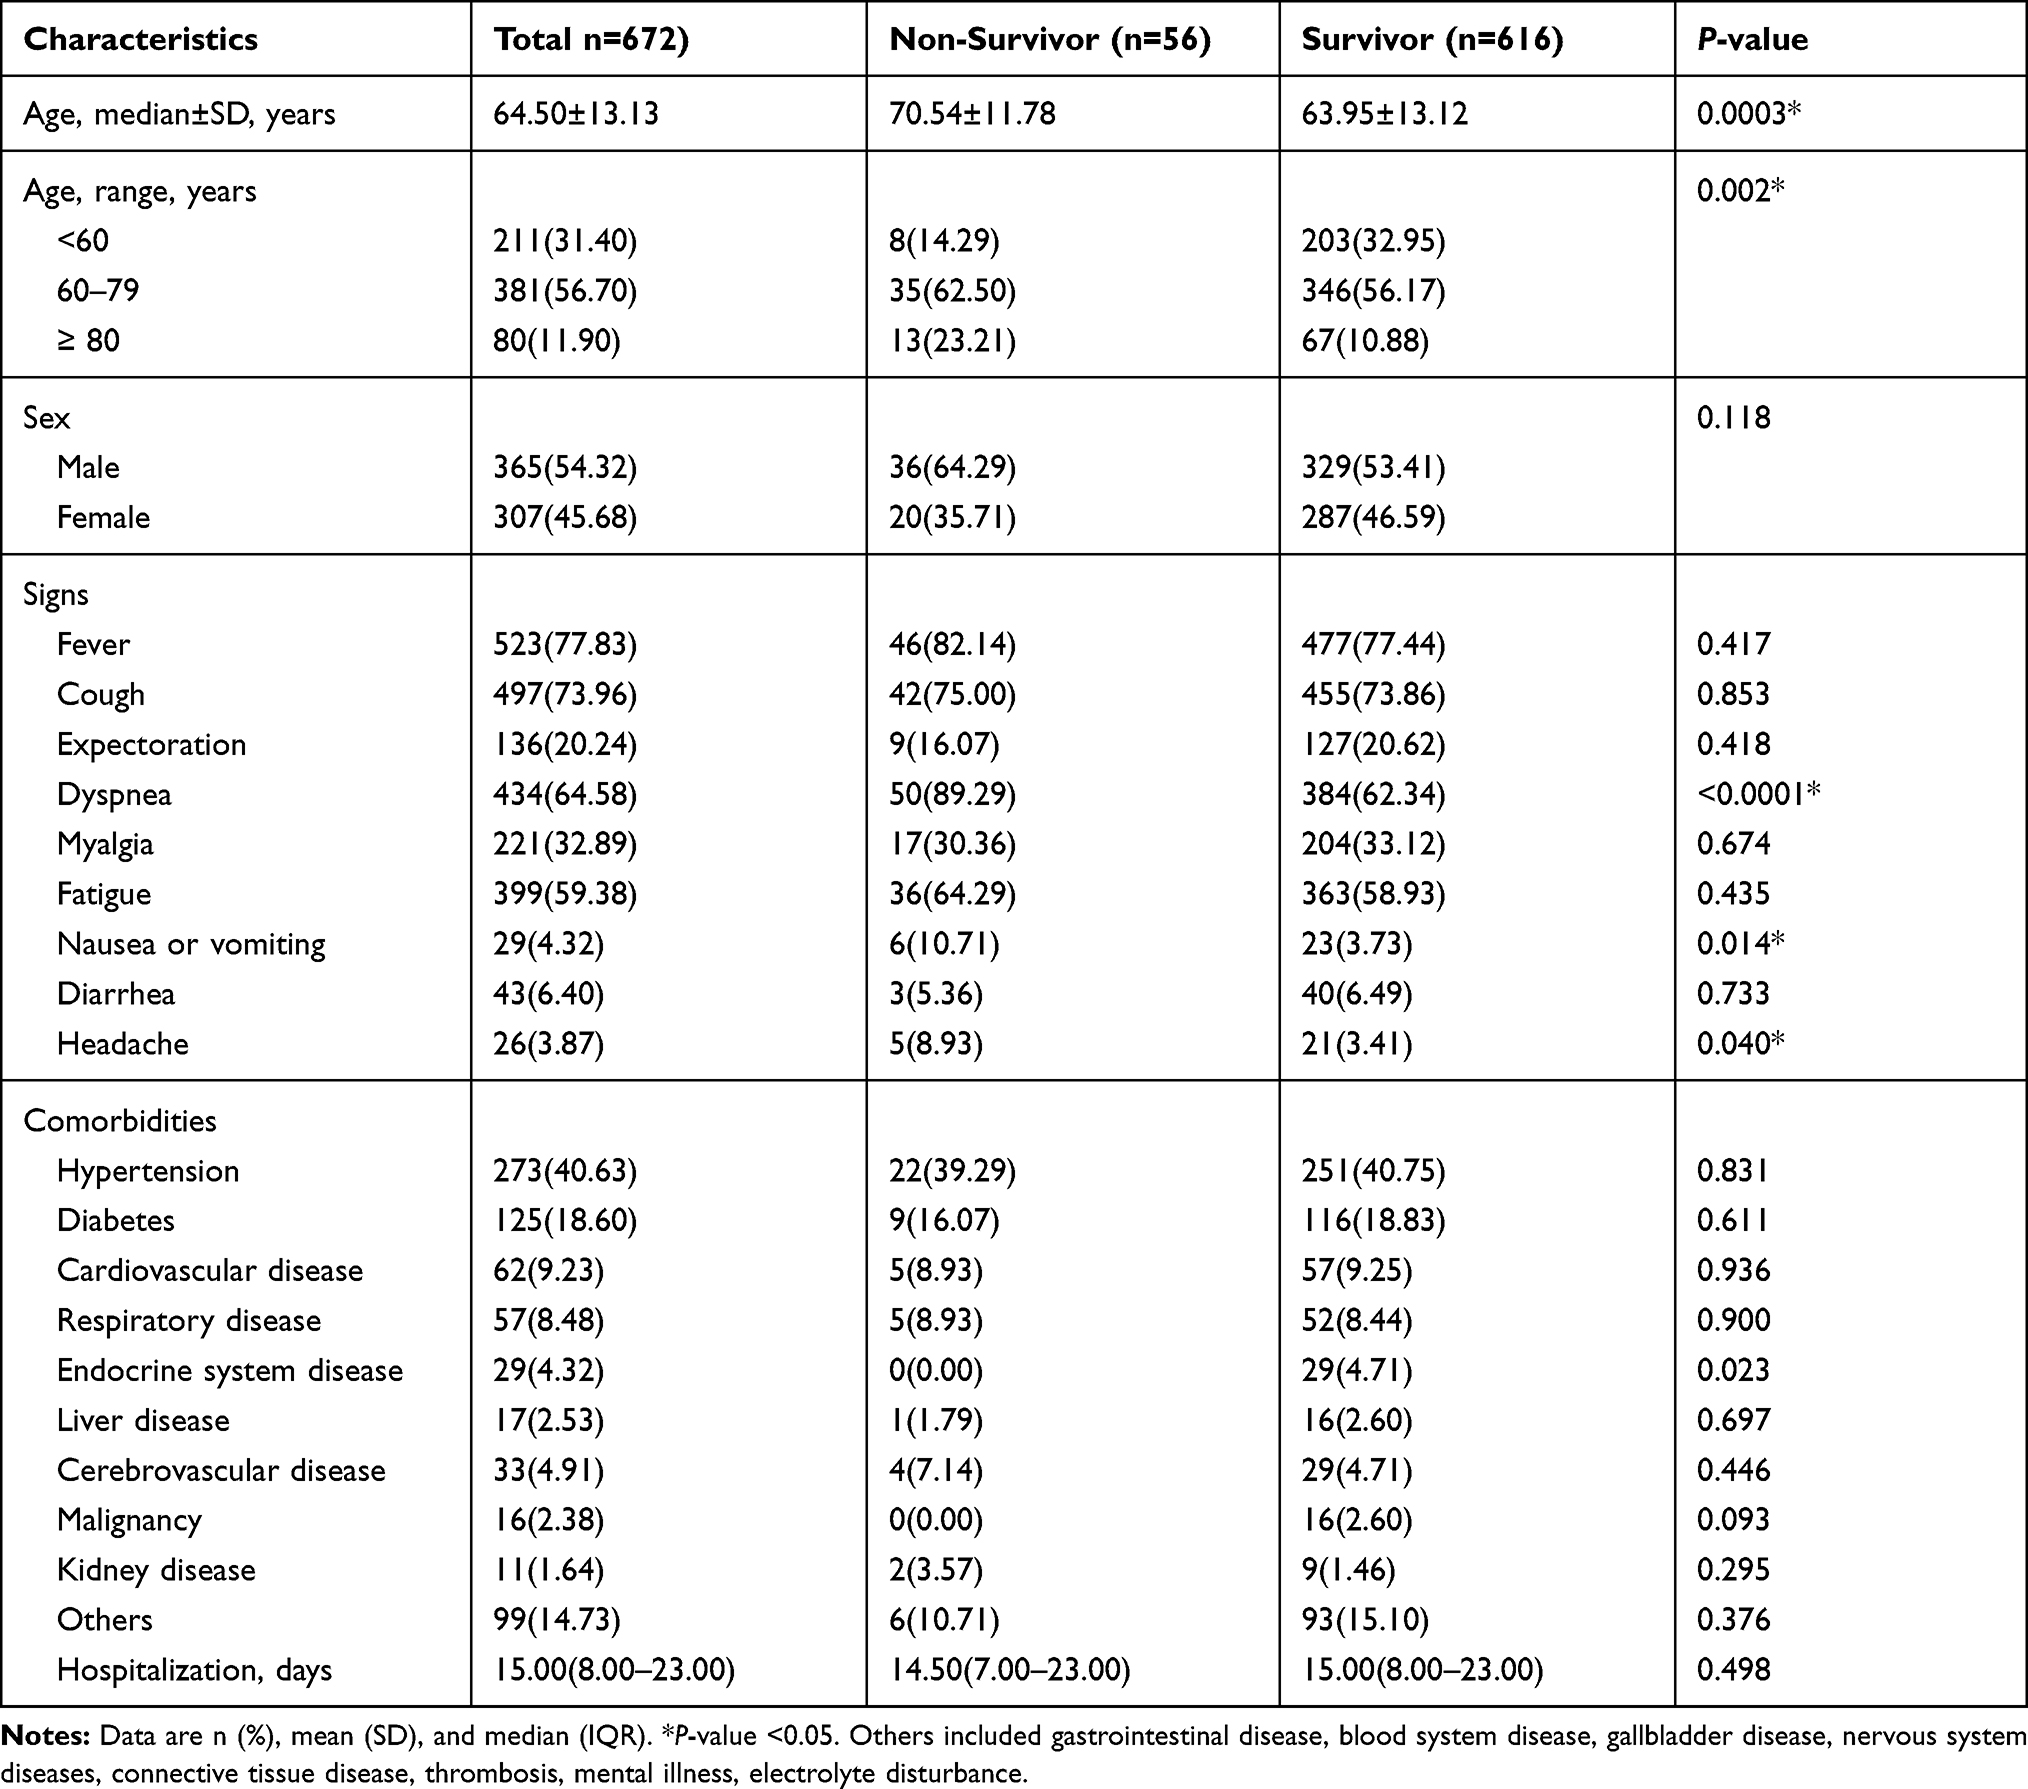 |
Table 2 Clinical Features of Severe/Critical COVID-19 Patients |
Laboratory Finding and CT Imaging in Different Clinical Stage of COVID-19
Laboratory finding and CT imaging on admission are listed in Table 3. In comparison with NP, P had higher leucocytes count ([6.83±2.61] vs [5.97±2.09], P<0.001), and higher neutrophils count ([5.02±2.45] vs [3.73±1.78], P<0.001), lower lymphocytes count ([1.20±0.71] vs [1.62±0.78], P<0.001), lower haemoglobin ([121.86±18.67] vs [125.29±16.76], P=0.038). Admission levels of TBIL ([11.86±6.12] vs [10.51±5.28], P=0.009), DBIL ([4.96±3.36] vs [3.72±2.79], P<0.001), BUN ([5.46±2.51] vs [4.62±4.31], P<0.001), CK-MB (9.20[7.45–11.75] vs 8.30[6.80–10.40], P=0.004), LDH (240.85[177.40–316.55] vs 170.30[148.40–199.50], P<0.001), D-dimer ([2.13±3.42] vs [0.65±1.39], P<0.001), fibrinogen ([3.39±0.90] vs [3.02±0.85], P<0.001), PT ([13.76±3.62] vs [12.93±1.44], P<0.001), and CRP (16.50[2.68–73.96] vs 1.70[0.67–5.30], P<0.001) were also significantly higher, whereas level of ALB ([34.08±4.70] vs [38.27±4.04], P<0.001) was significantly lower in the P than in the NP. At hospital admission, lower platelets count (platelets count <125×109/L, 10.71% vs 4.55, P=0.004), higher CK level (CK ≥200 IU/L, 8.74% vs 1.82, P<0.001), as well as higher APTT level (APTT ≥37 s, 4.46% vs 1.46%, P=0.042) were more common in progressive patients than in NP. Compared with NP, patients who progressed to severe COVID-19 were also likely to have bigger total lesion volume (721.75 [226.55–1090.60] vs 145.80[23.10–404.90], P<0.001) and total lesion volume ratio (22.35[7.10–38.65] vs 3.70[0.60–11.20], P<0.001) at presentation. The ALT and creatinine levels were not statistically different between the two groups (P>0.05).
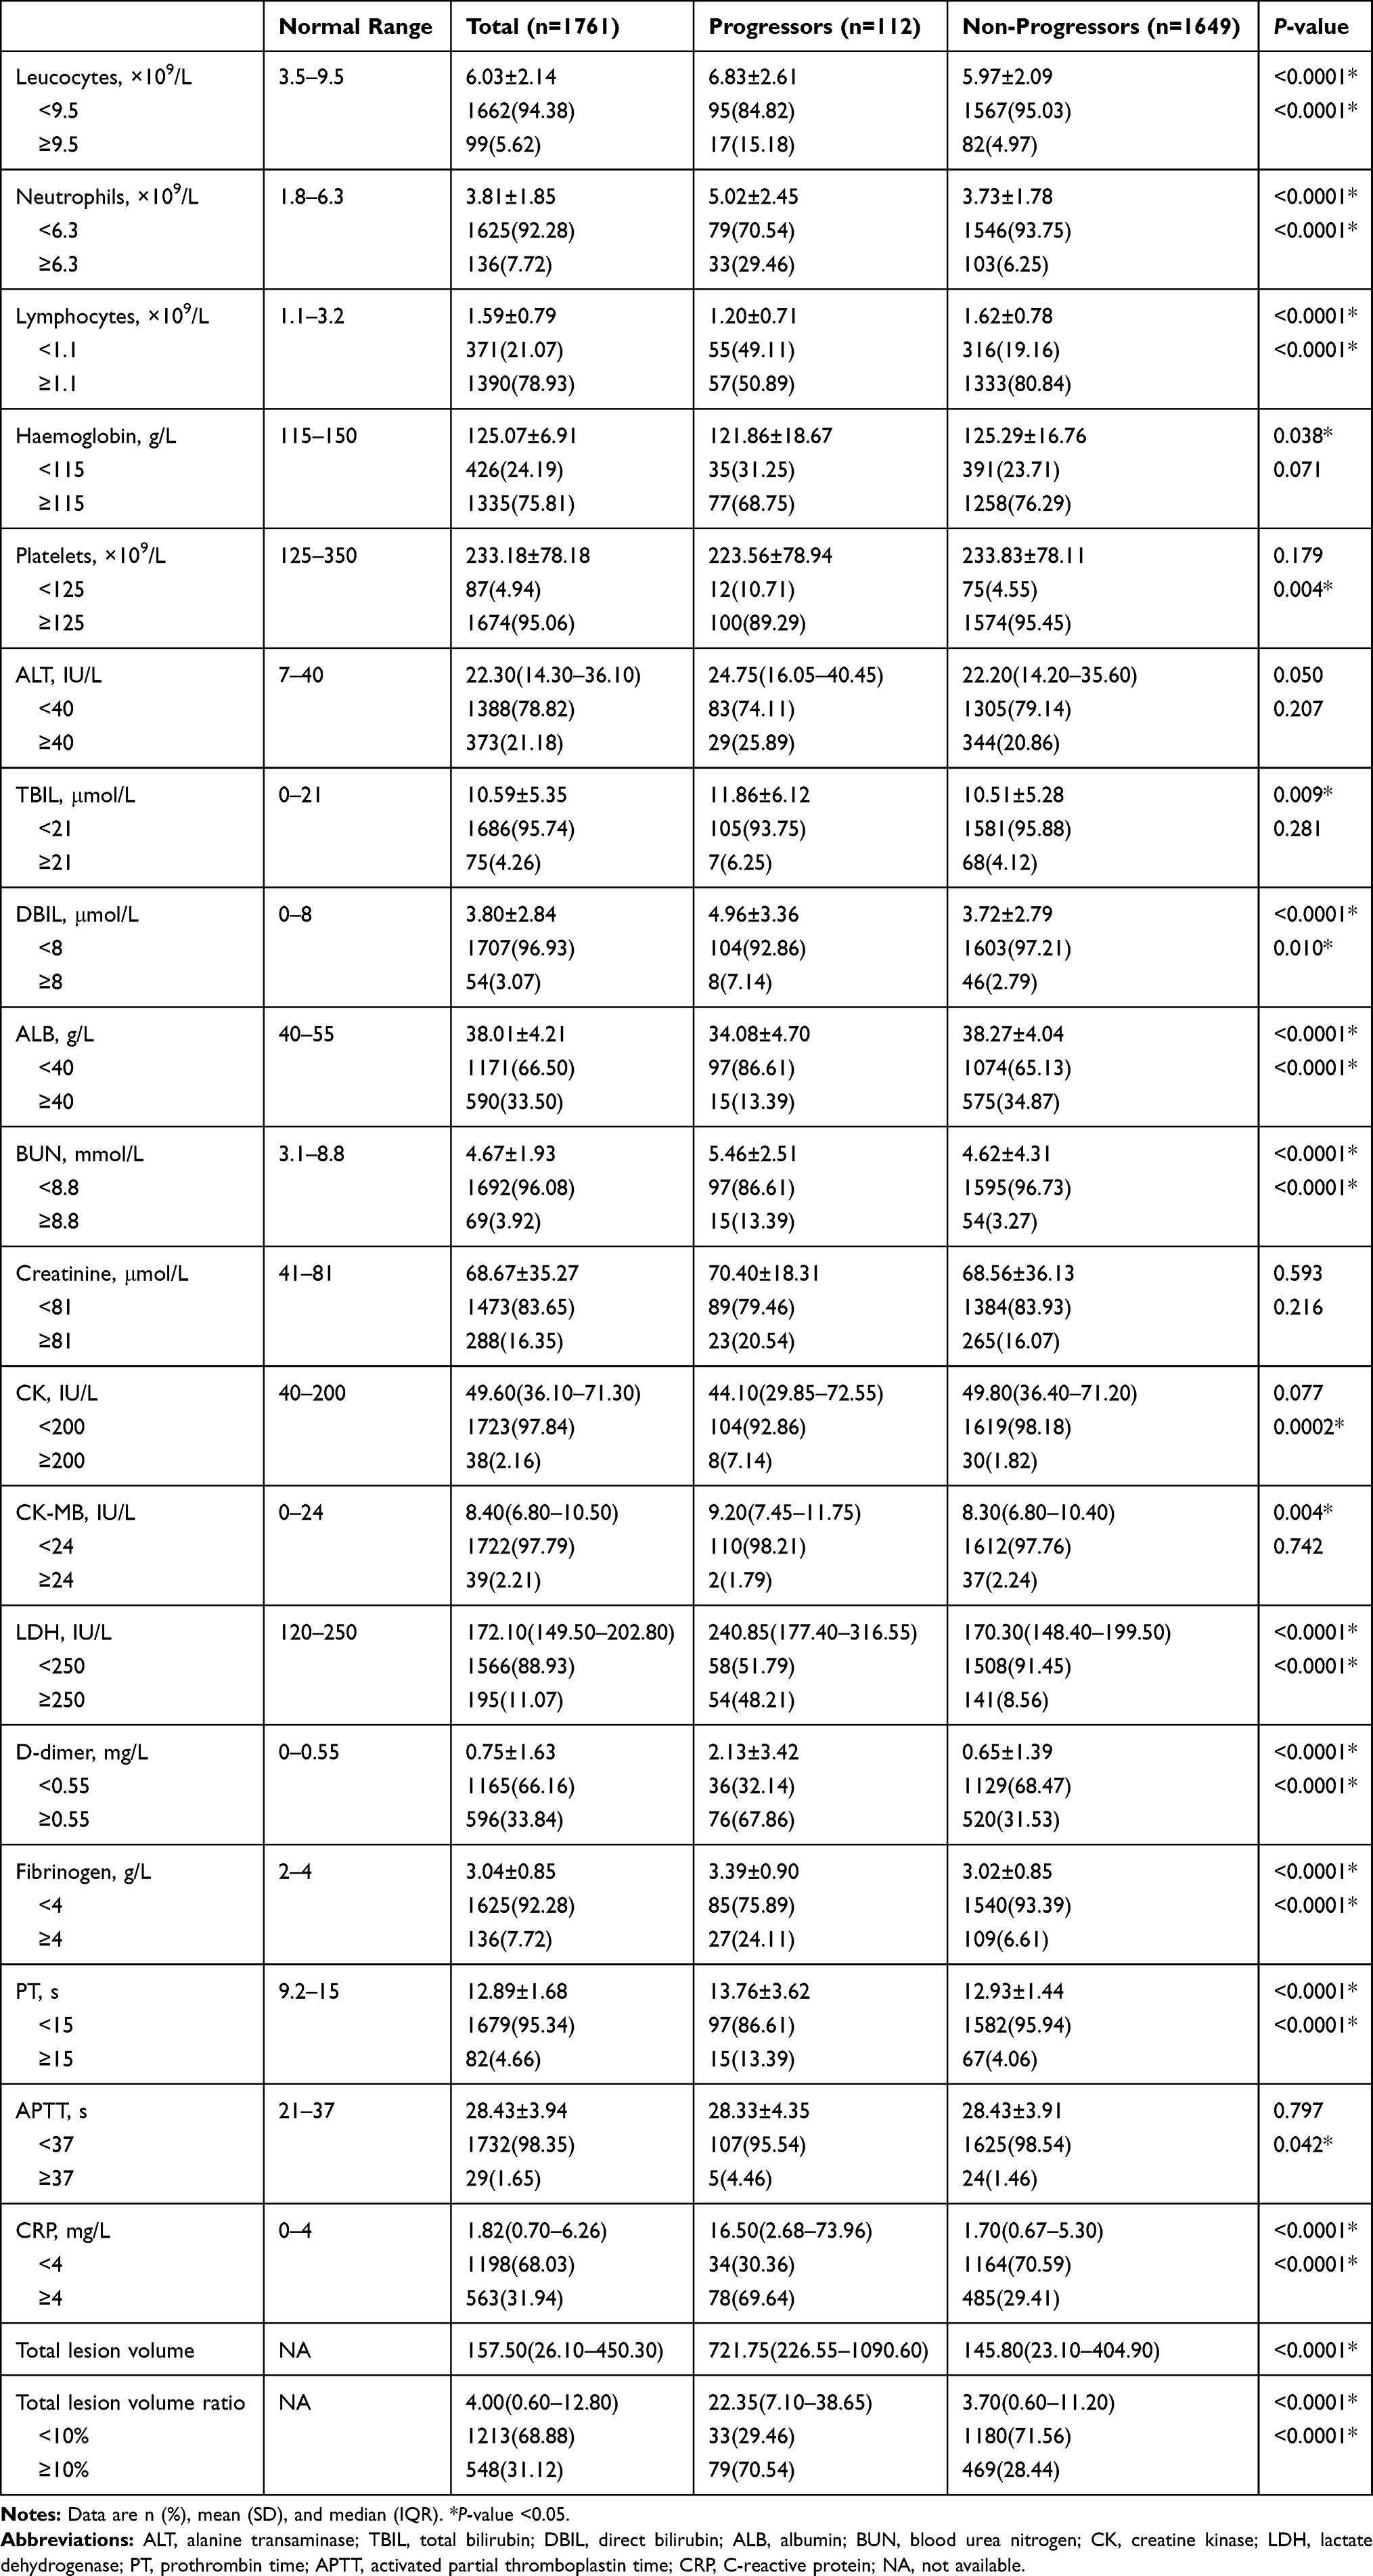 |
Table 3 Laboratory Finding and CT Imaging of Mild/Moderate COVID-19 Patients on Admission |
There were numerous differences in laboratory findings between NS and S, including increased leucocyte ([10.79±8.19] vs [6.59±2.58], P<0.001) and neutrophil ([9.54±7.97] vs [4.58±2.48], P<0.001) counts, reduced lymphocytes ([0.74±0.46] vs [1.27±0.68], P<0.001), platelets ([165.88±114.93] vs [225.75±80.62],P<0.001) and ALB (30.67±4.87 vs 35.81±4.65, P<0.001), as well as higher levels of TBIL (12.60[9.90–19.90] vs 9.80[7.40–12.80], P<0.001), DBIL (6.80[4.50–10.70] vs 3.60[2.60–5.00], P<0.001), BUN ([9.53±5.20] vs [5.33±3.03], P<0.001), creatinine (76.40[60.65–102.40] vs 64.40[54.30–76.55], P<0.001), CK (78.95 (34.20–174.65) vs 44.90[30.05–66.35], P<0.001), CK-MB (16.50[11.00–23.95] vs 9.05[7.15–12.00], P<0.001), LDH (441.60[342.80–600.30] vs 199.65[165.95–258.25], P<0.001), D-dimer ([5.65±5.63] vs [1.58±2.94], P<0.001), PT ([16.02±3.55] vs [13.38±4.00], P<0.001), APTT ([35.54±24.48] vs [28.35±5.62], P<0.001), CRP (85.69[33.00–148.74] vs 4.28[1.38–21.49], P<0.001). The levels of haemoglobin (P=0.267, [116.96±21.70] vs [119.93±18.91]), ALT (P=0.354, 25.95[15.75–48.45] vs 21.90[14.95–3.50]), and fibrinogen (P=0.097, [3.04±1.31] vs [3.22±0.71]) did not differ between patients who died and patients who survived, as shown in Table 4.
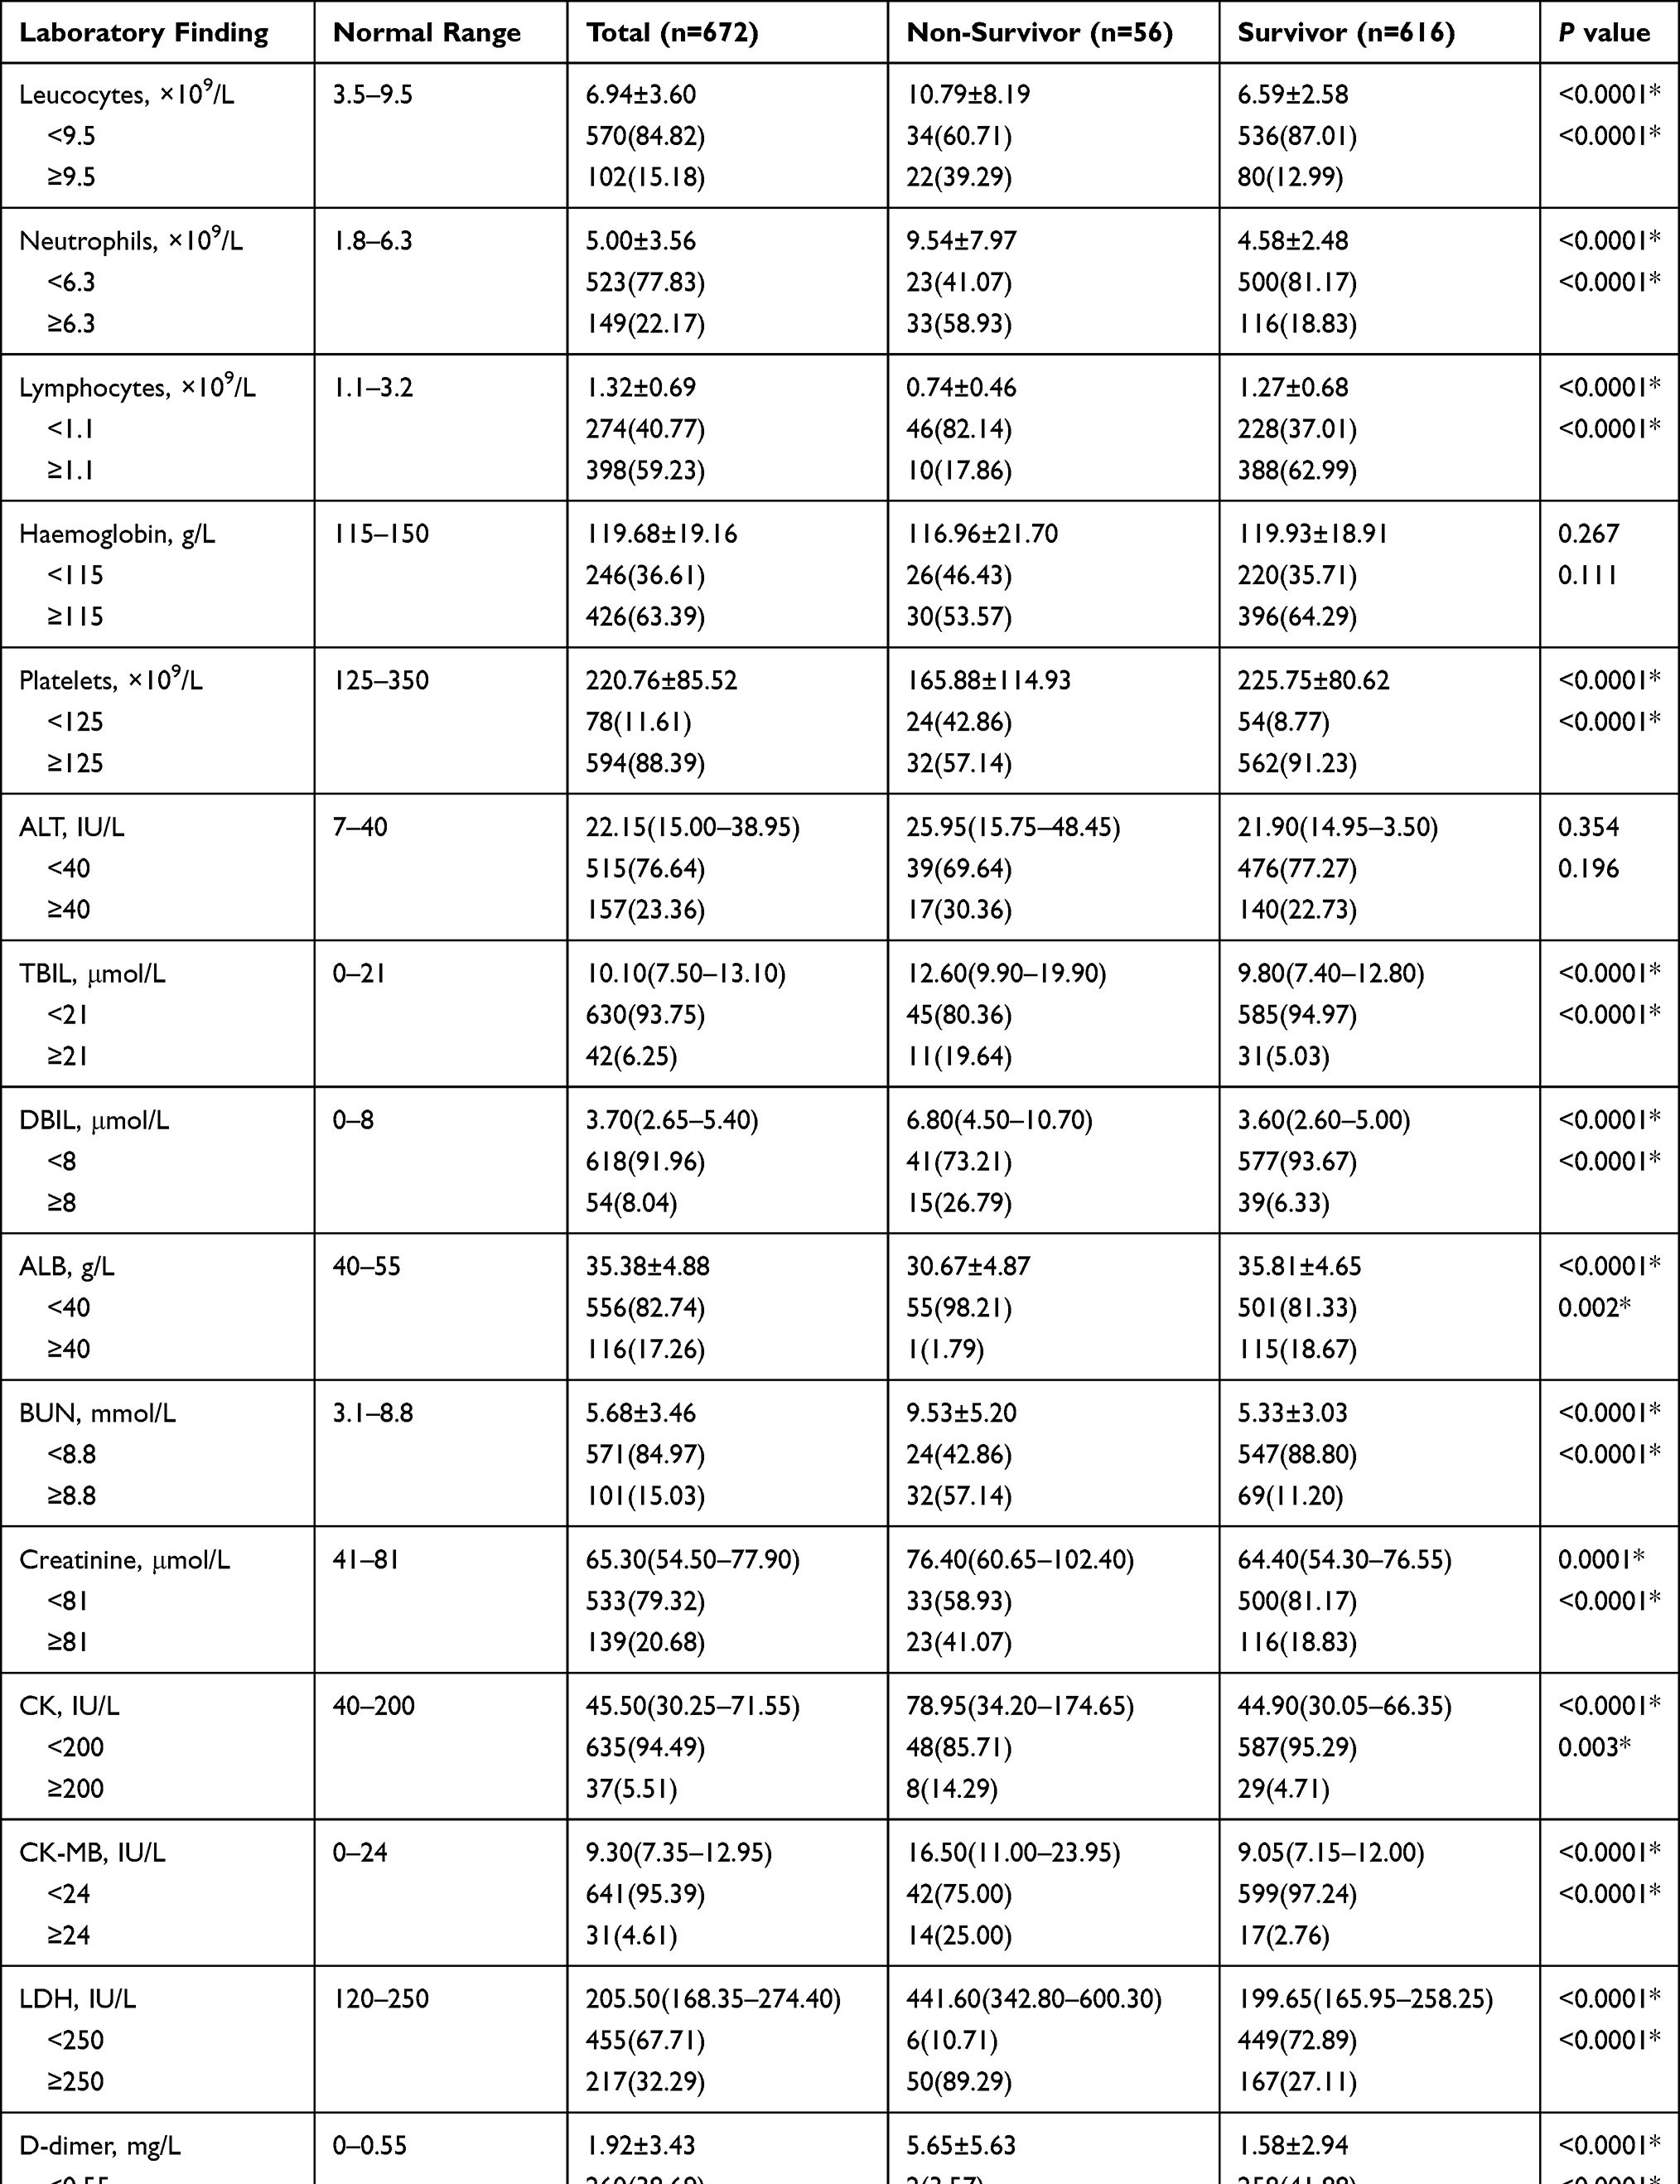 |
Table 4 Laboratory Finding of Severe/Critical COVID-19 Patients |
Predictive Factors for Distinguishing Patients with COVID-19 in Dynamic Development
On the Cox univariate analysis, the risk factors associated with progression into severe severity in moderate COVID-19 were older age, comorbidities including hypertension, diabetes, cardiovascular disease, respiratory disease, and cerebrovascular disease, increased leucocytes count and neutrophils count, lymphopenia, thrombocytopenia, decreased level of ALB, elevated levels of DBIL, BUN, CK, LDH, D-dimer, fibrinogen, PT, APTT, and CRP, as well as total lesion volume ratio ≥10%. Thereafter, a Cox multivariable model, risk of the disease deterioration of COVID-19 from non-severe to severe or critical condition was independently associated with neutrophils (HR=1.958, 95% CI=1.253–3.059, P=0.003), lymphocytes (HR=1.549, 95% CI=1.018–2.355, P=0.041), CK (HR=2.203, 95% CI=1.048–4.632, P=0.037), LDH (HR=3.309, 95% CI=2.083–5.256, P<0.001), CRP (HR=2.575, 95% CI=1.638–4.049, P<0.001), total lesion volume ratio ≥10% (HR=2.286, 95% CI=1.451–3.601, P<0.001), as shown in Table 5.
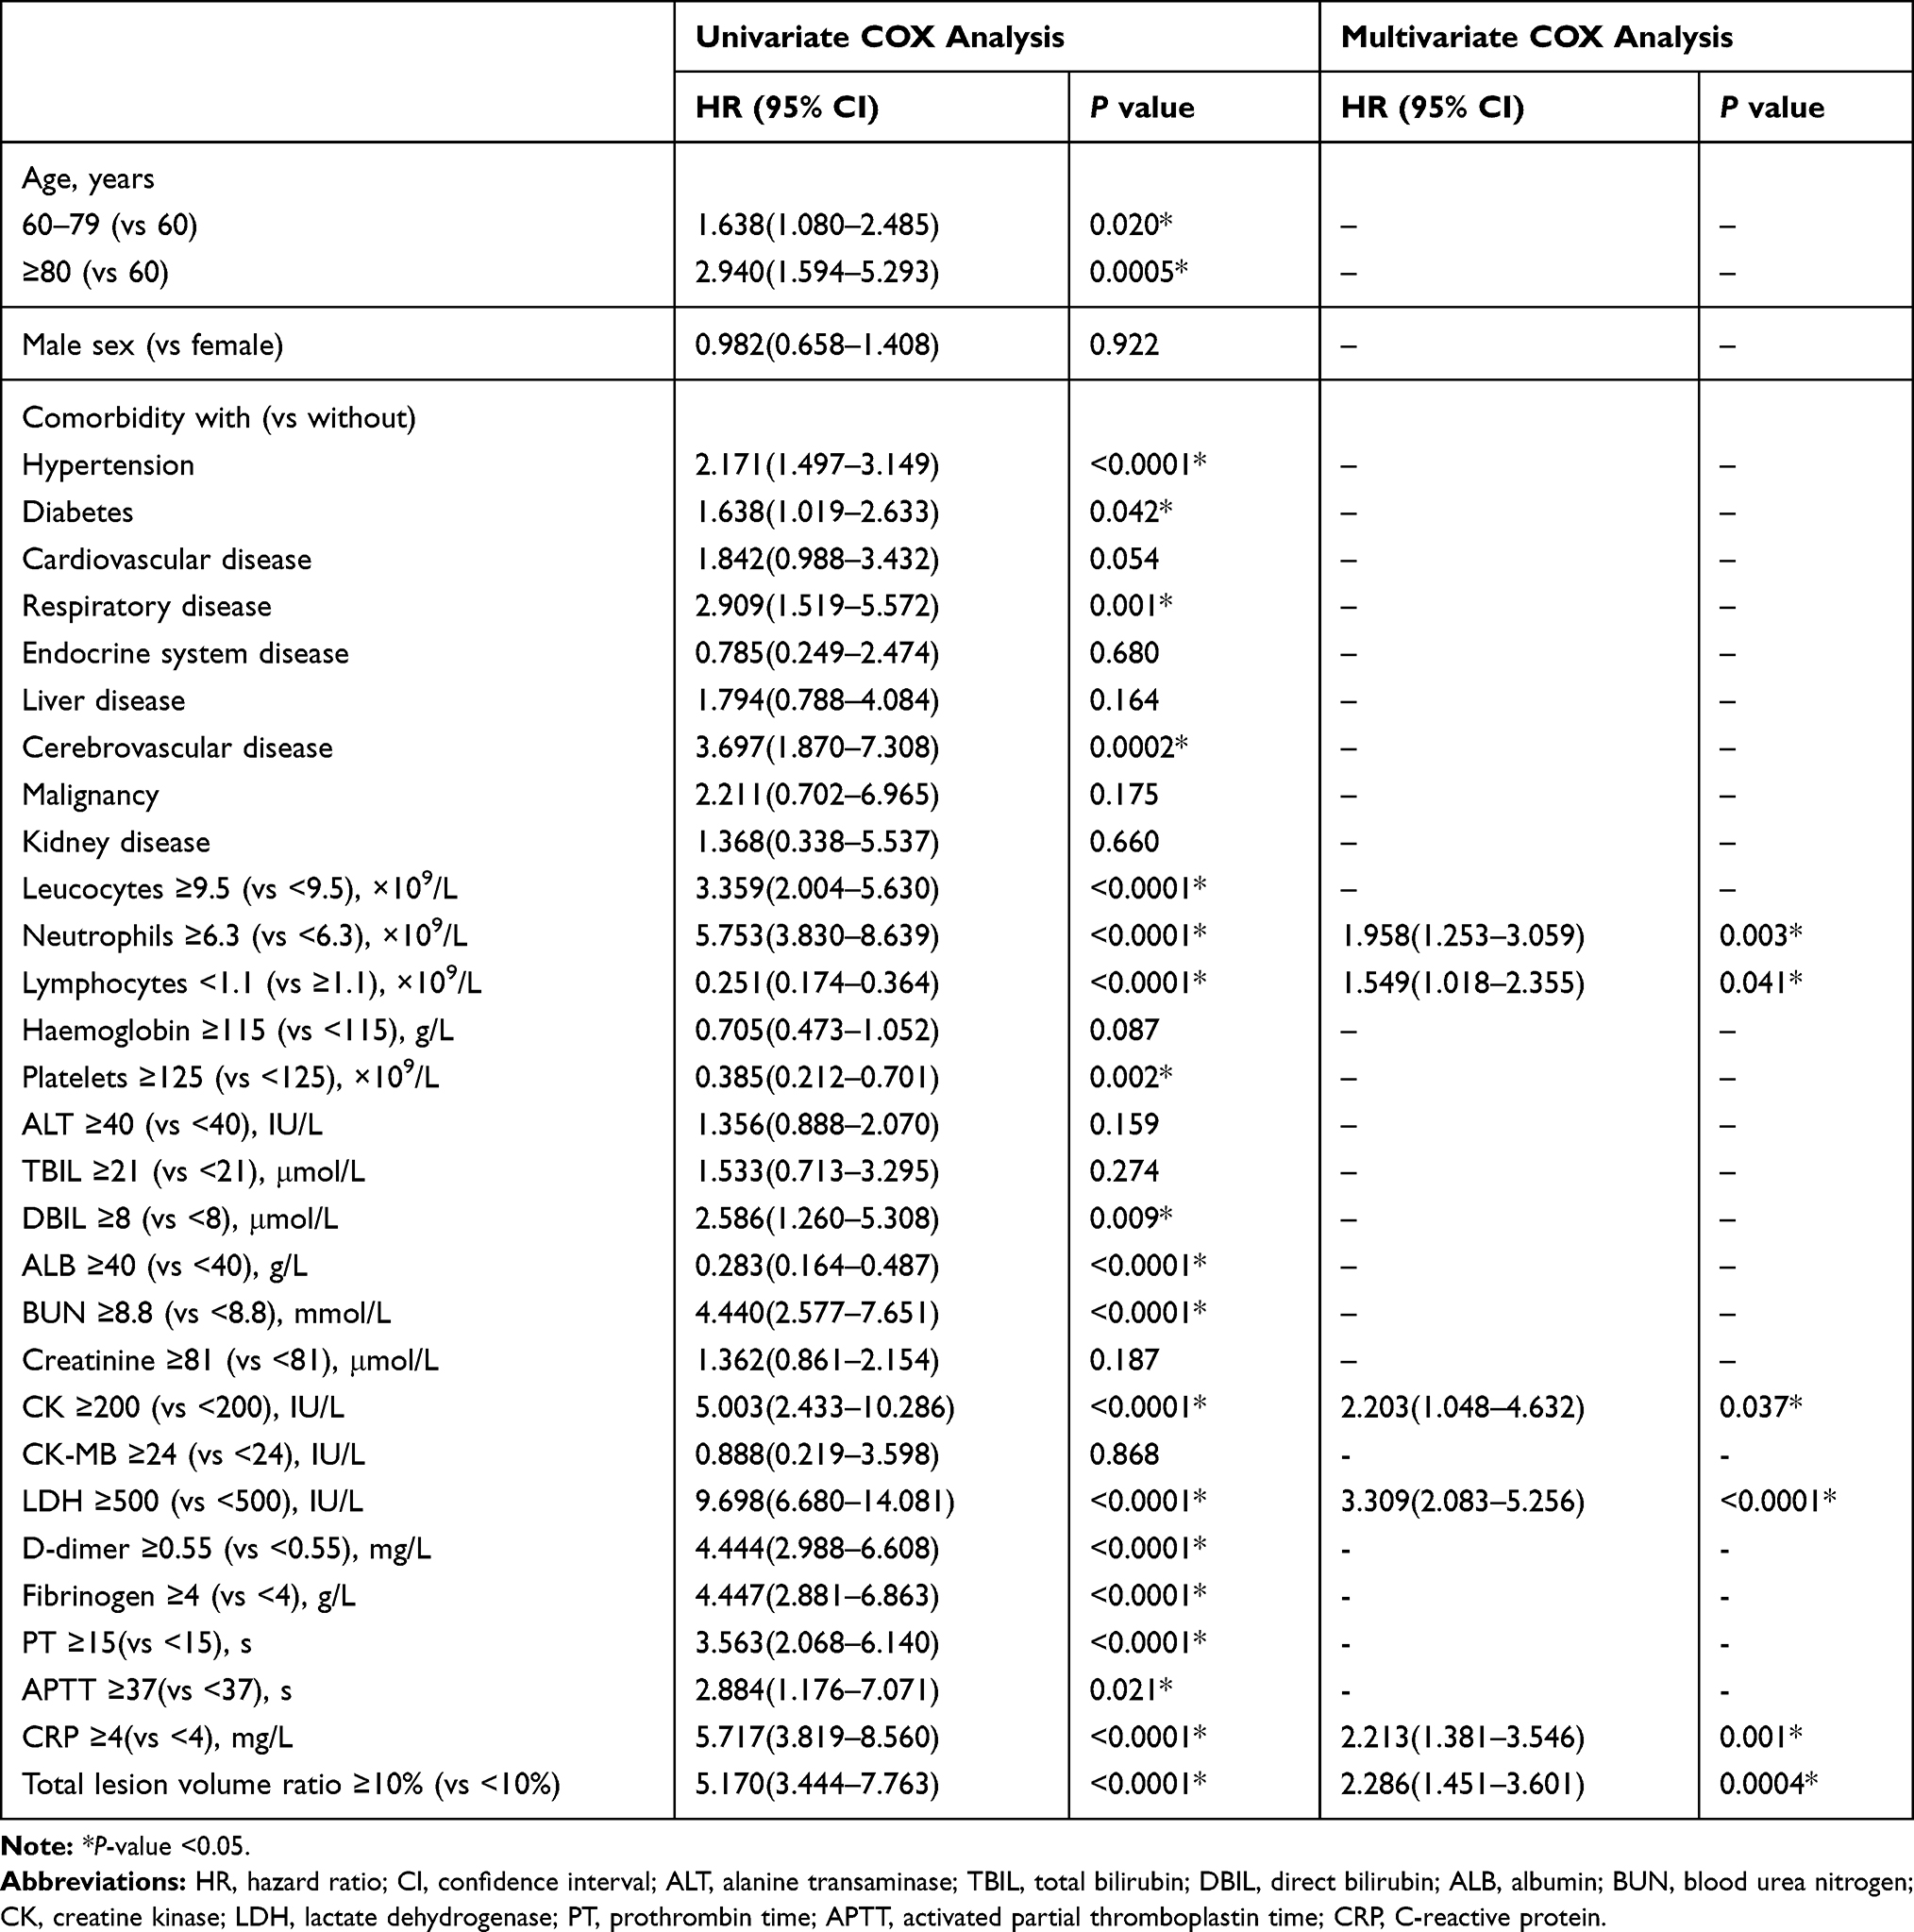 |
Table 5 Univariate and Multivariate COX Analysis of Progression of Mild/Moderate COVID-19 |
As with mortality, the Cox univariate analysis identified 17 significant risk factors for S/C group, as follows: older age and more significant laboratory abnormalities including raised leucocyte and neutrophil counts, lymphopenia, thrombocytopenia, reduced ALB level, elevated TBIL, DBIL, BUN, creatinine, CK, CK-MB, LDH, D-dimer, PT, APTT, and CRP levels. The multivariate Cox regression analysis eventually suggested that lymphocytes <1.1×10⁹/L (HR:2.060, 95% CI:1.000–4.242, P=0.050), BUN ≥8.8 mmol/L (HR:2.715, 95% CI:1.539–4.790, P<0.001), CK-MB ≥24 IU/L (HR:3.412, 95% CI:1.760–6.616, P<0.001), LDH ≥250 IU/L (HR:5.578, 95% CI:2.317–13.427, P<0.001), PT ≥15 s(HR:3.619, 95% CI:2.102–6.231, P<0.001) were markedly independent risk factors for predicting disease deterioration of COVID-19 from S/C to death, as shown in Table 6.
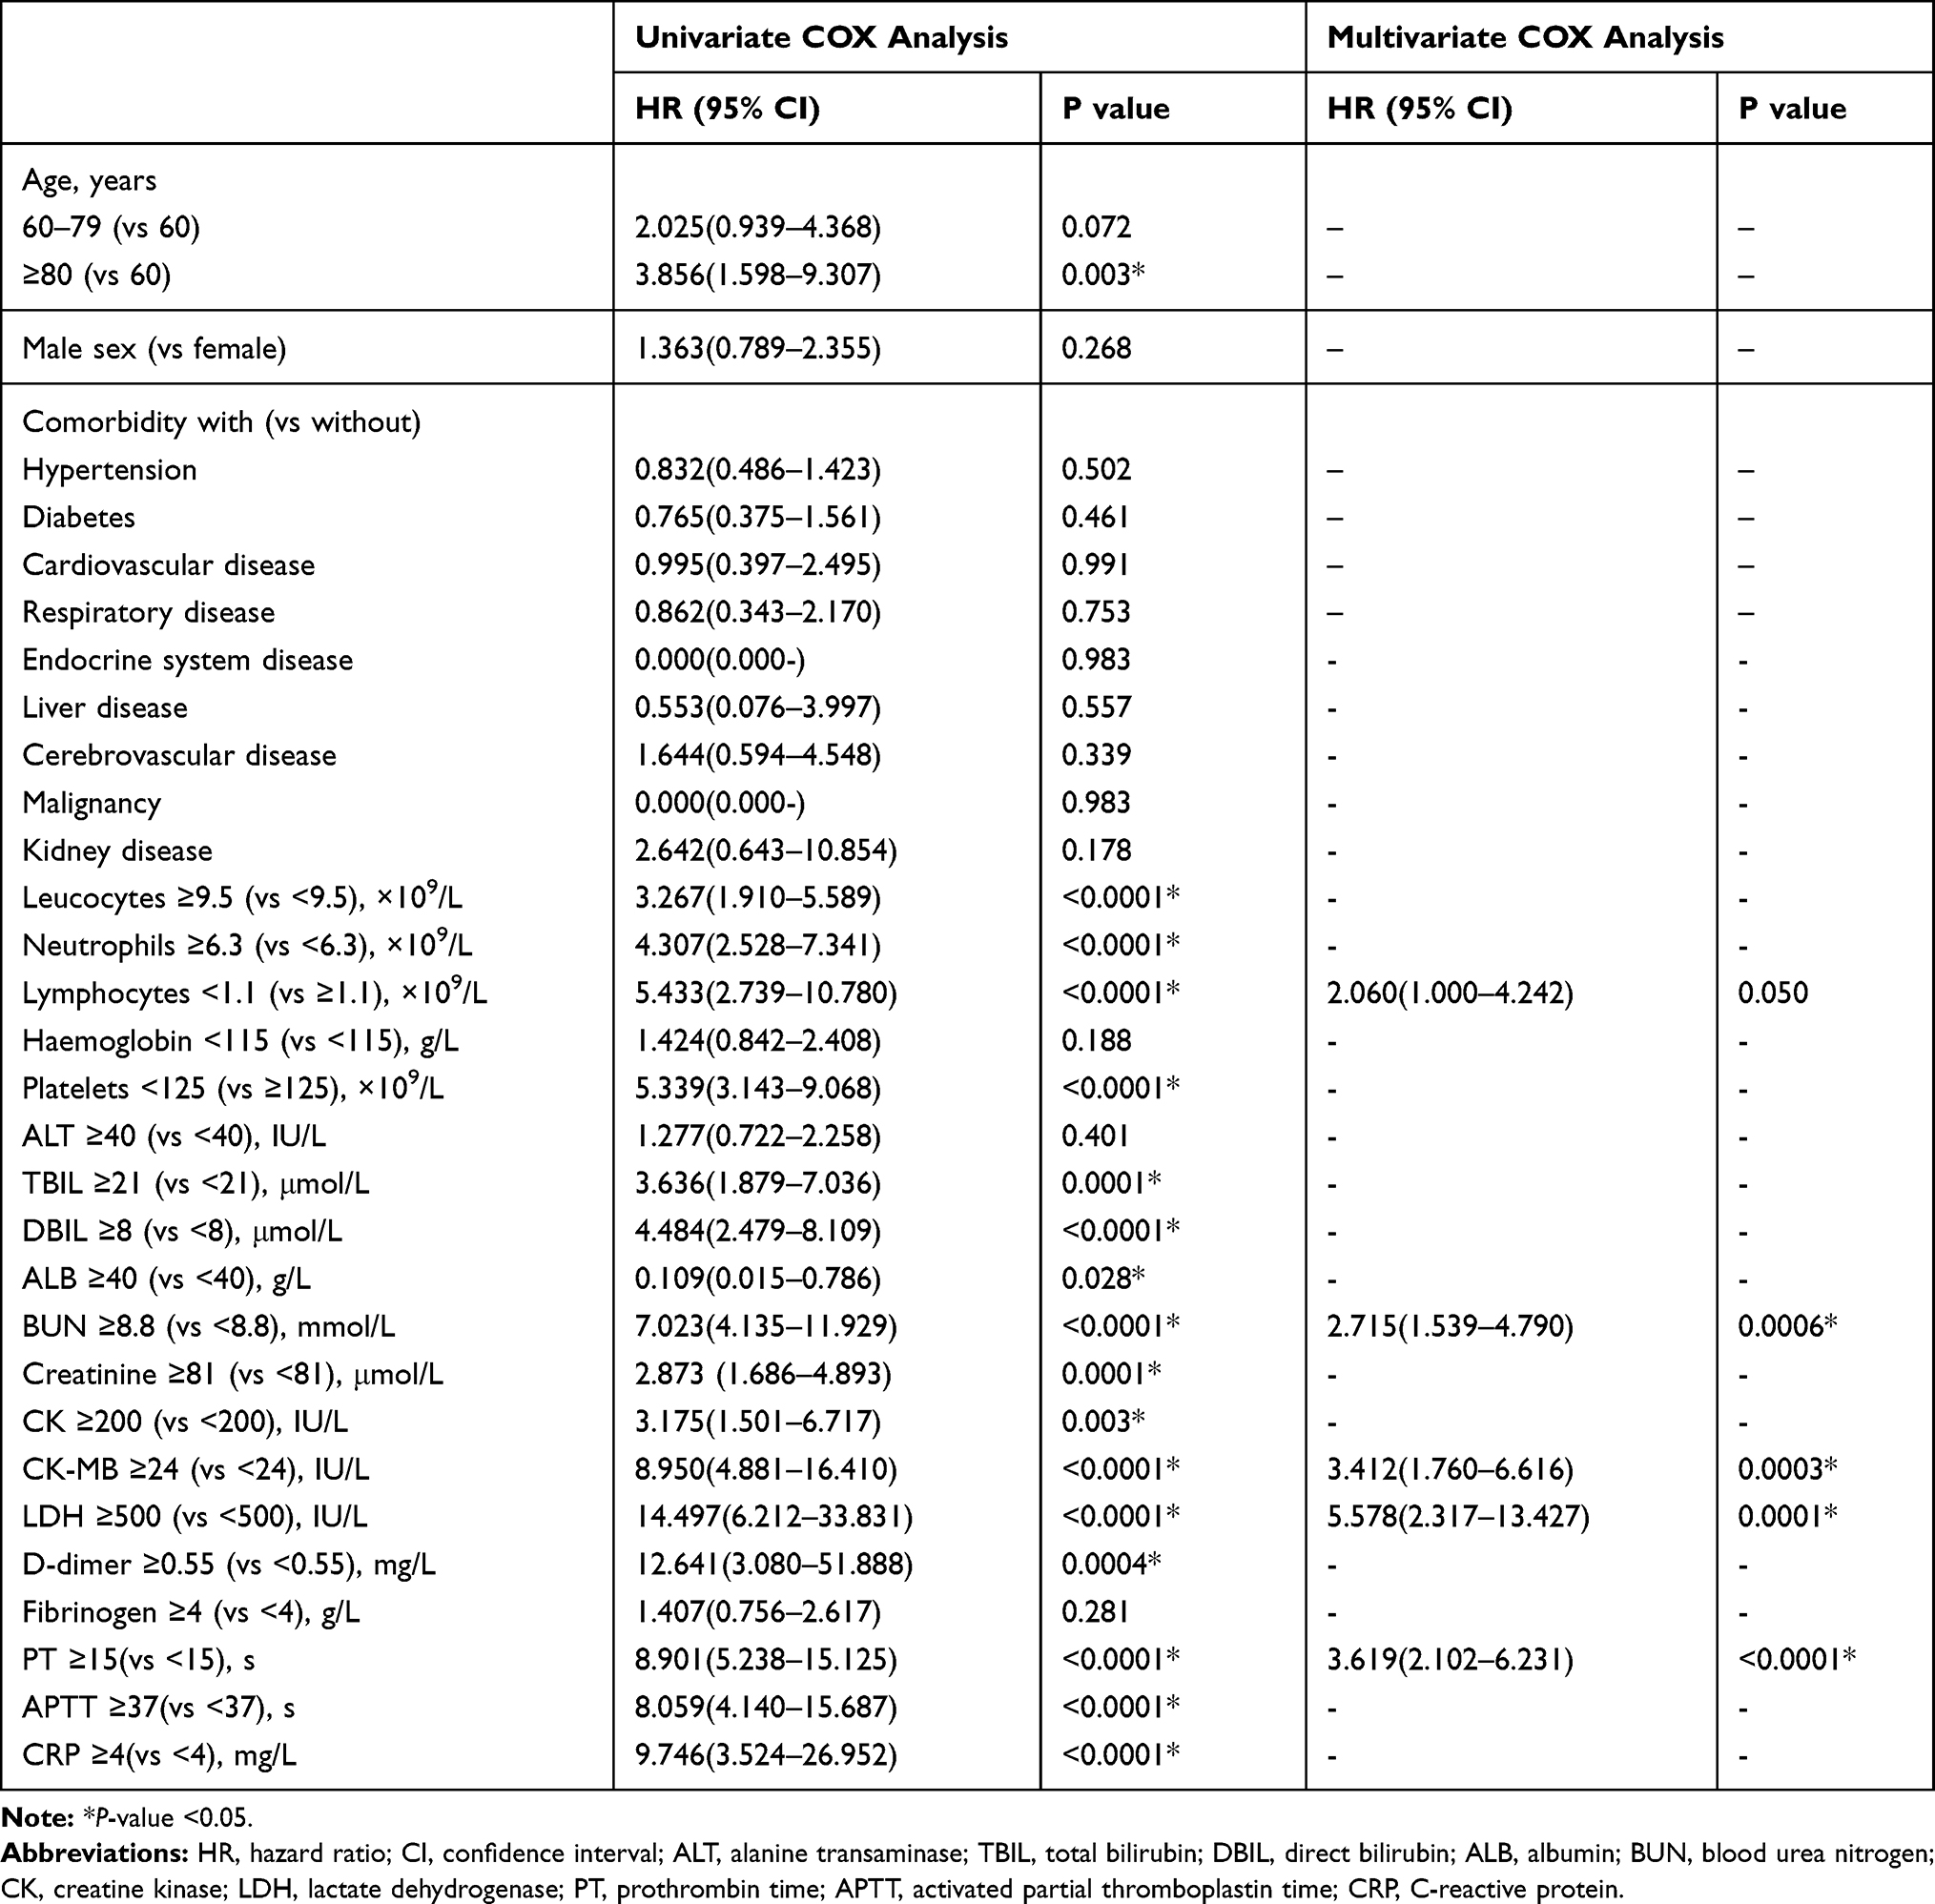 |
Table 6 Univariate and Multivariate COX Analysis of Survival of Severe/Critical COVID-19 |
Nomogram Establishment and Risk Stratification of COVID-19
The nomogram was developed based on the integration of neutrophils, lymphocytes, CK, LDH, CRP, and total lesion volume ratio ≥10% count for 20-day progression, 40-day progression, 60-day progression, and 80-day progression to predict the possibility of deterioration into S/C for each non-severe COVID-19 (Figure 2). We used Kaplan–Meier analysis to stratify patients according to risk, and the initial time is calculated from the onset of symptom (Figure 3). All patients were divided into two strata according to the cutoff value of neutrophils count (low risk: <6.3, high risk: ≥6.3), lymphocytes count (low risk: ≥1.1, high risk: <1.1), CK level (low risk: <200, high risk: ≥200), LDH level (low risk: <250, high risk: ≥250), CRP level (low risk: <4, high risk: ≥4), and total lesion volume ratio (low risk: <10%, high risk: ≥10%). High risk of neutrophils count (P<0.001), lymphocytes count (P<0.001), CK (P<0.001), LDH (P<0.001), CRP (P<0.001) level, and total lesion volume ratio (P<0.001) were associated with the incidence of S/C COVID-19. A risk score system was constructed using six statistically significant clinical variables to predict progression. Figure 4 shows progression rate increased with increasing risk scores.
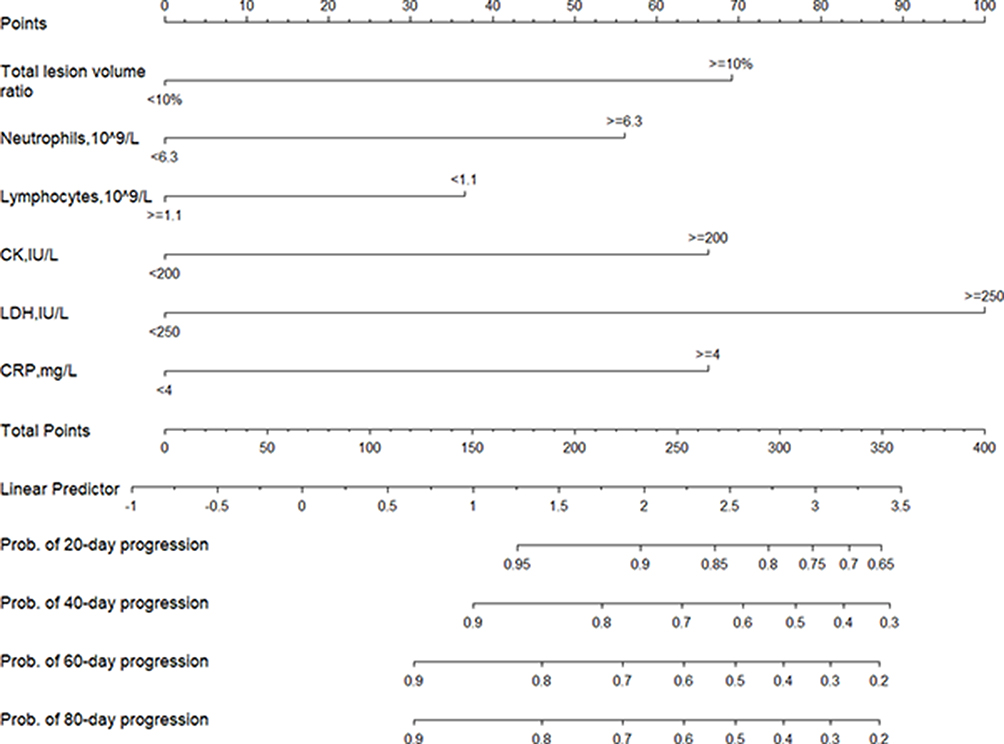 |
Figure 2 Nomogram predicting 20-day, 40-day, 60-day, and 80-day progression probability of patients with non-severe COVID-19. |
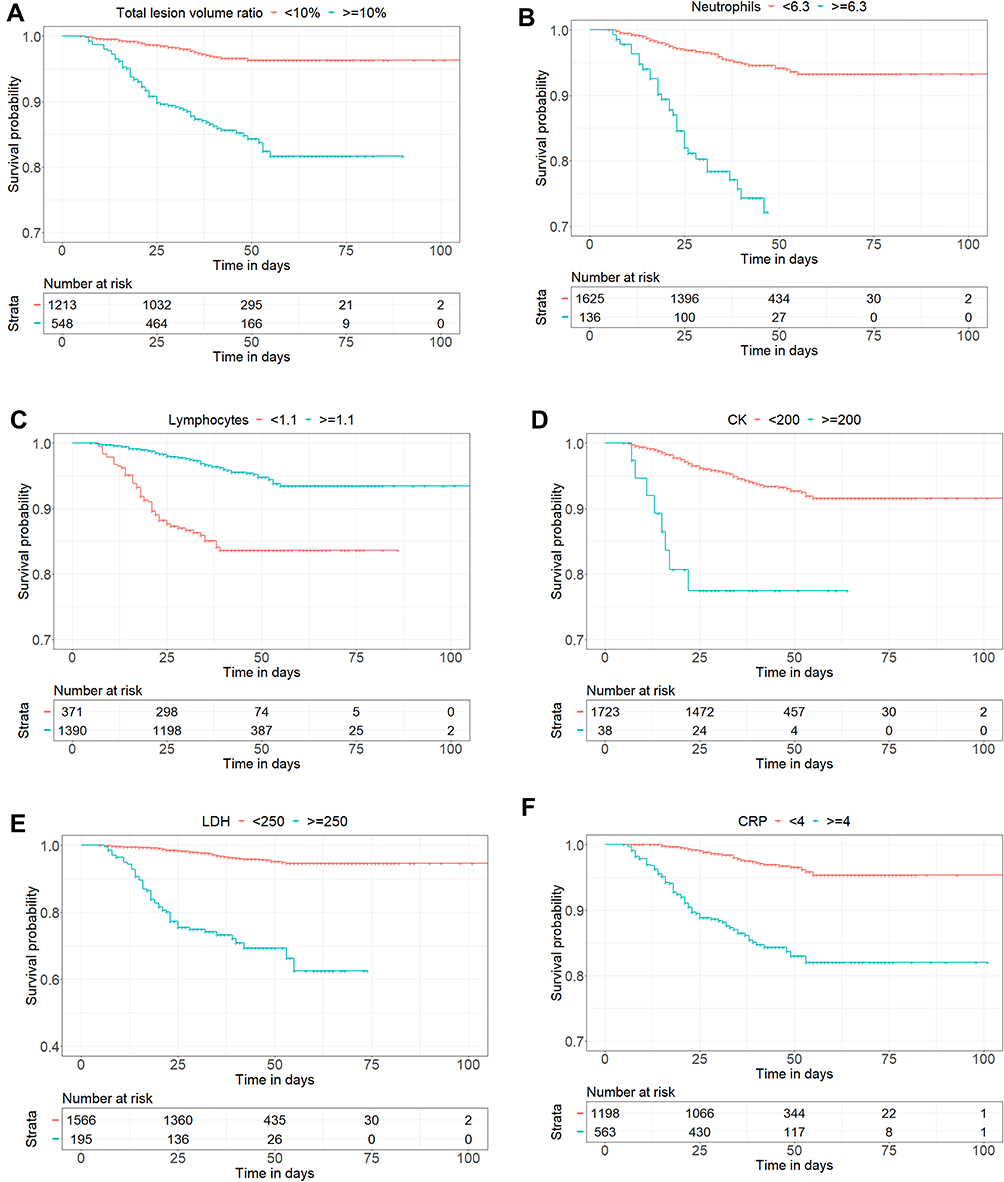 |
Figure 3 Kaplan–Meier curves of risk group stratification for non-progression to severe illness. (A) The cutoffs of neutrophils for each risk group were as follows: low risk: <6.3, and high risk: ≥6.3. (B) The cutoffs of lymphocytes for each risk group were as follows: low risk: ≥1.1, and high risk: <1.1. (C) The cutoffs of CK for each risk group were as follows: low risk: <200, and high risk: ≥200. (D) The cutoffs of LDH for each risk group were as follows: low risk: <250, and high risk: ≥250. (E) The cutoffs of CRP for each risk group were as follows: low risk: <4, and high risk: ≥4. (F) The cutoffs of total lesion volume ratio for each risk group were as follows: low risk: <10%, and high risk: ≥10%. |
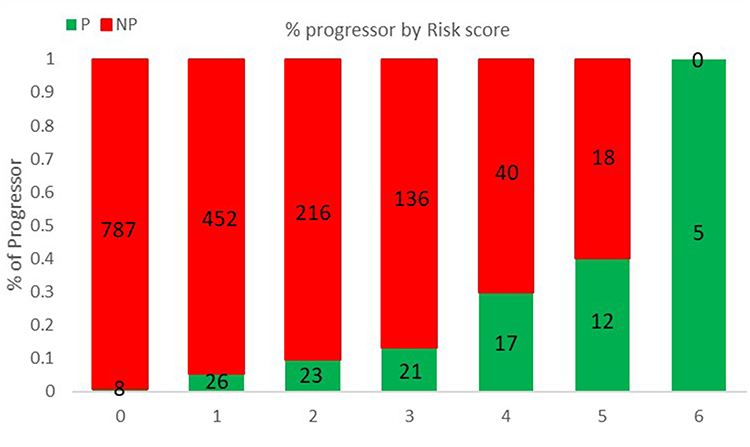 |
Figure 4 Risk score for progressor. Scores ranged from 0 to 6, with 0 indicating the lowest risk and 6 being the highest risk of progression. The numbers in the bar indicate the number of patients in the NP (red) and P (green) that were correctly predicted in the dataset. |
Furthermore, a nomogram based on lymphocytes, BUN, CK-MB, LDH, and PT was established to predict 20 days, 40 days, 60 days, and 80 days survival probability for each S/C COVID-19 (Figure 5). And Kaplan–Meier survival plots for markedly prognostic factors in our study are shown in Figure 6. All patients were divided into two strata according to the cutoff value of lymphocyte counts (low risk: ≥1.1×10⁹/L, high risk: <1.1×10⁹/L), BUN level (low risk: <8.8 mmol/L, high risk: ≥8.8 mmol/L), CK-MB level (low risk: <24 IU/L, high risk: ≥24 IU/L), LDH level (low risk: <250 IU/L, high risk: ≥250 IU/L), and PT (low risk: <15 s, high risk: ≥15 s). We identified five laboratory variables that improved risk stratification in fatal outcome. Integration of high risk of lymphocyte counts (P<0.001), BUN (P<0.001), CK-MB (P<0.001), LDH (P<0.001), and TP (P<0.001) were associated with the fatality in severe COVID-19. Comparison between nomogram-predicted and observed Kaplan–Meier estimates of survival probability shows that it is consistent. Figure 7 shows the results for the five statistically significant clinical variables using the risk score system. The mortality rate increased with increasing risk scores.
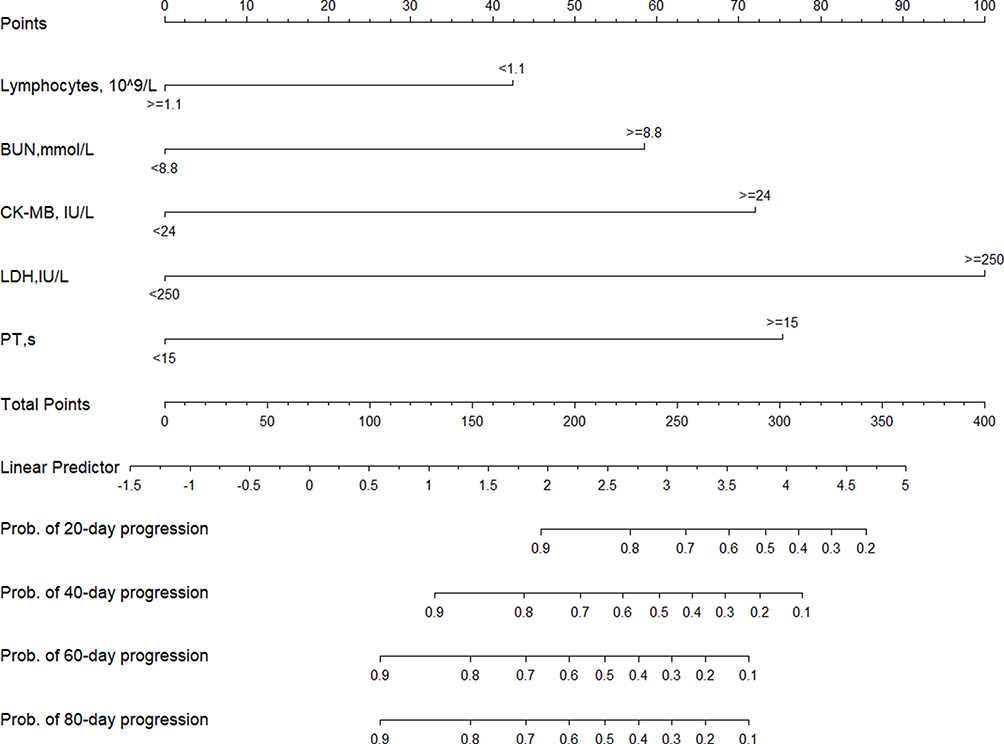 |
Figure 5 Nomogram predicting 20-day, 40-day, 60-day, and 80-day survival probability of patients with COVID-19. |
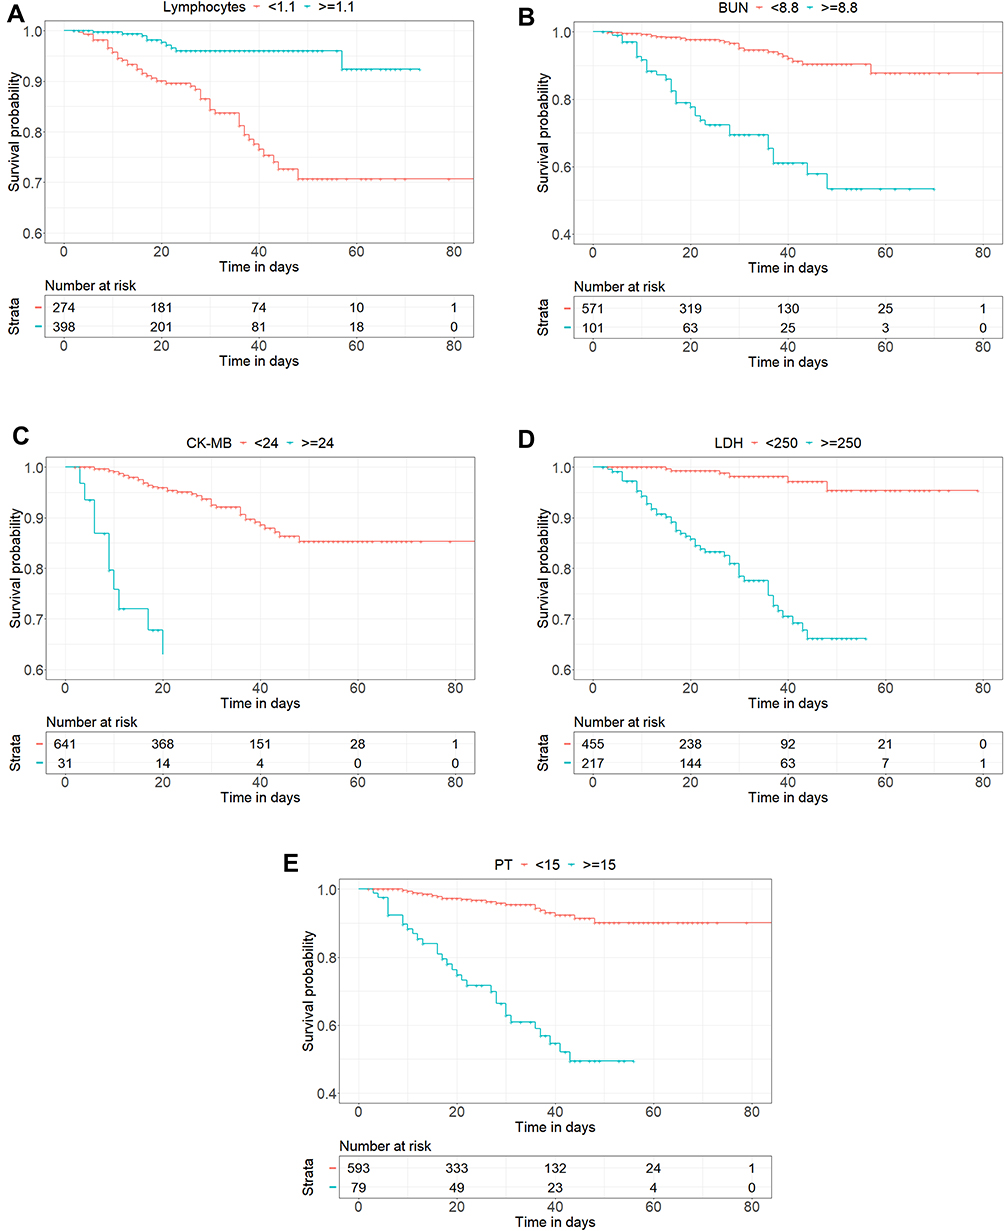 |
Figure 6 Kaplan–Meier curves of risk group stratification for survival probability. (A) Lymphocytes: low risk: ≥1.1, and high risk: <1.1. (B) BUN: low risk: <8.8, and high risk: ≥8.8. (C) CK-MB: low risk: <24, and high risk: ≥24. (D) LDH: low risk: <250, and high risk: ≥250. (E) PT: low risk: <15, and high risk: ≥15. |
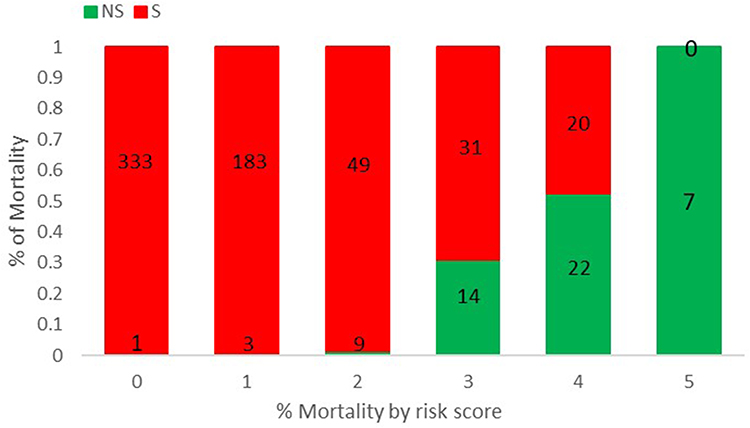 |
Figure 7 Risk score for mortality. Scores ranged from 0 to 5, with 0 indicating the lowest risk and 5 being the highest risk of mortality. The numbers in the bar indicate the number of patients in the S (red) and NS (green) that were correctly predicted in the dataset. |
Discussion
Our study aimed to describe both the disease progression into being S/C during admission and mortality evolved from patients who were S/C ill on admission or deteriorated to during hospitalization of 2321 patients affected with COVID-19 admitted at Huo Shen-Shan hospital in Wu Han.
Our report on the disease dynamic development of COVID-19 patients in diverse stages contributes to early identification and prompt intervention to delay illness progression. Since there is no effective treatment for COVID-19, slowing the development of the disease is key to survival. Majority of mild to moderate patients (93.64%, 1649/1761) did not deteriorate to S/C subtype and recovered from COVID-19 suffering in 12.00 (8.00–18.00) days after admission. And among those who did die, they worsened from S/C state to fatal outcome within a brief period of 15.00 (8.00–23.00) days. Once a patient progressively comes up with the S/C condition, the chance of mortality is 8.33% (56/672) at short notice. This emphasizes the significance of intensive monitoring of critical hazards factors for throughout the disease deterioration in the early stages of COVID-19 infection.
In the present study, the significantly independent risk factors we explored for the disease's continuable progression are similar to previous reports with immune dysfunction and inflammatory responses, coagulopathy, liver damage, myocardial injury, and kidney injury.9,10,14–20 However, older age has been recommended as an essential independent predictor of mortality in SARS and MERS.21,22 Our study suggested that SARS-CoV-2 is susceptible to all aged groups, and the elderly patients have a higher possibility of disease progression to severe in moderate COVID-19 patients, consistent with earlier research.23,24 However, older age is not a risk factor accounting for the progression of moderate COVID-19 based on the multivariate Cox regression analysis. Several reasons can be proposed to explain this result. First, older population may have other comorbid medical conditions that could increase the severity and mortality of infections.25 Patients of older age tend to present with atypical symptoms of COVID-19. They may present afebrile with non-respiratory symptoms, such as delirium or isolated functional decline without any obvious physical symptoms.26–28 These atypical presentations of COVID-19 may impede the early recognition of the disease, increase COVID-19 spread, and mortality. Additionally, although some comorbidities have been reported to be associated with critical illness and mortality, most previous studies did not rank their importance with respect to other laboratory variables.29,30 We speculate that this might be due to variability in triage decision-making among frontline clinicians.
The multivariate Cox regression analysis eventually suggested that higher levels of neutrophils count, CK, LDH and CRP, lymphopenia and total lesion volume ratio greater than 10% increased risk of disease progression into severe or critical states in M/M patients, which was consistent with literate reports.25,26,31 And our study also identified the elevated BUN, CK-MB, and LDH levels, and prolonged PT, together with lymphopenia as five value prognostic factor affecting the fatality for severely/critically ill patients with COVID-19. At the systemic level, elevated neutrophils count is an obvious feature of a high viral load exposure or cytokine storms induced by virus invasion.3,31 Increased serum CRP level is an early indication of the systemic inflammatory response syndrome, whereas lymphopenia is a prediction of immune dysfunction against the infection.14,31 In addition, some laboratory parameters may be associated with multiple organ dysfunction or tissue damage. Acute myocardial injury is marked by increased serum CK-MB and CK levels.32,33 Consistently, the elevated level of BUN is a marked manifestation of kidney injury.34,35 Further, increased LDH level is also a predictive factor of endothelial injury, which can lead to microvascular thrombosis and is related to renal failure.36 Besides, prolonged PT (≥15s) is related to increased exogenous coagulation activity, due to the release of tissue factors as the tissue damage, in patients with SARS-CoV-2 infection or sepsis.37,38 Therefore, maintaining an effective systemic immune response against the SARS-CoV-2 infection and preventing multiple organ failure is the top priority for the treatment of patients with COVID-19.
Surprisingly, decreased lymphocyte count and increased LDH level are identified to be important predictive factors for both disease progression from M/M to S/C and fatal outcome in severe or critical illness. Further, COVID-19 patients with a reduced level of lymphocyte count <1.1×10⁹/L had 1.549-fold higher chance of M/M-S/C-progression and a 2.060-fold higher risk of mortality in S/C states. And an elevation of LDH level (≥250 IU/L) increased the 2.203-fold likely to develop into S/C subtype and increased the 3.309-fold risk of fatality in S/C COVID-19 patients. Based on Kaplan–Meier analysis, lymphocytes count <1.1×10⁹/L and LDH ≥ 250 IU/L both have a higher disease progressive possibility along with survival probability. LDH is present in the cytoplasm of all human tissues, with higher concentrations in the liver, heart, and skeletal muscle.41 Elevated LDH levels have been reported as one of the most common findings in patients infected with MERS-CoV-2 and are also one of the biomarkers most strongly associated with ARDS mortality.42,43 Besides, multiple organ injury and decreased oxygenation with upregulation of the glycolytic pathway can result in abnormal values because the acidic extracellular pH resulting from infection and tissue injury will activate metalloproteases and enhance macrophage-mediated angiogenesis.44 When the lung tissue is infected by SARS-CoV-2, LDH itself is released when cellular necrosis happens; therefore, in severe infections in which a large number of cells typically undergo necrosis, high serum LDH levels can be observed. In particular, severe COVID-19 infections that mainly affect the lungs will release a high amount of LDH isozyme commonly found in lung tissue (LHD isoenzyme 3). Thus, closely detecting the dynamic change of lymphocyte count and LDH level is of great significance to provide important evidence to timely determine disease tendency and give patients the best medical care possible.
Radiological tests, particularly thin-slice chest computed tomography (CT) scans, play a crucial role in identifying the early stage of pulmonary infection, monitoring disease development and guiding clinical treatment planning for patients with COVID-19.45,47 In particular, we identified the total lesion volume ratio based on intelligent software to be a significant predictor for disease progression in non-severe patients with COVID-19. And patients with the total lesion volume ratio greater than 10% had 2.286-fold higher risk of disease progression into being S/C during admission. This is supplementary knowledge to the previous articles that the percentage of infection in the whole lung contributes to the diagnosis and severity grading of COVID-19 patients.11,12 SARS-CoV-2 spike protein depends on the binding to angiotensin-converting enzyme II (ACE2) receptor to enter cells in the lung, which may lead to the down-regulating of ACE2, elevated pulmonary capillary permeability, and diffuse alveolar damage.48,49 We speculate that progressors have increased expression of ACE2 receptors, making them more vulnerable to SARS-CoV-2 infection. The chest CT, featuring together with intelligent software analysis, tends to manifest in different features in different phases of disease onset among various severity subtype patients, and the total lesion volume ratio is rapidly increased in COVID-19 patients with non-severe-progression, indicating that early identification and timely intervention could not be more important.
While a large number of studies have previously identified clinical variables associated with the severity of COVID-19 infection, only a few studies have attempted to develop a predictive or risk score model to predict mortality and disease progression. Previous studies have indicated that deep learning and the resultant risk score have the potential to provide frontline physicians with quantitative tools to stratify patients more effectively in time-sensitive and resource-constrained circumstances.50–52 In the present study, a risk score system was constructed using the statistically significant clinical variables to predict progression and mortality. The progression and mortality rates increased with increasing risk scores, which is consistent with recent research.30
There are some limitations in our study. First, this study is a retrospective single-center study, and a multi-center study is needed to verify our conclusion. Second, due to the emergency circumstances, not all laboratory findings were done in all cases, including high-sensitivity cardiac troponin I, myoglobin, IL-6, PCT, BNP and serum ferritin. Therefore, their effects might be underestimated in predicting the dynamic development of COVID-19. Third, this study only concentrated on the impact of laboratory indicators and total lesion volume rate in the COVID-19 clinical course, whereas other factors, such as hospital admission time, treatment strategy, and the heterogeneities of medical level in different hospitals, cannot be ignored. Finally, due to early clinical intervention, only 3 patients developed into S/C in M/M and eventually progressed to death, which has a certain impact on the continuity of the two processes in this study. So, these findings need to be further confirmed by large sample data.
In conclusion, our study indicated that increased neutrophils count, lower lymphocytes count, elevated levels of CK, LDH, and higher total lesion volume ratio are confirmed to be reliable predictors for clinical progression in non-severe patients with COVID-19. The elevated BUN, CK-MB, and LDH levels, and prolonged PT are importantly independent risk factors associated with fatality in clinical courses of severely ill patients. In particular, reduced lymphocytes count and elevated LDH level may serve as predictive factors associated with a thorough clinical course of COVID-19, which provides significant evidence to assess disease development trends and timely intervention.
Disclosure
The authors have no conflicts of interest for this work to declare.
References
1. Huang C, Wang Y, Li X, et al. Clinical features of patients infected with 2019 novel coronavirus in Wuhan, China. Lancet. 2020;395(10223):497–506. doi:10.1016/S0140-6736(20)30183-5
2. Chen N, Zhou M, Dong X, et al. Epidemiological and clinical characteristics of 99 cases of 2019 novel coronavirus pneumonia in Wuhan, China: a descriptive study. Lancet. 2020;395(10223):507–513. doi:10.1016/S0140-6736(20)30211-7
3. Wang D, Hu B, Hu C, et al. Clinical characteristics of 138 hospitalized patients with 2019 novel coronavirus-infected pneumonia in Wuhan, China. JAMA. 2020;323(11):1061–1069. doi:10.1001/jama.2020.1585
4. Yi Y, Lagniton PNP, Ye S, et al. COVID-19: what has been learned and to be learned about the novel coronavirus disease. Int J Biol Sci. 2020;16(10):1753–1766. doi:10.7150/ijbs.45134
5. Rothan HA, Byrareddy SN. The epidemiology and pathogenesis of coronavirus disease (COVID-19) outbreak. J Autoimmun. 2020;109:102433. doi:10.1016/j.jaut.2020.102433
6. Guan WJ, Ni ZY, Hu Y, et al. Clinical characteristics of coronavirus disease 2019 in China. N Engl J Med. 2020;382(18):1708–1720. doi:10.1056/NEJMoa2002032
7. World Health Organization. Coronavirus disease 2019 (COVID-19) situation report-72; 2020. Available from: https://www.who.int/docs/default-source/coronaviruse/situation-reports/20200401-sitrep-72-covid-19.pdf?sfvrsn=3dd8971b_2.
8. Liu Y, Mao B, Liang S, et al; Shanghai Clinical Treatment Experts Group for COVID-19. Association between age and clinical characteristics and outcomes of COVID-19. Eur Respir J. 2020;55(5):2001112. doi:10.1183/13993003.01112-2020
9. Zhou F, Yu T, Du R, et al. Clinical course and risk factors for mortality of adult inpatients with COVID-19 in Wuhan, China: a retrospective cohort study. Lancet. 2020;395(10229):1054–1062. doi:10.1016/S0140-6736(20)30566-3
10. Liu X, Zhou H, Zhou Y, et al. Risk factors associated with disease severity and length of hospital stay in COVID-19 patients. J Infect. 2020;81(1):e95–e97. doi:10.1016/j.jinf.2020.04.008
11. Zhang HT, Zhang JS, Zhang HH, et al. Automated detection and quantification of COVID-19 pneumonia: CT imaging analysis by a deep learning-based software. Eur J Nucl Med Mol Imaging. 2020;47(11):2525–2532. doi:10.1007/s00259-020-04953-1
12. Lan W, Yang R, Guo D, et al. Longitudinal changes of chest CT appearances in patients with severe COVID-19 and its correlation with laboratory examination results. EUR J Radiol. 2016. doi:10.1016/j.ejro
13. National Health Commission. Diagnosis and treatment protocol for novel coronavirus pneumonia (Trial Version 7). Chin Med J (Engl). 2020;133(9):1087–1095. doi:10.1097/CM9.0000000000000819
14. Huang J, Cheng A, Lin S, et al. Individualized prediction nomograms for disease progression in mild COVID-19. J Med Virol. 2020;92(10):2074–2080. doi:10.1002/jmv.25969
15. Ji D, Zhang D, Xu J, et al. Prediction for progression risk in patients with COVID-19 pneumonia: the call score. Clin Infect Dis. 2020;71(6):1393–1399. doi:10.1093/cid/ciaa414
16. Zhang J, Yu M, Tong S, et al. Predictive factors for disease progression in hospitalized patients with coronavirus disease 2019 in Wuhan, China. J Clin Virol. 2020;127:104392. doi:10.1016/j.jcv.2020.104392
17. Wu C, Chen X, Cai Y, et al. Risk factors associated with acute respiratory distress syndrome and death in patients with coronavirus disease 2019 pneumonia in Wuhan, China. JAMA Intern Med. 2020;180(7):934–943. doi:10.1001/jamainternmed.2020.0994
18. Peduzzi P, Concato J, Kemper E, et al. A simulation study of the number of events per variable in logistic regression analysis. J Clin Epidemiol. 1996;49(12):1373–1379. doi:10.1016/s0895-4356(96)00236-3
19. Young BE, Ong SWX, Kalimuddin S, et al. Epidemiologic features and clinical course of patients infected with SARS-CoV-2 in Singapore. JAMA. 2020;323(15):1488–1494. doi:10.1001/jama.2020.3204
20. Cummings MJ, Baldwin MR, Abrams D, et al. Epidemiology, clinical course, and outcomes of critically ill adults with COVID-19 in New York City: a prospective cohort study. Lancet. 2020;395(10239):1763–1770. doi:10.1016/S0140-6736(20)31189-2
21. Choi KW, Chau TN, Tsang O, et al. Outcomes and prognostic factors in 267 patients with severe acute respiratory syndrome in Hong Kong. Ann Intern Med. 2003;139(9):715–723. doi:10.7326/0003-4819-139-9-200311040-00005
22. Hong KH, Choi JP, Hong SH, et al. Predictors of mortality in Middle East respiratory syndrome (MERS). Thorax. 2018;73(3):286–289. doi:10.1136/thoraxjnl-2016-209313
23. Wu Z, McGoogan JM. Characteristics of and important lessons from the coronavirus disease 2019 (COVID-19) outbreak in China: summary of a report of 72 314 cases from the Chinese center for disease control and prevention. JAMA. 2020;323(13):1239–1242. doi:10.1001/jama.2020.2648
24. Wei M, Yuan J, Liu Y, et al. Novel coronavirus infection in hospitalized infants under 1 year of age in China. JAMA. 2020;323(13):1313–1314. doi:10.1001/jama.2020.2131
25. Zhavoronkov A. Geroprotective and senoremediative strategies to reduce the comorbidity, infection rates, severity, and lethality in gerophilic and gerolavic infections. Aging (Albany NY). 2020;12(8):6492–6510. doi:10.18632/aging.102988
26. D’Adamo H, Yoshikawa T, Ouslander JG. Coronavirus disease 2019 in geriatrics and long-term care: the ABCDs of COVID-19. J Am Geriatr Soc. 2020;68(5):912–917. doi:10.1111/jgs.16445
27. Putri C, Hariyanto TI, Hananto JE, et al. Parkinson’s disease may worsen outcomes from coronavirus disease 2019 (COVID-19) pneumonia in hospitalized patients: a systematic review, meta-analysis, and meta-regression. Parkinsonism Relat Disord. 2021;87:155–161. doi:10.1016/j.parkreldis.2021.04.019
28. Hariyanto TI, Putri C, Situmeang RFV, et al. Dementia is a predictor for mortality outcome from coronavirus disease 2019 (COVID-19) infection. Eur Arch Psychiatry Clin Neurosci. 2021;271(2):393–395. doi:10.1007/s00406-020-01205-z
29. Zheng Z, Peng F, Xu B, et al. Risk factors of critical & mortal COVID-19 cases: a systematic literature review and meta-analysis. J Infect. 2020;81(2):e16–e25. doi:10.1016/j.jinf.2020.04.021
30. Wynants L, Van Calster B, Collins GS, et al. Prediction models for diagnosis and prognosis of covid-19: systematic review and critical appraisal. BMJ. 2020;369:m1328. doi:10.1136/bmj.m1328
31. Zheng Y, Zhang Y, Chi H, et al. The hemocyte counts as a potential biomarker for predicting disease progression in COVID-19: a retrospective study. Clin Chem Lab Med. 2020;58(7):1106–1115. doi:10.1515/cclm-2020-0377
32. Li JW, Han TW, Woodward M, et al. The impact of 2019 novel coronavirus on heart injury: a systematic review and meta-analysis. Prog Cardiovasc Dis. 2020;63(4):518–524. doi:10.1016/j.pcad.2020.04.008
33. Guo T, Fan Y, Chen M, et al. Cardiovascular implications of fatal outcomes of patients with coronavirus disease 2019 (COVID-19). JAMA Cardiol. 2020;5(7):811–818. doi:10.1001/jamacardio.2020.1017
34. Yang X, Jin Y, Li R, et al. Prevalence and impact of acute renal impairment on COVID-19: a systematic review and meta-analysis. Crit Care. 2020;24(1):356. doi:10.1186/s13054-020-03065-4
35. Gabarre P, Dumas G, Dupont T, et al. Acute kidney injury in critically ill patients with COVID-19. Intensive Care Med. 2020;46(7):1339–1348. doi:10.1007/s00134-020-06153-9
36. Wang X, Sahu KK, Cerny J. Coagulopathy, endothelial dysfunction, thrombotic microangiopathy and complement activation: potential role of complement system inhibition in COVID-19. J Thromb Thrombolysis. 2020;1(3):657–662. doi:10.1007/s11239-020-02297-z
37. Zhang Y, Xiao M, Zhang SL, et al. Coagulopathy and antiphospholipid antibodies in patients with covid-19. N Engl J Med. 2020;382(17):e38. doi:10.1056/NEJMc2007575
38. Li Y, Hu Y, Yu J, et al. Retrospective analysis of laboratory testing in 54 patients with severe- or critical-type 2019 novel coronavirus pneumonia. Lab Invest. 2020;100(6):794–800. doi:10.1038/s41374-020-0431-6
39. Liu WJ, Zhao M, Liu K, et al. T-cell immunity of SARS-CoV: implications for vaccine development against MERS-CoV. Antiviral Res. 2017;137:82–92. doi:10.1016/j.antiviral.2016.11.006
40. Chu H, Zhou J, Wong BH-Y, et al. Middle east respiratory syndrome coronavirus efficiently infects human primary T lymphocytes and activates the extrinsic and intrinsic apoptosis pathways. J Infect Dis. 2016;213(6):811–814. doi:10.1001/jamacardio.2020.1017
41. Hsu PP, Sabatini DM. Cancer cell metabolism: Warburg and beyond. Cell. 2008;134(5):703–707. doi:10.1016/j.cell.2008.08.021
42. Assiri A, Al-Tawfiq JA, Al-Rabeeah AA, et al. Epidemiological, demographic, and clinical characteristics of 47 cases of Middle East respiratory syndrome coronavirus disease from Saudi Arabia: a descriptive study. Lancet Infect Dis. 2013;13(9):752–761. doi:10.1016/S1473-3099(13)70204-4
43. Hoeboer SH, Oudemans-van Straaten HM, Groeneveld AB. Albumin rather than C-reactive protein may be valuable in predicting and monitoring the severity and course of acute respiratory distress syndrome in critically ill patients with or at risk for the syndrome after new onset fever. BMC Pulm Med. 2015;15:22. doi:10.1186/s12890-015-0015-1
44. Martinez-Outschoorn UE, Prisco M, Ertel A, et al. Ketones and lactate increase cancer cell “stemness,” driving recurrence, metastasis and poor clinical outcome in breast cancer: achieving personalized medicine via Metabolo-Genomics. Cell Cycle. 2011;10(8):1271–1286. doi:10.4161/cc.10.8.15330
45. Zu ZY, Jiang MD, Xu PP, et al. Coronavirus disease 2019 (COVID-19): a perspective from China. Radiology. 2020;296(2):E15–E25. doi:10.1148/radiol.2020200490
46. Zhu Y, Liu YL, Li ZP, et al. Clinical and CT imaging features of 2019 novel coronavirus disease (COVID-19). J Infect. 2020;81(1):147–178. doi:10.1016/j.jinf.2020.03.033
47. Li Y, Xia L. Coronavirus disease 2019 (COVID-19): role of chest CT in diagnosis and management. AJR Am J Roentgenol. 2020;214(6):1280–1286. doi:10.2214/AJR.20.22954
48. Letko M, Marzi A, Munster V. Functional assessment of cell entry and receptor usage for SARS-CoV-2 and other lineage B betacoronaviruses. Nat Microbiol. 2020;5(4):562–569. doi:10.1038/s41564-020-0688-y
49. Zhao Y, Zhao ZX, Wang YJ, et al. Single-cell RNA expression profiling of ACE2, the receptor of SARS-CoV-2. Am J Respir Crit Care Med. 2020;202(5):756–759. doi:10.1164/rccm.202001-0179LE
50. Li X, Ge P, Zhu J, et al. Deep learning prediction of likelihood of ICU admission and mortality in COVID-19 patients using clinical variables. PeerJ. 2020;8:e10337. doi:10.7717/peerj.10337
51. Hou W, Zhao Z, Chen A, et al. Machining learning predicts the need for escalated care and mortality in COVID-19 patients from clinical variables. Int J Med Sci. 2021;18(8):1739–1745. doi:10.7150/ijms.51235
52. Kar S, Chawla R, Haranath SP, et al. Multivariable mortality risk prediction using machine learning for COVID-19 patients at admission (AICOVID). Sci Rep. 2021;11(1):12801. doi:10.1038/s41598-021-92146-7
 © 2021 The Author(s). This work is published and licensed by Dove Medical Press Limited. The full terms of this license are available at https://www.dovepress.com/terms.php and incorporate the Creative Commons Attribution - Non Commercial (unported, v3.0) License.
By accessing the work you hereby accept the Terms. Non-commercial uses of the work are permitted without any further permission from Dove Medical Press Limited, provided the work is properly attributed. For permission for commercial use of this work, please see paragraphs 4.2 and 5 of our Terms.
© 2021 The Author(s). This work is published and licensed by Dove Medical Press Limited. The full terms of this license are available at https://www.dovepress.com/terms.php and incorporate the Creative Commons Attribution - Non Commercial (unported, v3.0) License.
By accessing the work you hereby accept the Terms. Non-commercial uses of the work are permitted without any further permission from Dove Medical Press Limited, provided the work is properly attributed. For permission for commercial use of this work, please see paragraphs 4.2 and 5 of our Terms.