")
Back to Journals » Diabetes, Metabolic Syndrome and Obesity » Volume 14
Increased Serum GDF15 Related to Improvement in Metabolism by Lifestyle Intervention Among Young Overweight and Obese Adults
Authors Cai L, Li C, Wang Y, Mo Y, Yin J, Ma X
Received 14 January 2021
Accepted for publication 20 February 2021
Published 17 March 2021 Volume 2021:14 Pages 1195—1202
DOI https://doi.org/10.2147/DMSO.S302033
Checked for plagiarism Yes
Review by Single anonymous peer review
Peer reviewer comments 2
Editor who approved publication: Dr Konstantinos Tziomalos
Lingli Cai,* Cheng Li,* Yufei Wang, Yifei Mo, Jun Yin, Xiaojing Ma
Department of Endocrinology and Metabolism, Shanghai Jiao Tong University Affiliated Sixth People’s Hospital; Shanghai Clinical Center for Diabetes; Shanghai Diabetes Institute; Shanghai Key Laboratory of Diabetes Mellitus, Shanghai, People’s Republic of China
*These authors contributed equally to this work
Correspondence: Jun Yin; Xiaojing Ma
Department of Endocrinology and Metabolism, Shanghai Jiao Tong University Affiliated Sixth People’s Hospital, 600 Yishan Road, Shanghai, 200233, People’s Republic of China
Tel +86-21-64369181
Fax +86-21-64368031
Email [email protected]; [email protected]
Aim: Growth differentiation factor 15 (GDF15) is closely related to obesity. This study aimed to explore the influence of weight loss intervention on serum GDF15 levels and the relationship between GDF15 and metabolism.
Materials and Methods: Forty-four overweight and obese adults either adopted a low-carbohydrate diet or performed moderate-to-vigorous exercise for 3 weeks. Weekly follow-ups were conducted to measure body composition, glucose and lipid metabolism and serum GDF15 levels.
Results: After 3 weeks of intervention, body weight, fat mass and waist circumference in both groups decreased (P < 0.05). No significant change in GDF15 levels was observed in the two groups. Among all the subjects, 10 of them (22.7%, group of Down) showed a decrease in GDF15 and 34 (77.3%, group of Up) showed an increase in GDF15 after the intervention. We found that GDF15 increased significantly with the follow-up time in the UP group and waist circumference, fasting serum insulin (FINS), homeostasis model assessment of insulin resistance (HOMA-IR) and triglycerides (TG) decreased (P for trend < 0.05). However, no significant differences in all parameters were detected in Down group. In addition, GDF15 was elevated between 30 mins and 120 mins in a 75-g oral glucose tolerance test. Its trend was negatively correlated with plasma glucose and serum insulin.
Conclusion: Increased serum GDF15 was associated with improvement in metabolism by lifestyle intervention among young overweight and obese adults. The increase of GDF15 could be an indicator to evaluate metabolic improvements in overweight and obese people.
Clinical Trial Registration: www.chictr.org.cn, registration number ChiCTR1800016786.
Keywords: growth differentiation factor 15, obesity, metabolism, low-carbohydrate diet, exercise
Introduction
Obesity has become one of the most important issues of global public health. Lifestyle adaptations including dietary adjustments and physical exercises are basic methods for weight loss,1 which can reduce both subcutaneous and visceral fat and improve metabolism.2,3 It has been reported that the occurrence of obesity and obesity-associated diseases are closely related to many hormones and cytokines.4,5 For example, inflammatory factors like interleukin 6 and tumor necrosis factor α were found elevated in obese people, while anti-inflammatory cytokines like adiponectin decreased.6–8 Diets and regular exercise are able to affect the production of these cytokines.9,10
Growth differentiation factor 15 (GDF15), also known as macrophage inhibitory cytokine-1, is a member of the transforming growth factor-β superfamily. It is expressed in various cells including adipocytes.11,12 Previous studies have confirmed its close relationship with obesity,12 establishing its new role as a factor that regulates energy metabolism and homeostasis. In addition, GDF15 knockout mice were more prone to high fat diet-induced obesity with aberrant glucose tolerance, lowered locomotor activity and metabolic rate.13
At present, the influence of weight loss intervention on circulating levels of GDF15 in obese people was rarely investigated. To further explore the associations between GDF15 and obesity, the study enrolled overweight and obese adults and measured their serum GDF15 concentrations during a 3-week lifestyle intervention, assessing the changes of GDF15 levels and metabolism status.
Materials and Methods
Study Subjects
All subjects provided written informed consent before enrollment. The study was approved by the Ethics Committees of Shanghai Jiao Tong University Affiliated Sixth People’s Hospital and complied with the Declaration of Helsinki. This trial was registered at www.chictr.org.cn with clinical trial registration number ChiCTR1800016786.
The study recruited overweight or obese subjects from the outpatient clinic at the Department of Endocrinology and Metabolism of Shanghai Jiao Tong University Affiliated Sixth People’s Hospital from July 2018 to January 2019. The inclusion criteria were defined as follows: (i) aged from 18 to 40 years old; (ii) Body mass index (BMI) ≥24 kg/m2 and waist circumference of males ≥90 cm or female ≥85 cm.14 Fifty-one subjects were prescreened by phone or message. None of the subjects had diabetes, severe liver, kidney or thyroid dysfunction, malignant tumor, infectious disease, pregnancy or lactation, history of medicine that might influence metabolism. None of the subjects had a history of cardiovascular disease. None of them had taken weight loss interventions within 1 month before the study. All the subjects were of Chinese Han nationality. Among them, two subjects were excluded due to not within the BMI range; two subjects were excluded due to a history of thyroid surgery and lack of time to participate, respectively; two subjects were excluded for other reasons. None of the subjects was diagnosed with diabetes after a 75-g oral glucose tolerance test (OGTT). The diagnosis of diabetes is according to the 2010 American diabetes association criteria.15 Finally, 45 overweight or obese subjects aged from 20 to 34 years were enrolled.
Study Protocol
All subjects underwent an OGTT and completed standardized questionnaires in the first visit (Visit 1, Day 0). Eligible subjects were randomly divided into the low-carbohydrate diet group (LC) or the exercise group (EX) by randomized digital table. Subjects in each group received detailed instructions about intervention measures by an investigator before they started.
Subjects in the LC were not prescribed a specific diet with exact composition. Restricted carbohydrate intake <50 g/day for 3 weeks was required and there was no restriction of calories, proportion of fat and protein, water or black coffee intake. Fruits, vegetables, processed foods or drinks with high sugar content or high-glycemic index were also restricted. No additional exercise was needed. Subjects in the EX were required to maintain their usual diet and take moderate-to-vigorous exercise ≥30 mins/day for 3 weeks. Heart rate was required to reach 60% to 70% of their maximum predicted heart rate, which was calculated as 220 (210 for females) minus the subject’s age per minute. No restriction of exercise types, but jogging, trotting, skipping and cycling were recommended. Interventions were conducted by participants themselves in free living.
All subjects were required to record their daily diet or exercise conditions by taking photos and filling in record forms assigned by investigators and upload photos to investigators every day. The follow-ups were conducted at the end of week 1 (Visit 2, day 8), week 2 (Visit 3, day 15) and week 3 (Visit 4, day 22).
Anthropometric and Biochemical Measurements
Anthropometric parameters and fasting venous blood samples were collected in each clinical follow-up (except an OGTT in Visit 1). Body composition was assessed by the Tanita TBF-418 body composition analyzer (Tanita Cooperation, Tokyo, Japan). Height was measured by a metric tape at baseline. Waist circumference was measured over the midpoint between the inferior margin of the last rib and the iliac crest by a flexible non-elastic metric tape. BMI = weight (kg)/squared height (m2).
Venous blood samples were collected after an overnight fast (≥10 hours) and were used to measure fasting plasma glucose (PG0min or FPG), fasting serum insulin (INS0min or FINS), fasting serum GDF15 (GDF150min), glycated haemoglobin A1c (HbA1c), total cholesterol (TC), triglycerides (TG), high-density lipoprotein cholesterol (HDL‐c) and low‐density lipoprotein cholesterol (LDL‐c). All subjects underwent a 75-g OGTT to measure 30-min plasma glucose (PG30min), 30-min serum insulin (INS30min), 30-min serum GDF15 (GDF1530min), 120-min plasma glucose (PG120min), 120-min serum insulin (INS120min) and 120-min serum GDF15 (GDF15120min).
Plasma glucose and serum lipids were measured by a biochemical analyzer (Hitachi 7600–120, Tokyo, Japan). HbA1c was measured by using high-performance liquid chromatography with a VARIANT II Hemoglobin A1c analyzer (Bio-Rad Laboratories, Hercules, CA). Serum insulin was measured by an electrochemiluminescence immunoassay on a Cobas e601 analyzer (Roche Diagnostics GmbH, Mannheim, Germany). Serum GDF15 levels were determined by quantitative sandwich enzyme-linked immunosorbent assay (R&D Systems, Minneapolis, USA) with intra‐ and inter‐assay coefficients of variation (CV) 0.46%-4.08% and 5.77%-9.24%, respectively. The CVs were determined at the concentrations of 100 pg/mL, 200 pg/mL, 400 pg/mL, 800 pg/mL and 1200 pg/mL (supplementary Table 1). The limit of quantitation (LoQ) of GDF15 ranged from 0.0 to 4.4 pg/mL and the mean LoQ was 2.0 pg/mL. The assay measuring range was 0-1500 pg/mL and the expected range in health was 337-1060 pg/mL in this assay. The homeostasis model assessment-insulin resistance (HOMA-IR) = FPG (mmol/L) × FINS (mU/L)/22.5.
Statistical Analysis
Statistical analyses were carried out using the SPSS 20.0 software (SPSS Inc., Chicago, IL, USA). The Kolmogorov–Smirnov test was performed to determine the normality of the data distribution. Data with a normal distribution were expressed as the mean ± standard error, and data with skewed distribution were expressed as median with interquartile range. Categorical variables were expressed as numbers with percentages. Comparisons between the two groups were carried out using the Student’s t test (normal distribution) or the Mann–Whitney U-test (skewed distribution). One-way repeated-measure ANOVA (Bonferroni correction included) was used to analyze differences from time 0 min to time 30 min and time 120 min in OGTT and differences from baseline to the 8-day, 15-day and 22-day follow-ups in the same group. Pearson correlation analysis was used to determine the relationship between the change of GDF15 and other metabolic parameters. Multivariate stepwise regression analysis was used to evaluate influential factors on change of GDF15. Cohen’s d was used to calculate the effect size ( ,
,  ). A multivariate generalized estimating equation model adjusted for gender, age, follow‐up visits, obesity status, family history of obesity, diabetes mellitus and other confounding factors was used to evaluate influential factors on GDF15. A P value (two sides) <0.05 was considered statistically significant.
Results
Basic Characteristics of the Study Subjects
Overall, 22 subjects in the LC and 22 subjects in the EX (Total 45 subjects, 1 subject quit due to lack of time) finished the study and none of them had a smoking history. All the baseline characteristics had no significant difference between the two groups (Table 1).
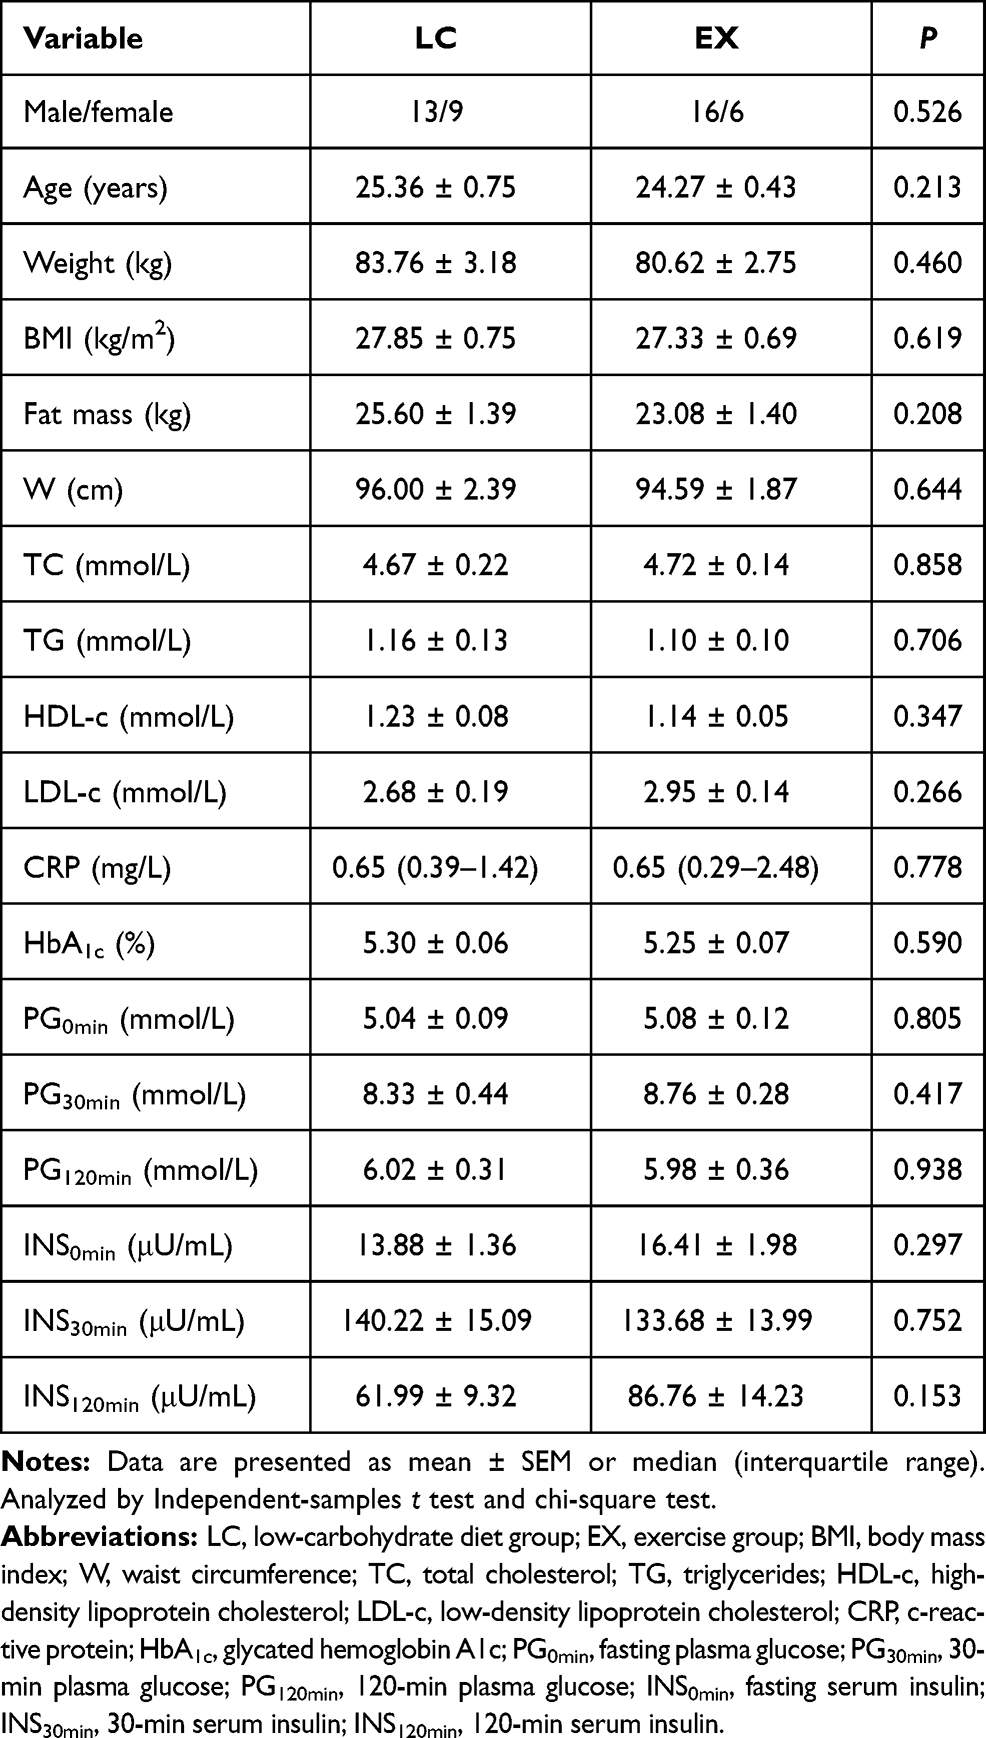 |
Table 1 Baseline Characteristics of Study Participants |
Serum GDF15 Levels in OGTT
During OGTT (n = 44), plasma glucose and serum insulin sharply increased first and then decreased (Figure 1A and B). GDF1530min (294.02±14.33 pg/mL) showed a slight decrease, not significantly different from GDF150min (301.80±15.93 pg/mL). After 120 mins’ high glucose loading, GDF15120min (309.84±13.90 pg/mL) rebounded to baseline level, significantly higher than GDF1530min (P < 0.05, Figure 1C). The differences between the GDF15120min and GDF1530min, PG120min and PG30min, INS120min and INS30min were represented as ΔGDF15120min-30min, ΔPG120min-30min and ΔINS120min-30min, respectively. Pearson correlation analysis showed that ΔGDF15120min-30min was negatively correlated with ΔPG120min-30min (r = −0.358, P < 0.05) and ΔINS120min-30min (r = −0.496, P < 0.05).
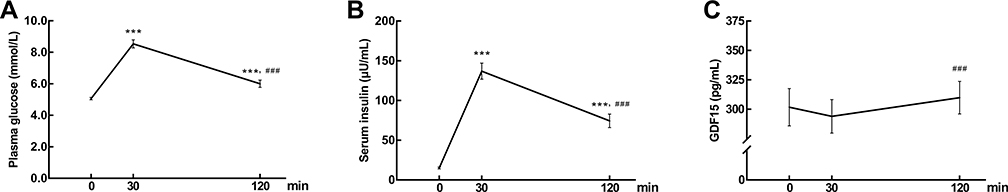 |
Figure 1 (A) Plasma glucose (B) serum insulin and (C) GDF15 concentrations over 120 min in response to a 75 g oral glucose tolerance test (OGTT). Data are expressed as mean ± SEM. ***P < 0.001 compared to time 0 min and ###P < 0.001 compared to time 30 min. |
Serum GDF15 Levels During Interventions
After 3-week interventions, body weight, fat mass and waist circumference in both groups decreased compared to baseline (P < 0.05, Figure 2A–C). However, no significant change in serum GDF15 levels was observed in the two groups (Figure 2D). The baseline and endpoint levels of GDF15 in LC and EX groups were in supplementary Table 2. GDF15 levels of each subjects in week 1, week2 and week 3 were in supplementary Table 3. All the parameters between the two groups had no significant difference during the study.
 |
Figure 2 (A) Body weight (B) Fat mass and (C) Waist circumference and (D) serum fasting GDF15 concentrations during the follow-ups in low-carbohydrate group (n = 22) and exercise group (n = 22). Data are expressed as mean ± SEM. *P < 0.05, ***P < 0.001 compared to baseline (Day 0). |
Relationship of GDF15 with Studied Parameters
To evaluate the association between ΔGDF15 and the intervention means, we performed a stepwise regression analysis with ΔGDF15 as the dependent variable (Table 2). We found that after adjusting for confounding factors including gender, age, Δweight, ΔBMI, Δfat mass, Δwaist circumference, ΔFPG, ΔFINS, ΔHOMA-IR, ΔTC, ΔTG, ΔHDL and ΔLDL, intervention means was not an influential factor for GDF15 (P = 0.373).
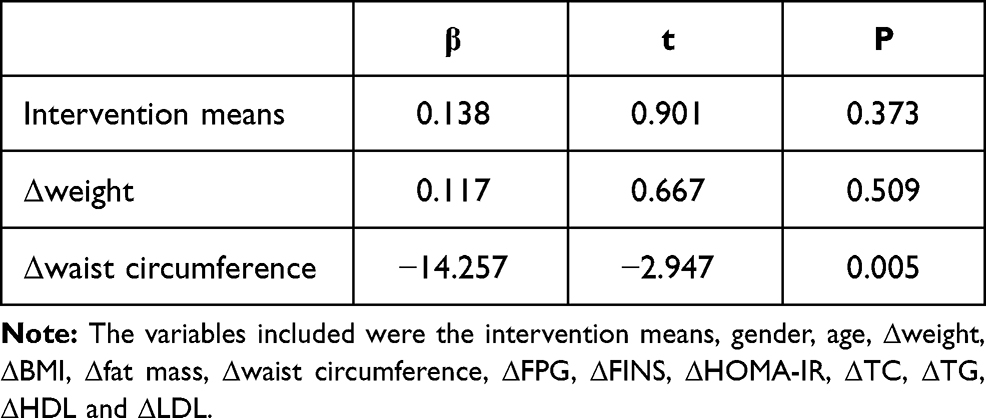 |
Table 2 Multivariate Linear Regression Analysis of ΔGDF15 |
Therefore, data of 44 subjects were further analyzed together. Mean serum GDF15 levels of 44 subjects increased compared to baseline (V4: 339.79±17.86 pg/mL vs V1: 301.80±15.93 pg/mL, P < 0.05). Pearson correlation analysis was used to analyze the relationship between ΔGDF15 and Δweight, ΔBMI, Δwaist circumference, ΔFBG, ΔFIN, Δlipid. The results showed that ΔGDF15 was negatively correlated with Δwaist circumference (r = −0.414, P < 0.05) and ΔFPG (r = −0.318, P < 0.05), which indicated that increased GDF15 might be associated with improvement in metabolism.
Among all the participants, 10 subjects’ GDF15 (22.7%) decreased and 34 subjects’ GDF15 (77.3%) increased compared to their baseline levels (Figure 3A and B). Subjects were then divided into another two groups according to their changes of GDF15 (Down: n = 10 and Up: n = 34, Table 3). Changes of parameters between baseline and endpoint in UP and DOWN groups were presented in supplementary Table 4. A multivariate generalized estimating equation model was used to analyze changes in the GDF15 and other metabolic parameters with adjustments for confounding factors including gender, age, obesity status, family history of obesity and diabetes mellitus. The results showed that in the Up group, GDF15 tended to increase significantly with the follow-up time (P for trend <0.05) along with the decreased trend of waist circumference, FINS, HOMA-IR and TG (P for trend <0.05). However, in the Down group, all comparisons were nonsignificant.
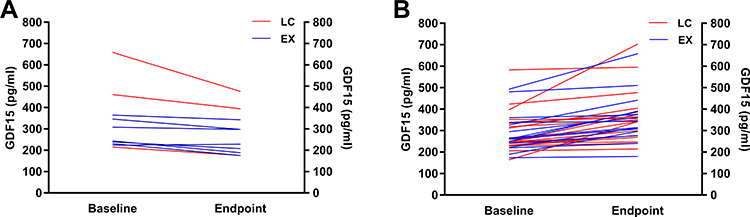 |
Figure 3 (A) The downtrend (n = 10) and (B) uptrend (n = 34) of fasting serum GDF15 concentrations before and after interventions. |
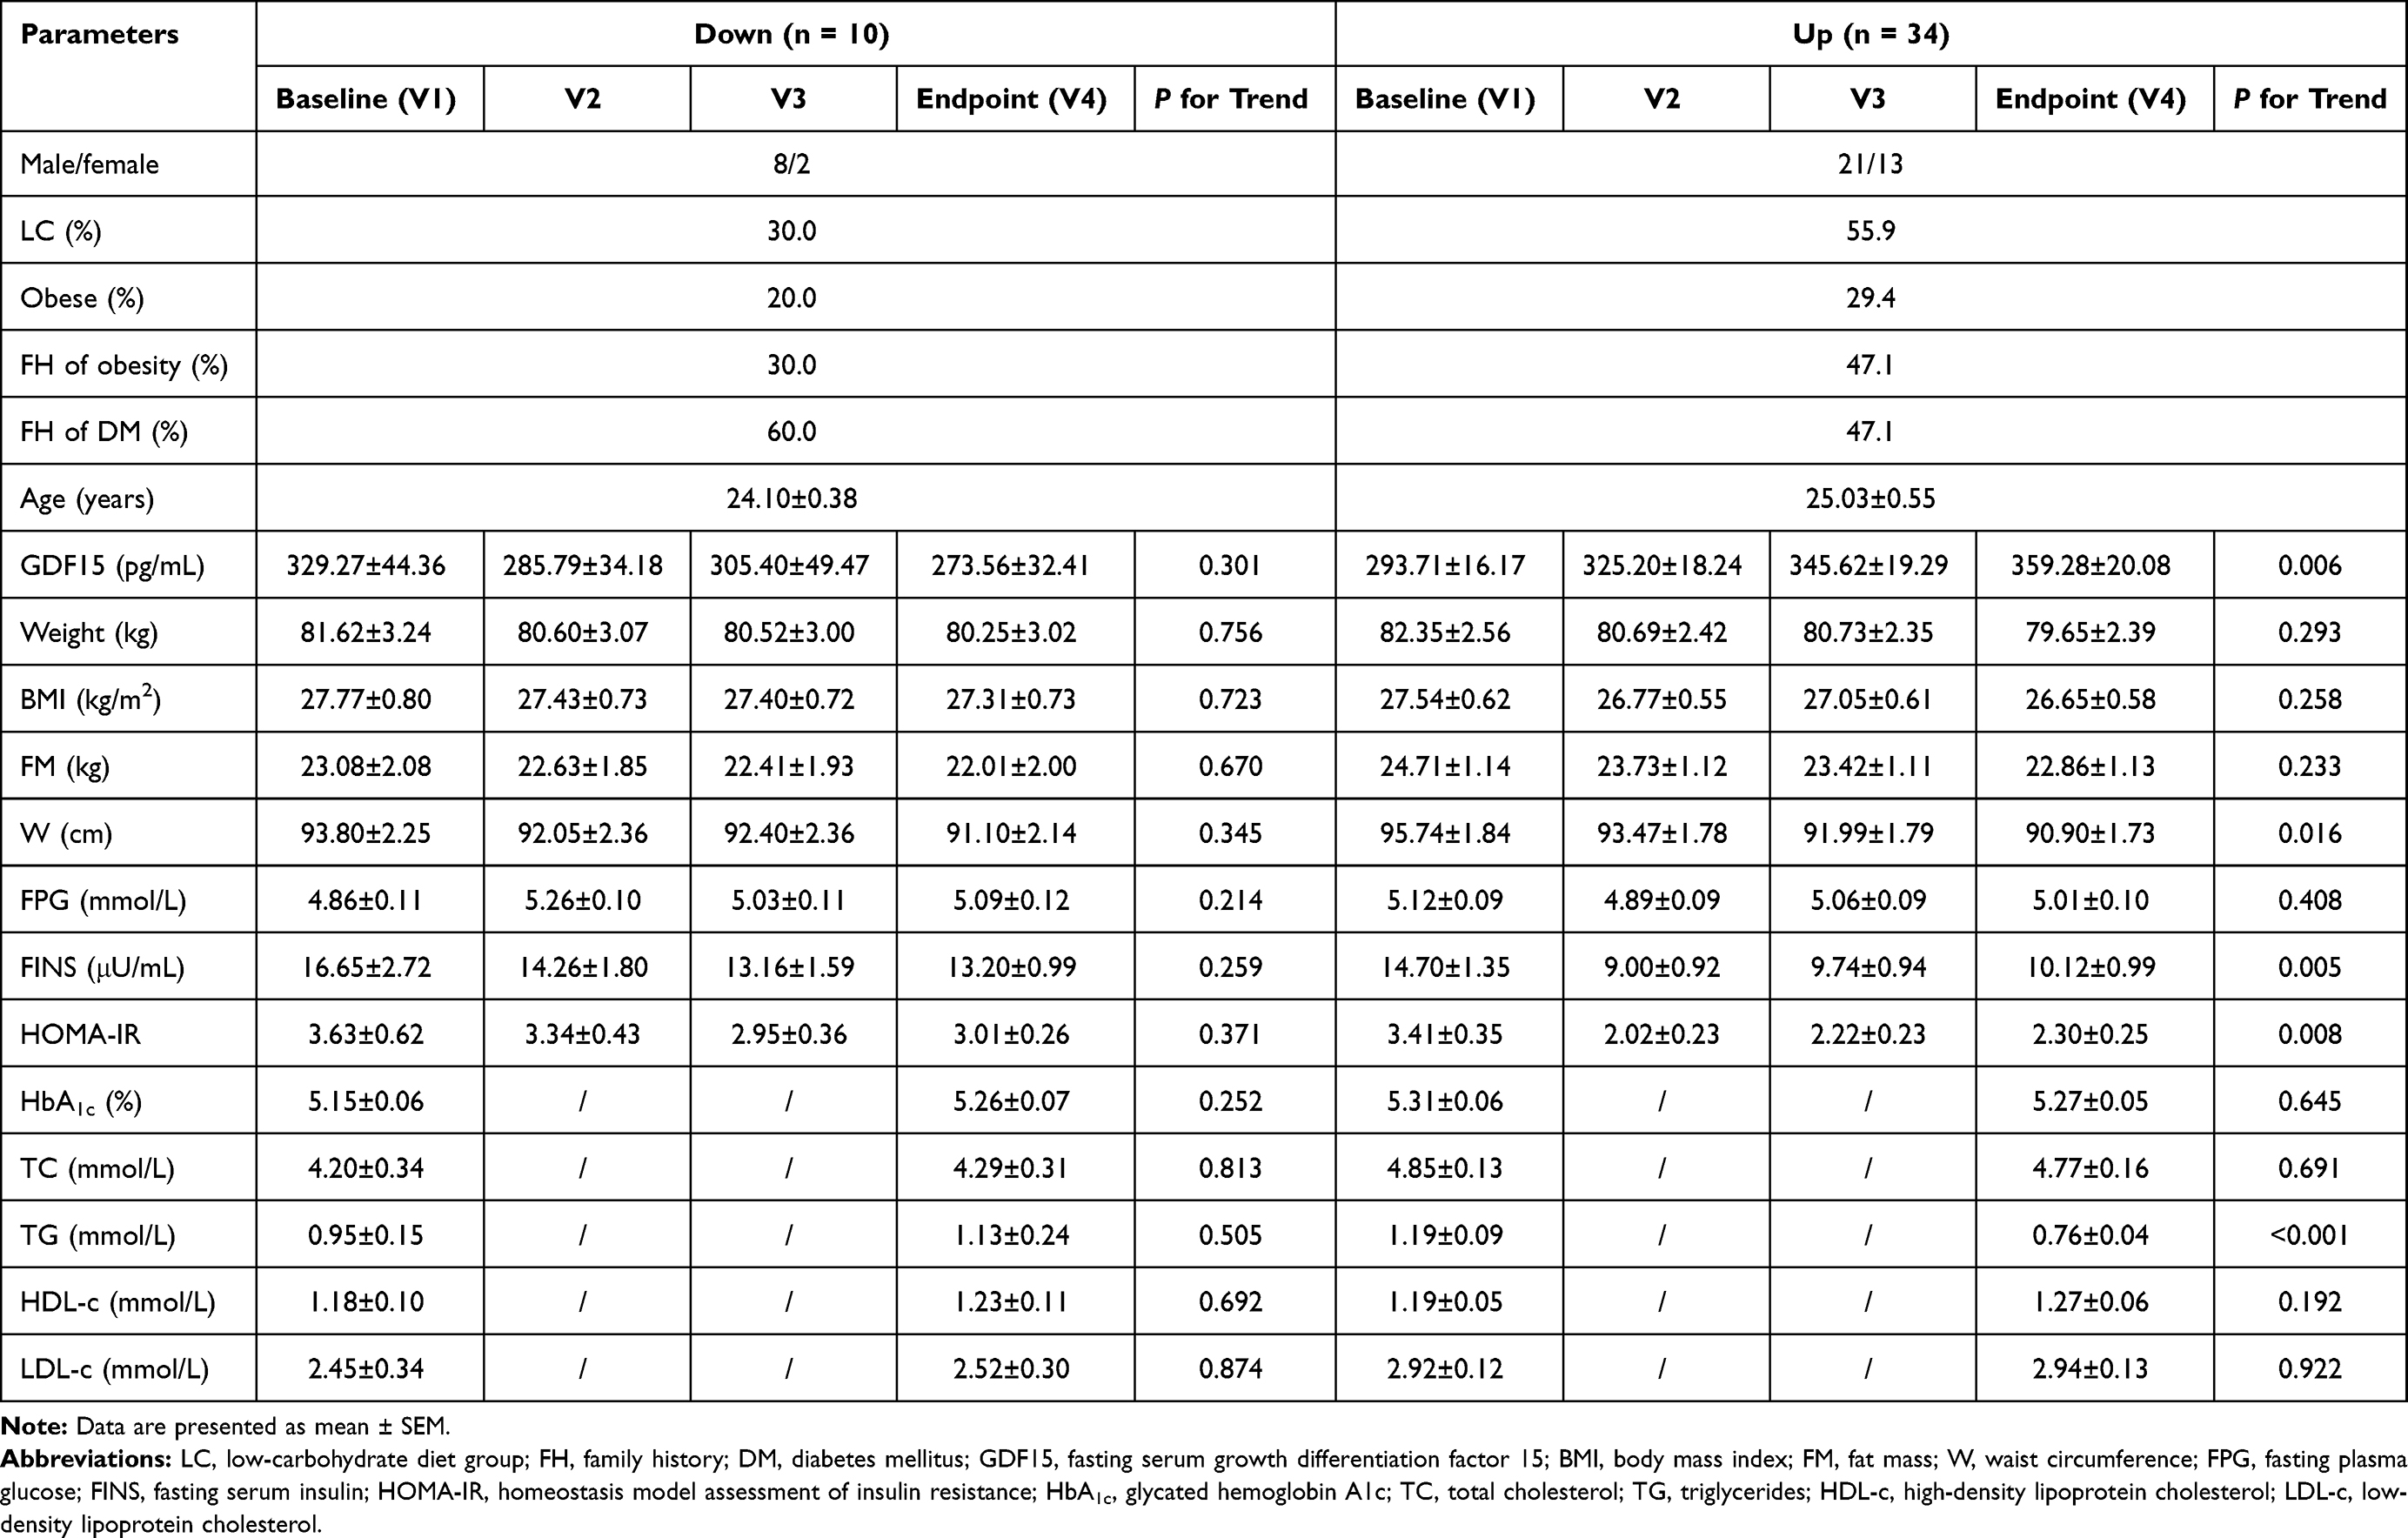 |
Table 3 Parameters During Intervention in Groups of Decreased GDF15 (Down) and Increased GDF15 (Up) |
Discussion
It has been reported that GDF15 is implicated in multiple biological processes, including inflammatory response, oxidative stress and energy homeostasis,11 susceptible to metabolic alternations. Previous studies also found that diets and exercise could affect GDF15 levels,16–18 but no comparative study has been conducted before and the influence of low-carbohydrate diets (LCD) on GDF15 is not clear yet. Patal et al17 found GDF15 levels of obese people were elevated after taking low-calorie meals and reduced during overeating. Furthermore, regular aerobic exercises (12 weeks) increased circulating GDF15 levels in obese people and the elevation in plasma GDF15 was associated with the loss of fat mass.18 Our study first investigated the effect of LCD on serum GDF15 and compared it with the effect of exercise. We found that lifestyle intervention could increase serum GDF15 and the changes of GDF15 had no connection with the means of intervention.
In accordance with the results of the present study, GDF15 was elevated as well in other conditions of weight loss such as anorexia nervosa and bariatric surgery.19–21 The mechanisms underlying the role of GDF15 in metabolic regulation are complicated. Glial cell line-derived neurotrophic factor family receptor α-like (GFRAL) was identified as the neuronal brainstem receptor responsible for mediating the anorectic actions of GDF15.22,23 Besides, GDF15 prevents obesity by increasing the expression of key thermogenic and lipolytic genes to promote thermogenesis, lipolysis and oxidative metabolism.24 Furthermore, GDF15 can mediate its effects by central mechanisms like hypothalamic transforming growth factor-beta receptor II, neuropeptide Y and so on.21 The latest study has revealed that the effects of metformin on body weight and energy balance are also mediated by GDF15.25
We found that lifestyle intervention could increase serum GDF15 in overweight and obese people. A previous study also showed that a two-week very low-calorie diet (VLCD) significantly increased serum GDF15 levels, reduced body weight and improved metabolism in obese people.16 However, they also found that GDF15 in diabetic patients did not change after VLCD in spite of a similar reduction of body weight and metabolic parameters. Therefore, they concluded that increased GDF15 levels in obese patients and diabetic patients do not induce weight loss. In combination with their conclusions and our results, we did not consider the increase of GDF15 as the cause of weight loss or improvement in metabolism. The possible association between them suggested GDF15 as a biomarker to assess the validity of obesity intervention.
The study showed GDF15 slightly descended first and then significantly increased during high glucose load which was contrary to the variation trend of blood glucose and insulin. One study had consistent findings that GDF15 decreased first and increased back to baseline levels at 120 min in OGTT.26 Although Patal17 et al suggested that GDF15 levels were unchanged following glucose ingestion, their data showed circulating GDF15 levels briefly fell at 60 min time point after the mixed meal. This variation trend was also similar to our results. So far studies about the response of GDF15 to glucose load are rare and the exact mechanism remains to be further investigated. Our data suggest whether the acute change of GDF15 under high glucose load or the chronic change after lifestyle intervention, the changes of GDF15 are opposite to that of glucose and insulin. Moreover, the increase of GDF15 may be associated with improved metabolism and the relationship was independent of weight loss since body weight remained stable during OGTT.
This study has some limitations. First, the study period was relatively short so that the evaluation of metabolic levels and cytokines might be inadequate. Additionally, it was a single-center open study with a small sample size. Therefore, further long-term large-scale randomized clinical trials are needed to explore the relation among GDF15, obesity and metabolism.
Conclusion
In summary, this study found increased serum GDF15 was associated with improvement in metabolism by lifestyle intervention among young overweight and obese adults. The increase of GDF15 could be an indicator to evaluate metabolic improvements in overweight and obese people.
Abbreviations
CRP, c-reactive protein; DM, diabetes mellitus; EX, exercise group; FH, family history; FINS, fasting serum insulin; FM, fat mass; FPG, fasting plasma glucose; GDF15, growth differentiation factor 15; GDF150min, fasting serum growth differentiation factor 15; GDF1530min, 30-min serum growth differentiation factor 15; GDF15120min, 120-min serum growth differentiation factor 15; HbA1c, glycated hemoglobin A1c; HDL-c, high-density lipoprotein cholesterol; HOMA-IR, homeostasis model assessment of insulin resistance; INS0min, fasting serum insulin; INS30min, 30-min serum insulin; INS120min, 120-min serum insulin; LC, low-carbohydrate diet group; LCD, low-carbohydrate diet; LDL-c, low-density lipoprotein cholesterol; OGTT, oral glucose tolerance test; PG0min, fasting plasma glucose; PG30min, 30-min plasma glucose; PG120min, 120-min plasma glucose; TC, total cholesterol; TG, triglycerides; W, waist circumference.
Data Sharing Statement
Data used or analyzed in the study are available from the corresponding author Dr. Xiaojing Ma upon reasonable request.
Acknowledgments
The authors are grateful to all the participants in the study.
Author Contributions
All the authors have made a significant contribution to the study in the conception, study design, execution, acquisition of data, analysis and interpretation. All the authors took part in drafting, revising or critically reviewing the article. And all the authors gave final approval of the version to be published and agree to be accountable for all aspects of the work.
Funding
The authors are grateful to all the participants in the study. This study was supported by the Shanghai Municipal Education Commission—Gaofeng Clinical Medicine Grant Support (20172025) and the National Natural Science Foundation of China (82070885).
Disclosure
The authors declared no conflict of interest.
References
1. Bray GA, Frühbeck G, Ryan DH, Wilding JP. Management of obesity. Lancet. 2016;387(10031):1947–1956. doi:10.1016/S0140-6736(16)00271-3
2. Fock KM, Khoo J. Diet and exercise in management of obesity and overweight. J Gastroenterol Hepatol. 2013;28(suppl 4):59–63. doi:10.1111/jgh.12407
3. Hens W, Vissers D, Hansen D, et al. The effect of diet or exercise on ectopic adiposity in children and adolescents with obesity: a systematic review and meta-analysis. Obes Rev. 2017;18(11):1310–1322. doi:10.1111/obr.12577
4. Cao H. Adipocytokines in obesity and metabolic disease. J Endocrinol. 2014;220(2):T47–T59. doi:10.1530/JOE-13-0339
5. Kang YE, Kim JM, Joung KH, et al. The roles of adipokines, proinflammatory cytokines, and adipose tissue macrophages in obesity-associated insulin resistance in modest obesity and early metabolic dysfunction. PLoS One. 2016;11(4):e0154003. doi:10.1371/journal.pone.0154003
6. Borges MD, Franca EL, Fujimori M, et al. Relationship between proinflammatory cytokines/chemokines and adipokines in serum of young adults with obesity. Endocr Metab Immune Disord Drug Targets. 2018;18(3):260–267. doi:10.2174/1871530318666180131094733
7. Schmidt FM, Weschenfelder J, Sander C, et al. Inflammatory cytokines in general and central obesity and modulating effects of physical activity. PLoS One. 2015;10(3):e0121971. doi:10.1371/journal.pone.0121971
8. Coppack SW. Pro-inflammatory cytokines and adipose tissue. Proc Nutr Soc. 2001;60(3):349–356. doi:10.1079/PNS2001110
9. Giugliano D, Ceriello A, Esposito K. The effects of diet on inflammation: emphasis on the metabolic syndrome. J Am Coll Cardiol. 2006;48(4):677–685. doi:10.1016/j.jacc.2006.03.052
10. Petersen AM, Pedersen BK. The anti-inflammatory effect of exercise. J Appl Physiol. 2005;98(4):1154–1162. doi:10.1152/japplphysiol.00164.2004
11. Fairlie WD, Moore AG, Bauskin AR, Russell PK, Zhangn HR, Breit SN. MIC-1 is a novel TGF-β superfamily cytokine associated with macrophage activation. J Leukocyte Biology. 1999;65(1):2–5. doi:10.1002/jlb.65.1.2
12. Ding Q, Mracek T, Gonzalez-Muniesa P, et al. Identification of macrophage inhibitory cytokine-l in adipose tissue and its secretion as an adipokine by human adipocytes. Endocrinology. 2009;150(4):1688–1696. doi:10.1210/en.2008-0952
13. Tran T, Yang J, Gardner J, Xiong Y. GDF15 deficiency promotes high fat diet-induced obesity in mice. PLoS One. 2018;13(8):e0201584. doi:10.1371/journal.pone.0201584
14. Jia W, Weng J, Zhu D, et al. Standards of medical care for type 2 diabetes in China 2019. Diabetes Metab Res Rev. 2019;35(6):e3158. doi:10.1002/dmrr.3158
15. American Diabetes Association. Diagnosis and Classification of Diabetes Mellitus. Diabetes Care. 2010;33(Supplement_1):S62–S69. doi:10.2337/dc10-S062
16. Dostálová I, Roubícek T, Bártlová M, et al. Increased serum concentrations of macrophage inhibitory cytokine-1 in patients with obesity and type 2 diabetes mellitus: the influence of very low calorie diet. Eur J Endocrinol. 2009;161(3):397–404. doi:10.1530/EJE-09-0417
17. Patel S, Alvarez-Guaita A, Melvin A, et al. GDF15 provides an endocrine signal of nutritional stress in mice and humans. Cell Metab. 2019;29(3):707–18.e8. doi:10.1016/j.cmet.2018.12.016
18. Zhang H, Fealy CE, Kirwan JP. Exercise training promotes a GDF15-associated reduction in fat mass in older adults with obesity. Am J Physiol Endocrinol Metab. 2019;316(5):E829–E836. doi:10.1152/ajpendo.00439.2018
19. Tsai VW, Lin S, Brown DA, Salis A, Breit SN. Anorexia-cachexia and obesity treatment may be two sides of the same coin: role of the TGF-b superfamily cytokine MIC-1/GDF15. Int J Obes. 2016;40(2):193–197. doi:10.1038/ijo.2015.242
20. Kleinert M, Bojsen-Møller KN, Jørgensen NB, et al. Effect of bariatric surgery on plasma GDF15 in humans. Am J Physiol Endocrinol Metab. 2019;316(4):E615–E621. doi:10.1152/ajpendo.00010.2019
21. Johnen H, Lin S, Kuffner T, et al. Tumor-induced anorexia and weight loss are mediated by the TGF-beta superfamily cytokine MIC-1. Nat Med. 2007;13(11):1333–1340. doi:10.1038/nm1677
22. Emmerson PJ, Wang F, Du Y, et al. The metabolic effects of GDF15 are mediated by the orphan receptor GFRAL. Nat Med. 2017;23(10):1215–1219. doi:10.1038/nm.4393
23. Tsai VWW, Husaini Y, Sainsbury A, Brown DA, Breit SN. The MIC-1/GDF15-GFRAL Pathway in energy homeostasis: implications for obesity, cachexia, and other associated diseases. Cell Metab. 2018;28(3):353–368. doi:10.1016/j.cmet.2018.07.018
24. Chrysovergis K, Wang X, Kosak J, et al. NAG-1/GDF15 prevents obesity by increasing thermogenesis, lipolysis and oxidative metabolism. Int J Obes. 2014;38(12):1555–1564. doi:10.1038/ijo.2014.27
25. Coll AP, Chen M, Taskar P, et al. GDF15 mediates the effects of metformin on body weight and energy balance. Nature. 2020;578(7795):444–448. doi:10.1038/s41586-019-1911-y
26. Schernthaner-Reiter MH, Kasses D, Tugendsam C, et al. Growth differentiation factor 15 increases following oral glucose ingestion: effect of meal composition and obesity. Eur J Endocrinol. 2016;175(6):623–631. doi:10.1530/EJE-16-0550
 © 2021 The Author(s). This work is published and licensed by Dove Medical Press Limited. The full terms of this license are available at https://www.dovepress.com/terms.php and incorporate the Creative Commons Attribution - Non Commercial (unported, v3.0) License.
By accessing the work you hereby accept the Terms. Non-commercial uses of the work are permitted without any further permission from Dove Medical Press Limited, provided the work is properly attributed. For permission for commercial use of this work, please see paragraphs 4.2 and 5 of our Terms.
© 2021 The Author(s). This work is published and licensed by Dove Medical Press Limited. The full terms of this license are available at https://www.dovepress.com/terms.php and incorporate the Creative Commons Attribution - Non Commercial (unported, v3.0) License.
By accessing the work you hereby accept the Terms. Non-commercial uses of the work are permitted without any further permission from Dove Medical Press Limited, provided the work is properly attributed. For permission for commercial use of this work, please see paragraphs 4.2 and 5 of our Terms.