")
Back to Journals » International Journal of Nanomedicine » Volume 11
Incorporation of heparin-binding proteins into preformed dextran sulfate-chitosan nanoparticles
Authors Zaman P, Wang J, Blau A, Wang W , Li T, Kohane DS, Loscalzo J , Zhang YY
Received 6 August 2016
Accepted for publication 15 September 2016
Published 18 November 2016 Volume 2016:11 Pages 6149—6159
DOI https://doi.org/10.2147/IJN.S119174
Checked for plagiarism Yes
Review by Single anonymous peer review
Peer reviewer comments 2
Editor who approved publication: Dr Thomas Webster
Paula Zaman,1 Julia Wang,1 Adam Blau,1 Weiping Wang,2 Tina Li,1 Daniel S Kohane,2 Joseph Loscalzo,1 Ying-Yi Zhang1
1Department of Medicine, Brigham and Women’s Hospital, 2Department of Anesthesiology, Boston Children’s Hospital, Harvard Medical School, Boston, MA, USA
Abstract: Incorporation of proteins into dextran sulfate (DS)-chitosan (CS) nanoparticles (DSCS NPs) is commonly performed using entrapment procedures, in which protein molecules are mixed with DS and CS until particle formation occurs. As DS is an analog of heparin, the authors examined whether proteins could be directly incorporated into preformed DSCS NPs through a heparin binding domain-mediated interaction. The authors formulated negatively-charged DSCS NPs, and quantified the amount of charged DS in the outer shell of the particles. The authors then mixed the DSCS NPs with heparin-binding proteins (SDF-1α, VEGF, FGF-2, BMP-2, or lysozyme) to achieve incorporation. Data show that for DSCS NPs containing 100 nmol charged glucose sulfate units in DS, up to ~1.5 nmol of monomeric or ~0.75 nmol of dimeric heparin-binding proteins were incorporated without significantly altering the size or zeta potential of the particles. Incorporation efficiencies of these proteins were 95%–100%. In contrast, serum albumin or serum globulin showed minimal incorporation (8% and 4%, respectively) in 50% physiological saline, despite their large adsorption in water (80% and 92%, respectively). The NP-incorporated SDF-1α and VEGF exhibited full activity and sustained thermal stability. An in vivo aerosolization study showed that NP-incorporated SDF-1α persisted in rat lungs for 72 h (~34% remaining), while free SDF-1α was no longer detectable after 16 h. As many growth factors and cytokines contain heparin-binding sites/domains, incorporation into preformed DSCS NPs could facilitate in vivo applications of these proteins.
Keywords: polyelectrolyte complex, polysaccharide, glycan, glycosaminoglycan
Introduction
Therapeutic proteins are increasingly used in the clinical setting; their highly specific and uniquely complex functions are beyond the capabilities of small drug molecules.1 However, owing to the lengthy process of production, therapeutic proteins are often limited in supply and high in cost. Proteins are also prone to inactivation, denaturation, and degradation. Improving their in vitro stability and in vivo half-life is essential for clinical applications.2
Compared with other nanoparticle (NP) systems, dextran sulfate (DS)-chitosan (CS) NPs (DSCS NPs) are particularly useful for protein delivery. DS and CS are derivatives of natural glycans and are completely water soluble. Formation of DSCS NPs occurs in water via charge-charge interactions, which pose minimal risk for denaturation or inactivation of the incorporated proteins. Additionally, binding to DS or CS in the matrix of NPs provides dynamic immobilization and protection of the incorporated proteins. In fact, DSCS NP-incorporated peptides/proteins have been previously shown to exhibit enhanced stability and/or sustained in vivo effects/retention.3–10
The current DSCS NP system, however, has some drawbacks. The most critical of these limitations is the instability of the NPs in physiological saline (0.15 M NaCl), since the structure of particles is based on electrostatic interactions. Additionally, although proteins can be incorporated into DSCS NPs, the efficiency of incorporation has been less than desirable. This limitation is related to the particle preparation procedure (an entrapment procedure), which requires that proteins are mixed with DS and CS from the beginning and stirred together until particle formation. Since only a fraction of the initial DS and CS forms particles, the remainder is washed away at the end of the preparation, taking along with them the bound, but unincorporated, proteins. In the authors previous studies, the incorporation efficiency of VEGF and SDF-1α was 40% and 80%, respectively.9,10 These efficiencies are not so low compared to many other techniques, but are impractical for therapeutic proteins owing to their extreme costs.
To solve these issues, the authors sought to separate the processes of DSCS NP preparation and protein incorporation. Preparation of DSCS NPs without proteins would allow chemical modifications of the NPs to reinforce their salt resistance. Direct incorporation of proteins into preformed DSCS NPs would prevent their loss during particle synthesis. Nevertheless, questions remained as to whether proteins can be efficiently incorporated into the preformed NPs and whether the incorporation affects the colloidal stability of the particles leading to their aggregation/precipitation.
The outer shell of negatively charged DSCS NPs comprises un-neutralized or charged DS, which is an analog of heparin.11 Proteins that contain a heparin-binding site/domain are known to have high affinity interactions with heparin or heparan sulfate.12,13 The authors, therefore, hypothesized that these proteins could be efficiently incorporated into preformed DSCS NPs. There are more than 435 heparin-binding proteins in humans,14 including many growth factors and cytokines. The authors chose five such proteins for this study whose three-dimensional structures and/or interactions with heparin have been well documented. This knowledge helped the authors to understand the stoichiometric loading capacity of preformed DSCS NPs and its consequence on the colloidal stability of the particles.
Materials and methods
Dextran sulfate sodium salt, weight-average molecular weight (MW) 500 kDa, was purchased from Thermo Fisher Scientific. Chitosan (MW range 50–190 kDa, 75%–85% deacetylated) (#448869), zinc sulfate, mannitol, Azure A chloride (#861049), and lysozyme (from chicken egg white) were obtained from Sigma-Aldrich. Cibacron brilliant red 3B-A (#sc-214719) was purchased from Santa Cruz Biotechnology. UltraPure DNase/RNase-free distilled water was obtained from Thermo Fisher Scientific. Recombinant human SDF-1α and VEGF165 were prepared in the authors laboratory as previously described.9,10 Recombinant human FGF-2 and BMP-2 were purchased from PeproTech. Bovine serum albumin (BSA) was purchased from EMD Millipore. Goat gamma globulin was obtained from Jackson ImmunoResearch Laboratories. SDF-1α enzyme-linked immunosorbent assay (ELISA) kit (Human CXCL12/SDF-1α DuoSet) was purchased from R&D Systems.
Preparation of DSCS NPs
DSCS NPs were prepared in a total volume of 1.2–300 mL in this study. For a 300 mL preparation, 150 mL DS (1 mg/mL in H2O) was stirred at 700 rpm and mixed with 37.5 mL CS (1 mg/mL) for 15 min. CS was prepared by dissolving in 0.2% acetic acid/H2O, filtering through 0.8, 0.45, and 0.2 μm SFCA membranes consecutively, and adjusting the pH to 5.3 with 2N NaOH. The stirring speed was then increased to 800 rpm, and 5.8 mL 200 mM ZnSO4 was added at 1 mL/min through a syringe pump. The mixture was stirred for another 60 min before the addition of 100 mL 15% mannitol. The DSCS NPs were precipitated by centrifugation at 20,000× g for 20 min. The particle pellets were washed twice with 70 mL water and centrifuged at 30,000× g for 40 min. The final particles were suspended in 12 mL 5% mannitol, divided into 0.5 mL aliquots, frozen at −80°C, and lyophilized for 3 days. The dried particles were stored desiccated at 4°C until use.
Particle size and zeta potential analysis
A DelsaNano C Particle Analyzer (Beckman) was used for the particle analysis following procedures described previously.15 Briefly, 10–15 μL particle samples were diluted in 0.5 or 2.5 mL water for size or zeta potential measurement, respectively. Standard operating procedures of the instrument were followed. Autocorrelation functions were analyzed by the Contin algorithm, and particle diameters were presented as cumulants. Zeta potentials were calculated from electrophoretic mobility using Smoluchowski approximation.
Azure A assay
Azure A was dissolved in water at 1 mg/mL as a stock solution (stored at 4°C), and diluted to 0.02 mg/mL in water as a working solution. For spectrophotometric analysis, 2 mL Azure A working solution was added to a polystyrene cuvette and mixed with 20 μL DS solution. Measurements were made within 15 min of mixing. To determine DS concentration in a 96-well plate, 10 μL DS standards (made with DS sodium salt) or NP samples (in the form of NP dispersion, diluted with water) in a concentration range of 0–0.20 mg/mL were added to plate wells. Azure A working solution (200 μL) was added next, followed by mixing on a plate shaker for 2 min. Absorbance was read at 620 nm. Samples were run in triplicate, and empty wells were used as the instrument blank.
Incorporation of proteins into DSCS NPs
Prior to protein incorporation, aliquots of lyophilized DSCS NPs were reconstituted with water and centrifuged at 20,000× g for 15 min to remove ultrafine particles. Pellets were resuspended in 2.5% mannitol, and an Azure A assay was performed to determine the amount of charged DS in the NPs. (Ultrafine particles could have contributed to 10%–15% of charged DS in the lyophilized particles. Thus, it was necessary to confirm the charged DS content with the Azure A assay after centrifugation.) Incorporation reactions were carried out by diluting specified amounts of DSCS NP and protein in water, 50% phosphate-buffered saline (PBS), or otherwise noted buffer solutions, and adding protein solution slowly to NPs while stirring at 800 rpm. Total reaction volume was 0.3 mL or in some cases 0.15 mL which were placed in a 2 mL glass vial with a 1.5×8 mm2 stir bar, or a 1.5 mL tube with a 3×3 mm2 stir bar, respectively. The mixture was stirred at 300 rpm for another 20 min. After the incorporation reactions, NPs were separated from unincorporated protein by centrifugation at 21,000× g for 20 min. Supernatants were collected and pellets were resuspended in 2.5% mannitol to their original volume. Equal volumes of supernatants and pellets were loaded on a 4%–20% sodium dodecyl sulfate (SDS) gel for electrophoresis. Gels were stained with Coomassie blue, and protein bands were quantified by densitometric analysis as previously described using BioRad ImageLab software.15
Migration assay
A cell migration assay was carried out to measure the chemotactic activity of SDF-1α using Costar polycarbonate Transwell inserts (pore size 5 μm, diameter 6.5 mm, Costar # 3421). SDF-1α was diluted in 0.6 mL of migration medium [RPMI-1640 medium containing 0.5% BSA (Sigma # A9576)] and added to wells in a 24-well plate (“bottom wells”). Transwell inserts (“top wells”) were placed into the bottom wells and loaded with 5×10⁵ Jurkat cells suspended in 100 μL migration medium. After 2 h incubation at 37°C, cells that transmigrated into the bottom well were mixed and counted with a BD Accuri C6 flow cytometer (BD Biosciences). Each sample was counted twice at a preset flow rate (14 μL/min for 10 μL). For negative controls, the cells were added to the top wells with no SDF-1α in the bottom wells. For the input cell number, cells were added directly to the bottom well and counted. Migration was calculated as a percentage of the input cell number after subtraction of the numbers in negative controls.
Endothelial cell proliferation assay
This assay was used to determine the activity of VEGF, for which a previously described procedure was followed.9 Human pulmonary artery endothelial cells (originally purchased from Lonza) were used for the assay, and a Cell Proliferation Assay kit, CellTiter 96, was used for estimation of cell proliferation.
Intratracheal aerosolization and analysis of lung tissue for SDF-1α content
Male Sprague Dawley rats weighing 200–225 g were purchased from Charles River Laboratories, and were acclimated for 4 days in the authors animal facility. Animal studies were performed according to protocols approved by the Harvard Medical Area Standing Committee on Animals.
Intratracheal aerosolization of SDF-1α or SDFNPs as well as the analysis of SDF-1α content in the lung was performed according to a previously described procedure.10 Briefly, SDF-1α or SDFNPs containing 12 μg SDF-1α were diluted in 50% PBS to a volume of 0.25 mL and aerosolized into rat lungs with a MicroSprayer Aerosolizer from Penn-Century. At 0, 16, 48, and 72 h after aerosolization, rat lung tissue was harvested and frozen in liquid nitrogen. The tissue was homogenized, and the total protein concentration in the homogenate supernatants was determined by the bicinchoninic acid (BCA) protein assay. Supernatant SDF-1α concentrations were determined by ELISA using reagents from R&D systems following the manufacturer’s instructions.
Results and discussion
Preparation of DSCS NPs
For the purpose of protein incorporation, DSCS NPs were prepared in large batches, lyophilized in small aliquots, stored as dry powder, and reconstituted prior to protein incorporation (for details, see “Materials and methods”). A number of formulations were examined in order to obtain small, negatively charged, and stable colloidal DSCS NPs. The concentrations of DS and CS solutions were found to be optimal when each of them were prepared at 1 mg/mL and mixed at a volume ratio of 4:1 (DS:CS). Zinc sulfate and mannitol were found to be necessary for the colloidal stability of the particles undergoing lyophilization. The concentration requirements for these two reagents are described in the subsequent paragraphs.
The effect of mannitol on the stability of DSCS NPs during lyophilization is shown in Figure 1. In the absence of mannitol, DSCS NPs became heavily aggregated after lyophilization. In the presence of 0.3%–5% mannitol, both the size and polydispersity index of the particles were gradually decreased. The concentration effect plateaued at 2.5%–5%, and 5% mannitol was chosen for the following DSCS NP preparation.
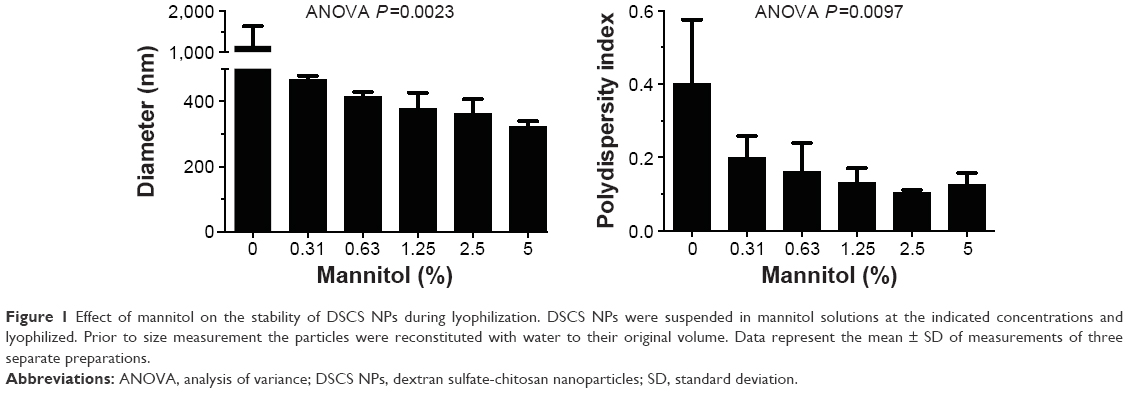 | Figure 1 Effect of mannitol on the stability of DSCS NPs during lyophilization. DSCS NPs were suspended in mannitol solutions at the indicated concentrations and lyophilized. Prior to size measurement the particles were reconstituted with water to their original volume. Data represent the mean ± SD of measurements of three separate preparations. |
The effect of zinc concentration on particle size is shown in Figure 2. Increasing zinc concentration from 0 to 20 mM led to a particle size decrease prior to lyophilization but increase after lyophilization. In both cases, however, the polydispersity indices of the particles were decreased with increasing zinc concentrations. A zinc sulfate concentration of 6 mM was chosen for the following DSCS NP preparation.
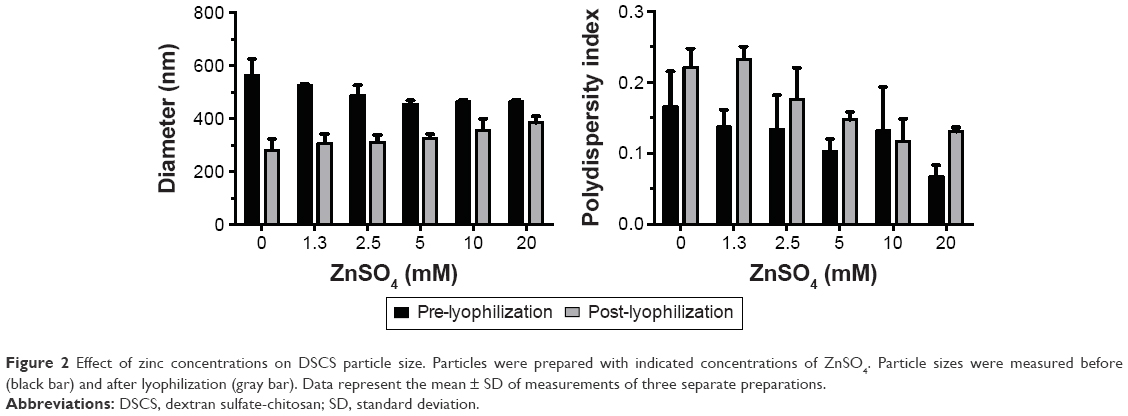 | Figure 2 Effect of zinc concentrations on DSCS particle size. Particles were prepared with indicated concentrations of ZnSO4. Particle sizes were measured before (black bar) and after lyophilization (gray bar). Data represent the mean ± SD of measurements of three separate preparations. |
Lyophilization reduced the overall size of the particles; however, the polydispersity indices of the particles were increased (Figure 2). The latter reflected an increase in heterogeneity of the particles, likely resulting from the generation of ultrafine particles during the lyophilization process. To separate this portion from the rest of the particles, centrifugation (21,000× g for 20 min) was carried out after reconstitution of lyophilized DSCS NPs and the resulting supernatant was discarded. The parameters of the finally formulated particles are shown in Table 1.
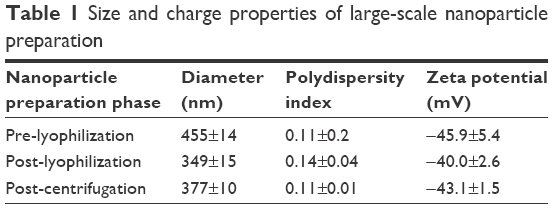 | Table 1 Size and charge properties of large-scale nanoparticle preparation |
Quantification of un-neutralized DS in DSCS NPs
To determine the amount of charged DS in DSCS NPs, an Azure A metachromatic assay was used. This assay has been previously established to measure concentrations of DS16 and heparin17 in solutions. Azure A interacts with charged and clustered sulfate groups in polymers (polysulfate group), but not neutralized or individual sulfate ions. The absorption spectra of Azure A after interacting with DS solutions are shown in Figure 3A. For the measurement of charged DS in DSCS NPs, absorbance at 620 nm was used and the assay was carried out in a 96-well plate. A typical standard curve is shown in Figure 3B, using standards made with DS sodium salt at concentrations from 0.04 to 0.2 mg/mL.
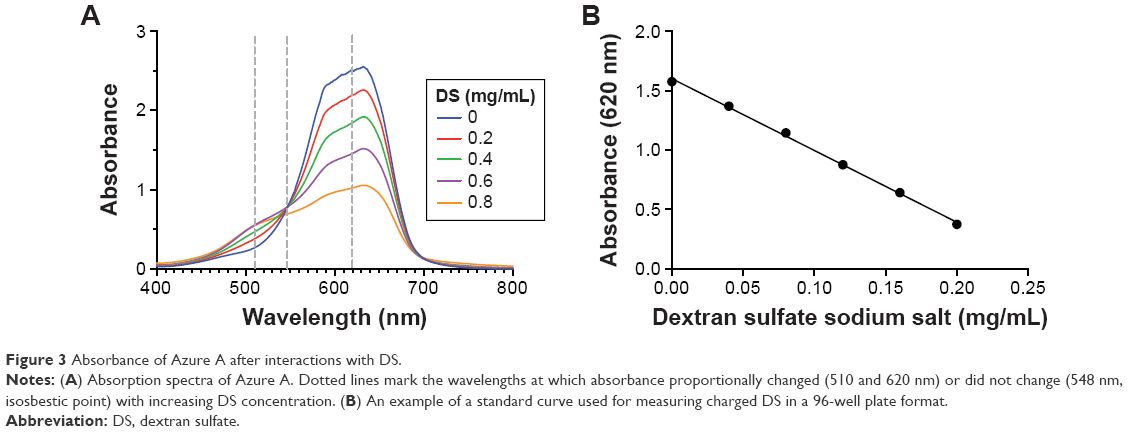 | Figure 3 Absorbance of Azure A after interactions with DS. |
To confirm that Azure A assay detects charged DS within DSCS NPs, the assay was carried out to measure DS concentration from each step of particle preparation using aliquots taken from the preparation mixture (in the form of colloidal dispersion). The results are shown in Table 2. The Azure A-detected amount of DS decreased by ~20% after addition of CS to DS in the first step of NP preparation. This reduction was correlated to the neutralization of DS sulfate groups by CS, which can be calculated as follows: the molar mass of a glucose sulfate unit in DS (sulfur content 17%) is ~397 g/mol assuming a glucose unit (molar mass =180 g/mol) with 2.3 sodium sulfate substitutions ([23+97–18] × 2.3=235) and one glycosidic bond (ignoring 5% branching) (−18); and the molar mass of a glucosamine unit in CS (80% deacetylated) is 169 g/mol, assuming 0.8 glucosamine unit (179 × 0.8=143), 0.2 N-acetylglucosamine unit (221 × 0.2=44), and one glycosidic bond (−18). At the weight ratio of DS to CS of 4:1, the ratio of saccharide units in DS and CS is 1:0.59. Each unit has on average 2.3 negative charges in DS and 0.8 positive charges in CS. Thus, the total charge ratio between DS and CS is ~2.3:0.47 (5:1). When neutralized, charged DS would comprise ~80% of total. This change remained after zinc sulfate and mannitol addition, indicating that the particle structure itself did not affect the detectability of its charged DS by Azure A. The Cibacron brilliant red 3B-A colorimetric assay,18,19 which measures charged CS, was also performed on the aliquots. (Note that the pH of CS solution and DS-CS mixture was 5.3 and 5.5, respectively, at which pH CS should be protonated as the pKa of CS is ~6.5). No CS was detected by the assay after mixing CS with DS in particle preparation, indicating complete neutralization of CS.
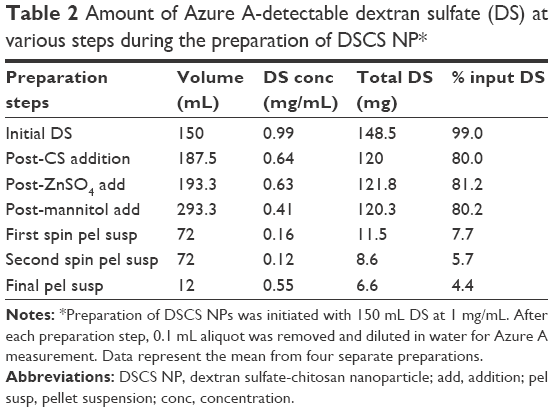 | Table 2 Amount of Azure A-detectable dextran sulfate (DS) at various steps during the preparation of DSCS NP* |
Table 2 also shows that the total yield of the DSCS NPs from this preparation is low: only 4.4% of the original amount of charged DS was found in the final DSCS NP preparation. A large amount of DS was detected in the supernatant fraction of the first centrifugation, which was discarded after separation from the particles.
Incorporation of heparin-binding proteins into preformed DSCS NPs
Heparin-binding proteins are defined by their high affinity for heparin, which is commonly demonstrated by binding the proteins to heparin-Sepharose resin in ≥0.15 M NaCl. Many proteins, especially those mediating intercellular signaling, fall into this category.14 The biological ligands of most of these proteins are heparan sulfate or sulfated glycosaminoglycans, which are present on the cell surface and in the extracellular matrix. A heparin-binding site or domain in the primary or tertiary structure of the proteins is responsible for heparin binding, which often includes a cluster of positively charged amino acid residues (Lys, Arg, and His) that bind to heparin through electrostatic interaction.12,13 As DS is an analog of heparin,11 heparin-binding proteins will likely bind to negatively charged DSCS NPs. Nevertheless, excessive binding could cause NP aggregation owing to charge neutralization.
The authors first examined incorporation of SDF-1α into DSCS NPs. SDF-1α is a chemokine and an important stem cell homing factor.20–22 It has a distinct heparin-binding site,23,24 exists mainly as a monomer in solution, but forms a dimer upon binding to heparin.24,25 The incorporation reaction was carried out by mixing SDF-1α with DSCS NPs at various ratios, followed by a centrifugation to separate unincorporated SDF-1α from DSCS NPs. The amount of SDF-1α in pellet and supernatant fractions was analyzed on SDS gels. Figure 4A shows that for reactions carried out in water (pH 6), the particle size and zeta potential were not significantly altered at SDF-1α ratios between 1.3 and1.9 nmol per 100 nmol charged glucose sulfate units in DSCS NPs. Beyond this point, the particles were markedly aggregated. Alkaline pH (pH 8) allowed some more SDF-1α loading (up to 2.5 nmol per 100 nmol charged glucose sulfate units in DSCS NPs) before inducing aggregation. SDF-1α binding (as a dimer) has been known to occupy 12–14 saccharide units in heparin.24 The aforementioned loading limit of DSCS NP (in average ~1.5 nmol SDF-1α/100 nmol charged glucose sulfate units in DSCS NP) suggests that less than 10% of total charged DS can be occupied before affecting NP stability. Incorporation efficiency was 92%–100% at all SDF-1α loading amounts tested (1–3 nmol/100 nmol charged saccharide units) (Figure 4B), which was greater than that obtained previously using an entrapment method (66%–80%).10
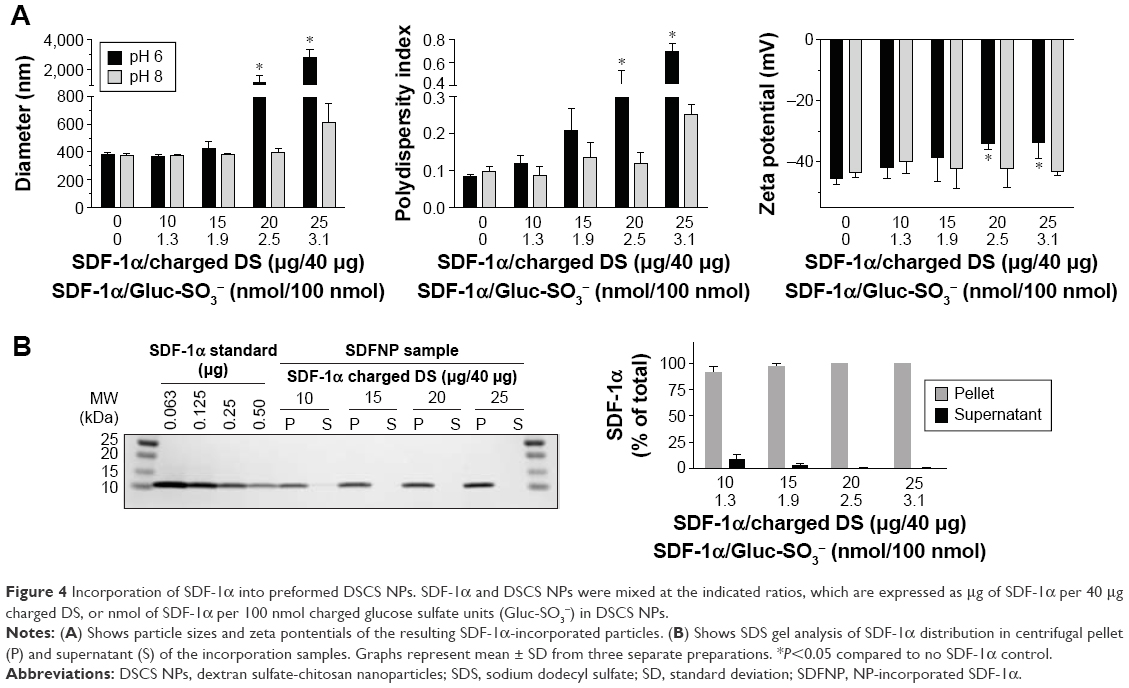 | Figure 4 Incorporation of SDF-1α into preformed DSCS NPs. SDF-1α and DSCS NPs were mixed at the indicated ratios, which are expressed as μg of SDF-1α per 40 μg charged DS, or nmol of SDF-1α per 100 nmol charged glucose sulfate units (Gluc-SO3−) in DSCS NPs. |
Incorporation of VEGF to DSCS NPs was next examined. VEGF is an important growth factor involved in angiogenesis and vasculogenesis.26 It is a disulfide-linked homodimer containing two heparin-binding domains located at the carboxyl-terminus of each monomer,27 and together they occupy 14 saccharide units upon heparin binding.28,29 The result of VEGF incorporation is shown in Figure 5. The maximal loading of VEGF without significantly affecting the size and zeta potential of the particles was 0.63–1 nmol VEGF per 100 nmol charged glucose sulfate units in DSCS NPs (Figure 5A). Similar to that found with SDF-1α, the loading limit of VEGF suggested that less than 10% charged glucose sulfate units in DSCS NPs can be occupied without affecting the stability of the NPs. The incorporation efficiency was 96%–100% at all tested VEGF loading amounts (0.25–2 nmol/100 nmol charged saccharide units) (Figure 5B), which is greater than that achieved by an entrapment method, which were ~40% or 50%–80% from two separate studies.5,9
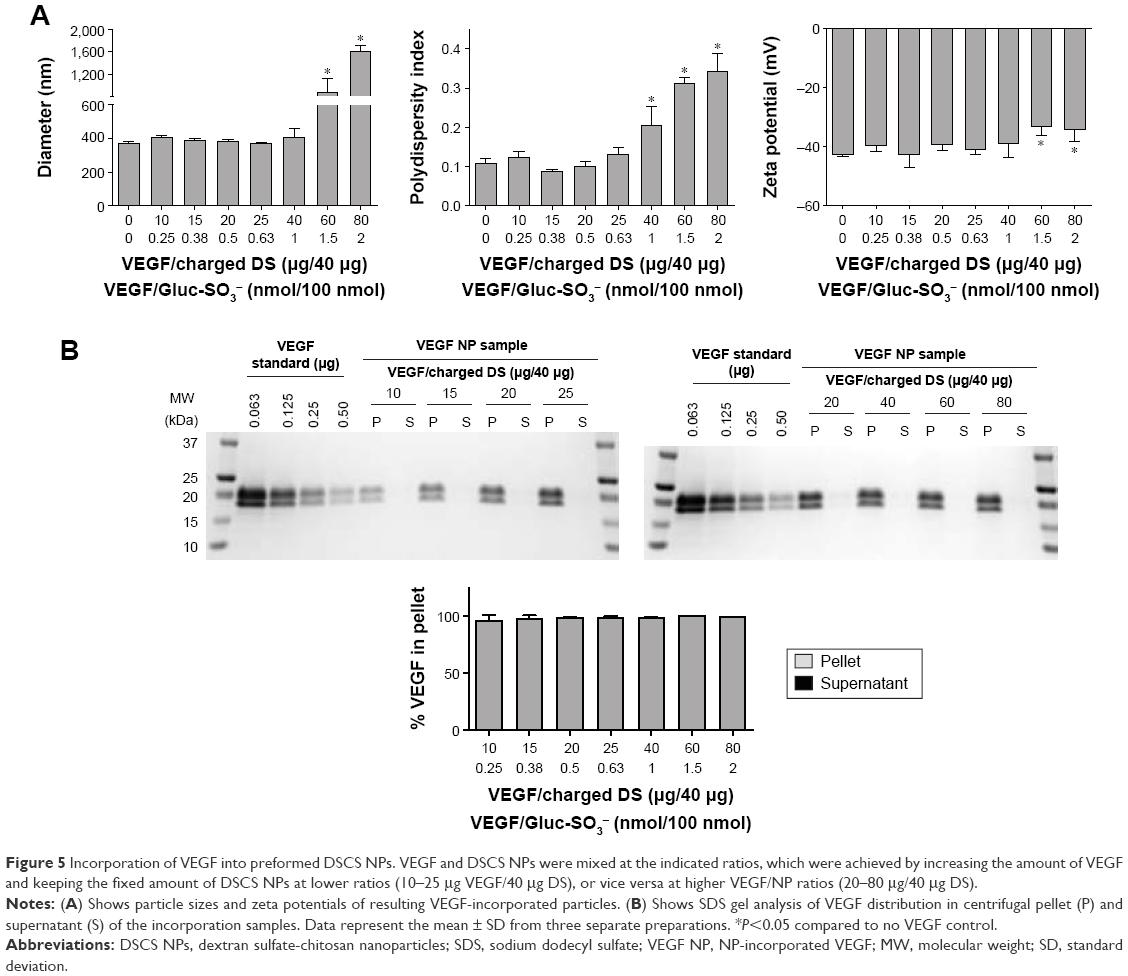 | Figure 5 Incorporation of VEGF into preformed DSCS NPs. VEGF and DSCS NPs were mixed at the indicated ratios, which were achieved by increasing the amount of VEGF and keeping the fixed amount of DSCS NPs at lower ratios (10–25 μg VEGF/40 μg DS), or vice versa at higher VEGF/NP ratios (20–80 μg/40 μg DS). |
Albumin and globulins are the most abundant proteins in blood. As proteins can adsorb to the surfaces of various inorganic/organic materials, the authors examined the adsorption of these proteins to preformed DSCS NPs. In this study, 50 μg of BSA (0.75 nmol) or goat gamma globulin (0.42 nmol) were mixed with DSCS NPs (containing 100 nmol charged glucose sulfate units) in water or 50% PBS. As shown in Figure 6, significant amounts of BSA and gamma globulin were adsorbed to DSCS NPs when mixed in water (80% and 92%, respectively), while only 8% and 4% adsorbed, respectively, when mixed in 50% PBS. In contrast, incorporations of SDF-1α and VEGF to DSCS NPs were not affected by 50% PBS (Figure 6). Owing to the instability of DSCS NPs in salt solutions, 100% PBS could not be used in this test.
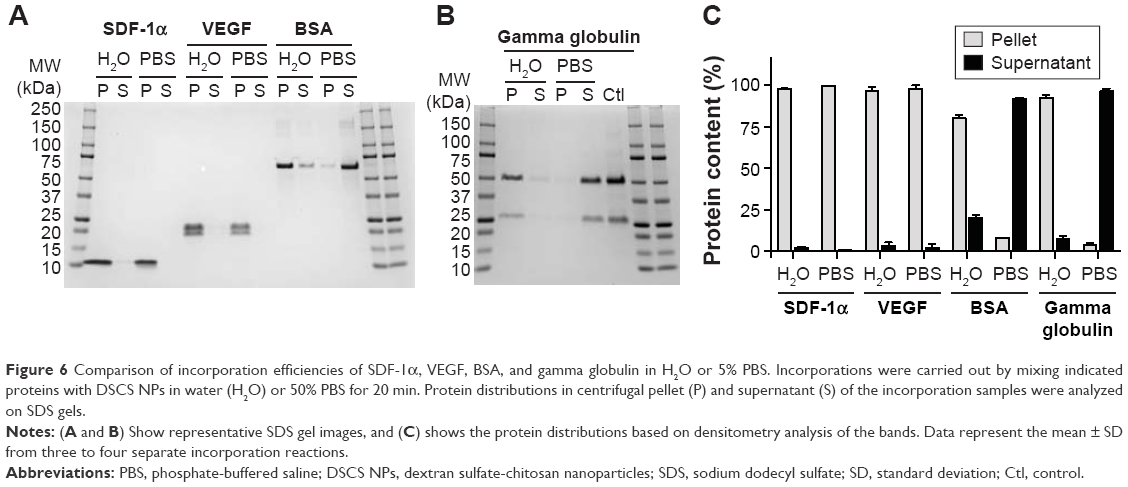 | Figure 6 Comparison of incorporation efficiencies of SDF-1α, VEGF, BSA, and gamma globulin in H2O or 5% PBS. Incorporations were carried out by mixing indicated proteins with DSCS NPs in water (H2O) or 50% PBS for 20 min. Protein distributions in centrifugal pellet (P) and supernatant (S) of the incorporation samples were analyzed on SDS gels. |
Incorporation of other heparin-binding proteins was briefly studied to confirm their loading ratios to DSCS NPs. Human FGF-2 is a monomeric protein that forms a dimer upon binding to heparin.30–32 Human BMP-2, by contrast, is a disulfide-linked homodimeric heparin-binding protein.33,34 Egg white lysozyme is a monomeric heparin-binding protein,35,36 which is also present in human milk. Purified lysozyme could be obtained from commercial sources in relatively large quantity and low cost. Incorporation of each protein was examined at two different loading ratios. For FGF-2 and lysozyme, the ratios were 1 or 2 nmol protein per 100 nmol charged glucose sulfate units in DSCS NPs; for BMP-2, the ratios were reduced to half, as BMP-2 is a dimer. As shown in Table 3, incorporation efficiencies of these proteins in 50% PBS were between 95% and 100%. Size and zeta potential of DSCS NPs were not significantly changed except for that of FGF-2-incorporated DSCS NPs at a protein-to-charged glucose sulfate unit ratio 2:100. Together with the findings from SDF-1α and VEGF incorporation, the maximum loading of heparin-binding proteins to DSCS NPs was ~1.5 nmol for monomeric proteins or 0.75 nmol for dimeric proteins per 100 nmol charged glucose sulfate units in DSCS NP.
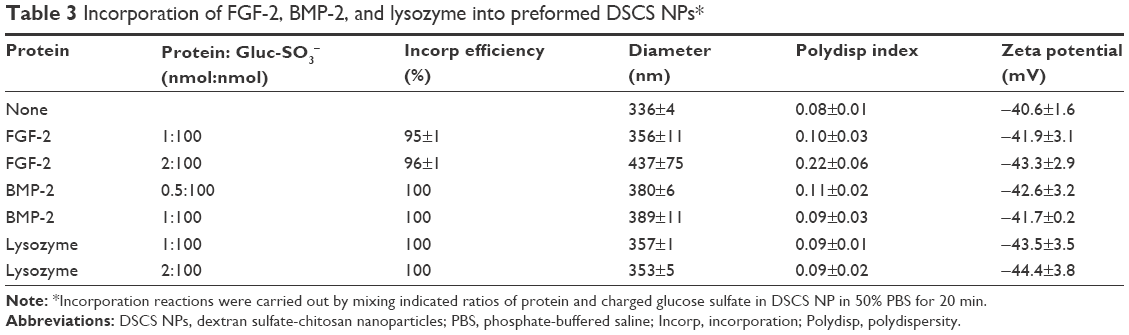 | Table 3 Incorporation of FGF-2, BMP-2, and lysozyme into preformed DSCS NPs* |
Activity and stability of NP-incorporated SDF-1α (SDFNP) and VEGF
To examine the chemotactic activity of SDFNP, a Jurkat cell migration assay was carried out. Free SDF-1α and SDFNP were diluted to 1 or 3 ng/mL for measurements. As shown in Figure 7A, at both SDF-1α concentrations analyzed, SDFNP exhibited similar or slightly greater migration activities compared to those of SDF-1α, indicating that the NP incorporation did not block the chemotactic activity of SDF-1α. The slightly greater activity of SDFNP at 1 ng/mL was perhaps a consequence of a protective effect of NP binding as the protein was extremely diluted. This phenomenon was also observed with the VEGF activity assay at the 1 ng/mL dose. It should be noted that the chemotactic activity exerted by SDFNP was from NP-bound SDF-1α rather than the free (released) protein. The authors have previously reported that only 3% of SDF-1α was released from SDFNP after 7 days of incubation at 37°C in 50% PBS,10 which was confirmed in this study (data not shown). The NP-bound SDF-1α was able to compete with free form of SDF-1α in the migration assay, and bind to its receptor (CXCR4) on Jurkat cells in the NP form.10
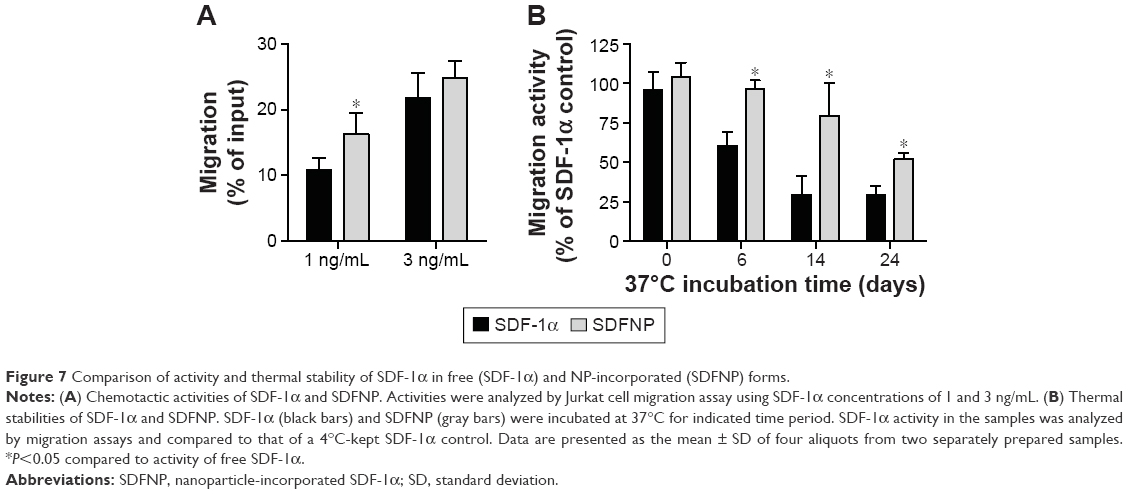 | Figure 7 Comparison of activity and thermal stability of SDF-1α in free (SDF-1α) and NP-incorporated (SDFNP) forms. |
To determine thermal stability, SDF-1α and SDFNP were diluted in 2.5% mannitol and incubated at 37°C for up to 24 days. Aliquots were removed at various time points and analyzed with migration assays. As shown in Figure 7B, after 6,14, and 24 days incubation at 37°C, SDF-1α activity was 61%±9%, 29%±12%, and 29%±5%, respectively, while those of SDFNP were 96%±5%, 80%±20%, and 52%±4%, respectively. Thus, SDF-1α thermal stability was improved by incorporation into DSCS NPs. No previous report has examined the thermal stability of SDF-1α; however, studies have shown that binding to heparin protects SDF-1α from protease degradation.37,38
VEGF activity was examined by an endothelial cell proliferation assay. As shown in Figure 8A, NP-incorporated VEGF (VEGF NP) had similar activity to VEGF, which was consistent with a previous finding using VEGF NP made by an entrapment method.9 To compare thermal stability between VEGF and VEGF NPs, samples were incubated at 37°C for up to 20 days. The activities of the samples were analyzed at several incubation times, and compared with a VEGF stock (control) kept at 4°C. The activities of the samples at day 13 and day 20 incubations are shown in Figure 8B and C. Results show that both VEGF and VEGF NP retained full activity after incubation at 37°C for 20 days, indicating that the free form of VEGF is unusually thermally stable and the 20-day incubation at 37°C did not differ in the stability between VEGF and VEGF NP. This result is consistent with previous studies using a differential scanning calorimetry method to determine the thermal stability of VEGF.5,39 The studies found that VEGF has an unusually high melting temperature of 107°C or 108°C,5,39 indicating a very high thermal stability. VEGF NP further increases the melting temperature to over 115°C,5 indicating that the thermal stability of VEGF was further enhanced by incorporation into DSCS NPs.
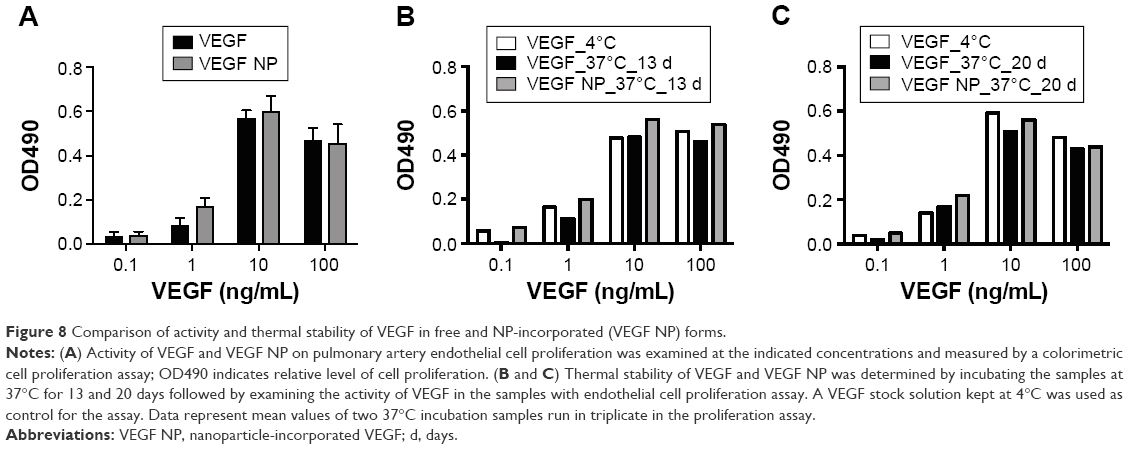 | Figure 8 Comparison of activity and thermal stability of VEGF in free and NP-incorporated (VEGF NP) forms. |
In vivo retention time of SDFNP
To determine the in vivo retention time, SDF-1α or SDFNP were aerosolized into rat lungs. Lung tissue was harvested at various periods of time after delivery, and examined for SDF-1α content by ELISA. As shown in Figure 9, SDF-1α content in the lung tissue given the free form of SDF-1α was nearly undetectable 16 h after aerosolization (~2% remaining), but remained detectable in the lungs which received SDFNP at 100%, 76%, and 34% of initial values at 16 h, 48 h, and 72 h after delivery, respectively. This retention time pattern was similar to the SDFNPs made previously by the entrapment method.10
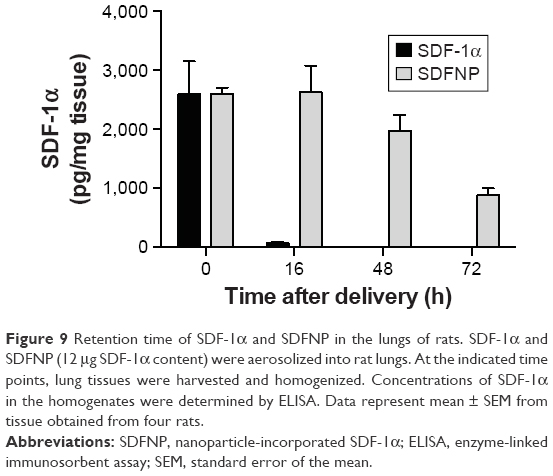 | Figure 9 Retention time of SDF-1α and SDFNP in the lungs of rats. SDF-1α and SDFNP (12 μg SDF-1α content) were aerosolized into rat lungs. At the indicated time points, lung tissues were harvested and homogenized. Concentrations of SDF-1α in the homogenates were determined by ELISA. Data represent mean ± SEM from tissue obtained from four rats. |
Advantage of the current system over entrapment and adsorption techniques
In the current system, DSCS NPs are prepared in large batches, stored in small aliquots, and quantified by the Azure A assay to determine the final content of charged DS in the NPs. These steps allow the incorporation of the heparin-binding protein to be extremely convenient (a 20 min mixing), highly efficient (95%–100%), and quantitative (the whole mixture can be delivered directly). These advantages are unparalleled by preparations produced by entrapment procedures, which required a 20–24 h processing period owing to the de novo synthesis of particles and partial (limited) incorporation of input proteins (40%–80%). The final amount of protein in the resulting NPs needed to be quantified individually by an SDS gel analysis. Nonspecific adsorptions of proteins to various bio-macromolecules (proteins, nucleotides, polysaccharides, and lipid vesicles) are commonly observed in aqueous solutions without salt. These adsorptions are often disrupted by salt solutions at physiological ionic strength (equivalent to 0.15 M NaCl or saline). Therefore, BSA or gamma globulin had minimal adsorption (4%–8%) to DSCS NPs in the presence of 50% PBS.
Conclusion
In order to incorporate therapeutic proteins into DSCS NPs efficiently, this study examined specific binding-mediated particle incorporation. Heparin-binding proteins were chosen for the incorporation as DS in the outer shell of DSCS NPs is an analog of heparin. A heparin-binding site could also be tagged to a protein during recombinant production to allow the specific binding. An Azure A assay was established to quantify charged DS in the particles; corresponding glucose sulfate units in the DS were calculated to estimate the loading capacity of DSCS NPs. Data show that incorporation efficiencies of heparin-binding proteins (SDF-1α, VEGF, FGF-2, BMP-2, or lysozyme) to preformed DSCS NPs were between 95% and 100%. The size and zeta potential of the NPs were not significantly affected at protein loading conditions up to ~1.5 nmol of monomeric or ~0.75 nmol of dimeric heparin-binding proteins per 100 nmol charged glucose sulfate units in DSCS NPs. In comparison, nonspecific adsorption of BSA or gamma globulin to DSCS NPs showed minimal incorporation in 50% PBS (8% and 4%, respectively) but a substantial incorporation in water (80% and 92%, respectively). Incorporation into DSCS NPs did not interfere with the activities of SDF-1α and VEGF, and enabled greater thermal stability of the proteins. It also markedly extended the in vivo retention time of SDF-1α compared to its free form. These data show that heparin binding domain-mediated specific interaction allows an efficient incorporation of proteins into preformed DSCS NPs. This incorporation provides enhanced in vitro and in vivo stability of the proteins, which could be useful for their various biological applications.
Acknowledgments
This work was supported by the NIH grants HL048743, HL061795, GM107618, and HL108630. The authors thank Neil E Lombardozzi and Stephanie Tribuna for their excellent technical assistance in the preparation of this manuscript.
Disclosure
The authors (YYZ, JL) have submitted an application for a provisional patent based on the information included in this manuscript. The authors report no other conflicts of interest in this work.
References
Leader B, Baca QJ, Golan DE. Protein therapeutics: a summary and pharmacological classification. Nat Rev Drug Discov. 2008;7(1):21–39. | ||
Kontermann RE. Strategies for extended serum half-life of protein therapeutics. Curr Opin Biotechnol. 2011;22(6):868–876. | ||
Chen Y, Siddalingappa B, Chan PH, Benson HA. Development of a chitosan-based nanoparticle formulation for delivery of a hydrophilic hexapeptide, dalargin. Biopolymers. 2008;90(5):663–670. | ||
Sarmento B, Ribeiro A, Veiga F, Ferreira D, Neufeld R. Oral bioavailability of insulin contained in polysaccharide nanoparticles. Biomacromolecules. 2007;8(10):3054–3060. | ||
Huang M, Vitharana SN, Peek LJ, Coop T, Berkland C. Polyelectrolyte complexes stabilize and controllably release vascular endothelial growth factor. Biomacromolecules. 2007;8(5):1607–1614. | ||
Drogoz A, Munier S, Verrier B, David L, Domard A, Delair T. Towards biocompatible vaccine delivery systems: interactions of colloidal PECs based on polysaccharides with HIV-1 p24 antigen. Biomacromolecules. 2008;9(2):583–591. | ||
Huang M, Berkland C. Controlled release of repifermin from polyelectrolyte complexes stimulates endothelial cell proliferation. J Pharm Sci. 2009;98(1):268–280. | ||
Sharma S, Mukkur TK, Benson HA, Chen Y. Enhanced immune response against pertussis toxoid by IgA-loaded chitosan-dextran sulfate nanoparticles. J Pharm Sci. 2012;101(1):233–244. | ||
Lauten EH, VerBerkmoes J, Choi J, et al. Nanoglycan complex formulation extends VEGF retention time in the lung. Biomacromolecules. 2010;11(7):1863–1872. | ||
Yin T, Bader AR, Hou TK, et al. SDF-1alpha in glycan nanoparticles exhibits full activity and reduces pulmonary hypertension in rats. Biomacromolecules. 2013;14(11):4009–4020. | ||
Ricketts CR. Dextran sulphate – a synthetic analogue of heparin. Biochem J. 1952;51(1):129–133. | ||
Xu D, Esko JD. Demystifying heparan sulfate-protein interactions. Annu Rev Biochem. 2014;83:129–157. | ||
Gallagher J. Fell-Muir Lecture: Heparan sulphate and the art of cell regulation: a polymer chain conducts the protein orchestra. Int J Exp Pathol. 2015;96(4):203–231. | ||
Ori A, Wilkinson MC, Fernig DG. A systems biology approach for the investigation of the heparin/heparan sulfate interactome. J Biol Chem. 2011;286(22):19892–19904. | ||
Bader AR, Li T, Wang W, Kohane DS, Loscalzo J, Zhang YY. Preparation and characterization of SDF-1alpha-chitosan-dextran sulfate nanoparticles. J Vis Exp. 2015(95):52323. | ||
Ellis HA, Walton KW. The estimation and recovery of dextran sulphates in biological fluids. J Clin Pathol. 1959;12:467–472. | ||
Grant AC, Linhardt RJ, Fitzgerald GL, Park JJ, Langer R. Metachromatic activity of heparin and heparin fragments. Anal Biochem. 1984;137(1):25–32. | ||
Mendelovits A, Prat T, Gonen Y, Rytwo G. Improved colorimetric determination of chitosan concentrations by dye binding. Appl Spectrosc. 2012;66(8):979–982. | ||
Muzzarelli RA. Colorimetric determination of chitosan. Anal Biochem. 1998;260(2):255–257. | ||
Stebler J, Spieler D, Slanchev K, et al. Primordial germ cell migration in the chick and mouse embryo: the role of the chemokine SDF-1/CXCL12. Dev Biol. 2004;272(2):351–361. | ||
Sharma M, Afrin F, Satija N, Tripathi RP, Gangenahalli GU. Stromal-derived factor-1/CXCR4 signaling: indispensable role in homing and engraftment of hematopoietic stem cells in bone marrow. Stem Cells Dev. 2011;20(6):933–946. | ||
Ghadge SK, Muhlstedt S, Ozcelik C, Bader M. SDF-1alpha as a therapeutic stem cell homing factor in myocardial infarction. Pharmacol Ther. 2011;129(1):97–108. | ||
Amara A, Lorthioir O, Valenzuela A, et al. Stromal cell-derived factor-1alpha associates with heparan sulfates through the first beta-strand of the chemokine. J Biol Chem. 1999;274(34):23916–23925. | ||
Sadir R, Baleux F, Grosdidier A, Imberty A, Lortat-Jacob H. Characterization of the stromal cell-derived factor-1alpha-heparin complex. J Biol Chem. 2001;276(11):8288–8296. | ||
Fermas S, Gonnet F, Sutton A, et al. Sulfated oligosaccharides (heparin and fucoidan) binding and dimerization of stromal cell-derived factor-1 (SDF-1/CXCL 12) are coupled as evidenced by affinity CE-MS analysis. Glycobiology. 2008;18(12):1054–1064. | ||
Ferrara N. Molecular and biological properties of vascular endothelial growth factor. J Mol Med (Berl). 1999;77(7):527–543. | ||
Fairbrother WJ, Champe MA, Christinger HW, Keyt BA, Starovasnik MA. Solution structure of the heparin-binding domain of vascular endothelial growth factor. Structure. 1998;6(5):637–648. | ||
Robinson CJ, Mulloy B, Gallagher JT, Stringer SE. VEGF165-binding sites within heparan sulfate encompass two highly sulfated domains and can be liberated by K5 lyase. J Biol Chem. 2006;281(3):1731–1740. | ||
Zhao W, McCallum SA, Xiao Z, Zhang F, Linhardt RJ. Binding affinities of vascular endothelial growth factor (VEGF) for heparin-derived oligosaccharides. Biosci Rep. 2012;32(1):71–81. | ||
DiGabriele AD, Lax I, Chen DI, et al. Structure of a heparin-linked biologically active dimer of fibroblast growth factor. Nature. 1998;393(6687):812–817. | ||
Faham S, Hileman RE, Fromm JR, Linhardt RJ, Rees DC. Heparin structure and interactions with basic fibroblast growth factor. Science. 1996;271(5252):1116–1120. | ||
Schlessinger J, Plotnikov AN, Ibrahimi OA, et al. Crystal structure of a ternary FGF-FGFR-heparin complex reveals a dual role for heparin in FGFR binding and dimerization. Mol Cell. 2000;6(3):743–750. | ||
Ruppert R, Hoffmann E, Sebald W. Human bone morphogenetic protein 2 contains a heparin-binding site which modifies its biological activity. Eur J Biochem. 1996;237(1):295–302. | ||
Vallejo LF, Rinas U. Folding and dimerization kinetics of bone morphogenetic protein-2, a member of the transforming growth factor-beta family. FEBS J. 2013;280(1):83–92. | ||
Zou S, Magura CE, Hurley WL. Heparin-binding properties of lactoferrin and lysozyme. Comp Biochem Physiol B. 1992;103(4):889–895. | ||
Guyot N, Labas V, Harichaux G, et al. Proteomic analysis of egg white heparin-binding proteins: towards the identification of natural antibacterial molecules. Sci Rep. 2016;6:27974. | ||
Sadir R, Imberty A, Baleux F, Lortat-Jacob H. Heparan sulfate/heparin oligosaccharides protect stromal cell-derived factor-1 (SDF-1)/CXCL12 against proteolysis induced by CD26/dipeptidyl peptidase IV. J Biol Chem. 2004;279(42):43854–43860. | ||
Takekoshi T, Ziarek JJ, Volkman BF, Hwang ST. A locked, dimeric CXCL12 variant effectively inhibits pulmonary metastasis of CXCR4-expressing melanoma cells due to enhanced serum stability. Mol Cancer Ther. 2012;11(11):2516–2525. | ||
Muller YA, Heiring C, Misselwitz R, Welfle K, Welfle H. The cystine knot promotes folding and not thermodynamic stability in vascular endothelial growth factor. J Biol Chem. 2002;277(45):43410–43416. |
 © 2016 The Author(s). This work is published and licensed by Dove Medical Press Limited. The full terms of this license are available at https://www.dovepress.com/terms.php and incorporate the Creative Commons Attribution - Non Commercial (unported, v3.0) License.
By accessing the work you hereby accept the Terms. Non-commercial uses of the work are permitted without any further permission from Dove Medical Press Limited, provided the work is properly attributed. For permission for commercial use of this work, please see paragraphs 4.2 and 5 of our Terms.
© 2016 The Author(s). This work is published and licensed by Dove Medical Press Limited. The full terms of this license are available at https://www.dovepress.com/terms.php and incorporate the Creative Commons Attribution - Non Commercial (unported, v3.0) License.
By accessing the work you hereby accept the Terms. Non-commercial uses of the work are permitted without any further permission from Dove Medical Press Limited, provided the work is properly attributed. For permission for commercial use of this work, please see paragraphs 4.2 and 5 of our Terms.