")
Back to Journals » Clinical Epidemiology » Volume 12
Incidence Rates of Four Major Non-Communicable Chronic Diseases in the Chinese Adult Population from 2007 to 2016: A Study Based on a National Commercial Claims Database
Authors Yang Y, Sun X, Wang J , Yang C, Zhang L
Received 15 November 2019
Accepted for publication 29 January 2020
Published 24 February 2020 Volume 2020:12 Pages 215—222
DOI https://doi.org/10.2147/CLEP.S238804
Checked for plagiarism Yes
Review by Single anonymous peer review
Peer reviewer comments 2
Editor who approved publication: Professor Henrik Sørensen
Yu Yang, 1, 2,* Xiaoyu Sun, 1, 2,* Jinwei Wang, 3 Chao Yang, 3 Luxia Zhang 1–3
1National Institute of Health Data Science, Peking University, Beijing, People’s Republic of China; 2Center for Data Science in Health and Medicine, Peking University, Beijing, People’s Republic of China; 3Renal Division, Department of Medicine, Peking University First Hospital; Peking University Institute of Nephrology; Key Laboratory of Renal Disease, National Health Commission of China; Key Laboratory of Chronic Kidney Disease Prevention and Treatment, Ministry of Education of China, Beijing, People’s Republic of China
*These authors contributed equally to this work
Correspondence: Luxia Zhang
Renal Division, Department of Medicine, Peking University First Hospital; Peking University Institute of Nephrology; Assistant Dean, National Institute of Health Data Science at Peking University, No. 8 Xishiku St, Xicheng District, Beijing 100034, People’s Republic of China
Tel +86-10-83572388
Fax +86-10-66551055
Email [email protected]
Background: The spread of non-communicable chronic diseases (NCDs) is a global crisis. Understanding the dynamics of NCDs at the population level is crucial to develop prevention strategies as well as to evaluate the effectiveness of intervention. However, studies investigating the incidence rate of NCDs among the general population are limited, especially for developing countries like China. We aim to evaluate the incidence rates of four major NCDs from 2007 to 2016, based on a national commercial claims database in China.
Methods: Cancer, stroke, coronary heart disease (CHD) and end-stage kidney disease (ESKD) accounted for over 90% of claims data were included as major NCDs. The definition of the above diseases followed the guideline of disease definitions of critical illness insurance released by the Insurance Association of China. Age-standardized incidence rates (ASRs) of those major NCDs among subgroups of sex, demographic regions, and China city tiers were reported. The trends of incidence rates were described as annual percent change (APC) as well as average annual percent change (AAPC) and were then examined by joinpoint models.
Results: For the population insured in 2007, the average 10-year ASRs of cancer, CHD, stroke, and ESKD were 221.0, 55.5, 43.5, 11.0 per 100,000 person-years, respectively. For males, the ASRs of cancer, CHD, ESKD continuously increase in the past decade with AAPC of 1.4%, 5.2%, and 3.3%; while the ASRs of stroke were decreased with APC of 3.7% after 2009. For females, the increased ASRs of cancer with AAPC of 4.2% and CHD with AAPC of 2.0%; while decreased trends of ASRs were observed for stroke and ESKD. Patterns of ASRs changing varied between different demographic regions and city tiers.
Conclusion: Commercial claims data could be a valuable data source to evaluate the disease burden for major NCDs in China. The disease burden of severe stroke was decreasing while cancer, CHD and ESKD were still increasing in China. More efforts should be put into control of CHD, especially in the northern part of China.
Keywords: non-communicable chronic diseases, incidence rate, claims database, Asian
Introduction
Globally, non-communicable diseases (NCDs) accounted for 71% of all deaths.1 The study commissioned by the World Economic Forum in 2011 concluded that the world would sustain a cumulative output loss of $47 trillion between 2011 and 2030 because of non-communicable diseases.2 Whereas in China, the situation was more serious, with 89% of the countrywide mortality is attributable to NCDs in 2016.3 Along with population growth and ageing, rapid urbanization and changing lifestyles, the burden of serious NCDs will be rising continually.4 Capturing the changing trend of NCDs are essential for the management of healthcare systems and planning and evaluation of health service delivery. However, resources for surveillance of NCDs are somewhat limited in most low- and middle-income countries like China, despite the increasing burden and socioeconomic impact of NCDs.5 A complete picture of the national scale and profile will be particularly useful to direct adequate resources to provide required management and develop specific policies aimed that reducing the burden and suffering from the diseases at the national level.6
Claims data, as a type of real-world data derived from sources outside typical clinical research settings, re widely used for complementing the knowledge gained from traditional clinical researches.7 Claims data are recorded routinely and could support rapid and valuable researches in the medical problem of interest. Researches based on commercial claims data have been published in post-marketing drug surveillance, healthcare utilization, and NCDs surveillance.
In this study, we aim to evaluate the incidence rates of four major NCDs from 2007 to 2016 in China, based on Chinese commercial critical illness insurance database (CCCIID), which includes information of critical illness insurances from six top commercial insurance companies with the market share over 80% in 2007 (see Supplementary material 1).
Materials and Methods
Data Source
The health insurance system in China is composed of basic health insurance and commercial health insurance. Basic health insurance is funded by the government and covers more than 90% of the entire population in China.8 Commercial health insurance usually functions as supplementary insurance to basic health insurance, with critical illness insurance accounting for more than 50% in China.9 Critical illness insurance is a type of life insurance that paid in a lump sum if the insurant is diagnosed with one of the specific critical illnesses on a predetermined list as part of an insurance policy. It has been a rapidly growing sector of business since introduced into the Chinese market in 1995.
Our analyses were based on CCCIID, which included information of critical illness insurances of six top commercial insurance companies (China Life, Ping An, China Pacific, Xinhua, Taikang, China Taiping) with the market share over 80% in 2007 and still over 50% in 2016 (see Supplementary material 1). Sex, age, geographic regions and diagnoses of insurants were documented in CCCIID from 2007 to 2016. Insurants would not be further recorded in CCCIID after reimbursements or exceeding validity period. Reimbursement was triggered by the first diagnosis of critical illnesses listed in the corresponding policy. All diagnoses had been validated through chart review.
The ethical approval of this study was approved to be waived by the institutional review board ethics committee of the Peking University First Hospital (Ethical approval number: 2019–020), because all the data included in this study were anonymous and cannot be used to identify any individual.
Definition of Major NCDs
In 2007, the Insurance Association of China and the Chinese Medical Doctor Association issued a guideline that defines 25 types of critical illnesses (see Supplementary material 2).10 They required that all critical illness insurances sold in China should cover cancer, acute myocardial infarction (AMI), stroke, coronary artery bypass graft (CABG), major organ or hematopoietic stem cells transplantation and end-stage kidney disease (ESKD) needing renal replacement therapy. Although policies sold before 2007 were followed various definitions of critical illnesses of different companies, all the definitions were either same or were only mildly different from definitions in the guideline (see Supplementary material 3). In most cases after 2007, reimbursements follow the coverage both in the guideline and corresponding contracts.
Among all critical illnesses above, cancer, coronary heart disease (CHD, including AMI and CABG), stroke and ESKD accounted for more than 90% of all the claims and were therefore identified as major NCDs in our study. The definitions of those four diseases were described in Supplementary material 4.
Statistical Analysis
Insurants who were recorded from 2007 in CCCIID were defined as the study population. Incidence rates for each major NCDs in this study, with the number of claims as numerator and cumulative follow-up person-years as denominator each year from 2007 to 2016.
The date on which insurants reported a claim was used as the incident date. As claim data were recorded after reimbursement, annually incident cases were adjusted according to the time of lag between claim and reimbursement. All the incidence rates were standardized to the World Health Organization (WHO) standard population.11 Variables including diagnosis, sex, age, regions, and residences were used for analysis in this study. The age was categorized into five intervals (18–29 years, 30–39 years, 40–49 years, 50–59 years, and 60 years or older). Besides geographic regions, the residences were categorized into megacity (first/second-tier city), city (third/fourth-tier city), and rural area.
Trends in age-standardized incidence rates (ASRs) from 2007 to 2016 were examined by fitting the joinpoint model.12,13 Joinpoint Trend Analysis Software (version 4,6.0.0, National Cancer Institute, USA) is a trend analysis software developed by the US National Cancer Institute. It describes changes in data trends by connecting several different line segments on a log scale at “joinpoints.” The program starts with the minimum number of joinpoints (eg, 0 joinpoint, which is a straight line) and tests whether more joinpoints are statistically significant and must be added to the model (up to that maximum number). Monte Carlo permutation method was used to test the significance, P value of <0.05 was considered statistically significant. Annual percent change (APC) for each line segment is tested to determine whether a difference exists from the null hypothesis of no change (0%). In the final model, each joinpoint informs a statistically significant change in trends (increase or decrease), and each of those trends is described by an APC.
The ASRs of cancer were calculated after thyroid cancer was excluded as sensitivity analysis, since thyroid cancer incidence has increased dramatically in many countries in the developed world over the past three decades, especially in females.14–17
The SAS software (version 9.4, SAS Institute Inc., Cary, NC, USA) and Joinpoint software were used in the study.
Results
As shown in Table 1, 31.4 million person-years of insurants were recorded in the CCCIID in 2007. Female insurants slightly outnumbered male insurants (53.5% vs 46.5%). The majority of insurants (67.4%) aged 30–49 years in 2007. Regarding geographical distribution, insurants who dwelled in east China (34.0%) contributed the largest person-years. In addition, most insurances were sold in city area (48.9%). Until 2016, the average 10-year ASRs of cancer, CHD, stroke and ESKD were 221.0, 55.5, 43.5, 11.0 per 100,000 person-years, respectively.
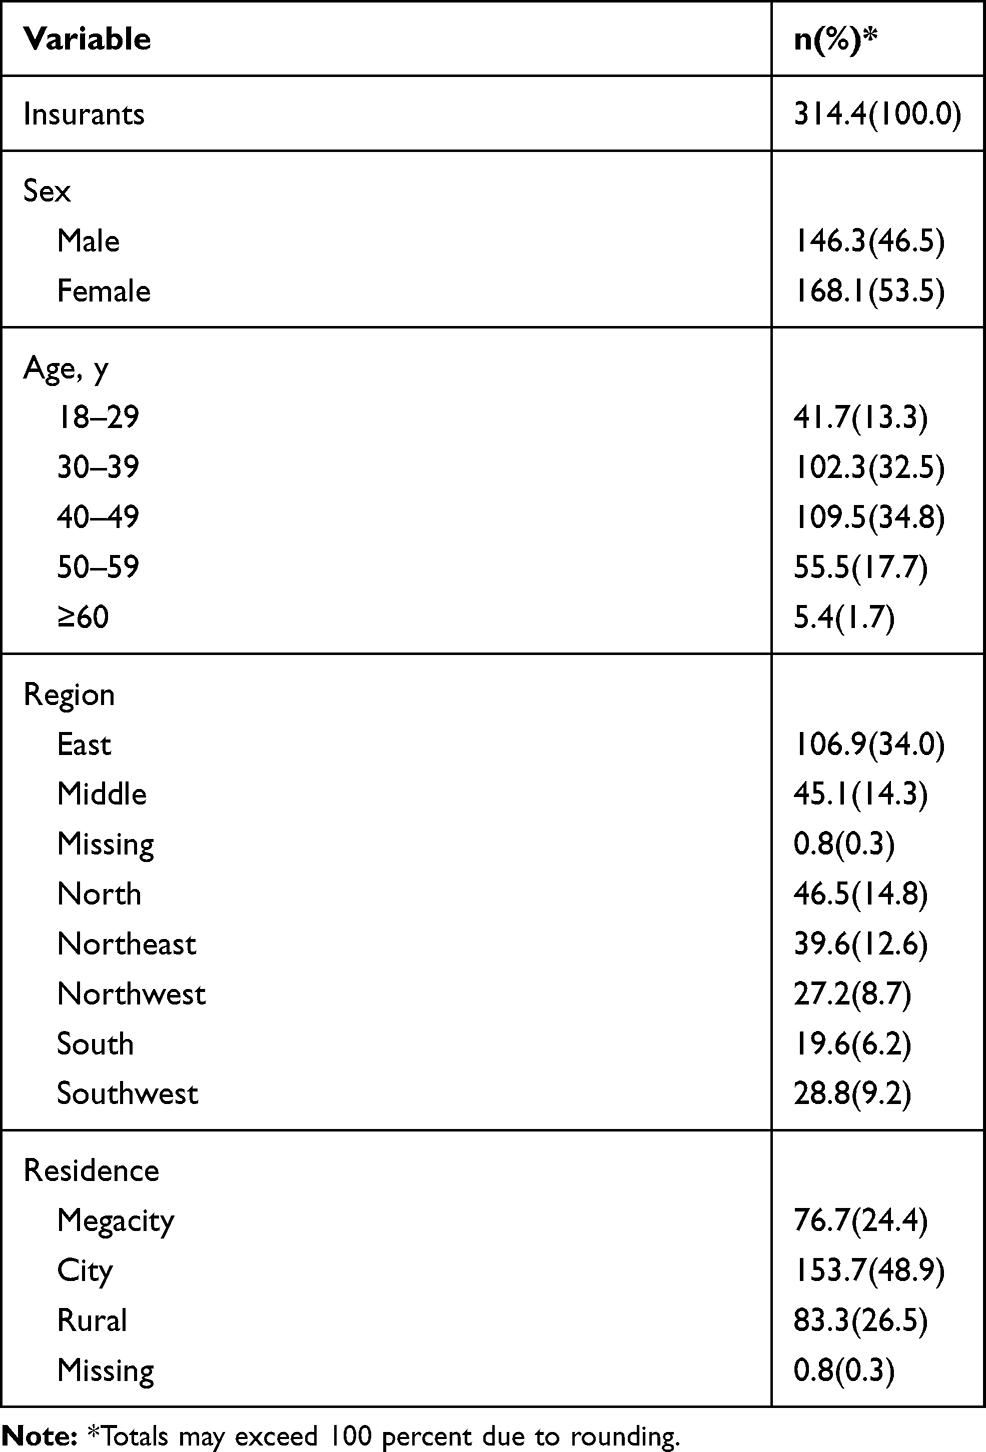 |
Table 1 Demographic Characteristics of Insurants as Recorded in the CCCIID at 2007 (100,000 Person-Years) |
Trends of ASRs by Sex from 2007 to 2016
The upward trends regarding the ASRs of cancer and CHD in both males and females were observed from 2007 to 2016 (P<0.05). After 2009, there was a downward trend of ASRs of stroke in both males and females (P<0.05). An upward trend of ASRs of ESKD was observed in the male population from 2007 to 2014 following a downward after that (P<0.05). Among females, there was an increase in ASRs of ESKD after 2010, but there was no significant difference (Table 2, Figure 1).
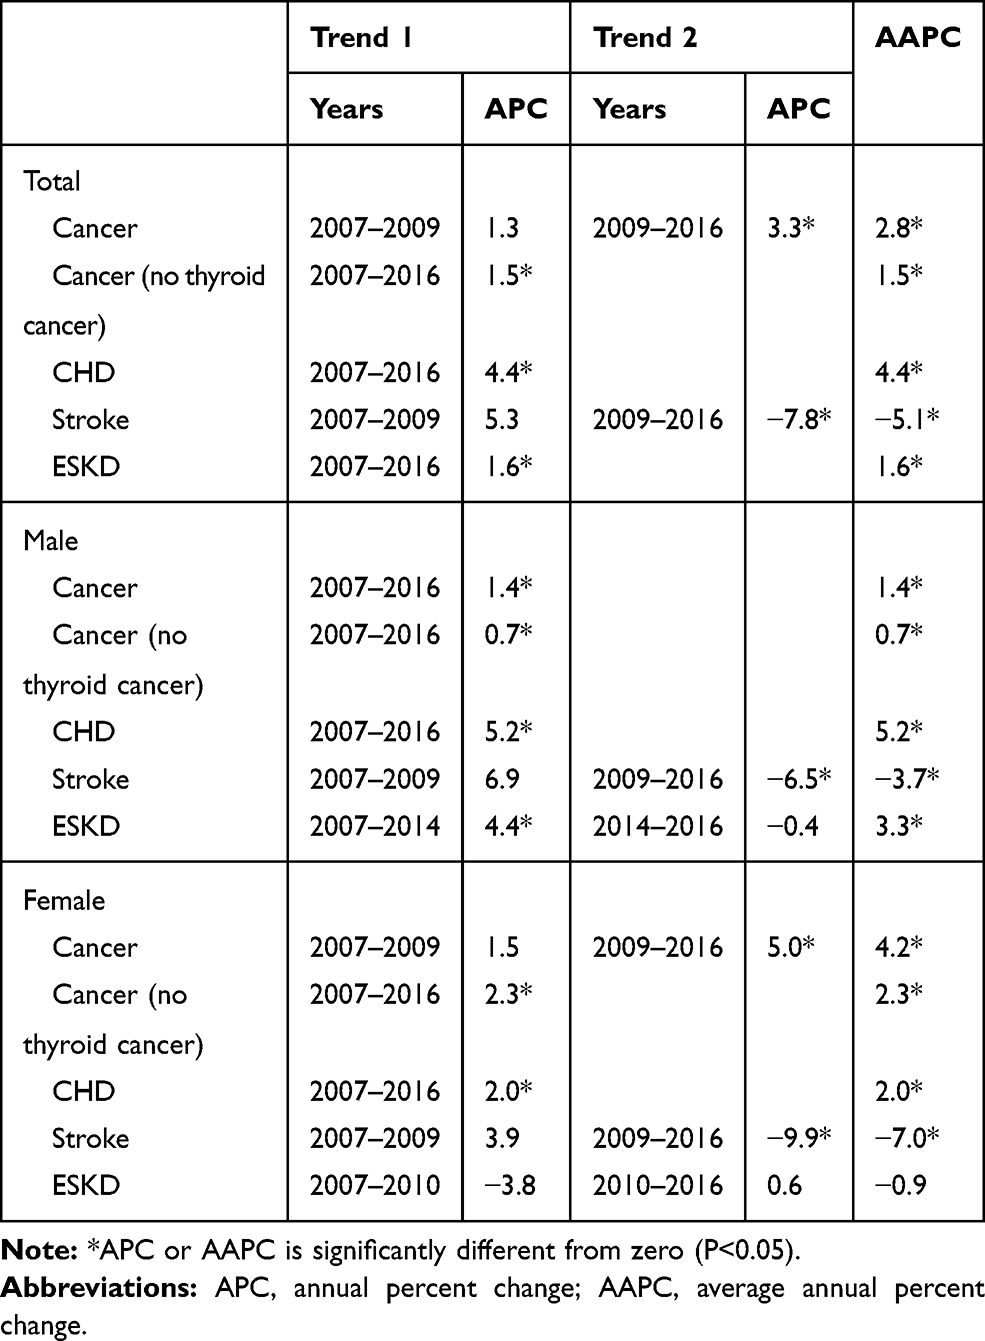 |
Table 2 Trends in ASRs of the Four Major NCDs According to Sex from 2007 to 2016 |
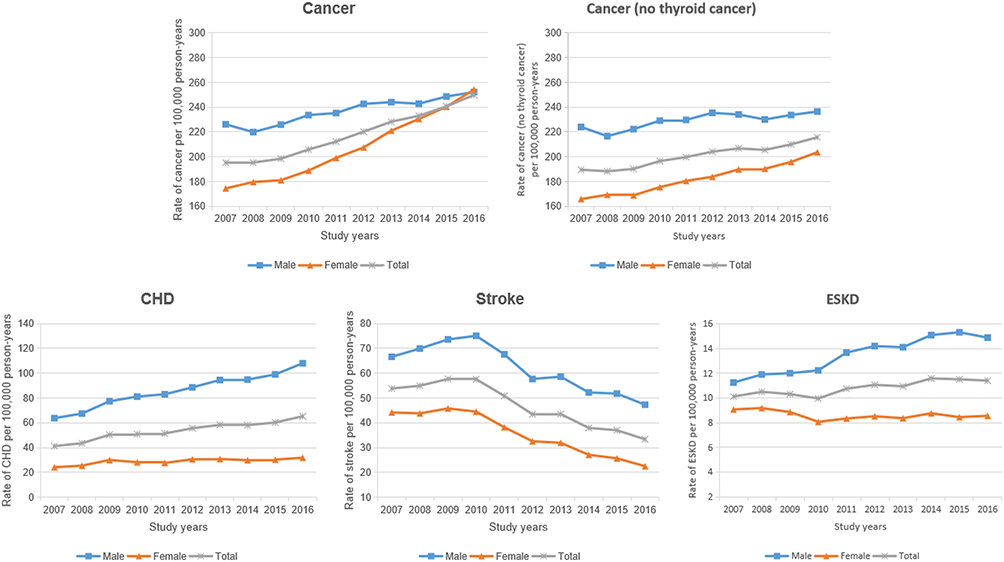 |
Figure 1 Trends of ASRs of the four major NCDs according to sex from 2007 to 2016. |
ASRs in Different Subgroups by Sex in 2016
The highest ASRs and the lowest ASRs of cancer, CHD, and stroke were observed in Northeast China and Southwest China in the total study population, respectively. The highest ASR and the lowest ASR of ESKD were observed in Northeast China and East China. The ASRs of CHD and stroke were higher in the northern part (Northeast China, Northwest China and North China) than the rest of China. Higher ASR of cancer and lower ASRs of CHD, stroke and ESKD were observed in a higher degree of urbanization with respect to places of residence (Table 3).
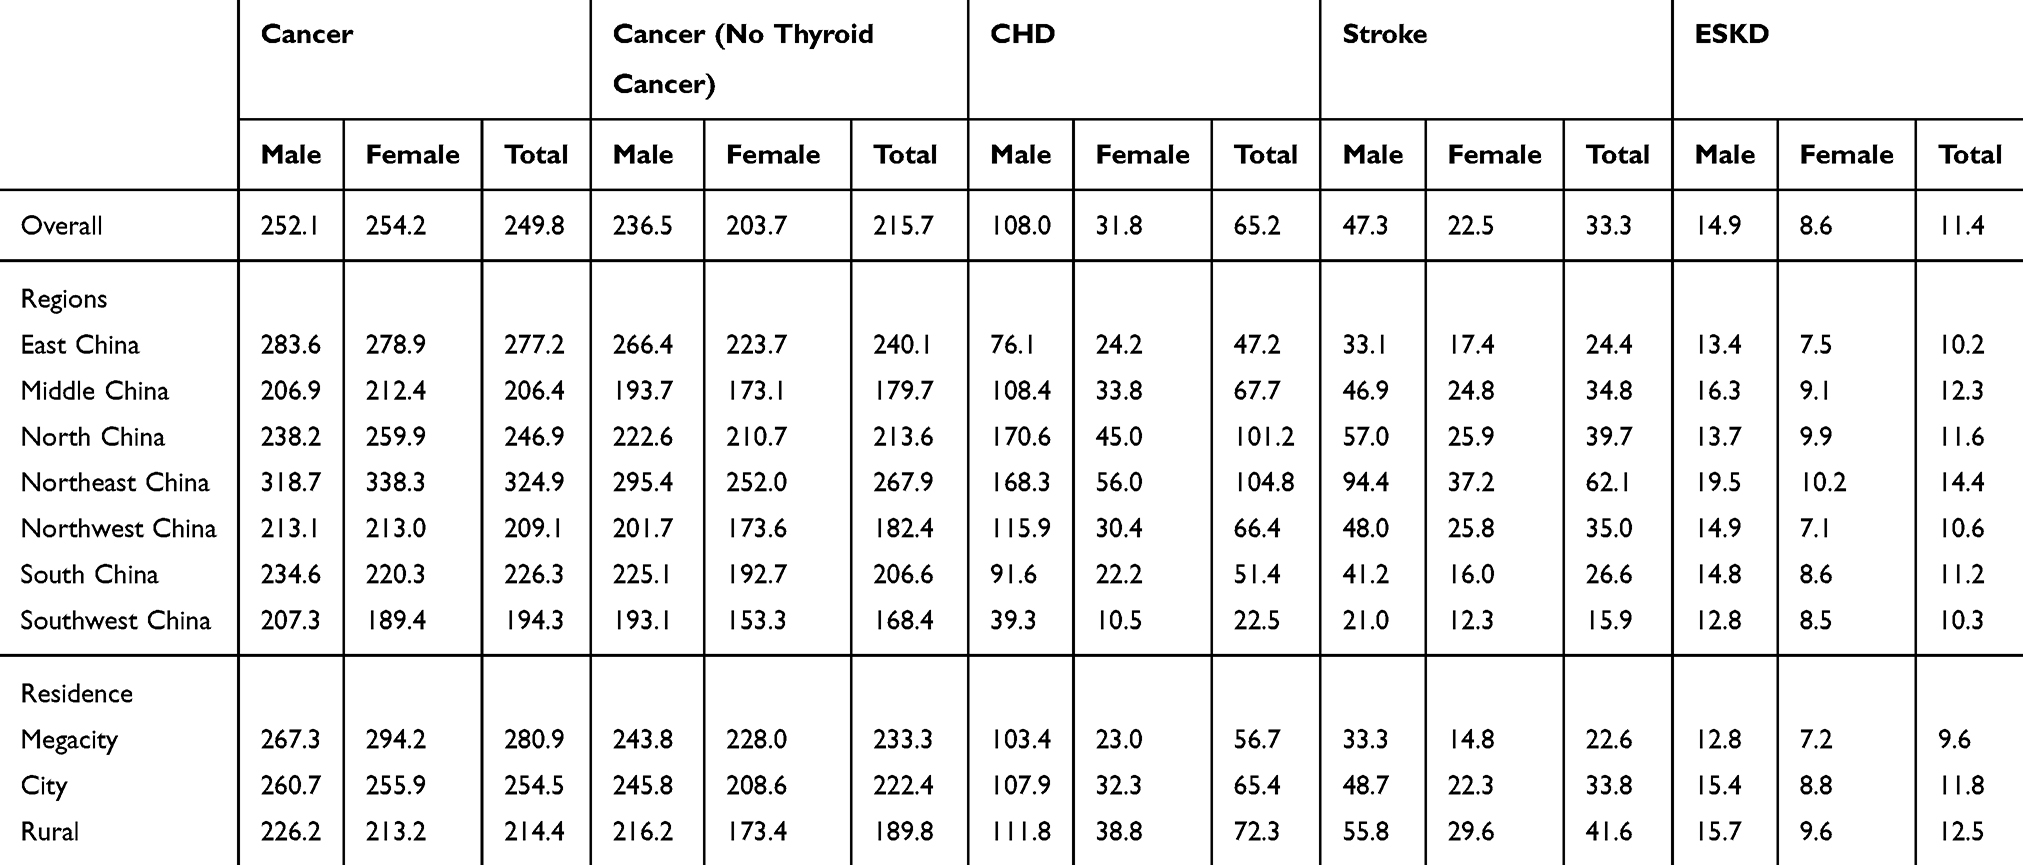 |
Table 3 ASRs (per 100,000 Person-Years) of the Four Major NCDs in 2016 According to Regions and Area of Residence |
Sensitivity Analyses
In the sensitivity analyses of excluding thyroid cancer, the ASRs of cancer in females were lower than in males even though the ASRs in females increased more rapidly than in males from 2007 to 2016. Furthermore, the percentage change in ASR of cancer excluding thyroid cancer was lowest in Northeast China compared to other regions and was lower in cities compared with that in rural areas (Table 3).
Percentage Change of ASRs by Geographical Distribution from 2007 to 2016
The highest ASRs percentage increase of cancer and CHD were observed in Southwest China from 2007 to 2016. The most significant ASR decline of stroke was observed in South China. The ASRs of ESKD in different regions were stable from 2007 to 2016 when compared to the rest of the three NCDs (Figure 2).
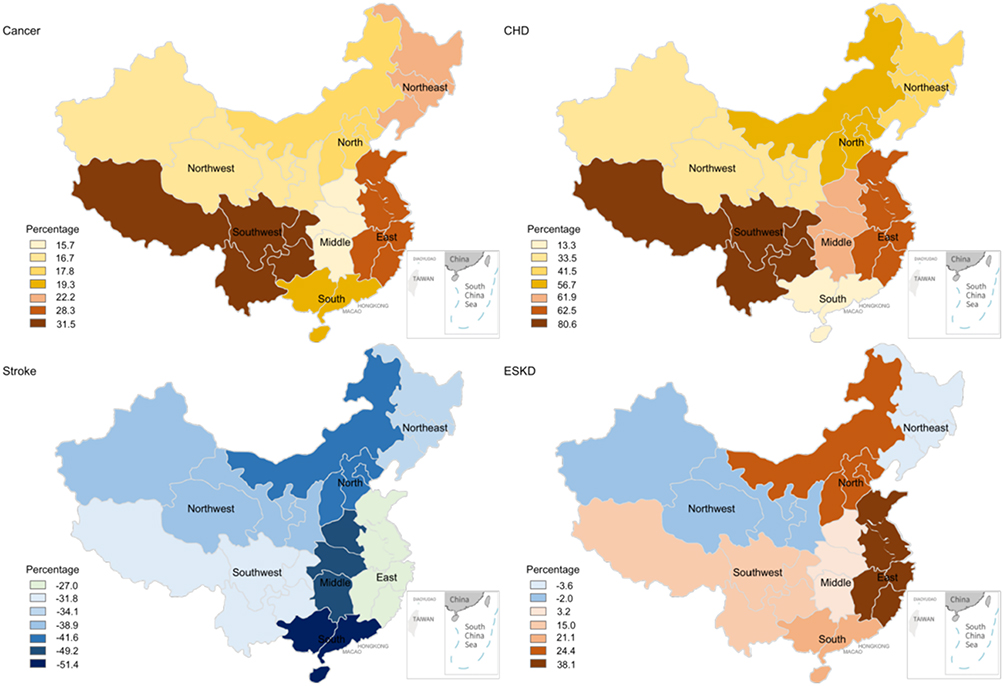 |
Figure 2 Map of percentage change in ASRs of the four major NCDs from 2007 to 2016. |
Discussion
In this study, we present the incidence and trends of four major NCDs in Chinese population covered by commercial critical illness insurance. This paper provided insights regarding trends in the incidence of four major NCDs in the past decade. Similar evidence is extremely limited in developing countries.
The ASRs of cancer in our study were higher than estimated ASRs from the National Central Cancer Registry of China (NCCRC) in 2014–2015 (233.0 vs 186.5/100,000 in 2014; 240.6 vs 201.1/100,000 in 2015),18,19 and also was higher than the rate in China estimated by GLOBOCAN 2018 (223.0/100,000 for males and 182.6/100,000 for females).20 The ASR of cancer was even higher among females than males in 2016, which was opposite to results reported by NCCRC and the GLOBOCAN. We also found that the trend for ASRs of cancer in females increased faster than in males (4.2% vs 1.4% increase). The sensitivity analysis showed that after excluding thyroid cancer, the trend of cancer incidence rate in females (AAPC, average annual percent change of 2.3% increase per year) was in accordance with results from NCCRC (AAPC of 2.2% increase per year).19 We speculated that the ASRs of cancer reported in our study might be inflated by early detection, screening and even over-diagnosis of thyroid cancer, since several studies have shown that over-diagnosis of thyroid cancer is common, particularly in females.21,22 Meanwhile, this might be one of the explanations for the gap of ASRs in cancer between rural and urban areas, since the urban area would be much resourceful and developed with respect to medical services. In our study, the ASR in Southwest China had the highest percentage change, which also was seen in the NCCRC surveillance that Southwest China had the lowest incidence rate among different areas in 2014 (165.8/100,000), but the highest incidence rate (226.7/100,000) in 2015.18,19
In our study, the ASRs for stroke were lower than previous studies in China. The ASR of stroke reported by the National Epidemiological Survey of Stroke in China (NESS-China) in 2013 was 246.8 per 100,000 person-years,23 the incidence rate of stroke in adults aged 40–74 was 379 per 100,000 individuals in 2013 reported by the China National Stroke Screening Survey (CNSSS),24 while in our study the ASR incident of stroke in 2013 was only 43.5 per 100,000 person-years. The difference of definition may mainly cause the significant disparities. For commercial critical illness insurance, only the stroke with sequelae of permanent dysfunction of the nervous system or death would be reimbursed (see Supplementary materials 3). The trends of stroke incident in our study were downward since 2010. On the one hand, the decreasing of mortality and incidence rates of sequelae after stroke could be driven by evidence-based treatments such as thrombolysis within 3 hrs, aspirin, and better acute stroke care in addition to programs for stroke.25 On the other hand, higher socioeconomic status (ie, insurants in our study) may have a positive impact on the knowledge of stroke prevention and control of risk factors, as well as accessibility and adherence to medical treatment.26,27 Moreover, the variation in incidence rates of stroke between urban and rural areas may reflect accessibility for better treatment in urban areas.
To the best of our knowledge, there was no available national incidence data of ESKD in China before. Even it is crucial for developing disease control and service provision strategies.28 The incidence rate of ESKD in our study was comparable with that reported in Beijing in 2013 (11.0 vs 9.4 per 100,000 person-years)29 and that in Shanghai in 2011 (10.4 vs 11.5 per 100,000 person-years),30 but lower than that in Nanjing in 2014 (11.2 vs 22.0 per 100,000 person-years).31 Compared to foreign countries, the incidence rate of ESKD in our study in 2016 (11.4 per 100,000 person-years) was similar to that in the United Kingdom (11.8 per 100,000 person-years),32 Australia (11.7 per 100,000 person-years), New Zealand (11.9 per 100,000 person-years),33 but was considerably lower than that in the USA (38.5 per 100,000 person-years).34
Diabetes and hypertension were reported to be the major causes of kidney disease in China.35 We found that the highest incidence rate of ESKD was in Northeast China. The high prevalence but low control rate of diabetes and hypertension might be the leading cause of that.36–38 Driven by population ageing and increasing prevalence of diabetes and hypertension in China, the incidence of ESKD could rise sharply over the next few decades. It is necessary to build a national registry for ESKD and/or chronic kidney disease before ESKD in China.
As far as we know, this is the first attempt by using commercial health insurance database in estimating the burden of critical NCDs in China, which may provide usefully complementary information to data derived from survey and registers in the country. However, there are limitations of our study that deserve mention. Firstly, because most of the insurance products have the upper limit for age, the age distribution of our study population is younger than the general population in China. Even age-adjustment has been conducted by the WHO standard population, a lower proportion of the elderly population may influence ASRs. Secondly, certain cancers were not covered in our study such as carcinoma in situ, chronic lymphocytic leukaemia and skin cancer due to the definition of critical illnesses guideline in China, which might affect the incidence rate of cancer. Finally, geographic information was collected based on the location where insurances were bought, instead of the place of residence.
Conclusions
To achieve better control of major NCDs in China, a detailed assessment of the disease burden in China is critical. Claims data are remarkably valuable in the assessment of disease burden. To our knowledge, commercial claims data in China as CCCIID have not been well leveraged for disease burden analysis before. Our results suggest that the healthcare system for severe stroke has been well developed in China based on the decreasing trends of ASRs. Our results also confirm that cancer is still the priority medical problem in China, and potentially over-diagnosis of thyroid cancer shall be addressed, especially in females. The increasing trend of CHD incidence implies that more attention should be paid to the control of CHD, especially in the northern part of China. The incident data of ESKD in China are as high as some developed countries and are estimated to rise sharply over the next few decades. It is necessary to build a national registry for ESKD and/or chronic kidney disease before ESKD in China.
Abbreviations
AMI, acute myocardial infarction; ASRs, age-standardized incidence rates; APC, annual percent change; AAPC, average annual percent change; CNSSS, China National Stroke Screening Survey; CCCIID, Chinese commercial critical illness insurance database; CABG, coronary artery bypass graft; CHD, coronary heart disease; ESKD, end-stage kidney disease; NCCRC, National Central Cancer Registry of China; NESS-China, National Epidemiological Survey of Stroke in China; NCDs, non-communicable diseases; WHO, World Health Organization.
Ethical Approval
The ethical approval of this study was approved to be waived by the institutional review board ethics committee of the Peking University First Hospital (Ethical approval number: 2019-2020) because all the data included in this study were anonymous and cannot be used to identify any individual.
Acknowledgments
We would like to thank the China Reinsurance Group for providing permission of data analysis.
Funding
This study was supported by Grants from the National Natural Science Foundation of China [Grant Nos. 81771938, 91846101, 81301296], from Peking University [Grant Nos.BMU2018MX020, PKU2017LCX05], the National Key Technology R&D Program of the Ministry of Science and Technology of the People’s Republic of China [2016YFC1305400], and the University of Michigan Health System-Peking University Health Science Center Joint Institute for Translational and Clinical Research [BMU20160466, BMU2018JI012, BMU2019JI005]. The funding source had no involvement in this study.
Disclosure
Prof. Dr. Luxia Zhang report grants from AstraZeneca, outside the submitted work. The authors report no other conflicts on interest in this work.
References
1. World Health Organization. Noncommunicable Diseases. Geneva: World Health Organization; 2018. Available from: https://www.who.int/news-room/fact-sheets/detail/noncommunicable-diseases.
2. Hunter DJ, Reddy KS. Noncommunicable diseases. N Engl J Med. 2013;369(14):1336–1343. doi:10.1056/NEJMra1109345
3. World Health Organization. Noncommunicable Diseases Country Profiles 2018. Geneva: World Health Organization; 2018. Available from: https://www.who.int/nmh/publications/ncd-profiles-2018/en.
4. Min Y, Jiang L-X, Yan L-JL, et al. Tackling China’s noncommunicable diseases: shared origins, costly consequences and the need for action. Chin Med J. 2015;128(6):839–843. doi:10.4103/0366-6999.152690
5. Kroll M, Phalkey RK, Kraas F. Challenges to the surveillance of non-communicable diseases–a review of selected approaches. BMC Public Health. 2015;15:1243. doi:10.1186/s12889-015-2570-z
6. Benziger CP, Roth GA, Moran AE. The Global Burden of Disease Study and the preventable burden of NCD. Glob Heart. 2016;11(4):393–397. doi:10.1016/j.gheart.2016.10.024
7. Sherman RE, Anderson SA, Dal Pan GJ, et al. Real-world evidence — what is it and what can it tell us? N Engl J Med. 2016;375(23):2293–2297. doi:10.1056/NEJMsb1609216
8. Marten R, McIntyre D, Travassos C, et al. An assessment of progress towards universal health coverage in Brazil, Russia, India, China, and South Africa (BRICS). Lancet. 2014;384(9960):2164–2171. doi:10.1016/S0140-6736(14)60075-1
9. Feng PC. Current status and prospects of critical illness insurance products. China Med Insurance. 2014;9:62–65.
10. Definition of disease in critical illness insurance. Available from: http://www.awi-intl.com/life/disease/definitionofdisease.pdf.
11. Ahmad OB, Boschi-Pinto C, Lopez AD, Murray CJ, Lozano R, Inoue M. Age Standardization of Rates: a New WHO Standard (GPE Discussion Paper Series No. 31). Geneva: World Health Organization; 2001.
12. Kim HJ, Fay MP, Feuer EJ, Midthune DN. Permutation tests for joinpoint regression with applications to cancer rates. Stat Med. 2000;19(3):335–351. doi:10.1002/(SICI)1097-0258(20000215)19:3<335::AID-SIM336>3.0.CO;2-Z
13. Institute NC. Version 4.6.0-April 2018. Bethesda, MD: Statistical Methodology and Applications Branch, Surveillance Research Program, National Cancer Institue; 2018. Available from: https://surveillance.cancer.gov/joinpoint.
14. Davies L, Welch HG. Current thyroid cancer trends in the United States. JAMA Otolaryngol Head Neck Surg. 2014;140(4):317–322. doi:10.1001/jamaoto.2014.1
15. Colonna M, Grosclaude P, Remontet L, et al. Incidence of thyroid cancer in adults recorded by French cancer registries (1978–1997). Eur J Cancer. 2002;38(13):1762–1768. doi:10.1016/S0959-8049(02)00110-7
16. Kilfoy BA, Zheng T, Holford TR, et al. International patterns and trends in thyroid cancer incidence, 1973–2002. Cancer Causes Control. 2009;20(5):525–531. doi:10.1007/s10552-008-9260-4
17. Roman BR, Morris LG, Davies L. The thyroid cancer epidemic, 2017 perspective. Curr Opin Endocrinol Diabetes Obes. 2017;24(5):332–336. doi:10.1097/MED.0000000000000359
18. Chen W, Sun K, Zheng R, et al. Cancer incidence and mortality in China, 2014. Chin J Cancer Res. 2018;30(1):1–12. doi:10.21147/j.issn.1000-9604.2018.01.01
19. Chen W, Zheng R, Baade PD, et al. Cancer statistics in China, 2015. CA Cancer J Clin. 2016;66(2):115–132. doi:10.3322/caac.21338
20. Bray F, Ferlay J, Soerjomataram I, Siegel RL, Torre LA, Jemal A. Global cancer statistics 2018: GLOBOCAN estimates of incidence and mortality worldwide for 36 cancers in 185 countries. CA Cancer J Clin. 2018;68(6):394–424. doi:10.3322/caac.v68.6
21. Morris LG, Sikora AG, Tosteson TD, Davies L. The increasing incidence of thyroid cancer: the influence of access to care. Thyroid. 2013;23(7):885–891. doi:10.1089/thy.2013.0045
22. Esserman LJ, Thompson IM
23. Wang W, Jiang B, Sun H, et al. Prevalence, incidence, and mortality of stroke in china: results from a nationwide population-based survey of 480 687 adults. Circulation. 2017;135(8):759–771. doi:10.1161/CIRCULATIONAHA.116.025250
24. Guan T, Ma J, Li M, et al. Rapid transitions in the epidemiology of stroke and its risk factors in China from 2002 to 2013. Neurology. 2017;89(1):53–61. doi:10.1212/WNL.0000000000004056
25. Liu M, Wu B, Wang WZ, Lee LM, Zhang SH, Kong LZ. Stroke in China: epidemiology, prevention, and management strategies. Lancet Neurol. 2007;6(5):456–464. doi:10.1016/S1474-4422(07)70004-2
26. Grotto I, Huerta M, Grossman E, Sharabi Y. Relative impact of socioeconomic status on blood pressure lessons from a large-scale survey of young adults. Am J Hypertens. 2007;20(11):1140–1145. doi:10.1016/j.amjhyper.2007.06.004
27. Addo J, Ayerbe L, Mohan KM, et al. Socioeconomic status and stroke: an updated review. Stroke. 2012;43(4):1186–1191. doi:10.1161/STROKEAHA.111.639732
28. Liyanage T, Ninomiya T, Jha V, et al. Worldwide access to treatment for end-stage kidney disease: a systematic review. Lancet. 2015;385(9981):1975–1982. doi:10.1016/S0140-6736(14)61601-9
29. Gan L, Zuo L. Current ESRD burden and its future trend in Beijing, China. Clin Nephrol. 2015;83(7 Suppl 1):17–20. doi:10.5414/CNP83S017
30. Zhang WM. Current status of dialysis therapy in Shanghai (results from Shanghai Renal Registry, 2011). Chin J Blood Purifi. 2012;11(5):233–236.
31. Sun L, Zou LX, Han YC, et al. Forecast of the incidence, prevalence and burden of end-stage renal disease in Nanjing, China to the Year 2025. BMC Nephrol. 2016;17(1):60. doi:10.1186/s12882-016-0269-8
32. Association TR. UK renal registry: 20th annual report 2017. Available from: https://www.renalreg.org/wp-content/uploads/2018/06/20th-Annual-Report_web_book.pdf.
33. Registry A. The 40th annual ANZDATA report 2017. http://www.anzdata.org.au/v1/report_2017.html.
34. Saran R, Robinson B, Abbott KC, et al. US renal data system 2017 annual data report: epidemiology of kidney disease in the United States. Am J Kidney Dis. 2018;71(3s1):A7. doi:10.1053/j.ajkd.2018.01.002
35. Huang YM, Xu D, Long J, et al. Spectrum of chronic kidney disease in China: a national study based on hospitalized patients from 2010 to 2015. Nephrology. 2019;24:725–736. doi:10.1111/nep.13489
36. Li D, Lv J, Liu F, et al. Hypertension burden and control in mainland China: analysis of nationwide data 2003–2012. Int J Cardiol. 2015;184:637–644. doi:10.1016/j.ijcard.2015.03.045
37. Zhou X, Guan H, Zheng L, et al. Prevalence and awareness of diabetes mellitus among a rural population in China: results from Liaoning Province. Diabet Med. 2015;32(3):332–342. doi:10.1111/dme.12599
38. Yang L, Shao J, Bian Y, et al. Prevalence of type 2 diabetes mellitus among inland residents in China (2000–2014): a meta-analysis. J Diabetes Investig. 2016;7(6):845–852. doi:10.1111/jdi.2016.7.issue-6
 © 2020 The Author(s). This work is published and licensed by Dove Medical Press Limited. The full terms of this license are available at https://www.dovepress.com/terms.php and incorporate the Creative Commons Attribution - Non Commercial (unported, v3.0) License.
By accessing the work you hereby accept the Terms. Non-commercial uses of the work are permitted without any further permission from Dove Medical Press Limited, provided the work is properly attributed. For permission for commercial use of this work, please see paragraphs 4.2 and 5 of our Terms.
© 2020 The Author(s). This work is published and licensed by Dove Medical Press Limited. The full terms of this license are available at https://www.dovepress.com/terms.php and incorporate the Creative Commons Attribution - Non Commercial (unported, v3.0) License.
By accessing the work you hereby accept the Terms. Non-commercial uses of the work are permitted without any further permission from Dove Medical Press Limited, provided the work is properly attributed. For permission for commercial use of this work, please see paragraphs 4.2 and 5 of our Terms.