")
Back to Journals » Diabetes, Metabolic Syndrome and Obesity » Volume 14
Incidence of Diabetic Retinopathy and Its Predictors Among Newly Diagnosed Type 1 and Type 2 Diabetic Patients: A Retrospective Follow-up Study at Tertiary Health-care Setting of Ethiopia
Authors Debele GR , Kanfe SG , Weldesenbet AB , Ayana GM , Jifar WW , Raru TB
Received 4 January 2021
Accepted for publication 9 March 2021
Published 22 March 2021 Volume 2021:14 Pages 1305—1313
DOI https://doi.org/10.2147/DMSO.S300373
Checked for plagiarism Yes
Review by Single anonymous peer review
Peer reviewer comments 4
Editor who approved publication: Prof. Dr. Antonio Brunetti
Gebiso Roba Debele,1 Shuma Gosha Kanfe,2 Adisu Birhanu Weldesenbet,3 Galana Mamo Ayana,3 Wakuma Wakene Jifar,4 Temam Beshir Raru3
1Department of Public Health, College of Health Sciences, Mettu University, Mettu, Ethiopia; 2Department of Health Informatics, College of Health Sciences, Mettu University, Mettu, Ethiopia; 3Department of Epidemiology and Biostatistics, Collage of Health and Medical Sciences, Haramaya University, Haramaya, Ethiopia; 4Department of Pharmacy, College of Health Sciences, Mettu University, Mettu, Ethiopia
Correspondence: Gebiso Roba Debele Tel +251922042777
Email [email protected]
Background: With an increasing number of diabetes patients in developing countries, the burden of diabetes-related blindness is undoubtedly posing a massive challenge to the sustainable health care system due to the cost of care. Despite this fact, to date, most of the epidemiological research on diabetic retinopathy (DR) in eastern Africa, including Ethiopia, has been limited to survey studies. Thus, we determined the incidence of retinopathy and its predictors among diabetic patients in Jimma University Medical Center, Southwest Ethiopia.
Methods: A retrospective follow-up study was conducted on 402 randomly selected diabetic patients of aged ≥ 15 years. A preliminary reviewed checklist was used to obtain information on the demographics, clinical and physiological attributes. Data were entered using EpiData version 4.6 and analyzed using Stata version 14. All variables at P-values less than 0.2 in bivariable analysis were exported to multivariable analysis. Multivariable accelerated failure time (AFT) regression analyses using Weibull distribution were used to examine the predictors of DR at a 5% level of significance.
Results: Throughout a median follow-up period of 5.9 years, the cumulative incidence of DR was 20.15% (95%CI: 16.50– 24.37) and the incidence rate was 36.9 per 1000 person years (PY) (95%CI: 29.7– 45.9). Multivariable Weibull AFT regression analyses showed that type two diabetes mellitus (T2DM) (adjusted time ratio (ATR) 0.4095%CI: 0.20– 0.78), hypertension (HTN) (ATR 0.54; 95%CI: [0.35, 0.82]), low high density lipoprotein cholesterol (HDL-C) (ATR 0.51; 95%CI: 0.36– 0.73), and borderline high total cholesterol (TC) (ATR 0.63; 95%CI: 0.42– 0.94) were a predictor of time to DR.
Conclusion: The overall incidence of DR among patients with diabetes mellitus was estimated to be 20.15% and is becoming a public health burden in Ethiopia. Our results indicate that T2DM, HTN, low HDL-C and borderline high TC independently predicts an increased incidence/decreased survival time of retinopathy among diabetes patients. The low HDL-C, HTN, and high TC are modifiable risk factors that should be managed along with diabetes.
Keywords: diabetic retinopathy, predictors, incidence, diabetes mellitus
Introduction
Diabetes mellitus (DM) is a prevalent metabolic disease that causes high mortality associated with its complications and has physical, social, and economic consequences on the community.1,2 With an increasing number of diabetes patients worldwide, predominantly in developing countries, the burden of diabetes-related blindness certainly poses massive challenges to the sustainable health-care system because of the cost of care.3 In 2019 to the International Diabetic Federation (IDF), there were an estimated 4.2 million deaths among the 20–79 age group attributed to its complications and this corresponds to one death every eight seconds.4 One of the complications of DM is that nearly all patients with type one diabetes mellitus (T1DM) and more than 60% of patients with type two diabetes mellitus (T2DM) will develop retinopathy within the first two decades of diagnosis.5 Diabetic retinopathy (DR) may lead to visual loss in the proliferative stage either from growth of new retinal vessels, or increased permeability of vessels5 which possibly depends on local production of angiogenic and growth factors.6 The high-mobility-group A1 protein plays a great role in lowering risk of developing DR by downregulating the expression of vascular endothelial growth factor A, which is a major activator for angiogenesis.7 In Africa the age standardized mortality rate due to diabetes and its complications was estimated to be 111.3 per 100,000 population8 and 22 per 1000 deaths were attributed to diabetes in Ethiopia.9
Globally DR in people with diabetes was estimated to be 35% with vision-threatening diabetic retinopathy (VTDR) present in 12%.10 It was predicted that DR will grow from 5.5 million in 2005 to 16.0 million in 2050 and the incidence of VTDR is expected to grow from 1.2 million in 2005 to 3.4 million in 2050.11 The annual incidence of DR ranged from 2.2% to 12.7% and annual progression to VTDR ranged from 3.4% to 12.3%.12 In Africa retinopathy was estimated to affect 30.2–31.6% of diabetes patients13 and the prevalence is growing most rapidly in Sub-Saharan Africa (SSA) countries imposing a large economic burden.14,15 The prevalence of retinopathy in Ethiopia was 19.48% with the highest prevalence in Oromia (24.8%), followed by in Amhara region (19.99%).16
DR is one of the leading causes of blindness in the working age population with devastating consequences, despite being possibly preventable and treatable.17,18 Globally approximately 4.8% of cases of vision loss were caused by DR.19 Eighty-six percent of younger-onset blindness and one-third of older-onset blindness was attributable to DR.5 DR caused 1.9% of moderate or severe visual impairment globally and 2.6% of blindness in 201020 and it is the sixth leading cause of global visual impairment.21
From multiple risk factors of DR, the duration of DM and age of the patient are supposed to be the strongest predictors.3,22,23 Other risk factors like hypertension (HTN),24 blood glucose23 and high body mass index (BMI)22 were also shown to have associations with DR.25
Even though high plasma glucose level was a conventional risk factor for DR, better glucose control was reported to have an unacceptable effect on preventing the development of DR.26 The study reported that only 11% of the total risk of DR could be explained by hyperglycemia, and the remaining 89% might be caused by other potential risk factors.27 Therefore, exploring other potential risk factors and prevention of DR would be imperative.
To date, most of the epidemiological research on DR in eastern Africa including Ethiopia has been limited to prevalence estimates from cross-sectional studies. Thus, we determined the incidence of retinopathy and its predictors among T1DM and T2DM patients in Jimma University Medical Center, Southwest Ethiopia.
Patients and Methods
Study Setting, Period, Design and Population
A facility-based retrospective follow-up study was conducted at Jimma University Medical Center, Southwest Ethiopia from September 5, 2012 to February 25, 2020. The study population was all newly diagnosed T1DM and T2DM patients from September 5, 2012 to August 2015 whose age was ≥15 and who fulfilled the inclusion criteria of the study. In contrast, we recruited those newly diagnosed DM patients from September 5, 2012 to August 28, 2015 in our study and followed them until February 25, 2020. Once diagnosed with T1DM or T2DM during the recruitment time, we immediately started follow-up making unbalanced nature of data. Those patients who have no medical charts, with a unknown date of DM diagnosis, who were referred from another health facility, and who had history of retinopathy from other underlying causes, or before diabetes diagnosis were excluded from the study.
Sample Size and Sampling Procedure
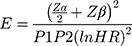
The final sample size for this study (428) was determined using predictors significantly associated with risk of DR from previous studies using Schoenfeld formula28 under Stata software version 14.
 And
And  = Schoenfeld formula for manual calculation.
Where E=number of required events, n=sample size,  is hazard ratio of selected covariates, p1 is proportion of subjects under exposure group,
  and
and  is probability of an event. After sampling frame was prepared using identification number of DM patients from the registration book, subject was randomly selected by simple random sampling technique.
Variables and Operational Definitions
The incidence of DR in patients with T1DM and T2DM was our primary outcome variable. Alternatively, explanatory variables contained demographic variables: age, sex, and residence; clinical: family history of DM, type of DM, type of treatment, creatinine, hemoglobin and comorbidities; and physiologic variables: BMI, HDL-C, low density lipoprotein cholesterol (LDL-C), triglyceride (TG), TC, DBP and SBP).
Diabetic retinopathy was defined as a microvascular complication of diabetes that was evaluated by clinical examination or indirect ophthalmoscopy by ophthalmologists29 and classified as present (yes) or absent (no) from the charts based on ophthalmologists decision.
Time to DR was the time gap in years between diagnoses of diabetes mellitus and first episode of DR.
Event was development of DR.
Censored, in our study, was death, lost to follow-up, and being event free at the end of the study.
Body mass index was defined as physiologic factors that measured in weight in kilograms per squared meter of height (kg/m2) and was subdivided as low (<18.5 kg/m2), normal (18.5–24.9 kg/m2) and high (≥25 kg/m2) according to World Health Organization criteria.30
Hypertension was defined as an average systolic/diastolic blood pressure of 140/90 mmHg or higher taken on two or more separate days and the measurement was taken from record review.31
Data Collection and Quality Assurance
We used data abstraction format from different literature to collect necessary information from patients’ medical files. Using a uniform checklist, relevant secondary data was collected from patient intake form, follow-up card, DM registration book, and electronic information databases, recorded routinely by the hospitals for follow-up, monitoring, and evaluation purposes. To ensure data quality, we performed a preliminary review for consistency of understanding the review tools and completeness of data items. Then adequacy of checklist was evaluated and variables on which data did not exist were excluded from checklist. Before actual data collection, training on record review was given to data collectors and supervisors for two days. All completed checklists/data were examined for consistency and completeness during data management, cleaning, and analysis. Strict supervision was applied by supervisors and investigators during data collection.
Data Management and Analysis
The data were checked for inconsistencies, coding errors, completeness and clarity before entry. Data entry was done using EpiData version 4.6 and then exported to Stata software version 14 for further cleaning and analysis. Normally distributed continuous variables were described in terms of mean with standard deviation, and median with interquartile range was used for asymmetrically distributed variables. Categorical characteristics, including the outcome variable were described in terms of frequencies and percentages. Pearson’s chi-squared test was used to compare the cohort’s baseline categorical variables based on the status of DR during follow-up. Independent sample t-test was used to compare normally distributed baseline continuous variables based on status of DR during follow-up and the Mann–Whitney U-test if the data for the continuous variables were non-normally distributed.
The incidence rate was computed for the entire cohort by dividing the total number of incident cases of DR to the total person-years of follow-up. Survival time was estimated using Kaplan–Meier curves and log rank test was used to compare survival time between groups of categorical variables. Variables with a P-value less than 0.2 in the bivariable analysis were transferred to multivariable analysis to control confounding effect. Weibull regression was selected as a best fitting survival model based on Akaike information criteria (AIC). Goodness of fit of the model was assessed by Cox–Snell residual. Finally, variables with a P-value of less than 0.05 in multivariable regression analysis were considered to be a significant predictor of the outcome variable.
Results
We included 402 (94% of response rate) T1DM and T2DM patients who met the inclusion criteria from the 428 total sample size of whom 247 (61.4%) were male and 238 (59.2%) were urban residents. The age of study participants at baseline ranged from 15 to 90 years with the mean and standard deviation of 43.82 and 15.86, respectively. The average age of respondents at baseline were 25.14 and 51.77 years for T1DM and T2DM respectively. Table 1 shows the cohort’s baseline sociodemographic and clinical characteristics and Table 2 shows physiological characteristics and their comparison according to the status of DR during follow-up. Compared with those who did not develop DR during follow-up, those who developed DR were older and took oral hypoglycemic agent more frequently at baseline, and they had a high proportion of chronic kidney disease (CKD), HTN and cardiovascular disease (CVD). Similarly, they had a higher BMI, TC level, TG level, LDL-C level, creatinine level, hemoglobin level, SBP, DBP and lower HDL-C levels at baseline when compared with those who did not develop DR during follow-up.
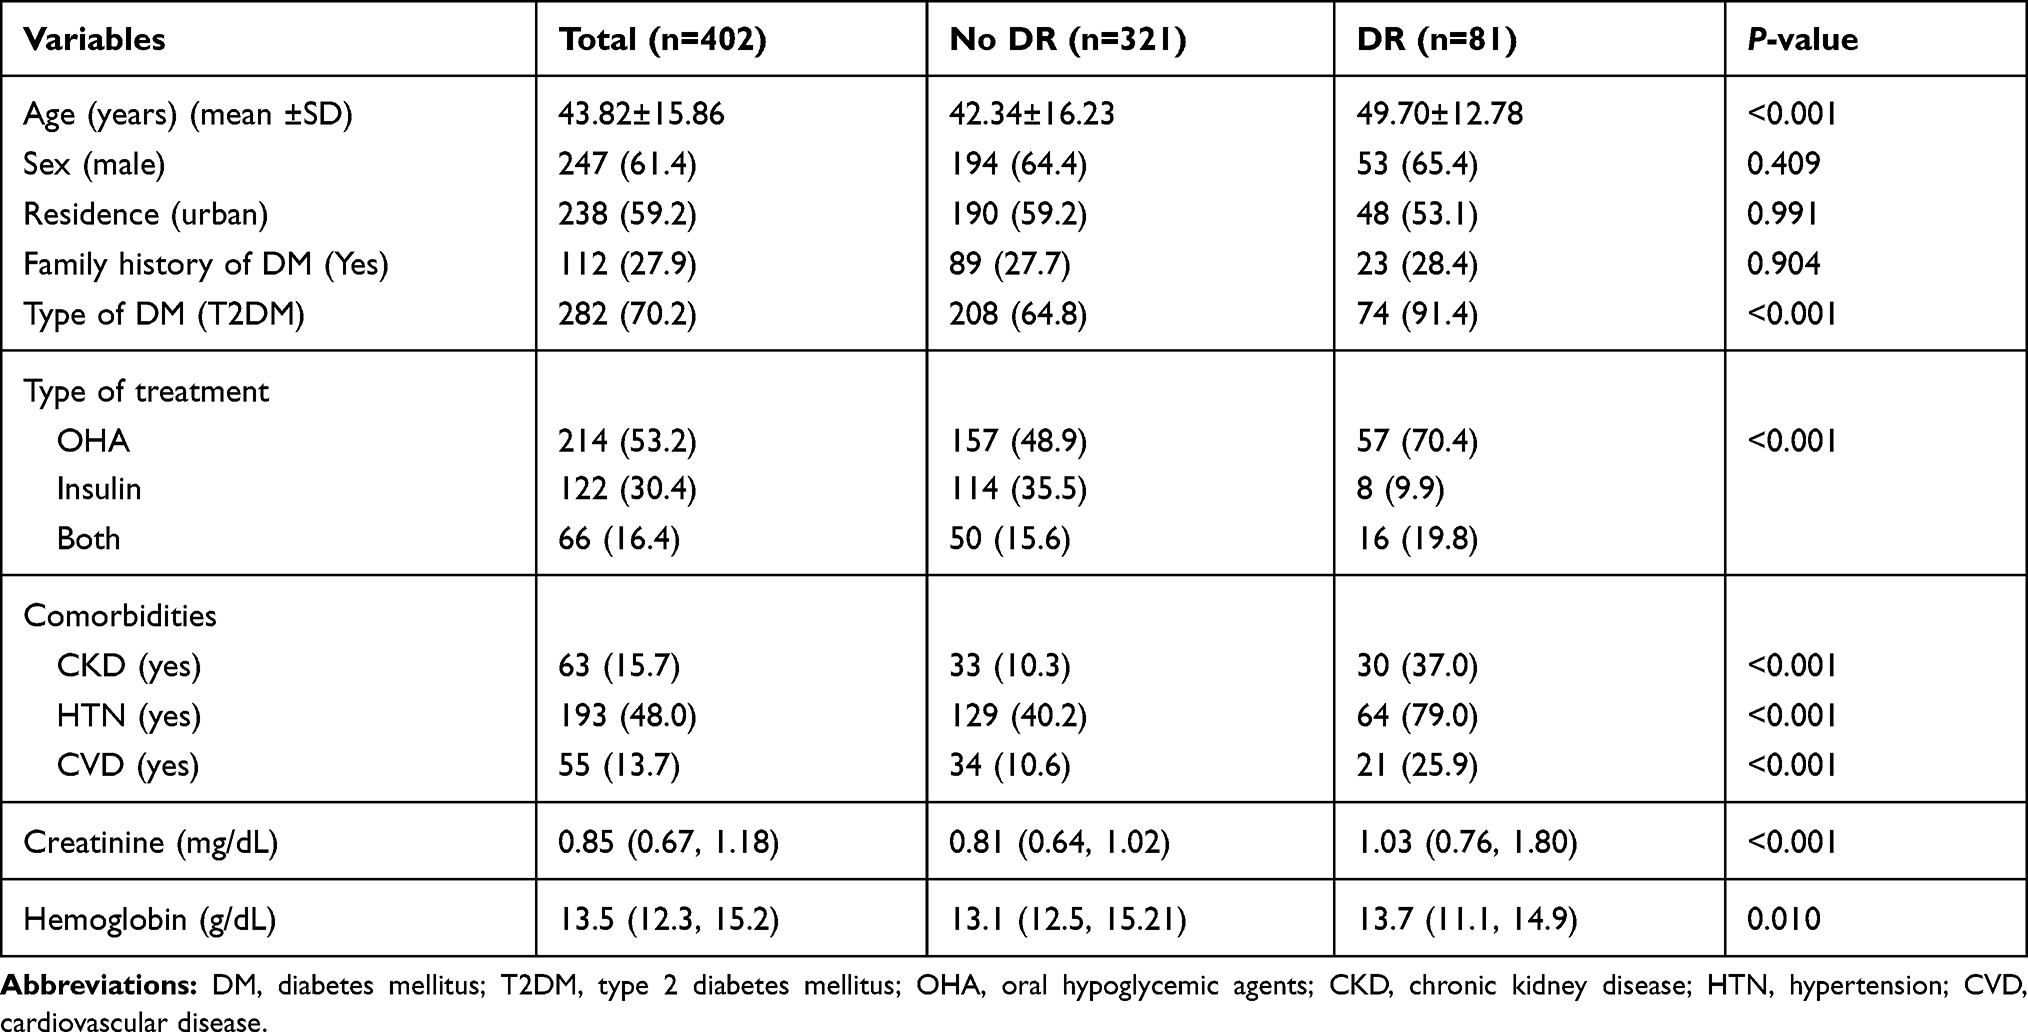 |
Table 1 Baseline Sociodemographic and Clinical Characteristics of Diabetic Patients According to Their Status of Diabetic Retinopathy, 2020 |
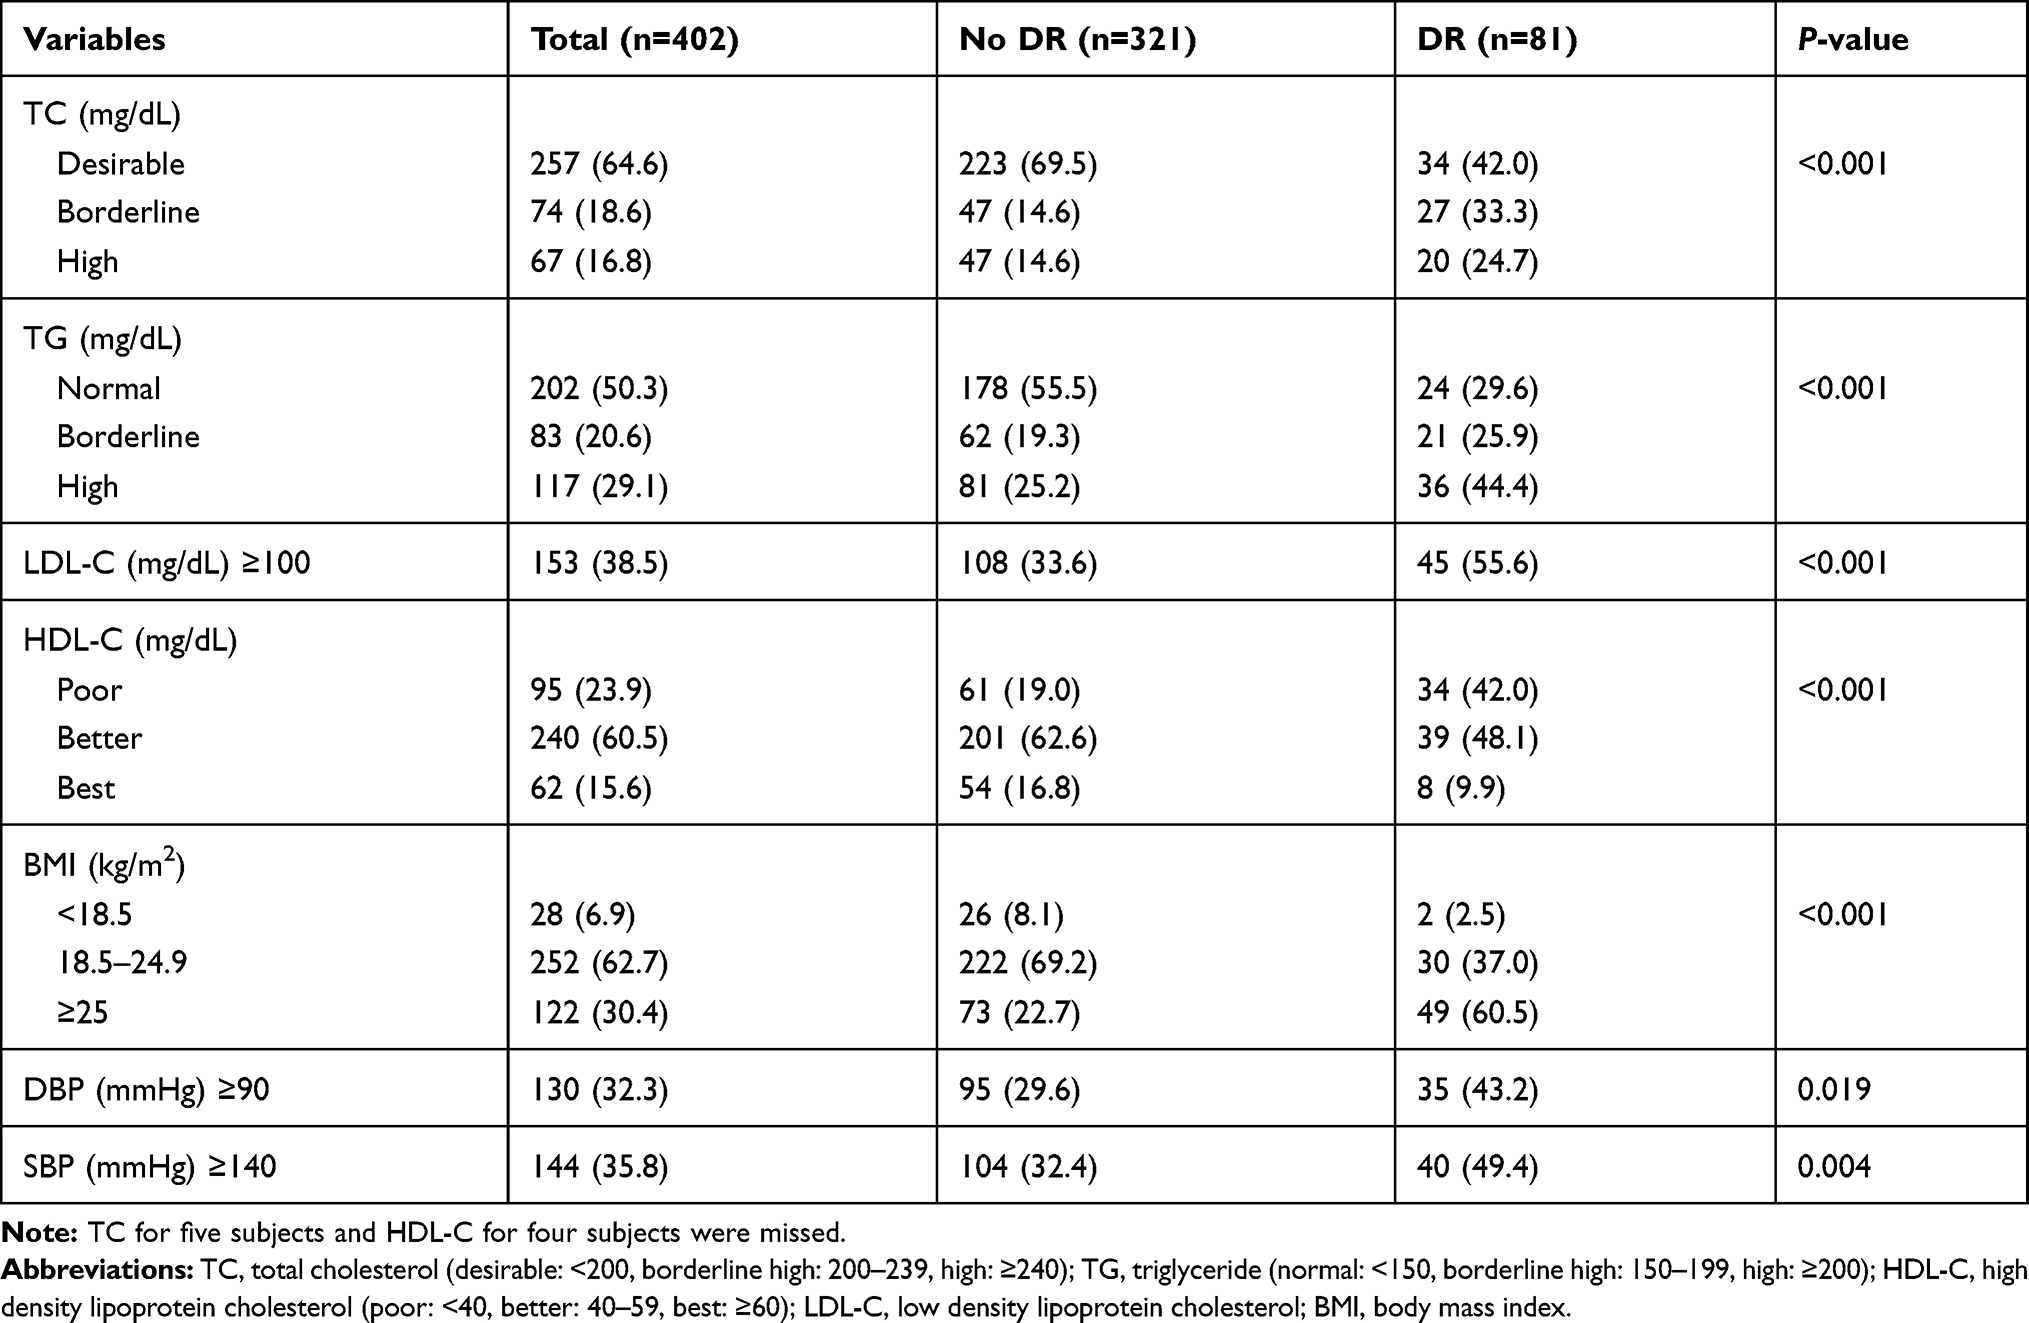 |
Table 2 Baseline Physiological Characteristics of Diabetic Patients According to Their Status of Diabetic Retinopathy, 2020 |
During the median follow-up time of 5.89 years (IQR: 7.85, 9.58 years), 81 subjects developed DR making a cumulative incidence of 20.15% (95%CI: 16.50–24.37). Overall, the incidence rate for DR was 36.9 per 1000 person years (PY) (95%CI: 29.7–45.9). The incidence rate was 9.66 (95%CI: 4.6–20.25) and 50.42 (95%CI: 40.14–63.32) per 1000 PY among T1DM and T2DM, respectively.
Predictors of Time to Diabetic Retinopathy Among Diabetic Patients
Table 3 shows the predictors associated with development of DR among cohorts of diabetic patients. The tolerance of all variables ranged from 0.62 to 0.92, indicating the absence of multicollinearity. The multivariable accelerated failure time model using Weibull distribution was the parsimonious model (because of lowest AIC=440.7). From the Cox–Snell residual plot, cumulative hazard plot follows a straight line through the origin with slope one indicating satisfaction of goodness of fit of the model. In the multivariable analysis four variables (type of DM, HTN, HDL-C and TC) were statistically significantly associated with DR among diabetic patients. According to this model, patients with T2DM (ATR 0.40; 95%CI: 0.20–0.78), HTN (ATR 0.54, 95%CI: 0.35–0.82), low HDL-C (ATR 0.51; 95%CI: 0.36–0.73), and borderline high TC (ATR 0.63; 95%CI: 0.42, 0.94) have lower survival time compared to their counterparts.
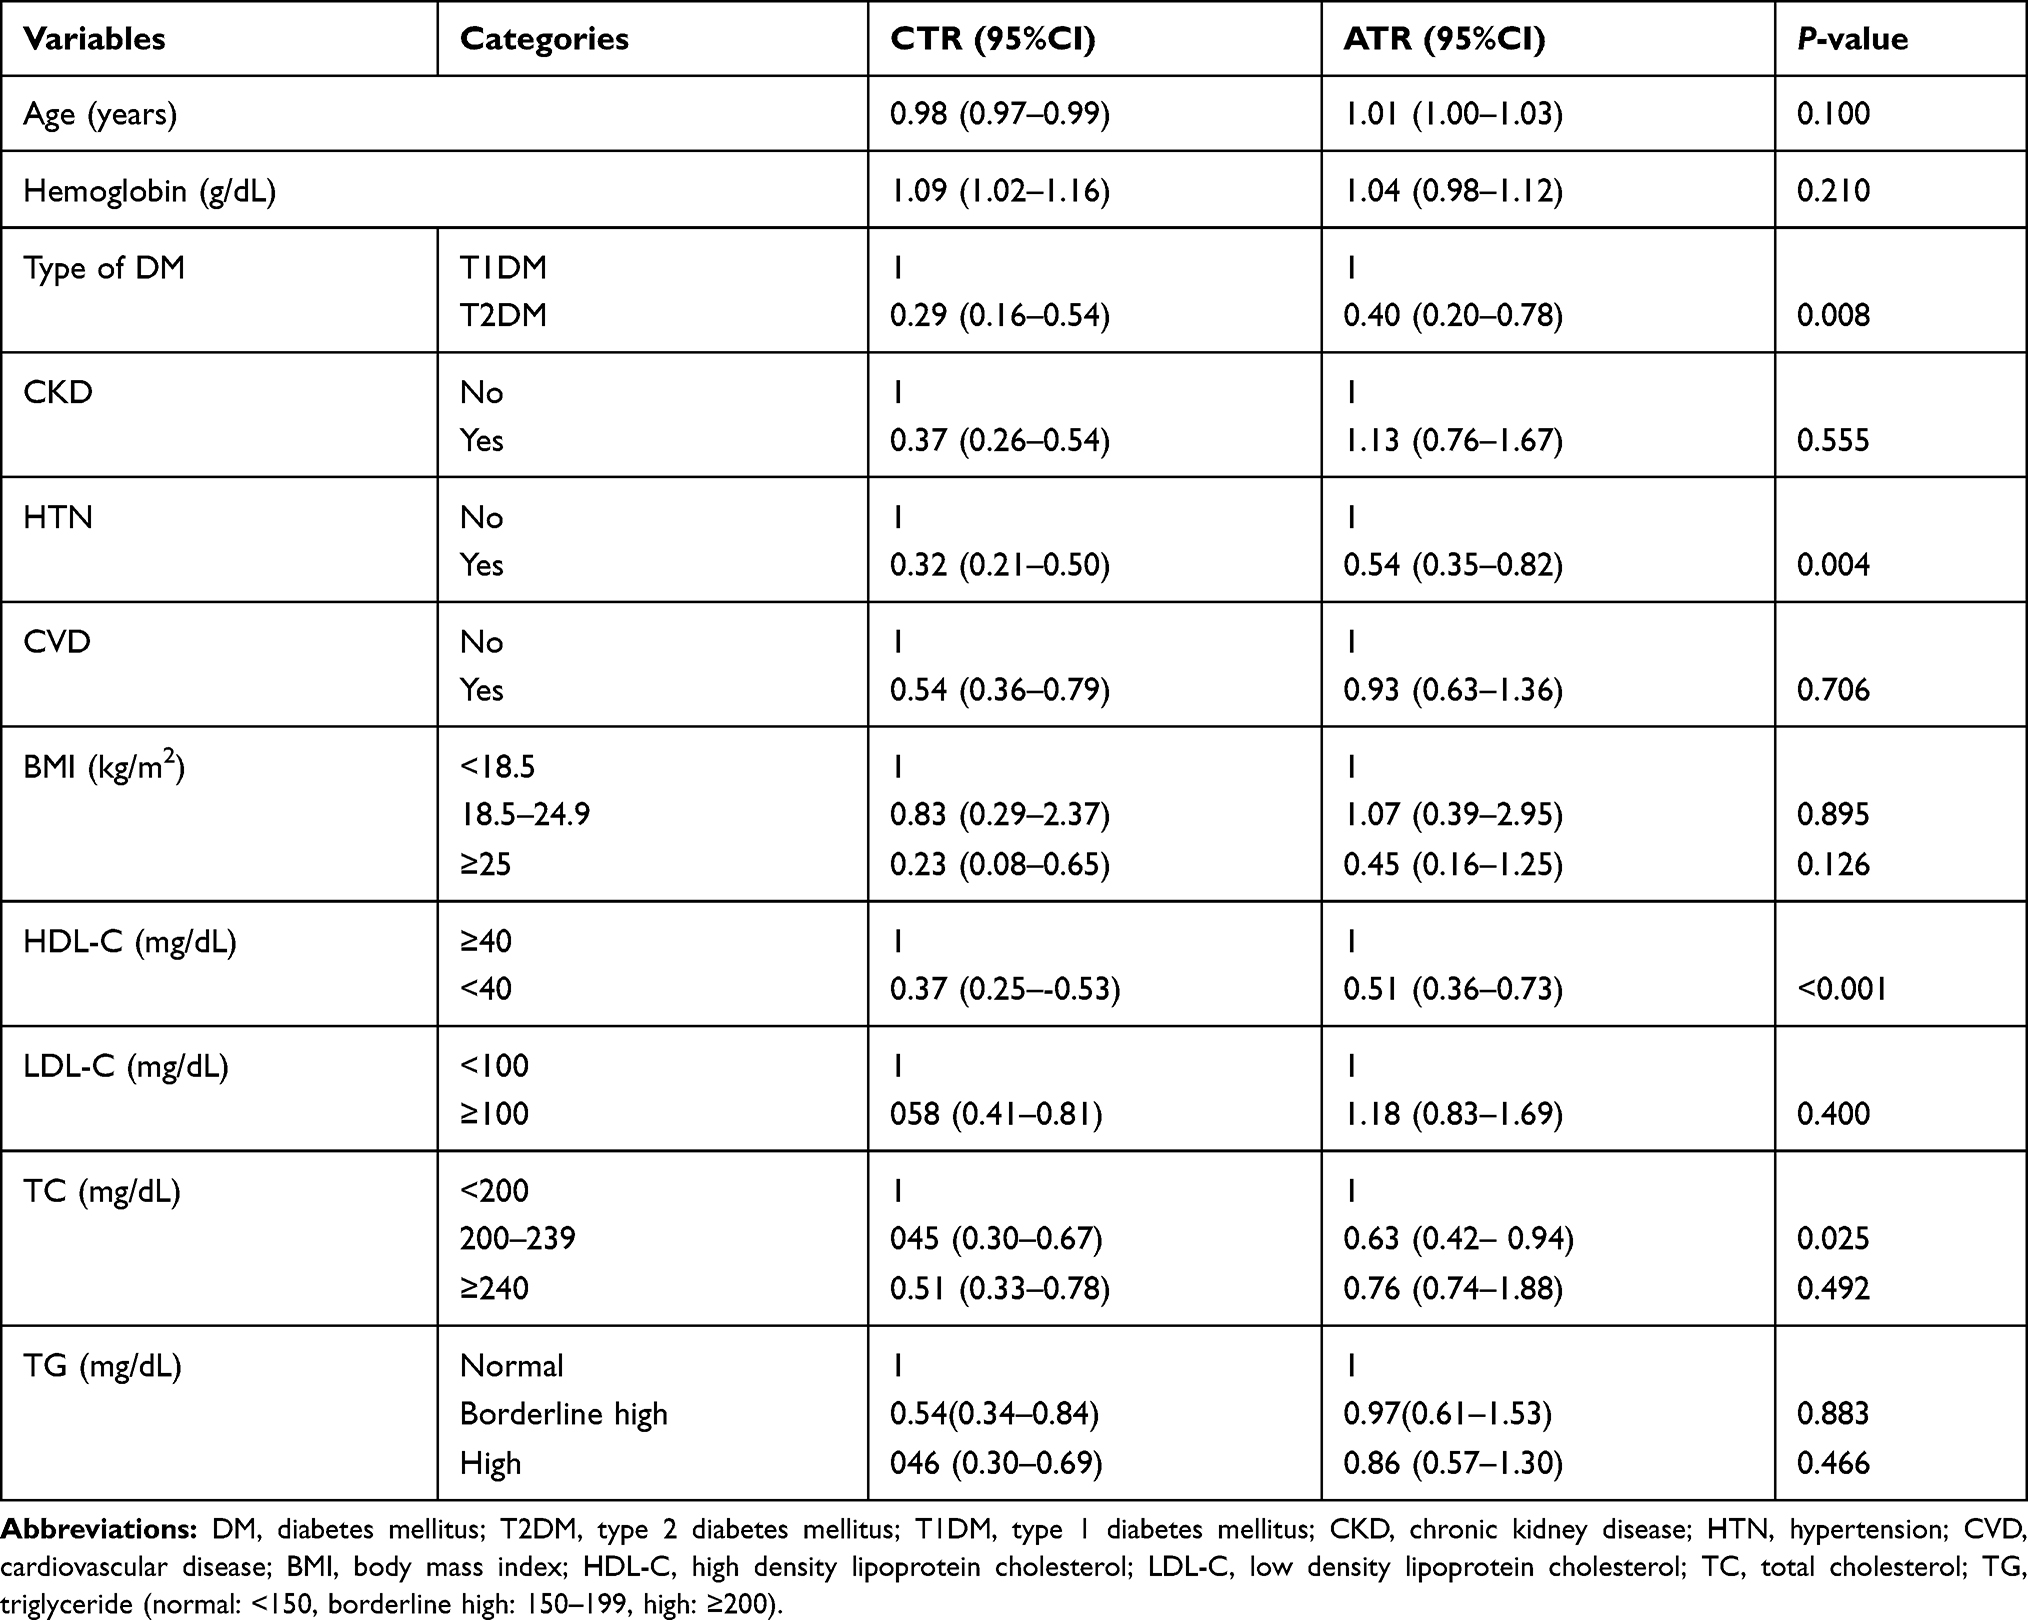 |
Table 3 Multivariable Weibull AFT Regression Model Analysis of Time to Diabetes Retinopathy and Its Predictors Among Diabetes Mellitus Patients, 2020 |
Discussion
According the current study, the incidence density of DR was 3.69 per 100 PY (95%CI: 2.97–4.59) or 3.08 per 1000 patient-months (95%CI: 2.48–3.83). Similarly, the overall cumulative incidence of DR was 20.15% with 95%CI: 16.50–24.37. A similar incidence of DR was observed from studies done in Tikur Anbessa Hospital, Addis Ababa (2.65 per 1000 PM)32 and southern parts of Ethiopia at Arbaminch General Hospital (3.6 per 100 PY)23 and Japan (38.3/1000 PY).33 This could be due to almost similar health service provided for the diabetic patients. For the study done in Japan the possible reason for comparable incidence of DR is that the follow-up period is almost similar, which was 8 years for Japan and 7.5 in our study. We found that incidence of DR was high compared to incidence previously reported in China,24 Spain,34 Australia,35 and another study in China,36 which reported 1.81/100 PY, 2.43/100PY, 14.4% and 15.16% of incidence respectively. All these studies were followed-up for a period of four to five years which is lower than the follow-up period of our study. However, the finding of the current study was lower than the reported previous studies done in England (36% of cumulative incidence after five years of follow-up),37 Kenya (22.47 per 100 PY after median follow-up period of 5.5 years with mean age of 62.7 years),22 Scotland (5.1/100 PY).38
Despite its insignificant effect in the multivariable model, our study found a correlation between DR and renal damage. This result is supported by the study conducted in Italy which depicted the relationship between albumin uric CKD and DR.39 This might be attributed to the close coexistence/link of microvascular and macrovascular complication of DM40 which is posing greater global burden for the economically weaker national health systems.
In our follow-up study, type of DM was a significant predictor of time to DR. Hence, the average disease-free survival time for T2DM patients was 0.40 times that of T1DM patients. This finding is analogous to the studies conducted at Ayder referral hospital41 and Tikur Anbessa Hospital32 in Ethiopia, which found that T2DM patients had higher risk of developing DR and other microvascular complications than T1DM patients. This could be due to the fact that most of the T2DM patients are older compared to T1DM patients. Furthermore, the age of onset of T2DM is decreasing nowadays and allowing enough duration of diabetes to develop microvascular complications.42 In contrast to our finding, Spanish43 and Scottish44 studies found that T1DM patients had a higher risk of developing DR than T2DM patients. The possible variation of these results could be due to differences in the study population. The Spanish study included all T1DM and T2DM aged 12 years and over at the start of the study (not at the date of diabetes diagnosis). But our study included patients aged 15 years and over at diagnosis, which may exclude a significant number of T1DM patients.
We also identified that patients with HTN had a 46% lower survival rate than patients who had no HTN, which is in keeping with several other studies.23,24,33,45,46 Those studies reported the increment in hazard ratio of DR among diabetic patients with HTN comorbidity. The innovative UK Prospective Diabetes Study had elucidated the importance of controlling blood pressure in patients with DR47 and the Hoorn study estimated double risk of DR among DM patients with HTN.48 This noticeable connection between HTN and DR may be clarified by the frequent clinical co-existence of HTN and diabetes.46 HTN might cause DR through morphological changes in the retinal vessels such as retinal hemorrhages, hard exudates and cotton-wool spots.49
Poor HDL-C was found to decelerate the time to DR in this study. After adjusting for the other factors, the time to develop DR among patients with HDL-C <40 mg/dL was significantly decreased by 49% (ATR=0.51) compared to patients with HDL-C ≥40 mg/dL. To our knowledge this was the first cohort study that showed the significant effect of HDL-C on survival time of DR among type 1 and 2 diabetic patients. The follow-up study regarding the association of HDL-C and incidence was very limited. But a crossectional survey in Democratic Republic of Congo revealed the significant U-shaped relationship between DR rates and HDL-C.50 In another observational study, a modest association was found for higher levels of HDL-C and decreased prevalence of proliferative DR.51 The reason could be HDL-C maintains the endothelial cells, and in doing so, prevents atherosclerosis, which is a pathological hallmark of microvascular complications of DM.52 However, various studies showed insignificant association between DR and HDL-C.3,48,53 Unlike the results of our study, findings from “NO BLIND Study Group” reported the novel association between high HDL-C and DR.54 The contribution of high HDL-C to the pathogenesis of DR is still not clear and the explanation of this association is beyond the scope of this study. Therefore, further studies are required to elucidate the mechanisms by which high HDL-C causes DR.
Furthermore, our study identified that diabetes patients with borderline high TC had a 37% lower survival time compared to DM patients with desirable TC. Even though the relationship between the serum lipids and DR was controversial, some preceding studies found that high TC was associated with incidence of DR.24,55 The possible reason could be due to lipid-induced arteriosclerotic changes that principally accounted for the pathology of DR.56
Limitations of the Study
Despite its strength the current study had some limitations. Because of the retrospective nature of the study, lack of full records on behavioral factors like smoking, physical exercise, treatment adherence, and lack of information on some common drugs in the diabetic patient, such as aspirin from the medical charts may underestimate the effects and subject variations in the development of incidence of DR. Even though the study was conducted in the largest national medical center in the country for DM follow-up, the findings might not be representative of the diabetes population in the country because of possible selection bias.
Conclusion
In conclusion, DR among patients with T1DM and T2DM accounted for 9.66 and 50.42 per 1000 PY, respectively and it is becoming a public health burden in Ethiopia. Our findings suggest that T2DM, low HDL-C, HTN and borderline high TC independently predict an increased incidence/decreased survival time of DR among T1DM and T2DM. Modifiable risk factors like low HDL-C, HTN, and high TC should be managed aggressively along with diabetes. We recommend further prospective studies using primary data, which includes by including variables that were unavailable from the medical charts.
Abbreviations
ATR, adjusted time ratio; AIC, Akaike information criterion; BMI, body mass index; CTR, crude time ratio; CKD, chronic kidney disease; CVD, cardiovascular disease; DM, diabetes mellitus; HDL-C, high-density lipoprotein cholesterol; HTN, hypertension; LDL-C, low-density lipoprotein cholesterol; OHA, oral hypoglycemic agent; PY, person years; SSA, Sub-Saharan African; TG, triglyceride; T1DM, type 1 diabetes mellitus; T2DM, type 2 diabetes mellitus; VTDR, visual threatening Diabetic retinopathy.
Data Sharing Statement
Data will be available from the corresponding author upon request.
Ethics Approval and Informed Consent
Ethical clearance and letter of cooperation for Jimma University Medical Center were obtained from the Institutional Review Board of the University of Gondar. Waiver letter was obtained from the medical director of the hospitals in order to access medical records of patients. Confidentiality during all phases of research activities was kept and data were held on a secure password-protected system. This study was conducted in accordance with the Declaration of Helsinki.
Acknowledgments
Our gratitude goes to the University of Gondar, College of Health and Medical Sciences for all necessary services and we appreciate the support from the hospital's administrations and data collector.
Author Contributions
All authors equally contributed to conception, design of the study, acquisition of data supervision of data collection, analysis and interpretation, drafting or revising the article, have agreed on the journal to which the article will be submitted, gave final approval of the version to be published, and agree to be accountable for all aspects of the work.
Funding
The University of Gondar has covered the costs of data collectors and supervisors per diem. However, the university had no role in the study design, data collections, and analysis, decision to publish, or preparation of the manuscript.
Disclosure
The authors report no conflicts of interest in this work.
References
1. Patel V, Rassam S, Newsom R, Wiek J, Kohner E. Retinal blood flow in diabetic retinopathy. Br Med J. 1992;305(6855):678–683. doi:10.1136/bmj.305.6855.678
2. Frank RN. Diabetic retinopathy and systemic factors. Middle East Afr J Ophthalmol. 2015;22(2):151. doi:10.4103/0974-9233.154388
3. Ahmed KR, Karim MN, Bhowmik B, et al. Incidence of diabetic retinopathy in Bangladesh: a 15‐year follow‐up study. J Diabetes. 2012;4(4):386–391. doi:10.1111/j.1753-0407.2012.00208.x
4. Internation Diabetes Federation. IDF Diabetes Atlas.
5. Fong DS, Aiello L, Gardner TW, et al. Retinopathy in diabetes. Diabetes Care. 2004;27(suppl 1):s84–s7. doi:10.2337/diacare.27.2007.S84
6. Crawford TN, Alfaro III DV, Kerrison JB, Jablon EP. Diabetic retinopathy and angiogenesis. Curr Diabetes Rev. 2009;5(1):8–13. doi:10.2174/157339909787314149
7. Chiefari E, Ventura V, Capula C, et al. A polymorphism of HMGA1 protects against proliferative diabetic retinopathy by impairing HMGA1-induced VEGFA expression. Sci Rep. 2016;6(1):1–11. doi:10.1038/srep39429
8. Roglic G. WHO Global report on diabetes: a summary. Int J Noncommun Dis. 2016;1(1):3. doi:10.4103/2468-8827.184853
9. Ogurtsova K, da Rocha Fernandes J, Huang Y, et al. IDF Diabetes Atlas: global estimates for the prevalence of diabetes for 2015 and 2040. Diabetes Res Clin Pract. 2017;128:40–50. doi:10.1016/j.diabres.2017.03.024
10. World Health Organization. TADDS: tool for the assessment of diabetic retinopathy and diabetes management systems; 2015.
11. Saaddine JB, Honeycutt AA, Narayan KV, Zhang X, Klein R, Boyle JP. Projection of diabetic retinopathy and other major eye diseases among people with diabetes mellitus: united States, 2005–2050. Arch Ophthalmol. 2008;126(12):1740–1747. doi:10.1001/archopht.126.12.1740
12. Sabanayagam C, Banu R, Chee ML, et al. Incidence and progression of diabetic retinopathy: a systematic review. Lancet Diabetes Endocrinol. 2019;7(2):140–149. doi:10.1016/S2213-8587(18)30128-1
13. Burgess P, MacCormick I, Harding S, Bastawrous A, Beare N, Garner P. Epidemiology of diabetic retinopathy and maculopathy in Africa: a systematic review. Diabetic Med. 2013;30(4):399–412. doi:10.1111/j.1464-5491.2012.03756.x
14. Burgess PI, Harding SP, García-Fiñana M, Beare NA, Msukwa G, Allain TJ. First prospective cohort study of diabetic retinopathy from sub-Saharan Africa: high incidence and progression of retinopathy and relationship to human immunodeficiency virus infection. Ophthalmology. 2016;123(9):1919–1925. doi:10.1016/j.ophtha.2016.05.042
15. Gonder JR, Walker VM, Barbeau M, et al. Costs and quality of life in diabetic macular edema: canadian burden of diabetic macular edema observational study (C-REALITY). J Ophthalmol. 2014;2014:1–9. doi:10.1155/2014/939315
16. Fite RO, Lake EA, Hanfore LK. Diabetic retinopathy in Ethiopia: a systematic review and meta-analysis. Diabetes Metab Syndr. 2019;13(3):1885–1891. doi:10.1016/j.dsx.2019.04.016
17. Pezzullo L, Streatfeild J, Simkiss P, Shickle D. The economic impact of sight loss and blindness in the UK adult population. BMC Health Serv Res. 2018;18(1):63. doi:10.1186/s12913-018-2836-0
18. Bunce C, Wormald R. Leading causes of certification for blindness and partial sight in England & Wales. BMC Public Health. 2006;6(1):58. doi:10.1186/1471-2458-6-58
19. Resnikoff S, Pascolini D, Etya’Ale D, et al. Global data on visual impairment in the year 2002. Bull World Health Organ. 2004;82:844–851. doi:10.1590/S0042-96862004001100009
20. Bourne RR, Stevens GA, White RA, et al. Causes of vision loss worldwide, 1990–2010: a systematic analysis. Lancet Global Health. 2013;1(6):e339–e49. doi:10.1016/S2214-109X(13)70113-X
21. Pascolini D, Mariotti SP. Global estimates of visual impairment: 2010. Br J Ophthalmol. 2012;96(5):614–618. doi:10.1136/bjophthalmol-2011-300539
22. Bastawrous A, Mathenge W, Wing K, et al. The incidence of diabetes mellitus and diabetic retinopathy in a population-based cohort study of people age 50 years and over in Nakuru, Kenya. BMC Endocr Disord. 2017;17(1):19. doi:10.1186/s12902-017-0170-x
23. Chisha Y, Terefe W, Assefa H. Incidence and factors associated with diabetic retinopathy among diabetic patients at arbaminch general hospital, gamo gofa Zone (longitudinal follow up data analysis). J Diabetol. 2017;8(1). doi:10.4103/jod.jod_6_17
24. Liu L, Wu J, Yue S, et al. Incidence density and risk factors of diabetic retinopathy within type 2 diabetes: a five-year cohort study in China (Report 1). Int J Environ Res Public Health. 2015;12(7):7899–7909. doi:10.3390/ijerph120707899
25. Abu samra K, Al-Bdour MI, Al-Till KMA. Risk factors for diabetic retinopathy among Jordanian diabetics. Middle East Afr J Ophthalmol. 2008;15(2):77. doi:10.4103/0974-9233.51997
26. Ismail-Beigi F, Craven T, Banerji MA, et al. Effect of intensive treatment of hyperglycaemia on microvascular outcomes in type 2 diabetes: an analysis of the ACCORD randomised trial. Lancet. 2010;376(9739):419–430. doi:10.1016/S0140-6736(10)60576-4
27. Lachin JM, Genuth S, Nathan DM, Zinman B, Rutledge BN. Effect of glycemic exposure on the risk of microvascular complications in the diabetes control and complications trial—revisited. Diabetes. 2008;57(4):995–1001. doi:10.2337/db07-1618
28. Schoenfeld DA. Sample-size formula for the proportional-hazards regression model. Biometrics. 1983;39:499–503. doi:10.2307/2531021
29. Wilkinson CP, Ferris FL
30. WHO. Physical status: the use and interpretation of anthropometry. Report of a WHO Expert Committee. Geneva; World Health Organization technical report series; 1995;854:1–452.
31. WHO. Diagnosis and management for patients with hypertension: noncommunicable disease education manual for primary health care professionals and patients; 2017.
32. Azeze TK, Sisay MM, Zeleke EG. Incidence of diabetes retinopathy and determinants of time to diabetes retinopathy among diabetes patients at Tikur Anbessa Hospital, Ethiopia: a retrospective follow up study. BMC Res Notes. 2018;11(1):542. doi:10.1186/s13104-018-3660-7
33. Kawasaki R, Tanaka S, Tanaka S, et al. Incidence and progression of diabetic retinopathy in Japanese adults with type 2 diabetes: 8 year follow-up study of the Japan Diabetes Complications Study (JDCS). Diabetologia. 2011;54(9):2288–2294. doi:10.1007/s00125-011-2199-0
34. Salinero-Fort MA, San Andres-Rebollo FJ, de Burgos-lunar C, Arrieta-Blanco FJ, Gomez-Campelo P, Group M. Four-year incidence of diabetic retinopathy in a Spanish cohort: the MADIABETES study. PLoS One. 2013;8(10):e76417. doi:10.1371/journal.pone.0076417
35. Cikamatana L, Mitchell P, Rochtchina E, Foran S, Wang JJ. Five-year incidence and progression of diabetic retinopathy in a defined older population: the Blue Mountains Eye Study. Eye. 2007;21(4):465–471. doi:10.1038/sj.eye.6702771
36. Song H, Liu L, Sum R, Fung M, Yap MK. Incidence of diabetic retinopathy in a Hong Kong Chinese population. Clin Exp Optom. 2011;94(6):563–567. doi:10.1111/j.1444-0938.2011.00628.x
37. Jones CD, Greenwood RH, Misra A, Bachmann MO. Incidence and progression of diabetic retinopathy during 17 years of a population-based screening program in England. Diabetes Care. 2012;35(3):592–596. doi:10.2337/dc11-0943
38. Looker H, Nyangoma S, Cromie D, et al. Predicted impact of extending the screening interval for diabetic retinopathy: the Scottish Diabetic Retinopathy Screening programme. Diabetologia. 2013;56(8):1716–1725. doi:10.1007/s00125-013-2928-7
39. Sasso FC, Pafundi PC, Gelso A, et al. Relationship between albuminuric CKD and diabetic retinopathy in a real-world setting of type 2 diabetes: findings from No blind study. Nutr Metab Cardiovasc Dis. 2019;29(9):923–930. doi:10.1016/j.numecd.2019.05.065
40. Minutolo R, Gabbai FB, Provenzano M, et al. Cardiorenal prognosis by residual proteinuria level in diabetic chronic kidney disease: pooled analysis of four cohort studies. Nephrol Dialysis Transpl. 2018;33(11):1942–1949. doi:10.1093/ndt/gfy032
41. Berihun L, Muluneh EK. Correlates of time to microvascular complications among diabetes mellitus patients using parametric and non-parametric approaches: a case study of Ayder referral hospital, Ethiopia. Ethiopian J Sci Technol. 2017;10(1):65–80. doi:10.4314/ejst.v10i1.5
42. Koopman RJ, Mainous AG, Diaz VA, Geesey ME. Changes in age at diagnosis of type 2 diabetes mellitus in the United States, 1988 to 2000. Ann Family Med. 2005;3(1):60–63. doi:10.1370/afm.214
43. Romero-Aroca P, Navarro-Gil R, Valls-Mateu A, Sagarra-Alamo R, Moreno-Ribas A, Soler N. Differences in incidence of diabetic retinopathy between type 1 and 2 diabetes mellitus: a nine-year follow-up study. Br J Ophthalmol. 2017;101(10):1346–1351. doi:10.1136/bjophthalmol-2016-310063
44. Looker H, Nyangoma S, Cromie D, et al. Rates of referable eye disease in the Scottish national diabetic retinopathy screening programme. Br J Ophthalmol. 2014;98(6):790–795. doi:10.1136/bjophthalmol-2013-303948
45. Broe R, Rasmussen ML, Frydkjaer-Olsen U, et al. The 16-year incidence, progression and regression of diabetic retinopathy in a young population-based Danish cohort with type 1 diabetes mellitus: the Danish cohort of pediatric diabetes 1987 (DCPD1987). Acta Diabetol. 2014;51(3):413–420. doi:10.1007/s00592-013-0527-1
46. Wat N, Wong RLM, Wong IYH. Associations between diabetic retinopathy and systemic risk factors. Hong Kong Med J. 2016. doi:10.12809/hkmj164869
47. Matthews DR, Stratton IM, Aldington SJ, Holman RR, Kohner EM; Group UPDS. Risks of progression of retinopathy and vision loss related to tight blood pressure control in type 2 diabetes mellitus: UKPDS 69. Arch Ophthalmol. 2004;122(11):1631.
48. van Leiden HA, Dekker JM, Moll AC, et al. Risk factors for incident retinopathy in a diabetic and nondiabetic population: the Hoorn study. Arch Ophthalmol. 2003;121(2):245–251. doi:10.1001/archopht.121.2.245
49. Tomić M, Ljubić S, Kaštelan S, Gverović Antunica A, Jazbec A, Poljičanin T. Inflammation, haemostatic disturbance, and obesity: possible link to pathogenesis of diabetic retinopathy in type 2 diabetes. Mediators Inflamm. 2013;2013:1–10. doi:10.1155/2013/818671
50. Longo-Mbenza B, Muaka MM, Gombet T, Phemba IL, Cook S, Mengome EM. Associations of high density lipoprotein cholesterol and framingham cardiovascular risk with diabetic retinopathy in african type 2 diabetics. World J Cardiovasc Dis. 2014;2014.
51. Klein BE, Myers CE, Howard KP, Klein R. Serum lipids and proliferative diabetic retinopathy and macular edema in persons with long-term type 1 diabetes mellitus: the wisconsin epidemiologic study of diabetic retinopathy. JAMA Ophthalmol. 2015;133(5):503–510. doi:10.1001/jamaophthalmol.2014.5108
52. Rye K-A, Barter PJ. Cardioprotective functions of HDLs. J Lipid Res. 2014;55(2):168–179. doi:10.1194/jlr.R039297
53. Ra H, Yoo JH, Ban WH, et al. Predictors for diabetic retinopathy in normoalbuminuric people with type 2 diabetes mellitus. Diabetol Metab Syndr. 2012;4(1):29. doi:10.1186/1758-5996-4-29
54. Sasso FC, Pafundi PC, Gelso A, et al. High HDL cholesterol: a risk factor for diabetic retinopathy? Findings from NO BLIND study. Diabetes Res Clin Pract. 2019;150:236–244. doi:10.1016/j.diabres.2019.03.028
55. Hussain S, Qamar MR, Iqbal MA, Ahmed A, Ullah E. Risk factors of retinopathy in type 2 diabetes mellitus at a tertiary care hospital, Bahawalpur Pakistan. Pakistan J Med Sci. 2013;29(2). doi:10.12669/pjms.292.3066
56. Klein R, Sharrett AR, Klein BE, et al. The association of atherosclerosis, vascular risk factors, and retinopathy in adults with diabetes: the atherosclerosis risk in communities study. Ophthalmology. 2002;109(7):1225–1234. doi:10.1016/S0161-6420(02)01074-6
 © 2021 The Author(s). This work is published and licensed by Dove Medical Press Limited. The full terms of this license are available at https://www.dovepress.com/terms.php and incorporate the Creative Commons Attribution - Non Commercial (unported, v3.0) License.
By accessing the work you hereby accept the Terms. Non-commercial uses of the work are permitted without any further permission from Dove Medical Press Limited, provided the work is properly attributed. For permission for commercial use of this work, please see paragraphs 4.2 and 5 of our Terms.
© 2021 The Author(s). This work is published and licensed by Dove Medical Press Limited. The full terms of this license are available at https://www.dovepress.com/terms.php and incorporate the Creative Commons Attribution - Non Commercial (unported, v3.0) License.
By accessing the work you hereby accept the Terms. Non-commercial uses of the work are permitted without any further permission from Dove Medical Press Limited, provided the work is properly attributed. For permission for commercial use of this work, please see paragraphs 4.2 and 5 of our Terms.