")
Back to Journals » Clinical Epidemiology » Volume 9
Incidence of diabetes and its mortality according to body mass index in South Koreans aged 40–79 years
Authors Jung HH , Park JI , Jeong JS
Received 20 July 2017
Accepted for publication 30 October 2017
Published 7 December 2017 Volume 2017:9 Pages 667—678
DOI https://doi.org/10.2147/CLEP.S146860
Checked for plagiarism Yes
Review by Single anonymous peer review
Peer reviewer comments 4
Editor who approved publication: Professor Vera Ehrenstein
Hae Hyuk Jung, Ji In Park, Jin Seon Jeong
Department of Medicine, Kangwon National University Hospital, Kangwon National University School of Medicine, Chuncheon, Gangwon-do, South Korea
Purpose: The purpose of this study was to assess diabetes incidence and all-cause mortality according to baseline body mass index (BMI) and to compare relative risks of mortality associated with incident diabetes across various BMI classes in a cohort of South Korean adults.
Patients and methods: Based on data from the National Health Insurance database of Korean individuals aged 40–79 years without preexisting diabetes, we calculated BMI at the baseline health examination. We estimated the relative risk of mortality associated with incident diabetes using time-dependent Cox models and considering the time of diabetes diagnosis.
Results: We noted 29,307 incident diabetes cases and 22,940 deaths during an 8-year follow-up of the initial cohort (n=436,692) and 73,756 incident diabetes cases and 57,556 deaths during a 10-year follow-up of the replication cohort (n=850,282). Regarding all-cause mortality, time-dependent Cox models revealed statistically significant interactions between diabetes status and baseline BMI class (P=0.018 and P<0.001 in the initial and replication cohorts, respectively). In separately conducted analyses for each BMI class, diabetes-associated relative risks for BMI values of 16.0–18.4, 18.5–22.9, 23.0–24.9, 25.0–29.9, and 30.0–34.9 kg/m2 were 1.50 (95% confidence interval [CI], 1.09–2.07), 1.39 (95% CI, 1.26–1.54), 1.20 (95% CI, 1.08–1.35), 1.18 (95% CI, 1.07–1.30), and 0.97 (95% CI, 0.74–1.28) in the initial cohort, and 1.44 (95% CI, 1.18–1.74), 1.33 (95% CI, 1.26–1.41), 1.24 (95% CI, 1.16–1.31), 1.11 (95% CI, 1.05–1.17), and 0.99 (95% CI, 0.85–1.16) in the replication cohort. The increasing trend of relative risk with decreasing BMI persisted mostly among subgroups stratified according to age or sex and smoking status.
Conclusion: Incident diabetes was associated with a greater increase in all-cause mortality risk in adults with lower BMI relative to those with higher BMI. This emphasizes the importance of treatment and prevention of type 2 diabetes among normal weight or underweight adults, particularly in Asia.
Keywords: body mass index, diabetes mellitus, mortality, cohort study
Plain language summary
Why was the study done? This study was conducted to determine whether incident diabetes differentially affects mortality depending on the body weight status.
What did the researchers do and find? Incident diabetes was associated with a greater increase in the risk of death among adults with a lower body mass index (BMI) relative to those with a higher BMI in both initial and replication cohort studies involving 436,692 and 850,282 Korean individuals, respectively.
What do these results mean? Development of type 2 diabetes has a more harmful effect on mortality in normal weight or underweight adults than in overweight or obese adults.
Introduction
The prevalence of type 2 diabetes is rapidly increasing in Asian populations. Although increased body weight is a strong risk factor for type 2 diabetes, Asians exhibit a greater prevalence of diabetes at a relatively lower body mass index (BMI), compared to Caucasians.1,2 A longitudinal Chinese study reported a twofold higher risk of mortality among patients with prevalent diabetes (mean BMI: 24.9±5.2 kg/m2) relative to those without diabetes3 and thus confirmed the well-known association of diabetes with excess mortality. However, a study based on the Swedish National Diabetes Register observed an overall hazard ratio for death of 1.15 among patients with prevalent diabetes (mean BMI: 29.6±5.3 kg/m2), compared with controls from the general population. In that study, the hazard ratio varied markedly depending on age, glycated hemoglobin levels, and comorbidities,4 but it remained unclear why diabetes-related mortality was much greater among the Chinese than Europeans. Studies involving patients with prevalent diabetes might be influenced by differences in baseline characteristics between patients, including the diabetes duration and related complications.
The association between body weight and mortality in patients with type 2 diabetes remains unresolved. Some studies involving diabetic patients have suggested higher mortality among normal weight patients versus overweight or obese patients.5,6 In a US study involving 2,625 patients with incident diabetes, the hazard ratios for all-cause and cardiovascular mortality were 2.08 and 1.52, respectively, among normal weight patients (BMI: 18.5–24.9 kg/m2) compared with overweight or obese patients (BMI: ≥25.0 kg/m2).5 In contrast, a recent study involving 11,427 patients with incident diabetes yielded a J-shaped association between BMI and mortality wherein the lowest mortality rates were observed at BMI values of 23.0–24.9 kg/m2.7 Furthermore, studies evaluating the additive effects of diabetes and metabolic syndrome on patient outcomes have reported inconsistent results. Some studies have shown that the comorbidity of diabetes and metabolic syndrome has a small or no additive effect on cardiovascular mortality, although both the conditions are individually and substantially associated with an increased risk.8–10 Hence, it remains unclear whether incident diabetes has an additive effect on mortality among obese individuals, despite being very likely among underweight or normal weight individuals. However, to the best of our knowledge, no study has demonstrated whether the influence of incident diabetes on mortality is dependent on body weight status.
In the present study, we assessed the diabetes incidence and all-cause mortality according to baseline BMI and compared the relative risks of mortality associated with incident diabetes across various BMI classes in a cohort of South Korean adults registered in the National Health Insurance Service-Health Screening (NHIS-HS) database (2002–2013). These analyses were additionally replicated using the customized National Health Information Database (NHID).
Materials and methods
Subjects
The NHID refers to the public database on health information for the whole population of South Korea, which is formed and maintained by the National Health Insurance Service (NHIS).11 The database covers data from 2002 onwards and includes the reimbursement records of the NHIS as well as the results of the nationwide health examinations generally performed at 2-year intervals (Supplementary materials). Details on the NHID, including data resource profile, lists of database variables, and health examination details are published elsewhere.12,13
The NHIS-HS database (2002–2013) comprises population-based cohort data, which have been established using the NHID and are available for research or statistical purposes from the NHIS.11 A total of 514,866 participants were randomly selected from among 5.15 million citizens aged 40–79 years who had undergone at least one national health examination during 2002–2003 and were followed up until December 31, 2013.
We assessed the type 2 diabetes and all-cause mortality incidences throughout the study period according to weight status. In addition to 516 participants excluded because of missing height or weight data, the following were excluded to avoid confounding of the mortality risk caused by a missing diagnosis of diabetes or preexisting conditions: 34,967 participants with diabetes, heart disease, stroke, or cancer reported during baseline examinations and 41,535 participants who developed diabetes or died before January 1, 2006. We also excluded 542 severely underweight participants (baseline BMI: <16.0 kg/m2) and 614 participants with class II or III obesity (BMI: ≥35.0 kg/m2). The final analysis included 436,692 participants (Figure 1A).
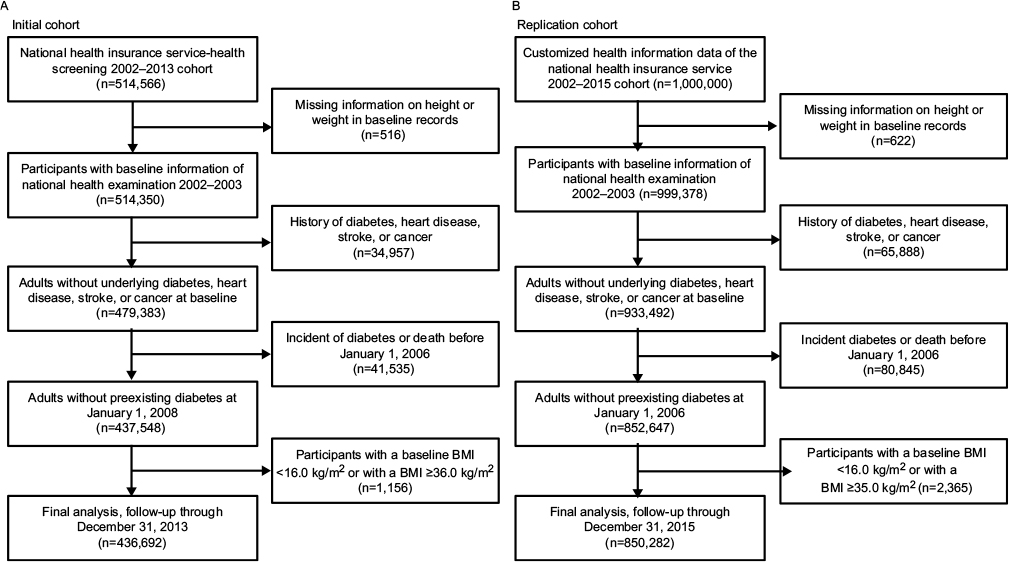 | Figure 1 Flow charts of participants of the National Health Insurance Service-Health Screening between 2002 and 2013 (A) and the Customized Health Information Data between 2002 and 2015 (B). |
To confirm the findings of the initial cohort, we constructed the replication cohort using the customized NHID. Currently, the customized NHID is provided to researchers after extraction and modification of data as requested. A total of 1 million participants were also randomly selected from the 5.15 million adults aged 40–79 years who had undergone health examination during 2002–2003.14 Stochastically, about 10% of all participants were selected in both the initial and the replication cohorts. We followed this cohort through December 31, 2015, and collected NHIS reimbursement data and health examination results. After excluding 149,718 participants using the criteria described above, 850,282 participants were included in the final analysis (Figure 1B).
All identifying subject information was removed prior to data collection. The requirement for informed consent was waived because this study collected routinely recorded data. The Institutional Review Board of Kangwon National University Hospital approved the present study (IRB File No. KNUH-2017-02-010).
Weight status and covariates
Baseline BMI values measured during 2002–2003 were divided into five classes (mildly–moderately underweight, 16.0–18.4 kg/m2; low-normal weight, 18.5–22.9 kg/m2; high-normal weight, 23.0–24.9 kg/m2, overweight, 25.0–29.9 kg/m2; and class I obesity, 30.0–34.9 kg/m2) and subdivided into eight categories (16.0–18.4, 18.5–19.9, 20.0–22.9, 23.0–24.9, 25.0–27.4, 27.5–29.9, 30.0–32.4, and 32.5–34.9 kg/m2) according to the WHO classification with additional cutoff points.15 We used the BMI category of 23.0–24.9 kg/m2, which included the median BMI of the study population, as a reference.
Baseline covariates were determined from the records of health examinations performed during 2002–2003. The average amount of alcohol consumption was estimated as an approximate value using answers to questionnaires (drinking frequency: ≤1/month, 2–3/month, 1–2/week, 3–4/week, and almost every day; and alcohol consumption on a single occasion: ≤0.5 bottle, 1 bottle, 1.5 bottles, and ≥2 bottles of Soju, the most widely consumed alcoholic beverage in Korea), on the assumption of 60 g alcohol per bottle of Soju. Income levels were determined by income-based insurance contributions during 2002–2003. The variables were formatted and classified into consistent 5-year age categories (40–44, 45–49, 50–54, 55–59, 60–64, 65–69, 70–74, or 75–79 years), sex (male or female), income level (high 30%, middle 40%, or low 30%), family history of diabetes (no or yes), physical exercise frequency (<1, 1–2, 3–4, or ≥5 days per week), smoking status (never, former, or current smoker), and alcohol consumption (men: <1, 1–4, 5–29, or ≥30 g per day; women: <1, 1–4, 5–14, or ≥15 g per day). Non-respondent categories were included for all variables.
Follow-up
Diabetes occurrence was confirmed using NHIS reimbursement records and blood glucose levels measured during biennial health examinations. We retrieved information about antidiabetic drugs from NHIS reimbursement records using NHIS Billing Codes (Supplementary materials). Diabetes mellitus was considered in cases with at least 90 total prescription days of insulin and oral hypoglycemic agents or fasting glucose levels ≥126 mg/dL at least twice during biennial blood tests. The time of diabetes onset was defined as either the first day of fasting glucose ≥126 mg/dL or the day of the first prescription of antidiabetic drugs, whichever occurred first.
The primary outcome, mortality, was confirmed throughout the follow-up using data from Statistics Korea and the NHIS database. We confirmed mortality in the initial cohort using death certificates from Statistics Korea, which were included in the NHIS-HS (2002–2013) database. Death certificates were identified using the personal identification numbers assigned to residents of Korea at birth, which were replaced with de-identified join keys. The causes of death on death certificates were coded using the International Classification of Diseases, 10th Revision. The NHIS database, including information about the date but not cause of death, was used to confirm mortality in the replication cohort.
Coronary revascularization procedures were confirmed using the NHIS reimbursement data. We captured information about procedures using NHIS Billing Codes (Supplementary materials). For some participants who repeatedly underwent coronary revascularization procedures, the day of the first procedure during the follow-up was used to calculate time to event in Cox models. We used a composite of cardiovascular death and coronary revascularization as a secondary outcome measure in the initial cohort and coronary revascularization alone as the secondary outcome in the replication cohort.
Statistical analysis
Hazard ratios for incident diabetes across the eight BMI categories were estimated using Cox regression models. Analyses were adjusted for the baseline characteristics of age, sex, family history of diabetes, income level, physical exercise, smoking status, and alcohol consumption. Stratified analyses were performed according to sex and smoking status (men who smoked/never smoked and women who never smoked) or age at baseline (40–59 and 60–79 years).
Survival was analyzed including information of the time of diabetes diagnosis. We performed time-dependent Cox regression analyses to account for transitions of some participants from non-diabetic to diabetic status during follow-up. The diabetes status split at the time of diagnosis was included as a time-dependent covariate. The analyses were conducted for all participants combined, including or excluding the interaction terms of “diabetes status” and “BMI class” to the main effects model, and were performed separately in five BMI classes to assess the effect modification of baseline BMI on the association between incident diabetes and mortality. We performed subgroup analyses stratified according to sex and smoking status or age at the baseline. All analyses were adjusted for the baseline characteristics of age, sex, family history of diabetes, income level, physical exercise, smoking, and alcohol consumption.
In addition, we estimated 1-year mortality rates according to diabetes status and baseline BMI. To do that, we re-estimated the relative risks of mortality compared to the reference group (participants without diabetes and a BMI of 23.0–24.9 kg/m2), entering the variable with 10 status combining two diabetes status and five BMI classes as a time-dependent covariate in Cox models. To obtain uniformly age-standardized mortality rates in person-years, we multiplied the relative risks by the mean of the eight age-specific mortality rates of the reference group. Age-specific mortality rates were obtained by dividing the number of deaths by the number of person-years of outcome observation. The number of deaths and person-years were separately calculated according to diabetes status even in participants who developed incident diabetes.
We also analyzed diabetes-associated mortality in models that included participants who reported having diabetes or developed diabetes before 2006, to assess whether prevalent diabetes affects mortality differently from incident diabetes. We analyzed cardiovascular event rates as the secondary outcome and repeated the analyses in models further adjusted for time-averaged (continuous) values of blood pressure and serum cholesterol. In addition, we analyzed hazard ratios for all-cause mortality and cardiovascular events across baseline BMI categories in models with different covariate subsets.
Statistical analyses were performed using SAS (version 9.4; SAS Institute, Cary, NC, USA) and SPSS (version 23.0; IBM Corporation, Armonk, NY, USA); both the software packages were confirmed to yield the same results.
Results
Baseline characteristics of the study cohorts
Table 1 shows the baseline characteristics of the included participants. The respective median age and BMI were 50 years (interquartile range [IQR], 44–59 years) and 23.8 kg/m2 (IQR, 21.9–25.7 kg/m2) among the initial cohort participants and 50 years (IQR, 44–58 years) and 23.8 kg/m2 (IQR, 22.0–25.7 kg/m2) among the replication cohort participants. Compared with overweight or obese individuals, normal weight or underweight individuals had a higher proportion of current smokers. The lowest BMI class (16.0–18.4 kg/m2) had the highest proportions of older and sedentary individuals.
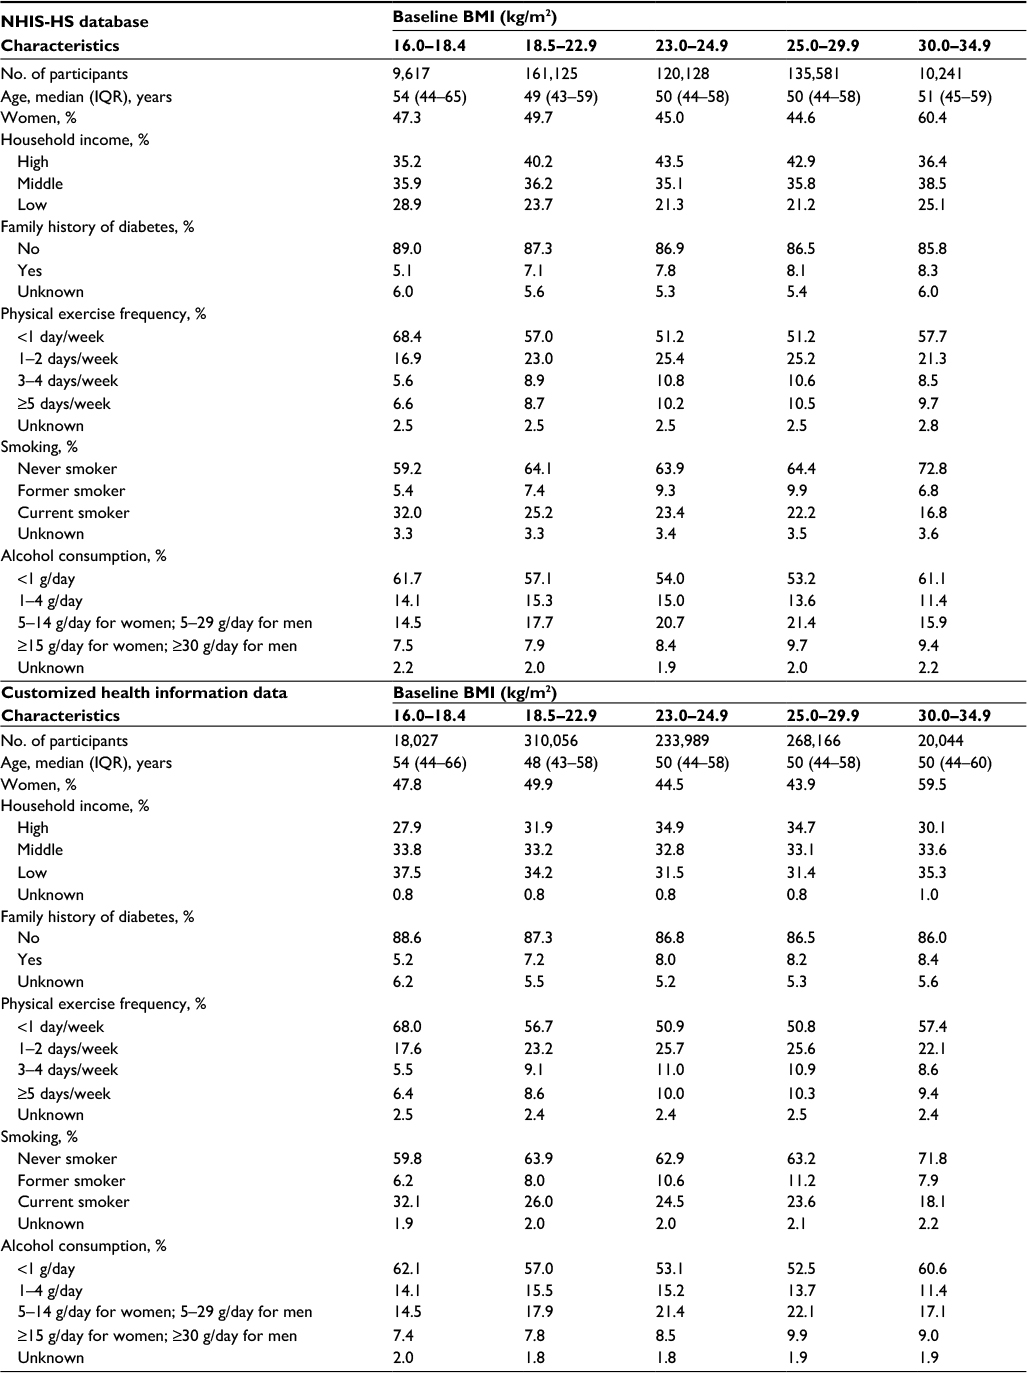 | Table 1 Baseline characteristics of the study participants according to baseline BMI Abbreviations: BMI, body mass index; NHIS-HS, National Health Insurance Service-Health Screening; IQR, interquartile range. |
Diabetes incidence across BMI categories
We evaluated the association between baseline BMI and diabetes incidence in participants without preexisting diabetes. Type 2 diabetes developed in 29,307 (6.7%) of 436,692 participants during the 8-year follow-up of the initial cohort and in 73,756 (8.7%) of 850,282 participants during the 10-year follow-up of the replication cohort. Among the 103,063 cases of incident diabetes, 47,713 (46.3%) occurred in normal weight or underweight participants (BMI, 16.0–24.9 kg/m2). Cox regression models adjusted for baseline characteristics showed that the incidence of diabetes increased progressively as the baseline BMI increased above 20, irrespective of sex and smoking status (Figure 2A and Supplementary materials). The increased risk of diabetes at higher BMIs was somewhat attenuated among elderly participants (age at baseline, 60–79 years; Figure 2B).
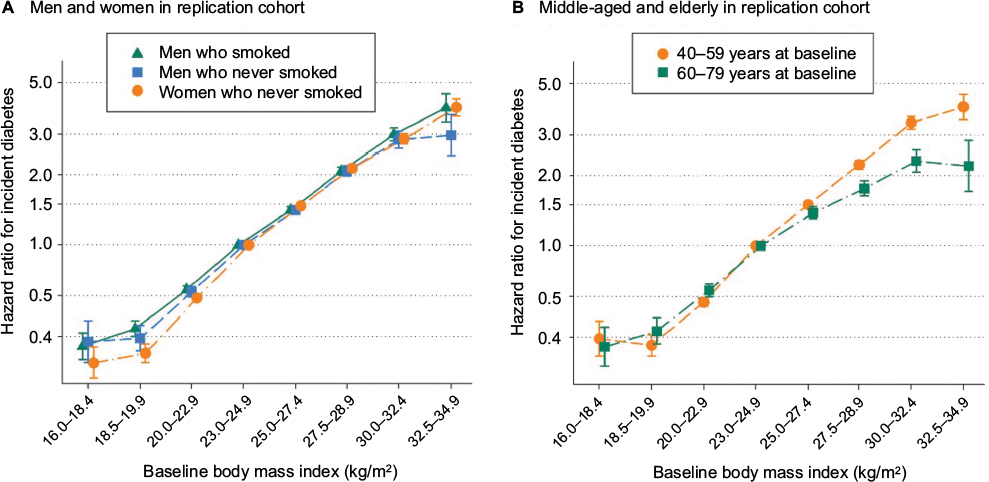 | Figure 2 Adjusted hazard ratios for incident diabetes according to baseline body mass index. Notes: Hazard ratios and 95% confidence intervals in men who smoked, men who never smoked, and women who never smoked (A) and in middle-aged and elderly participants (B) were estimated using Cox regression models. Because the proportion of women who smoked was small, analyses for women were restricted to those who never smoked (A). Hazard ratios for incident diabetes in the initial cohort was similar to those in the replication cohort as shown in Supplementary materials. The reference category was body mass index of 23.0–24.9 kg/m2. Hazard ratios were adjusted for the baseline characteristics of age, family history of diabetes, income level, physical exercise, and alcohol consumption (A); or further adjusted for sex and smoking (B). |
All-cause mortality associated with incident diabetes
During the 3.41 million and 8.24 million person-years of outcome observation, 22,940 and 57,556 deaths were noted in the initial and replication cohorts, respectively. We estimated the relative risk of all-cause mortality associated with incident diabetes using time-dependent Cox models while accounting for the time of diabetes diagnosis. Overall, the relative risks were 1.24 (95% confidence interval [CI], 1.17–1.31) in the initial cohort and 1.21 (95% CI, 1.17–1.25) in the replication cohort. The interaction of diabetes status with baseline BMI class had a statistically significant effect on all-cause mortality risk in the initial and replication cohorts (P=0.018 and P<0.001, respectively).
When time-dependent Cox analyses were conducted separately in each baseline BMI class, the relative risk of all-cause mortality associated with incident diabetes increased progressively as the baseline BMI decreased (Figure 3; Table 2). These association trends persisted in most subgroups when stratified analyses were conducted according to age or sex and smoking status.
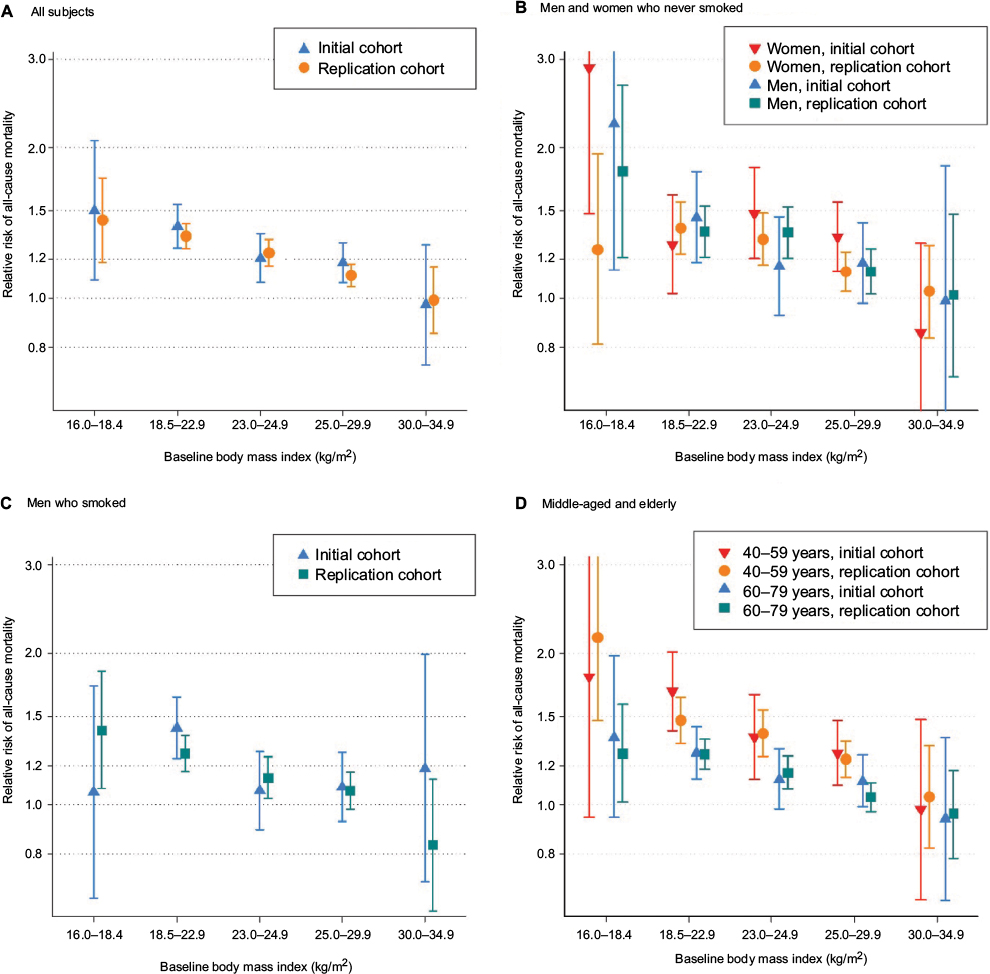 | Figure 3 Adjusted relative risks of all-cause mortality associated with incident diabetes in each baseline body mass index class. Notes: Relative risks and 95% confidence intervals among all participants (A), men and women who never smoked (B), men who smoked (C), and middle-aged and elderly participants (D) were estimated using time-dependent Cox models, while accounting for the time of diabetes diagnosis. Analyses for men and women were separately performed among those who never smoked, to avoid the potential confounding effect of smoking on the association of incident diabetes and weight status with all-cause mortality (B). Because the proportion of women who smoked was small, analyses for smokers were performed in men only (C). Subjects without diabetes at each time point served as the reference. Relative risks were adjusted for the baseline characteristics of age, family history of diabetes, income level, physical exercise, and alcohol consumption (B and C); or further adjusted for sex and smoking (A and D). |
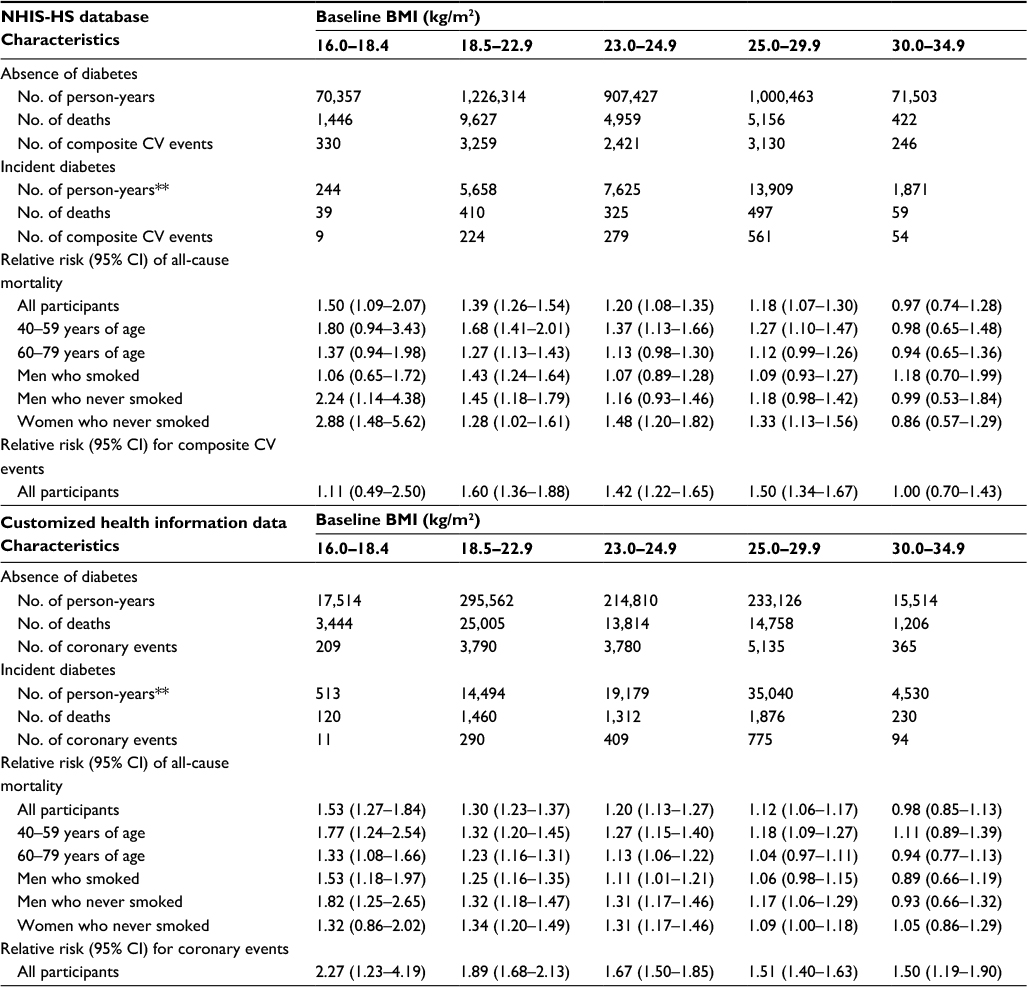 | Table 2 Adjusted relative risks for all-cause death and CV events, associated with incident diabetes, in each baseline BMI class* Notes: *Relative risks were estimated using time-dependent Cox models, while accounting for the time of diabetes diagnosis. Subjects without a diabetes diagnosis at each time point served as the reference. The analyses were adjusted for the baseline characteristics of age, sex, family history of diabetes, income level, physical exercise, smoking, and alcohol consumption. **Person-years were separately calculated according to diabetes status even in participants who developed incident diabetes. Abbreviations: BMI, body mass index; CV events, cardiovascular events; NHIS-HS, National Health Insurance Service-Health Screening; 95% CI, 95% confidence interval. |
We also analyzed the diabetes-associated relative risk of mortality in models that included participants with preexisting diabetes. The overall relative risks of mortality associated with any (prevalent or incident) diabetes were 1.57 (95% CI, 1.52–1.61) and 1.55 (95% CI, 1.52–1.58) in the initial and replication cohorts, respectively. In the analyses conducted in each BMI class, the relative risk again increased progressively as the BMI decreased (Supplementary materials).
Diabetes-associated relative risks of mortality according to baseline BMI are also presented as 1-year mortality rates (Figure 4 and Supplementary materials). The 1-year mortality rate was highest in participants with diabetes and lower BMIs, irrespective of age or sex and smoking status. The absolute difference in mortality rates between the diabetic and non-diabetic participants was larger among elderly participants, whereas the relative risk was greater among middle-aged participants than elderly participants.
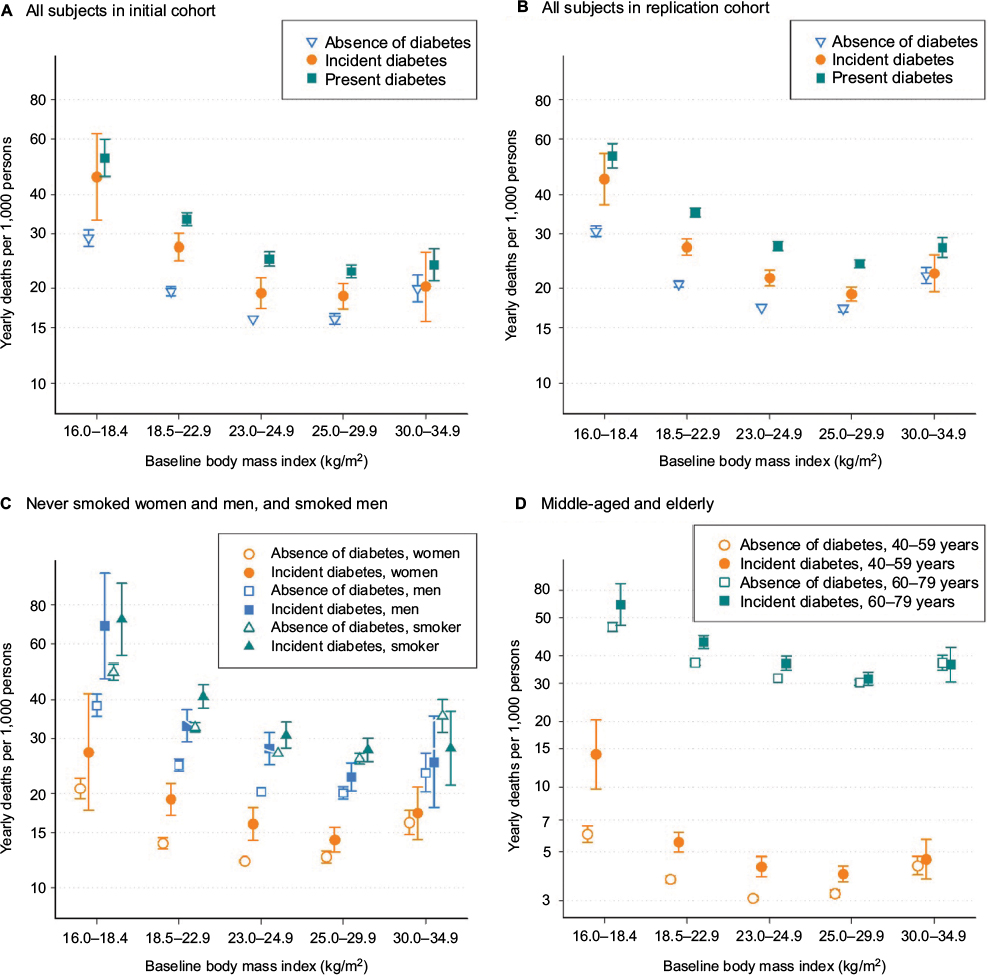 | Figure 4 All-cause mortality rates according to diabetic status and baseline body mass index (BMI). Notes: All-cause mortality rates among all participants in the initial (A) and replication (B) cohorts and among men and women who never smoked and men who smoked (C) and among middle-aged and elderly participants (D) in the replication cohort were estimated by multiplying the relative risks by the mean of age-specific mortality rates of the reference group. Relative risks were estimated using time-dependent Cox models, while accounting for the baseline BMI and the time of diabetes diagnosis. The participants with a baseline BMI of 23.0–24.9 kg/m2 and without diabetes at each time point served as the reference. The analyses were adjusted for the baseline characteristics of age, family history of diabetes, income level, physical exercise, and alcohol consumption (C); or further adjusted for sex and smoking (A, B, and D). |
Additional analyses
When we analyzed cardiovascular event rates as the secondary outcome, the diabetes-associated relative risk for coronary revascularization was greater among participants with a lower BMI compared to those with a higher BMI (Supplementary materials). These results remained mostly unchanged even after further adjustments for the time-averaged values of mean arterial pressure and serum total cholesterol (Supplementary materials).
Discussion
In this large cohort study of Korean adults, we evaluated the diabetes incidence and all-cause mortality according to weight status (ie, BMI). We observed that the diabetes incidence increased progressively with the baseline BMI and that the incident diabetes was associated with an increased overall risk of mortality. We found that the relative risk of mortality associated with incident diabetes was greater among participants with a lower BMI, reflecting the epidemiologic evidence suggesting a more harmful effect of type 2 diabetes on mortality in normal weight or underweight adults versus overweight or obese adults.
In the present study, ~50% of the cases of incident diabetes involved normal weight or underweight participants, and the risk for incident diabetes increased sharply and progressively from a BMI of 20 kg/m2. Among Asians (including Koreans), the risk of type 2 diabetes is known to increase as the BMI increases,16 although the risk shifts to lower BMI values. Asians would have a higher prevalence of diabetes relative to Caucasians at the same BMI.17 In addition, we observed that all-cause mortality increased in the lowest and highest BMI categories (Supplementary materials). Such U-shaped associations between BMI and mortality were similarly observed in the USA, European, and East Asian cohorts.18–21 However, the risk of cardiovascular (particularly coronary) events was greater among participants with higher BMIs compared to those with lower BMIs, even after adjusting for possible confounders. Overweight may be a standalone risk factor for atherosclerotic cardiovascular morbidity.
When we analyzed diabetes-related relative risk of mortality in each BMI class, the extent of increased mortality risk associated with incident diabetes was larger among participants with lower BMIs (Figure 3). The 1-year mortality rate, shown in Figure 4, was highest in diabetic participants with lower BMIs, indicating that among participants with lower BMIs, the greater mortality risk of diabetics compared with non-diabetics resulted from increased risk following incident diabetes rather than from low risk in non-diabetic participants with lower BMIs. These support the suggestion that incident diabetes has a more harmful effect in normal weight or underweight adults than overweight or obese adults.
On the other hand, some studies involving diabetic patients reported that the risk of mortality was lower among obese diabetics than their normal weight counterparts.5,6 Those reports have triggered arguments regarding the paradoxical protective effects of obesity among diabetic patients.22 When we compared 1-year mortality rates across BMI classes among only participants who developed incident diabetes, the mortality rate was greater in underweight or low-normal weight patients and similar in obese or overweight patients, compared with high-normal weight patients (Figure 4). This indicates that the greater relative risk of mortality associated with diabetes among persons with lower BMIs can appear as paradoxically decreased relative risk of mortality associated with obesity among persons with diabetes. However, contrary to the results of previous studies, we compared mortality risks between participants with diabetes and those without diabetes in each BMI class and investigated incident diabetes that developed in participants without diabetes at baseline. We observed different diabetes-related relative risks of mortality across BMI categories, which derived from increased risk following incident diabetes in participants with lower BMIs, rather than from decreased risk following weight gain in participants with diabetes. Our current findings suggest that the obesity paradox results from the more harmful effects of diabetes in individuals with lower BMIs, rather than the protective effects of obesity.
It remains unclear why diabetes-related relative risk of mortality is greater among adults with lower BMIs compared to those with higher BMIs, and several hypotheses could be proposed. First, sarcopenia is defined as the age-associated loss of skeletal muscle mass and function.23 As the amount of skeletal muscle mass correlates positively with BMI,24 sarcopenia may be common among adults with low BMIs. In addition, several studies have demonstrated an association of type 2 diabetes with sarcopenia, although the underlying mechanisms remain unclear.25,26 Hence, the occurrence of diabetes would worsen preexisting sarcopenia in participants with low BMIs. Sarcopenia has also been associated with increased mortality,27 and therefore, diabetes-related worsening of sarcopenia might additively increase mortality among participants with low BMIs. Sarcopenic obesity has been defined as the presence of both reduced muscle mass and high body fat.28 In a cohort study involving diabetic patients, a larger waist circumference was found to be associated with increased mortality, and a normal BMI was found to be associated significantly with increased mortality relative to a high BMI even after adjusting for waist circumference, suggesting that excess mortality was attributable to both high body fat and low lean body mass in patients with diabetes.5
Type 2 diabetes is characterized by both insulin resistance and dysfunctional insulin secretion. High BMI or obesity is a strong risk factor for insulin resistance and type 2 diabetes. However, impaired insulin secretion also increases the risk for type 2 diabetes, particularly in Asians,29–31 and may cause type 2 diabetes at low BMI values. The relative insulin deficiency may impair glucose utilization in muscle and adipose tissues and increase muscle and fat breakdown, as occurs in type 1 diabetes.32 Therefore, incident diabetes might lead to reductions in obesity and muscle mass, and the benefits of fat loss would at least partially offset the risks of muscle loss in participants with high BMI (which is correlated with a greater muscle mass).
One strength of our study was the use of the NHIS-HS database and customized NHIS health information data. This database consists of information about the reimbursement of patients receiving medical care under insurance coverage, as well as the results of biennial health medical examinations for most citizens aged ≥40 years.12,33 All Korean citizens are required to join the NHIS, and all claims regarding medical care expenses are recorded. Therefore, the databases include information from large population-based cohorts and facilitate the reliable identification of diabetes, death, coronary revascularization, and other covariates. To our knowledge, ours is one of the largest cohort studies involving incident diabetes. We identified 103,063 cases of incident diabetes using standard diagnostic criteria – prescribed medication for increased blood glucose levels or fasting blood glucose measurements of ≥126 mg/dL – which are the preferred parameters in epidemiological surveys. Moreover, we calculated BMI using measured heights and weights, rather than self-reported values which are frequently used in large-scale cohort studies. Self-reported values are less reliable, as most individuals tend to over-report their heights and underreport their weights.34
However, the present study had certain limitations. Although all insured Korean citizens are required to undergo biennial medical health examinations, some participants did not undergo regular health examinations. Among the survivors in each 2-year period, 65.8%, 71.0%, 75.9%, 78.8%, 76.5%, and 78.9% underwent follow-up examinations in 2004–2005, 2006–2007, 2008–2009, 2010–2011, 2012–2013, and 2014–2015, respectively (Supplementary materials). Moreover, we could have missed some cases of diabetes, as 2-h blood glucose or glycated hemoglobin levels were not measured. However, as we confirmed diabetes using both reimbursement and health examination records, the possibility of a missed diagnosis or bias due to a loss to follow-up was minimized. In addition, we could not assess diabetes-related mortality according to the cause of death. The statistical power was not sufficient to perform an analysis for each cause in each BMI class, and information about the causes of death was not available for the replication cohort. Finally, it may be difficult to generalize our findings to other racial and ethnic populations, as the present study only included participants who resided in Korea.
Conclusion
In conclusion, incident diabetes was associated with a greater increase in mortality in participants with lower BMIs compared to those with higher BMIs, reflecting the epidemiologic finding that type 2 diabetes more negatively affects mortality in normal weight or underweight adults than overweight or obese adults. Our findings can explain the obesity paradox observed among diabetic patients and emphasize the importance of type 2 diabetes treatment and prevention in normal weight or underweight adults, particularly in Asia.
Disclosure
The authors report no conflicts of interest in this work.
References
Yoon K-H, Lee J-H, Kim J-W, et al. Epidemic obesity and type 2 diabetes in Asia. Lancet. 2006;368(9548):1681–1688. | ||
Chan JCN, Malik V, Jia W, et al. Diabetes in Asia: epidemiology, risk factors, and pathophysiology. JAMA. 2009;301(20):2129–2140. | ||
Bragg F, Holmes MV, Iona A, et al. Association between diabetes and cause-specific mortality in rural and urban areas of China. JAMA. 2017;317(3):280–289. | ||
Tancredi M, Rosengren A, Svensson A-M, et al. Excess mortality among persons with type 2 diabetes. N Engl J Med. 2015;373(18):1720–1732. | ||
Carnethon MR, De Chavez PJD, Biggs ML, et al. Association of weight status with mortality in adults with incident diabetes. JAMA. 2012;308(6):581–590. | ||
Jackson CL, Yeh H-C, Szklo M, et al. Body-mass index and all-cause mortality in US adults with and without diabetes. J Gen Intern Med. 2014;29(1):25–33. | ||
Tobias DK, Pan A, Jackson CL, et al. Body-mass index and mortality among adults with incident type 2 diabetes. N Engl J Med. 2014;370(3):233–244. | ||
Cull CA, Jensen CC, Retnakaran R, Holman RR. Impact of the metabolic syndrome on macrovascular and microvascular outcomes in type 2 diabetes mellitus: United Kingdom Prospective Diabetes Study 78. Circulation. 2007;116(19):2119–2126. | ||
Church TS, Thompson AM, Katzmarzyk PT, et al. Metabolic syndrome and diabetes, alone and in combination, as predictors of cardiovascular disease mortality among men. Diabetes Care. 2009;32(7):1289–1294. | ||
Bae JC, Cho NH, Suh S, et al. Cardiovascular disease incidence, mortality and case fatality related to diabetes and metabolic syndrome: a community-based prospective study (Ansung-Ansan cohort 2001-12). J Diabetes. 2015;7(6):791–799. | ||
National Health Insurance Bigdata. Available from: https://nhiss.nhis.or.kr/bd/ab/bdaba012eng.do. Accessed October 9, 2017. | ||
Cheol Seong S, Kim Y-Y, Khang Y-H, et al. Data resource profile: The National Health Information Database of the National Health Insurance Service in South Korea. Int J Epidemiol. 2017;46(3):799–800. | ||
Lee J, Lee JS, Park S-H, Shin SA, Kim K. Cohort profile: The National Health Insurance Service-National Sample Cohort (NHIS-NSC), South Korea. Int J Epidemiol. 2017;46(2):e15. | ||
National Health Insurance Sharing Service. Available from: http://nhiss.nhis.or.kr/bd/ab/bdaba032eng.do. Accessed June 19, 2017. | ||
WHO Expert Consultation. Appropriate body-mass index for Asian populations and its implications for policy and intervention strategies. Lancet. 2004;363(9403):157–163. | ||
Oh SW, Shin S-A, Yun YH, Yoo T, Huh B-Y. Cut-off point of BMI and obesity-related comorbidities and mortality in middle-aged Koreans. Obes Res. 2004;12(12):2031–2040. | ||
King GL, McNeely MJ, Thorpe LE, et al. Understanding and addressing unique needs of diabetes in Asian Americans, native Hawaiians, and Pacific Islanders. Diabetes Care. 2012;35(5):1181–1188. | ||
Adams KF, Schatzkin A, Harris TB, et al. Overweight, obesity, and mortality in a large prospective cohort of persons 50 to 71 years old. N Engl J Med. 2006;355(8):763–778. | ||
Prospective Studies Collaboration, Whitlock G, Lewington S, et al. Body-mass index and cause-specific mortality in 900 000 adults: collaborative analyses of 57 prospective studies. Lancet. 2009;373(9669):1083–1096. | ||
Zheng W, McLerran DF, Rolland B, et al. Association between body-mass index and risk of death in more than 1 million Asians. N Engl J Med. 2011;364(8):719–729. | ||
Jee SH, Sull JW, Park J, et al. Body-mass index and mortality in Korean men and women. N Engl J Med. 2006;355(8):779–787. | ||
Hainer V, Aldhoon-Hainerová I. Obesity paradox does exist. Diabetes Care. 2013;36(Suppl 2):S276–S281. | ||
Fielding RA, Vellas B, Evans WJ, et al. Sarcopenia: an undiagnosed condition in older adults. Current consensus definition: prevalence, etiology, and consequences. International working group on sarcopenia. J Am Med Dir Assoc. 2011;12(4):249–256. | ||
Castillo EM, Goodman-Gruen D, Kritz-Silverstein D, Morton DJ, Wingard DL, Barrett-Connor E. Sarcopenia in elderly men and women: the Rancho Bernardo study. Am J Prev Med. 2003;25(3):226–231. | ||
Kim TN, Park MS, Yang SJ, et al. Prevalence and determinant factors of sarcopenia in patients with type 2 diabetes: the Korean Sarcopenic Obesity Study (KSOS). Diabetes Care. 2010;33(7):1497–1499. | ||
Kalyani RR, Metter EJ, Egan J, Golden SH, Ferrucci L. Hyperglycemia predicts persistently lower muscle strength with aging. Diabetes Care. 2015;38(1):82–90. | ||
Brown JC, Harhay MO, Harhay MN. Sarcopenia and mortality among a population-based sample of community-dwelling older adults. J Cachexia Sarcopenia Muscle. 2016;7(3):290–298. | ||
Zamboni M, Mazzali G, Zoico E, et al. Health consequences of obesity in the elderly: a review of four unresolved questions. Int J Obes. 2005;29(9):1011–1029. | ||
Weyer C, Bogardus C, Mott DM, Pratley RE. The natural history of insulin secretory dysfunction and insulin resistance in the pathogenesis of type 2 diabetes mellitus. J Clin Invest. 1999;104(6):787–794. | ||
Chen KW, Boyko EJ, Bergstrom RW, et al. Earlier appearance of impaired insulin secretion than of visceral adiposity in the pathogenesis of NIDDM. 5-Year follow-up of initially nondiabetic Japanese-American men. Diabetes Care. 1995;18(6):747–753. | ||
Torréns JI, Skurnick J, Davidow AL, et al. Ethnic differences in insulin sensitivity and beta-cell function in premenopausal or early perimenopausal women without diabetes: the Study of Women’s Health Across the Nation (SWAN). Diabetes Care. 2004;27(2):354–361. | ||
Rosenfalck AM, Almdal T, Hilsted J, Madsbad S. Body composition in adults with type 1 diabetes at onset and during the first year of insulin therapy. Diabet Med. 2002;19(5):417–423. | ||
National Health Insurance Sharing Service. Available from: http://nhiss.nhis.or.kr/bd/ab/bdaba006cv.do. Accessed February 2, 2017. | ||
Hill A, Roberts J. Body mass index: a comparison between self-reported and measured height and weight. J Public Health Med. 1998;20(2):206–210. |
 © 2017 The Author(s). This work is published and licensed by Dove Medical Press Limited. The full terms of this license are available at https://www.dovepress.com/terms.php and incorporate the Creative Commons Attribution - Non Commercial (unported, v3.0) License.
By accessing the work you hereby accept the Terms. Non-commercial uses of the work are permitted without any further permission from Dove Medical Press Limited, provided the work is properly attributed. For permission for commercial use of this work, please see paragraphs 4.2 and 5 of our Terms.
© 2017 The Author(s). This work is published and licensed by Dove Medical Press Limited. The full terms of this license are available at https://www.dovepress.com/terms.php and incorporate the Creative Commons Attribution - Non Commercial (unported, v3.0) License.
By accessing the work you hereby accept the Terms. Non-commercial uses of the work are permitted without any further permission from Dove Medical Press Limited, provided the work is properly attributed. For permission for commercial use of this work, please see paragraphs 4.2 and 5 of our Terms.