")
Back to Journals » ClinicoEconomics and Outcomes Research » Volume 14
Incidence of Catastrophic Health Expenditures Amongst Hospitalized Neonates in Ekiti, Southwest Nigeria
Authors Ogundare EO , Taiwo AB , Olatunya OS , Afolabi MO
Received 9 February 2022
Accepted for publication 28 April 2022
Published 17 May 2022 Volume 2022:14 Pages 383—394
DOI https://doi.org/10.2147/CEOR.S360650
Checked for plagiarism Yes
Review by Single anonymous peer review
Peer reviewer comments 2
Editor who approved publication: Dr Xing Lin Feng
Ezra O Ogundare,1,2 Adekunle B Taiwo,3 Oladele S Olatunya,1,2 Muhammed O Afolabi4
1Department of Paediatrics, Ekiti State University, Ado-Ekiti, Nigeria; 2Department of Paediatrics and Child Health, Ekiti State University Teaching Hospital, Ado Ekiti, Nigeria; 3Department of Paediatrics, Zankli Medical Services, Abuja, Nigeria; 4Department of Disease Control, Faculty of Infectious and Tropical Diseases, London School of Hygiene & Tropical Medicine, London, UK
Correspondence: Ezra O Ogundare, Department of Paediatrics, Ekiti State University, Ado-Ekiti, Nigeria, Tel +234-803-501-7416, Email [email protected]
Background: Neonatal illnesses require huge spending due to prolonged hospital stay. The management of these illnesses is usually financed by individual families which in most instances are living below the poverty line. This healthcare financing method can readily push families into catastrophic spending on health.
Aim: To ascertain the average cost of managing common neonatal illnesses and the financial burden, it constitutes to families in Ekiti State, southwest Nigeria.
Methods: We conducted a cross-sectional study on the out-of-pocket spending involved in managing neonates admitted into and discharged from the SCBU of the Ekiti State University Teaching Hospital, Ado-Ekiti, southwest Nigeria. Data collected included the monthly family income, the money spent on drugs, laboratory investigations and the hospital bill using a purposely designed structured questionnaire. Healthcare spending greater than 10% of the overall family income was described as catastrophic health spending (CHS).
Results: The medical bills for most (95%) of the 119 study participants were paid through the out-of-pocket means and 81.5% of the families spent more than 10% of their monthly earnings (CHS) to settle medical bills. Close to 50% of the families belonged to the lower social economic class. The median (IQR) duration of hospital stay was 2.75 days (3.0– 8.0). The median (IQR) total expenditure was N24,500.00 (N13,615.00–N41,487.50). The median (IQR) expenditure for the treatment of prematurity was highest at N55,075.00 (USD 133.10) [N27,350.00 (USD 66.10)–N105,737.50 (USD 255.53)] and more than 60.5% of the expenses was on hospital utilities and consumables. The length of hospital stay showed a robust positive correlation with the total hospital bill (r = 0.576, P < 0.001).
Conclusion: Neonatal illnesses put many households at risk of catastrophic health spending. There is need for increased government investment in health and extension of the health insurance scheme to all the citizens of the country.
Keywords: neonatal illness, out-of-pocket spending, catastrophic health spending, Nigeria
Introduction
Globally, about 2.5 million neonatal deaths occur each year, representing 47% of all deaths in children below five years of age.1 Wide variation in mortality rates occurs within the neonatal period, with as much as 75% of all neonatal deaths happening in the first week of life, comprising 25–45% of deaths within the initial 24 hours after birth.2 Prematurity, birth asphyxia, and neonatal infections are the foremost contributors to the worldwide burden of neonatal diseases.3 About 99% of global newborn deaths occur in developing countries where low household incomes hamper access to adequate neonatal care.2
In these low and middle-income countries (LMIC), health-care funding is mainly through out-of-pocket spending. The burden of the high cost of specialized neonatal care is borne largely by parents or families of the newborns.4 In LMIC such as Nigeria, out-of-pocket spending (OOPS) accounts for 70–95% of healthcare financing;5–8 A previous study on OOPS for newborn care in Enugu,5 Nigeria revealed that the medical bills for all the neonates (100%) were settled via the OOPS method. Given that most babies with neonatal morbidities require specialized care in a secondary or tertiary health institution, inability to pay for cost of neonatal care has been cited as a reason for delay in presentation or failure to present at a health facility.9 Causes of neonatal morbidity such as prematurity may also necessitate prolonged hospital stay which consequently adds to the cost of neonatal care.8
The World Bank defines out-of-pocket expenditures as any direct expenditure by households, including gratuities and payments in-kind, to health practitioners and suppliers of pharmaceuticals, therapeutic appliances, and other goods and services which primarily contribute to the restoration or enhancement of health status.10 OOPS, according to the World Bank definition, has to do mainly with direct costs incurred by an individual and/or household to preserve their health which may include cost of transportation to and from health-care facilities, feeding cost by the caregivers and other over-the-counter medicines and supplies.11
The 2021 World Health Statistics showed that the governments of most LMIC, including Nigeria, did not invest adequately on the health of their citizens with the revelation that the families who devote more than a tenth (10%) of their households earnings as OOPS on their well-being increased from 9.4% to 12.7% between years 2000 and 2015.11
The United Nation’s Sustainable Development Goal 3 target of halting preventable newborn deaths and reducing neonatal mortality to at least 12 per 1000 live births by 2030 cannot be attained without substantially improving health-care financing for newborns.12
OOPS method of health-care financing offers no financial hazard shield and may lead to financial disaster for families.5,13,14 Catastrophic health spending (CHS) describes a state when an individual or household concedes their elementary needs, and/or becomes indebted, disposes assets, and becomes poor because of the expenses on health maintenance.5,13–16 CHS occurs when more than a tenth (10%) of the total household earnings or greater than 40% of non-food revenue is spent to maintain health.5,15 As much as 133.4% of the joint family earnings has previously been documented to go into OOPS on neonatal health care on some occasions.17 The direct cost of care of very low birth weight – preterm babies ranged between 22.8 and 3966.3% of the joint monthly family earnings in a study conducted by Tongo et al among families in Ibadan, southwest, Nigeria.8 These findings suggest that many families were tipped into catastrophic spending by the need to care for the sick newborns in Nigeria.
The Federal Government of Nigeria in an attempt to safeguard households from the financial liability of OOPS launched the National Health Insurance Scheme (NHIS) in 2005 to enhance access to optimal health-care services. Since inception, fewer than 5% of Nigerians largely federal government employees are benefitting from the arrangement.18 The private health insurance (PHI) scheme covers fewer than 3% of the Nigerian population;19 this shows that more than 90% of Nigerians are at the risk of being tipped into catastrophic spending on maintaining their health.
Current studies6 have focused on OOPS in other age groups whilst paucity of data exists on OOPS for neonatal diseases in Nigeria hospital settings. Few available data were from studies conducted more than five years ago and may not be so relevant to the current context in Nigeria due to the worsening economic situations which have affected adversely individual and household incomes of majority of Nigerians.20 This study aims to determine the present-day OOPS cost of caring for sick neonates in a state-government-owned tertiary health-care facility in southwest Nigeria. The result of this research may provide reliable data that may inform formulation and implementation of appropriate health-care financing policies to address the ugly trends in the neonatal care in Nigeria.
Materials and Methods
Study Design and Settings
A cross-sectional descriptive study on families with neonates admitted and managed in the special care baby unit (SCBU) of Ekiti State University Teaching Hospital (EKSUTH), Ado-Ekiti, the capital city of Ekiti State, southwest Nigeria. This study was conducted over a six-month period (from February to July 2021).
The EKSUTH is a tertiary public health-care institution that provides health-care services to the residents of Ekiti State. Ado-Ekiti is inhabited largely by the Yorubas of the southwestern Nigeria; it has a population of about 308,621 residents.21 Subsistence farming is the major occupation and source of income of most residents of Ekiti. A few of Ekiti residents work as civil servants, artisans, and small-scale business owners. The minimum wage paid to civil servants (N30,000 [USD72.50]) is like what obtains in other states in Nigeria.22,23
The Special care baby Unit (SCBU) is a 15-bedded ward; the inborn section has 11 beds while 4 beds serve the out-born area. Inborn refers to neonates delivered in the health-care facility while outborn refers to babies referred from other health-care facilities or from home or other places of delivery. The SCBU is managed by one neonatologist, two postgraduate medical trainees, two house physicians and 14 nurses. The SCBU has the basic facilities required in a regular neonatal ward. Inborn patients are admitted directly from the labour ward or the labour ward theatre to the unit while the outborn section house neonates delivered outside the hospital.
At the time of the study, the hospital did not provide free treatment to clients in search of health care at the facility. Each client is responsible for his or her health bills through out-of-pocket spending, except for a few who are registered on the National Health Insurance Scheme (NHIS), these ones enjoy some subsidy.24
At admission of sick neonates, parents are encouraged to pay a receipted initial and mandatory deposit of ₦10,000 (US$24.17)25 (the official exchange rate at the time of this study was 1USD to N410.58)25 to the account department of the hospital. This initial payment is documented on the patient’s hospital file and is usually subtracted from the eventual hospital bill to be paid at discharge or demise of the patient. Non-payment of this deposit at admission does not deter or delay the commencement of care in this facility, however the parents are encouraged to pay with time and make weekly deposits, if possible, to avoid having to pay huge sum of money at discharge depending on the nature of the baby’s illness. Prescribed drugs if available in the hospital stock are supplied to the patients who pay at the point of purchase and a receipt is issued for the purchase. Those receipts were presented to the doctor on duty who recorded them in the newborn’s proforma. If the drug was not available in the hospital pharmacy, the patient’s relatives were encouraged to purchase the drugs from privately owned pharmacies or drug stores located outside the hospital and the receipts of the purchase were submitted to the doctor on duty for documentation. The same procedure was performed for all laboratory tests and other treatment measures necessitating payments.
At discharge or demise, the patient’s final bill is calculated by the accounts officers of the hospital using the newborn’s hospital file; the final bill usually includes the hospital and service/utility charges. Parents pay the final bill and are issued a receipt as evidence. The receipts were shown to the doctors on duty on the ward who also documented the bill on the patients’ proforma.
The total hospital bill is made up of the consultation charges, admission costs, and other charges as prescribed by the hospital management.
Study Participants
All the newborns admitted into the SCBU of the hospital constituted the sample set up, and only those whose parents gave consent to take part and agreed to submit the receipts of the payments and purchases made were consecutively enrolled in the research.
Data Collection and Measurement
Data collection was done using a purposely designed interviewer administered questionnaire. The questionnaire had sections on the newborn’s socio-demographics, occupation and educational attainments of the parents, family earnings, healthcare funding source, number of other siblings in the family, and amount spent during the admission and possibly the illness.
At discharge or demise, the newborn’s final bill (hospital and utility charges) was calculated at the accounts department; the parents pay the bill and are issued receipts for the payment, these were submitted to the doctor on duty for recording on the proforma. The investigators thereafter calculated the total OOPS based on the record on the newborn’s proforma, and these comprise the amounts paid for drugs, laboratory tests, the hospital and utility/service charges.
The money spent on treatment prior presenting in the hospital such as drug purchase from patent and proprietary medicine vendors (PPMVs) were added to the total cost of treatment of the illness once the parents provided the evidence of payment.
Diagnosis of neonatal illness was made based on the history and clinical examination findings and, where necessary, investigation reports were reviewed by physician in charge of the unit to confirm the diagnosis. Length of hospital stay was calculated as the number of days between the day of admission and day of discharge by the managing team. The extra days spent by some families because of their incapability to pay the hospital bill immediately after discharge was not added to the length of hospital stay for the neonatal illness, but this was documented on the proforma.
Sociodemographic data were also obtained from both parents’ occupation and highest level of education. The socioeconomic classification I–V by Oyedeji26 was used; where I is the highest ranked class and V, the lowest ranked class. A further classification of socioeconomic status into High (classes I and II), Medium (class III) and Low (classes IV and V) as proposed by Oseni and Odewale27 was used.
Calculation of Health Spending and Family Revenue
The total health spending during the period (HST) was calculated by summing up all the money spent by the family to preserve the well-being of their newborn baby on admission. This incorporated all the money spent on inpatient treatments including laboratory investigations, purchase of drugs, transportation, feeding and housing. Each family’s monthly revenue was decided by summing all the earnings that accrued to the family from wages, business incomes, cash received as gifts and all other verifiable income. The overall family revenue (TFI) was calculated by adding up all the monthly earnings of the family (summation of the father and mother’s income).
Catastrophic Health Spending (CHS) Determination
Health-care spending more than 10% of the overall family income was described as CHS for a family whose neonate was admitted during this study. Therefore, percentage of the overall family revenue spent to preserve the health of the newborn (THS/FI) was estimated using the following equation:

where HST is the total health spending during the research period and TFI is the overall household earnings during the research period. Any family with health-care spending percentage (THS/FI) >10% was judged to be involved in CHS during the research.
Ethical Approval
Ethical approval for the research was given by the Ethics and Research Committee of the Ekiti State University Teaching Hospital, Ado Ekiti with approval number A67/2021/09/004. Written informed permission was taken from parents/caregivers of newborns that were enrolled in this study. Involvement in the research was voluntary and the parents of the study participants were assured of confidentiality. The study complied with the Helsinki declaration.
Data Analysis
Data analysis was done using SPSS software version 25.28 Means and standard deviations were computed for continuous variables that were normally distributed, while median and IQR were determined for non-normally distributed data. Categorical variables were computed as proportions with 95% confidence intervals. Proportions were compared using Chi-square and Fisher’s test. The social class was further dichotomized into two groups: low and others (middle and upper) for the binary regression analysis. Univariable and multivariable regression analyses were performed to determine the forecasters/predictors of household catastrophic health spending (CHS). Level of significance was set at p-value (alpha) <0.05.
Results
One hundred and nineteen babies of consenting mothers were enrolled into the study out of the 150 babies managed in the unit during the study period, representing a response rate of 79.3%.
Sixty-six (55.5%) of the participants were males giving a M:F ratio of 1.2:1. One hundred and three (86.6%) of the babies were delivered in hospitals, 82 (68.9%) were term babies while about a quarter were preterm babies. Forty-two (35.3%) of the babies were referred to the unit, while the remaining were either admitted via the labour ward or through self-referral by the parents. Fifty-six (47.1%) babies had normal weight at admission while a little above 10% of them had admission weight less than 1.5kg. About 84 (70%) were on admission for less than 7 days while 6 (5%) were on admission for more than 21 days.
Only 6 (5%) of the babies had their parents on the health insurance scheme, while the remaining 95% were managed on out-of-pocket means. Close to 50% of the families involved in this study earned less than the minimum wage for the country. Most of the families of these newborns (81.5%) consumed more than 10% of their overall family monthly earning – catastrophic health spending while caring for their babies’ illnesses, while only 18.5% of the families including the 5% on health insurance scheme did not suffer catastrophic health spending in the management of their newborn baby’s illness or disease. Other attributes of the neonates are shown in Table 1. The median (IQR) total hospital spending was ₦15,000.00 (USD 36.25) [N13,615.00 (USD 32.90) - N41,487.50 (USD 100.26)]. The median (IQR) percentage of the total monthly family revenue spent on the healthcare of the babies was 11.0% (11.00–68.47%).
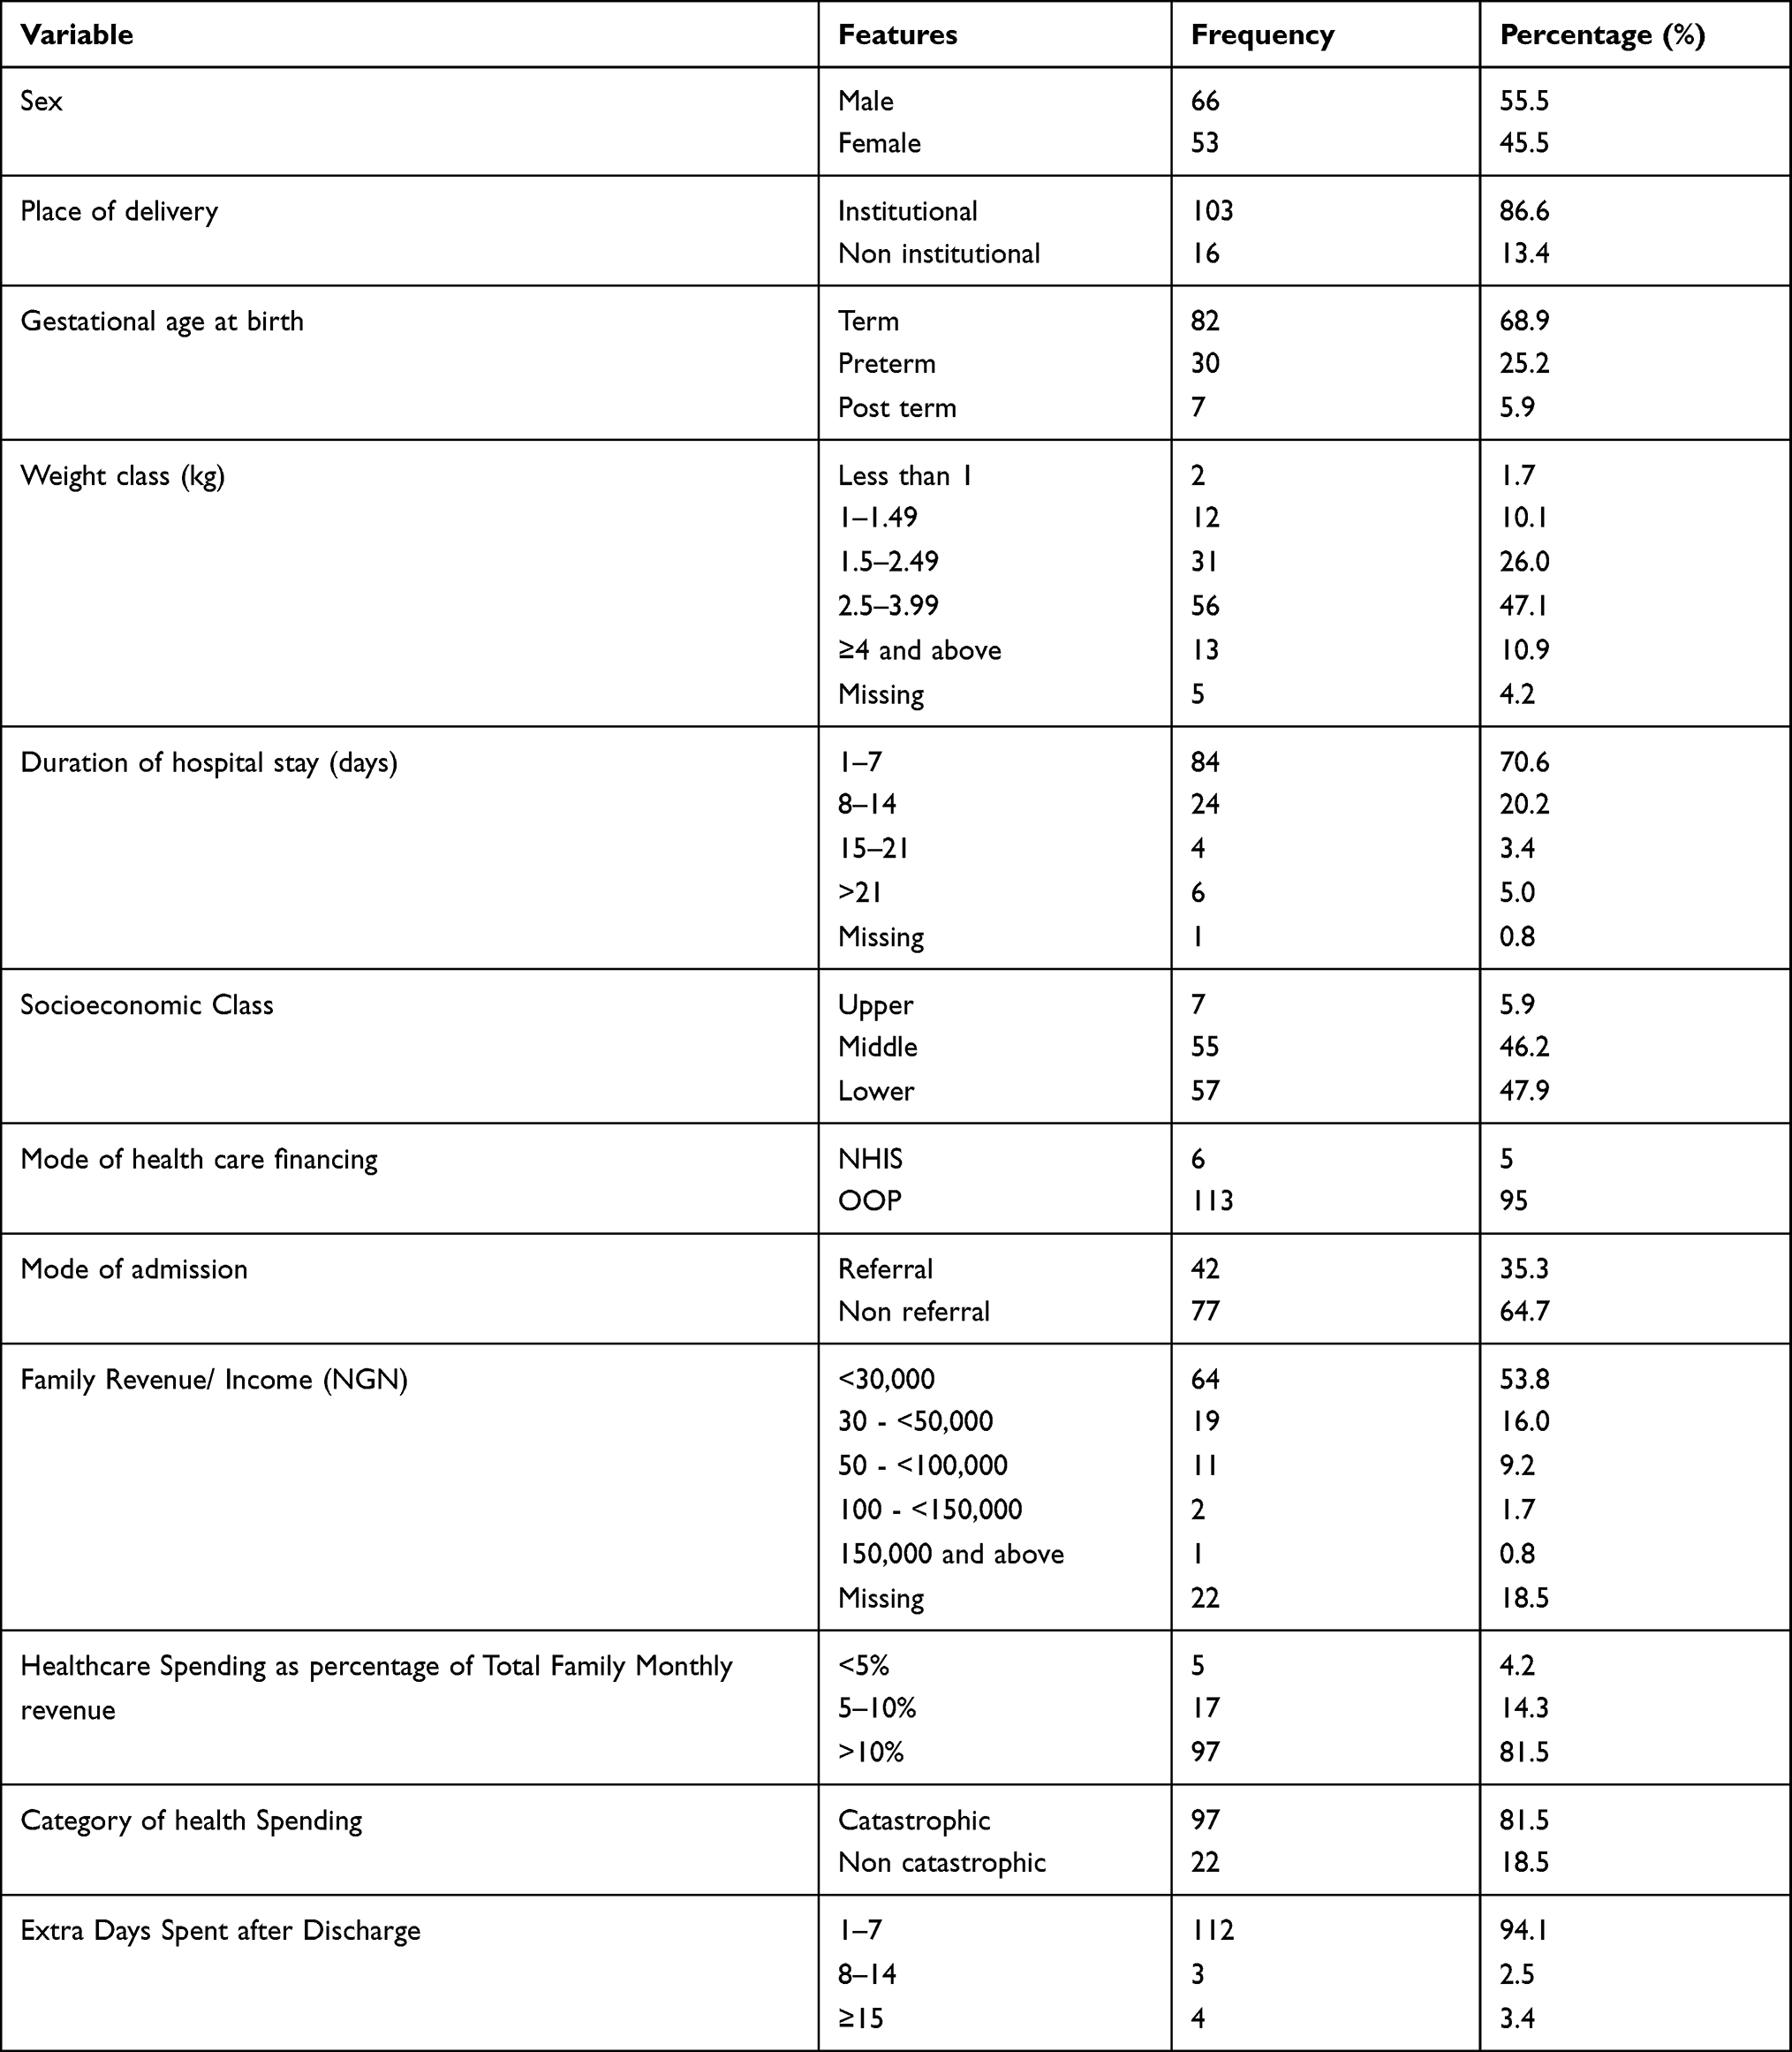 |
Table 1 Sociodemographic Characteristics of the Neonates |
Table 2 shows the different neonatal illnesses managed during the study period, the mean length of hospital stay due to the diseases, and the mean cost that ensued from the management of the illnesses. Neonatal Jaundice 30 (25.2%) accounted for most of the admissions during the study period, closely followed by Perinatal Asphyxia 29 (24.4%) and Prematurity 21 (17.6%) in that order. Prematurity was responsible for the longest duration of admission in the neonatal unit with median (IQR) duration of 9 days (4.00–21.50), followed by neonatal sepsis with 6 days (4.00–10.00). The median (IQR) expenditure for the treatment of prematurity was highest at N55,075.00 (USD 133.10) [N27,350.00 (USD 66.10)–N105,737.50 (USD 255.53)] and more than 60.5% of this cost was accounted for by the hospital utilities and consumables cost, while N7,500.00 (USD 18.13) representing 13.6% of the total expenditure on prematurity was spent on medications and N6,500.00 (USD 15.71) representing 11.8% of the expenditure was on investigations. This is followed distantly by neonatal sepsis with median (IQR) expenditure of N31,175.00 (USD 75.34) [N15,850.00 (USD 38.30) – N40,662.00 (USD 98.27)] with the hospital utilities and consumables costs [N19,550.00 (USD 47.25)] accounting for about 62.7% of the total cost of care for neonatal sepsis; medications accounted for 18.8% of the total expenditure on the management of neonatal sepsis. Neonatal Jaundice was the third leading reason for high expenditure in the neonatal unit with a median (IQR) total expenditure of N19,250.00 (USD 46.52) [N9475.00 (USD 22.90) – N37,050.00 (USD 89.54)] with hospital utilities and consumables responsible for 67.5% of the total amount spent caring for a newborn with jaundice. The same scenario played out with perinatal asphyxia with the hospital utilities and consumables responsible for about 63.3% (USD 39.05) of the mean total expenditure, while investigations accounted for 21.9% (USD 12.08) of the mean total expenditure for the treatment of perinatal asphyxia. The length of hospital stay showed a robust positive correlation with the total hospital bill (r = 0.576, P < 0.001).
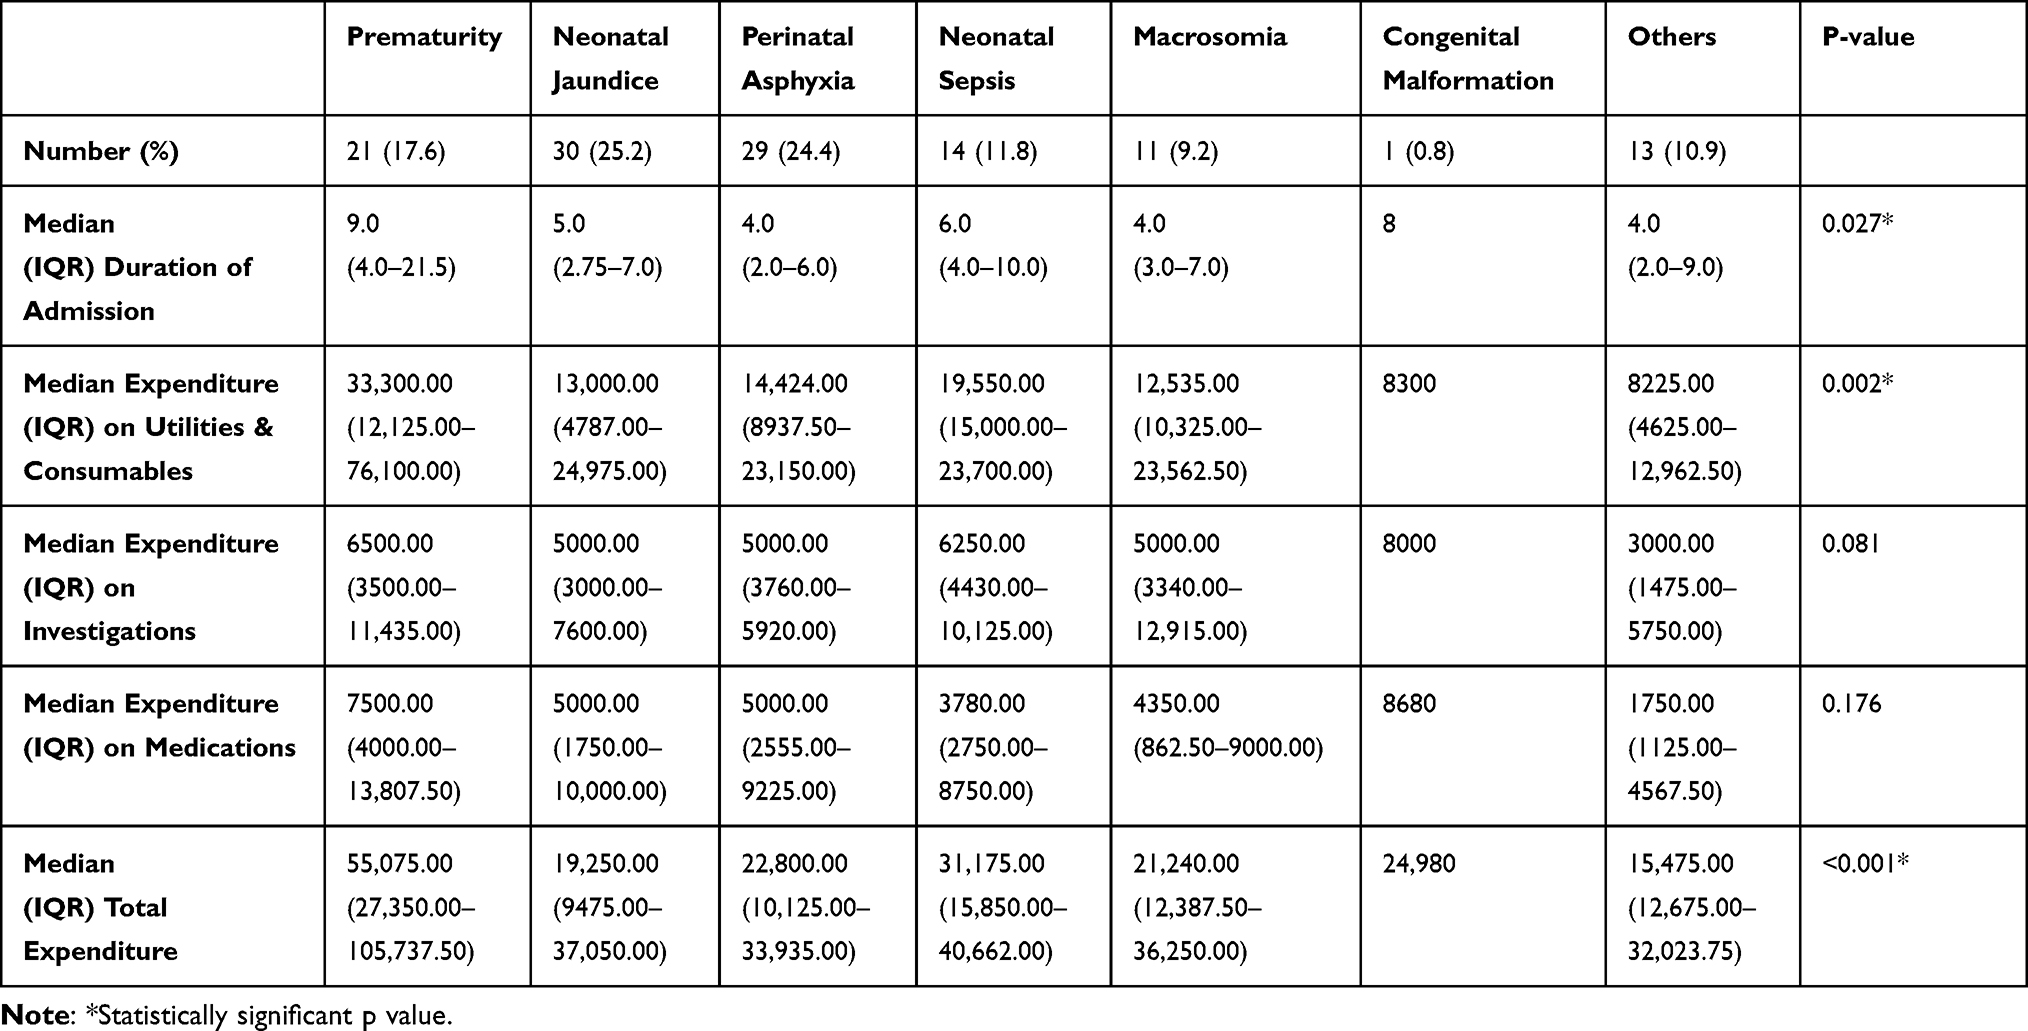 |
Table 2 Summary of Expenditures |
The healthcare spending of the families and its impact on the households is shown in Table 3.
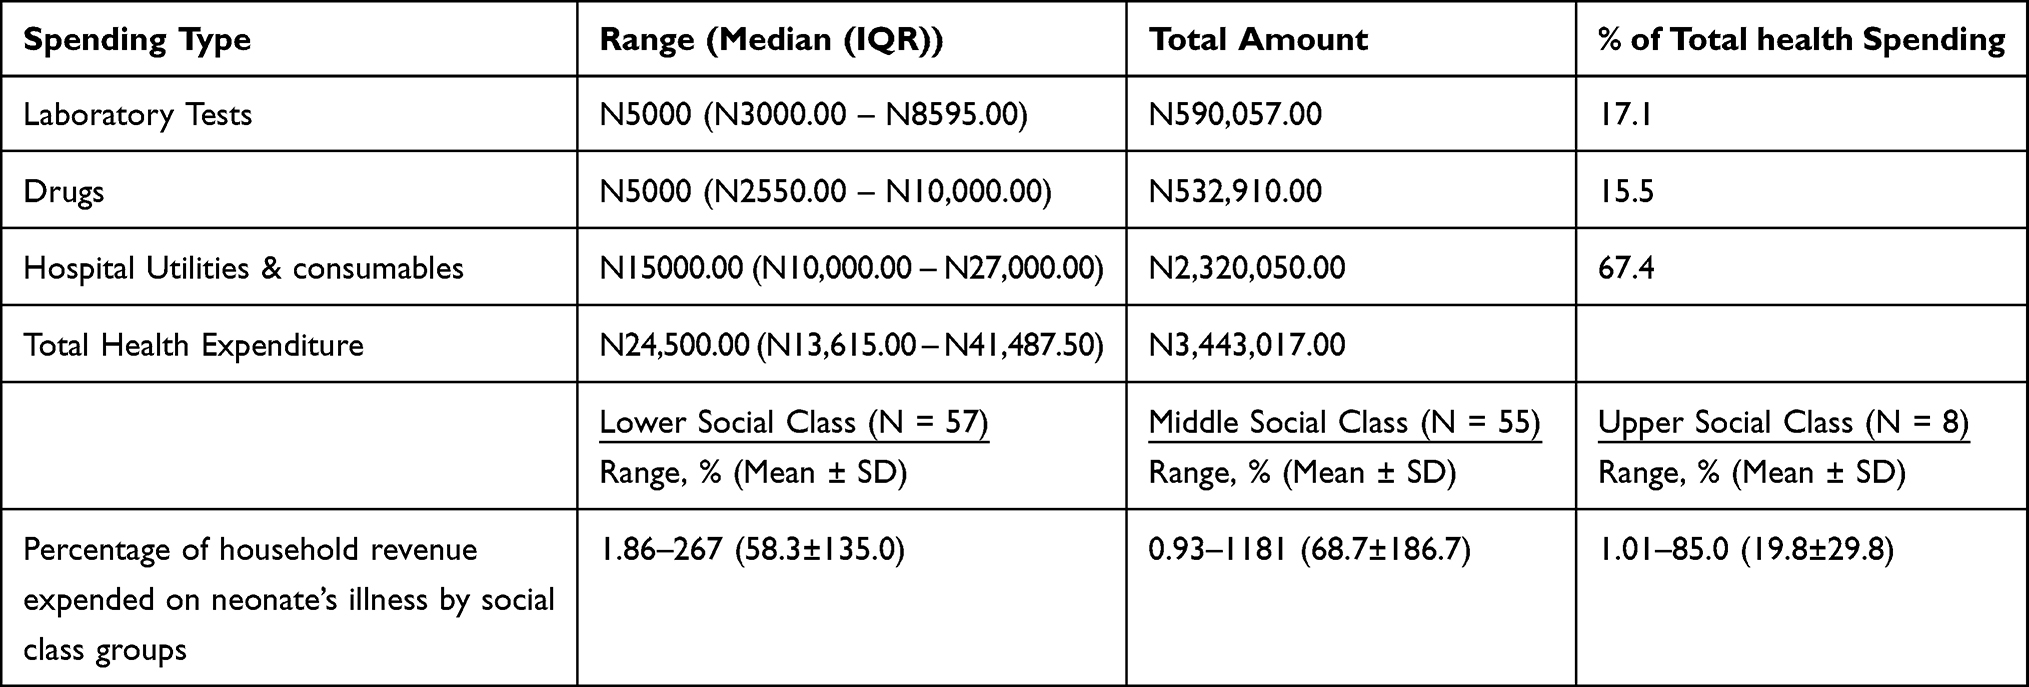 |
Table 3 Healthcare Spending by Payment for Services and Social Class |
The total healthcare spending of all the families was ₦3,443,017.00 (US$8320.69), ranging between ₦950 and ₦237,750 (US$2.30 and US$574.57), with a median (IQR) of ₦24,500.00 (USD 59.21) [N13,615.00 (USD 32.90)–N41,487.50 (USD 100.26)] per household; the hospital utilities charges and laboratory investigations made up the bulk of the health-care expenditures. The ratio of monthly family revenue spent by families in the middle social class to maintain the health of the newborn who required hospital admission varied between 0.93% and 1181.00% (mean 58.92±135.04) and this happened to be the highest percentage of household income expended by any social class involved in this study.
Table 4 shows the relationship between households’ proportion, health-care financing method, social class, monthly revenue, and healthcare spending. Most households (97, 81.5%) expended greater than 10% of their revenue in managing their admitted newborn babies, and more families in the lower social class fell victim of this. Catastrophic health spending (CHS) was recorded among ninety-seven (81.5%) families involved in the study while none of the families on NHIS suffered CHS.
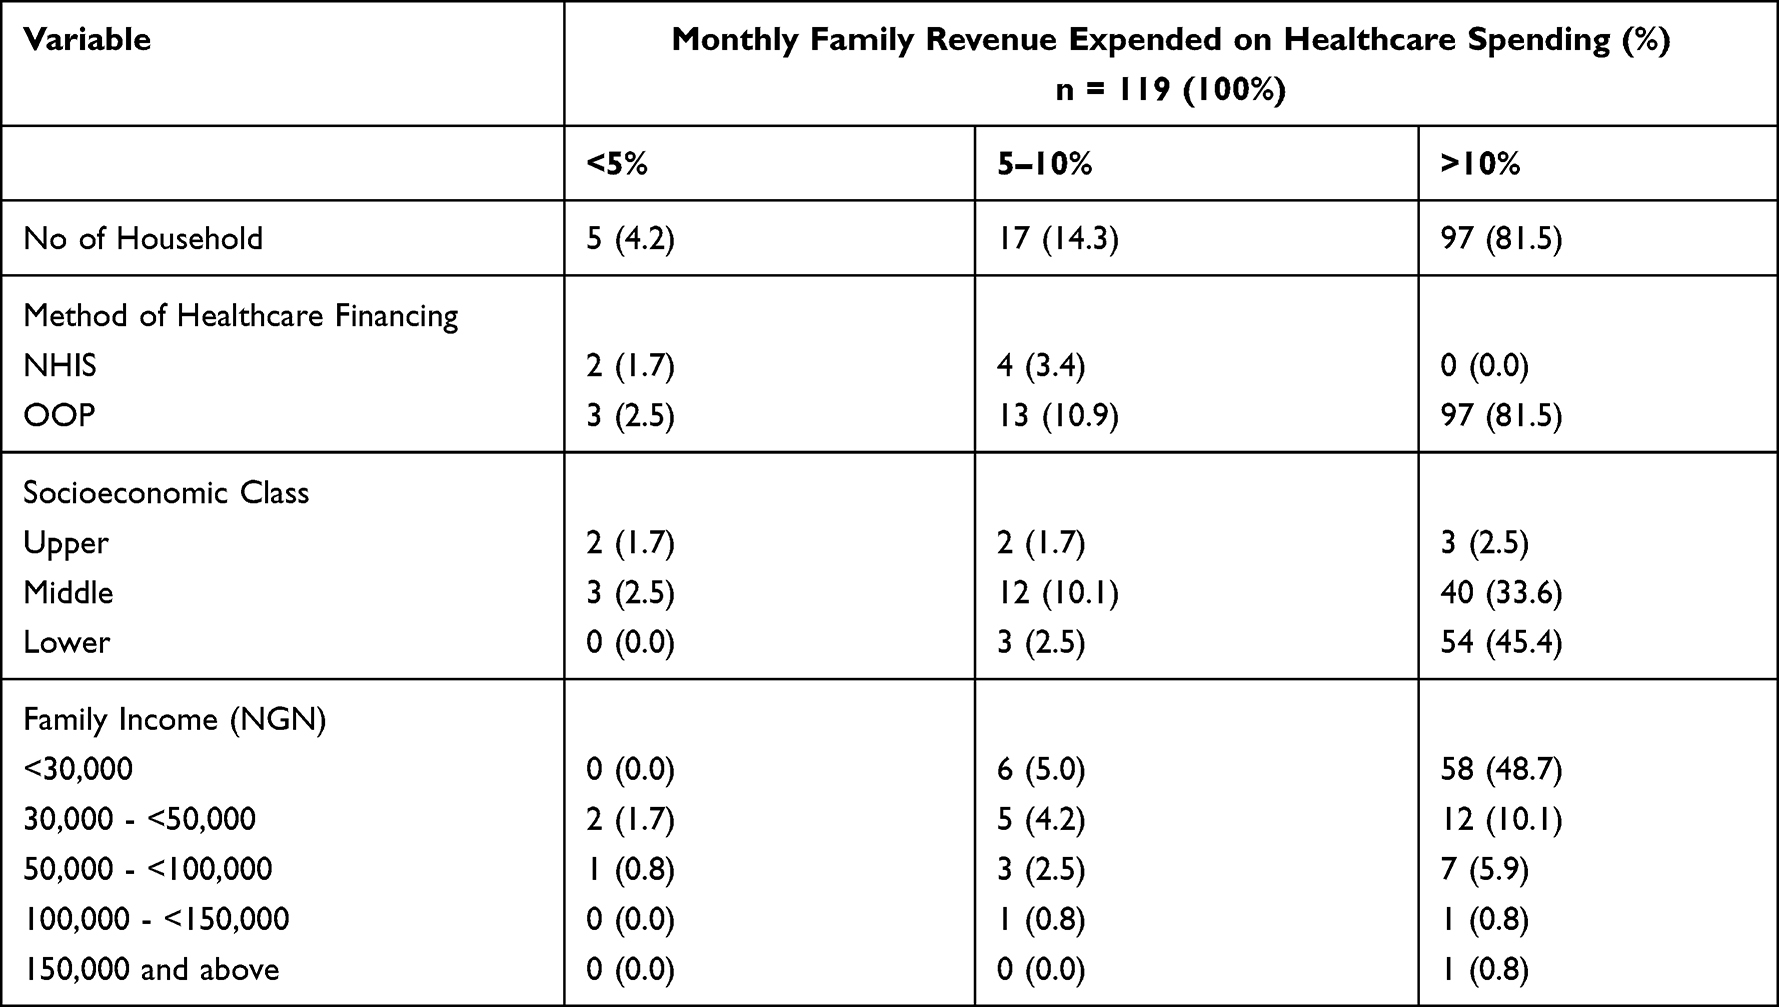 |
Table 4 Relationships Between Some Variables and Healthcare Spending |
The relationship between some variables and financial outcomes showed that out-of-pocket payments, lower social class, and total monthly earning of less than thirty thousand naira were significantly associated with catastrophic healthcare spending (Table 5).
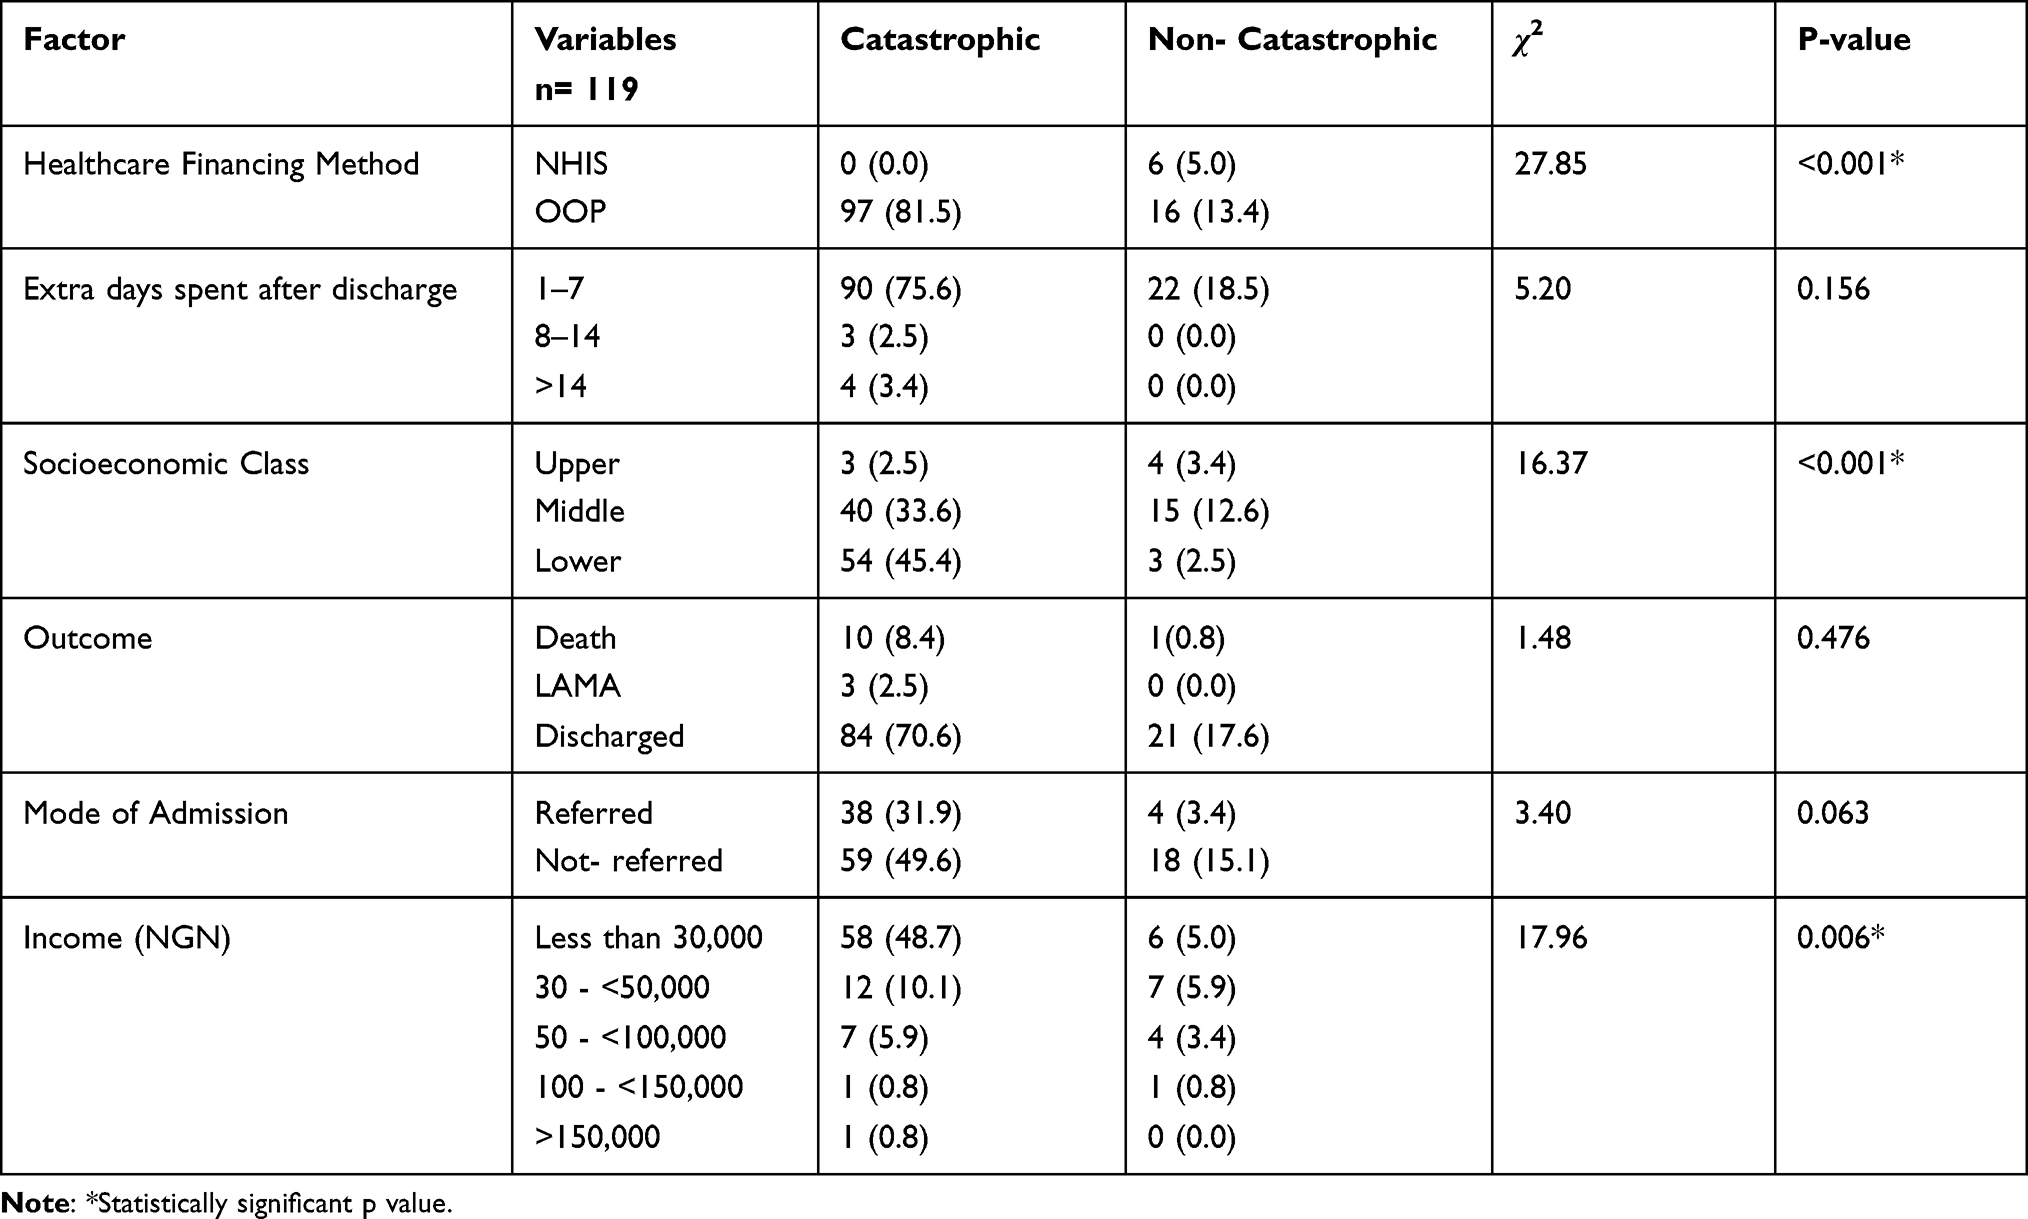 |
Table 5 Relationship Between Financial Outcome and Some Variables |
Using the presence or absence of CHS as the dependent variable, the binary logistic regression analysis revealed that lower social class was associated with higher odds for CHS as a predictor of Catastrophic Healthcare Spending (CHS) (95% CI 1.1–28.5, P=0.036) (Table 6).
 |
Table 6 Binary Logistic Regression of the Determinants of Household Catastrophic Healthcare Spending |
Discussion
Newborn care is essential; every neonate has the right to life and quality living. This, however, may be a mirage in settings where the cost of care for neonatal illnesses is out of reach of most parents responsible for providing the cost of neonatal care. The average cost of care for common neonatal illnesses from this research was high and not affordable to majority of the parents whose babies were enrolled in this study. Although the national monthly minimum wage in Nigeria is N30,000 (USD 72.50), majority of state governments, including the Ekiti where this study was conducted, have been unable to implement the minimum wage. This discovery is like the result of a similar research performed in Enugu, south-east Nigeria, about seven years ago. The study also showed that OOPS for the management of sick newborns in tertiary hospitals differed considerably with the length of hospital admission and by neonatal illness.29 The reason for this is because the duration of hospital admission, the investigation required and the treatment administered are all determined by the newborn’s illness.
Our study shows that most parents of our patients were not enrolled on any health insurance scheme. This development calls for re-engineering of the scheme so that more families can enroll. This practice of not being on any insurance scheme can only put the financial security of most families at risk of Catastrophic Healthcare Spending.
Ninety five percent (95%) of the families that participated in this study cared for their babies on OOPS similar to the findings of Ekwochi et al5 in Enugu in which all their study participants were managed on OOPE. This massive expenditure on healthcare by individuals is quite great and will most likely result in catastrophic healthcare spending for many households in a country where a large percentage of the people survive on less than US$1.90 per day.30 Unfortunately, the situation seems to be similar in most developing countries as well.30 This is quite different from what obtains in developed countries of the world where health care is free for children including neonates.4,13 OOPS offers families no financial shield, rather it delays/hinders families from pursuing healthcare, and can lead to catastrophic health spending thus pushing families into impoverishment.4,8,13,15,31 Close to half of the families involved in this research make less than the minimum wage as the total family income and expectedly most belonged to the lower social class (Table 1).
The average cost of care of LBW – preterm in this study was N79,719.75 (USD192.66), this is approximately 1.5 times and 2.5 times the cost of care of managing the same clinical condition in studies done in Enugu, south-east Nigeria about 9 years ago and in Ibadan, southwest Nigeria about 14 years ago, respectively. This increased cost of newborn care could be due to the high inflation rate in the country, which is put at above 15.99% in October 2021.32 This increase can also be attributed to the economic depression being experienced by the country that has badly affected the purchasing power of the nation’s currency as evidenced by the US dollar exchanging for the Naira at the rate of 1USD to N413.79 now as against 1USD to N161.1 about 7 years ago. These factors resulted to increase in the cost of goods and services which ultimately led to upward review of hospital bills. The average cost of care of LBW – preterm babies was the highest. This finding is not different from the findings of Ekwochi et al5 in Enugu, Nigeria, and Sunny et al29 in Nepal in which management of preterm babies accounted for the highest cost of care in the newborn unit. This is most likely due to the duration of stay on the ward, investigations, and management of some complications of prematurity that may arise during the period of stay in the newborn unit. This was closely followed by Neonatal Sepsis and Neonatal jaundice in our study. The expenditure on the hospital utilities and consumables formed the highest percentage of the bills for all the different categories of neonatal illnesses managed during the study period. This finding is like that of the report of the study conducted by Ekwochi et al5 in Enugu, Nigeria about seven years ago; however, it is different from the report of Sunny et al29 in Nepal where the cost of hospital stay and supportive treatment accounted for 11% of the total OOPS. This highlights the need for the government to subsidize these aspects of the expenditure to reduce the percentage of the family income that goes into this aspect of OOPS. The median duration of hospital stay, the median expenditure on hospital utilities and consumables, the median expenditure on investigations were all significantly higher for preterm babies (Table 2). These findings will put families with preterm babies at the danger of catastrophic healthcare spending since many of the households involved in this research already belonged to the middle and lower socio-economic classes and most of the expenses were paid for through out-of-pocket means. About 80% of the households that participated in this research spent greater than 10% of their overall monthly family revenue on health-care expenses (CHS).
Studies have shown that families use different coping mechanisms for health shocks that result in OOPS.33,34 When the medical bills exceed a household’s income, households sometimes use their savings, borrow from families and friends, loan money from individuals and financial organizations using collateral, mortgage properties, sell properties, dispose of their livestock and cash crops or farm produce in the short term to be able to offset their hospital bills.6,31,34–37 The findings from this study were not different from the coping mechanisms listed above, these measures will strain the finances of households involved in these practices and can push them ultimately into poverty. This method of healthcare financing is detrimental to the financial prosperity of families and may hinder our Nation from achieving the SDG goal 1 of eradicating extreme poverty by the year 2030. In the developed countries, governments have mechanisms that protect homes from enormous healthcare spending, and most of the mechanisms have to do with increased government investments/spending to take care of the health-care requirements of their people.13–16,33,38,39 Unfortunately, government spending on healthcare in Nigeria and other Sub-Saharan African countries has been insufficient and unbalanced.6,38,40
Health-care financing method, the socio-economic class and the monthly family income were the main predictors of catastrophic healthcare spending (CHS) in this research (Table 5). Out-of-pocket spending (OOPS) could result in adverse effect on the economic wellbeing of individuals and families and could force them into distress financing.41–44 The family income will likely determine the time of presentation in the appropriate facility for care, the ability to carry out the necessary investigations and procure the appropriate and adequate treatment of the newborn illness.
The lower the socio-economic class, the lower the income, the more likely chances of the household being tipped into CHS. Socio-economic class was the most significant predictor of catastrophic health spending (Table 6). This is a function of the parental occupation and their utmost formal scholastic achievement. As has been shown from previous studies, education, especially female education, is key to the survival of the population newborns inclusive. This buttresses the need for female education and empowerment which could result in improved health seeking behaviour and survival of the newborns.
Government spending on the health has been very poor. As low as 4.05% of the total Federal Government of Nigeria’s budget for the year 2021 was allocated to the health sector, this is a far cry from what all African Union members states agreed to in April 2001 Abuja declaration where member states pledged that nothing less than 15% of their annual budgetary plans will be devoted to healthcare financing.45,46 The Nigerian government level of spending on public health is worse than that of her African neighbours.40 The fact that 81.5% of households that participated in this research spent greater than 10% of their overall monthly family revenue on caring for their newborn (CHS) could reflect insufficient investments in the health sector, and with this universal health coverage (UHC) may become a mirage for families with newborns who have health challenge(s) as well as other citizens of the country.6
Recommendation
The way forward includes protecting families against catastrophic healthcare expenditure and huge out-of-pocket spending through the universal health coverage scheme. This scheme can be achieved by strengthening the health insurance scheme by scaling up enrolment of individuals and families irrespective of their monthly income and the socio-economic class. It is also imperative for the health insurance scheme to run smoothly and effectively. Government at all levels need to do more in terms of increasing investment in health and making health-care delivery free for the vulnerable groups in the society or it can be heavily subsidized for these groups of patients, as it is being done in some African countries despite having lower gross domestic product compared to Nigeria.40
Limitation
This study was conducted in the hospital, and it requires recall by the parents of newborns who may be critically sick. Some of these parents may not be emotionally stable to correctly recall all their sources of income and this may affect the classification of their income and socio-economic class.
It was a single-centered study, although this may not necessarily affect the findings.
Conclusion
This study revealed that no socio-economic class is completely protected from catastrophic health spending (CHS) because financing healthcare delivery in Nigeria is mainly through the Out-of-pocket method as 95% of the families in this study cared for their newborn babies using the OOPS method. The families that were affected mostly belonged to the lower socioeconomic class and lower income strata. This observation may explain in part why Nigeria still tops the list of countries with the highest neonatal and child mortality in Africa, despite being one of the largest and richest economies in Africa.5,43 This method of healthcare financing may lead to delay in hospital presentation.
Acknowledgment
The authors appreciate the parents/caregivers of the newborns who participated in this research.
Author Contributions
All the authors made significant contribution to the work reported, that is in the conception, study design, execution, acquisition of data, analysis, and interpretation; also took part in drafting, revising or critically reviewing the article; gave final approval of the version to be published; have agreed on the journal to which the article has been submitted; and agree to be accountable for all aspects of the work.
Disclosure
The authors report no conflicts of interest in this work.
References
1. UN IGME. Levels and Trends in Child Mortality Report 2018. New York, NY: UN Inter-agency Group for Child Mortality Estimation; 2018.
2. Lawn JE, Zupan J, Zupan J. 4 million neonatal deaths: when? Where? Why? 2005. Lancet. 2005;365(9462):891–900. doi:10.1016/S0140-6736(05)71048-5
3. WHO. The Global Burden of Disease: 2004 Update. Geneva: WHO; 2008.
4. Xu K, Evans DB, Kawabata K, Zeramdini R, Klavus J, Murray CJ. Household catastrophic health expenditure: a multicountry analysis. Lancet. 2003;362:111–117. doi:10.1016/S0140-6736(03)13861-5
5. Ekwochi U, Osuorah DC, Ndu IK, et al. Out-of-pocket cost of managing sick newborns in Enugu, southeast Nigeria. ClinicoEconom Outcomes Res. 2014;6:29–35. doi:10.2147/CEOR.S54674
6. Olatunya OS, Ogundare EO, Fadare JO, et al. The Financial burden of Sickle cell disease on households in Ekiti, Southwest Nigeria. ClinicoEconom Outcomes Res. 2015;7:545–553. doi:10.2147/CEOR.S86599
7. Onwujekwe O, Uguru N, Etiaba E, Chikezie I, Uzochukwu B, Adjagba A. The economic burden of malaria on households and the health system in Enugu State Southeast Nigeria. PLoS One. 2013;8(11):e78362. doi:10.1371/journal.pone.0078362
8. Tongo OO, Orimadegun AE, Ajayi SO, Akinyinka OO. The economic burden of preterm low birth weight care in Nigeria. J Trop Pediatr. 2009;55:262–264. doi:10.1093/tropej/fmn107
9. Nabyonga J, Desmet M, Karamagi H, Kadama PY, Omaswa FG, Walker O. Abolition of cost-sharing is pro-poor: evidence from Uganda. Health Policy Plan. 2005;20(2):100–108. doi:10.1093/heapol/czi012
10. World Bank. World development indicators, website; 2011a. Available from: http://data.worldbank.org/indicator/SH.XPD.OOPC.ZS.
11. World Health Organization. World health statistics 2021. Monitoring health for the SDGs. Available from: https://reliefweb.int/report/world/world-health-statistics-2021-monitoring-health-sdgs#:~:text=As%20of%2031%20December%202020%2C%20preliminary%20estimates%20suggest,more%20deaths%20than%20the%201.8%20million%20officially%20reported.
12. Liu L, Oza S, Hogan D, et al. Global, regional, and national causes of under-5 mortality in 2000–15: an updated systematic analysis with implications for the Sustainable Development Goals. Lancet. 2016;388(10063):3027–3035. doi:10.1016/S0140-6736(16)31593-8
13. Xu K, Evans DB, Carrin G, Aguilar-Rivera AM, Musgrove P, Evans T. Protecting households from catastrophic health spending. Health Aff. 2007;26(4):972–983. doi:10.1377/hlthaff.26.4.972
14. Gotsade G, Zoidze A, Rukhadze N. Household catastrophic health expenditure: evidence from Georgia and its policy implications. BMC Health Serv Res. 2009;9:69. doi:10.1186/1472-6963-9-69
15. Chuma J, Maina T. Catastrophic health care spending and impoverishment in Kenya. BMC Health Serv Res. 2012;12:413. doi:10.1186/1472-6963-12-413
16. O’Donnell O, Van Doorslaer E, Wagstaff A, Lindelow M. Analysing Health Equity Using Household Survey Data: A Guide to Techniques and Their Implementation. Washington, DC: The World Bank; 2008.
17. National minimum wage act 2011. Explanatory memorandum.
18. Onoka CA, Onwujekwe OE, Uzochukwu BS, Ezumah NN. Promoting universal financial protection: constraints and enabling factors in scaling-up coverage with social health insurance in Nigeria. Health Res Policy Syst. 2013;11:20. doi:10.1186/1478-4505-11-20
19. World Health Organization. World Health Statistics 2015. Geneva: World Health Organization; 2015.
20. National Bureau of Statistics. Available from: www.nigerianstat.gov.ng.
21. National Population Census Official Gazette. Legal notice on publication of 2006 census final results if the Federal Republic of Nigeria, 2006. Annex a B C. 2009;96(2):B1–B42.
22. The Official Website of Ekiti State Government. Available from: http://www.ekitistate.gov.ng.
23. Nigeria: minimum wage 2018–2020/ Statista. Available from: www.statista.com/statistics/1119133/monthly-minimum-wage-in-nigeria/.
24. National Health Insurance Scheme (NHIS) in Nigeria. Available from: http://nhis.gov.ng.
25. The Central Bank of Nigeria. Exchange rate. Available from: https://www.cbn.gov.ng/rates/ExchRateByCurrency.asp.
26. Oyedeji GA. Socioeconomic and cultural background of hospitalised children in Ilesa. Niger J Paediatr. 1985;13:111–117.
27. Oseni TA, Odewale M. Socioeconomic status of parents and the occurrence of pelvic inflammatory disease among undergraduates attending Irrua Specialist Teaching Hospital, Irrua, Edo State, Nigeria. Niger Postgrad Med J. 2017;24(2):114–120. doi:10.4103/npmj.npmj_28_17
28. IBM Corp. IBM SPSS Statistics for Windows, Version 25.0. Armonk, NY: IBM Corp; 2019.
29. Sunny AK, Gurung R, Gurung A, Basnet O, Ashish KC. Out of pocket expenditure for sick newborn care in referral hospitals of Nepal. Matern Child Health J. 2020;24(Suppl 1):S57–S65. doi:10.1007/s10995-020-02881-y
30. United Nations Global Impact. Poverty. Available from: https://www.unglobalcompact.org/what-is-gc/our-work/social/poverty.
31. Leive A, Xu K. Coping with out-of-pocket health payments: empirical evidence from 15 African countries. Bull World Health Organ. 2008;86(11):849–856. doi:10.2471/BLT.07.049403
32. Nigeria Inflation Rate. Trading economics. Available from: https://tradingeconomics.com/nigeria/inflation-cpi.
33. Russell S. Ability to pay for health care: concepts and evidence. Health Policy Plan. 1996;11:219–237. doi:10.1093/heapol/11.3.219
34. McIntyre D, Thiede M, Dahlgren G, Whitehead M. What are the economic consequences for households of illness and of paying for health care in low- and middle-income country contexts? Soc Sci Med. 2006;62:858–865. doi:10.1016/j.socscimed.2005.07.001
35. Van Damme W, Van Leemput L, Por I, Hardeman W, Meessen B. Out-of-pocket health expenditure and debt in poor households: evidence from Cambodia. Trop Med Int Heal. 2004;9(2):273–280. doi:10.1046/j.1365-3156.2003.01194.x
36. Husøy OK, Molla SM, Muluken G, Marie MK, Frithof NO, Ingrid M. Selling my sheep to pay for medicines - household priorities and coping strategies in a setting without universal health coverage. BMC Health Serv Res. 2018;18(1):1–12. doi:10.1186/s12913-017-2770-6
37. Mock CN, Gloyd S, Adjei S, Acheampong F, Gish O. Economic consequences of injury and resulting family coping strategies in Ghana. Accid Anal Prev. 2003;35(1):81–90. doi:10.1016/S0001-4575(01)00092-6
38. The World Databank. Poverty level and inequality database; 2010. Available from: http://www.brookings.edu/researchpapers/2013/06/achieving-universal-health-coverage-nigeria.
39. Mohanty RK, Behera DK. How effective is public health care expenditure in improving health outcome? An empirical evidence from the Indian states. 2020.
40. Gutstafsson-Wright E, Schellekens O. Achieving universal health coverage in Nigeria one state at a time: a public-private partnership community-based health insurance model. Brooke Shearer Working Paper Series; 2013:1–28 Available from: http://www.brookings.edu_media/research.
41. Mishra S, Mohanty SK. Out-of-pocket expenditure and distress financing on institutional delivery in India. Int J Equity Health. 2019;18:99. doi:10.1186/s12939-019-1001-7
42. Kastor A, Mohanty SK. Disease-specific out-of-pocket and catastrophic health expenditure on hospitalization in India: do Indian households face distress health financing? PLoS One. 2018;13(5):1–18. doi:10.1371/journal.pone.0196106
43. Joe W. Distressed financing of household out-of-pocket health care payments in India: incidence and correlates. Health Policy Plan. 2015;30(6):728–741. doi:10.1093/heapol/czu050
44. Ezeoke OP, Onwujekwe OE, Uzochukwu BS. Towards universal coverage: examining costs of illness, payment, and coping strategies to different population groups in Southeast Nigeria. Am J Trop Med Hyg. 2012;86(1):52–57. doi:10.4269/ajtmh.2012.11-0090
45. 15% benchmark to health sector in Nigeria – the journey so far. Available from: https://drpcngr.org/wp-content/uploads/2021/04/15-BENCHMARK-TO-HEALTH-SECTOR-IN-NIGERIA-MODIFIED-02-REDUCED.
46. WHO. The Abuja declaration: ten years on. Available from: http://www.who.int/healthsystem/publications/Abuja10.pdf.
 © 2022 The Author(s). This work is published and licensed by Dove Medical Press Limited. The full terms of this license are available at https://www.dovepress.com/terms.php and incorporate the Creative Commons Attribution - Non Commercial (unported, v3.0) License.
By accessing the work you hereby accept the Terms. Non-commercial uses of the work are permitted without any further permission from Dove Medical Press Limited, provided the work is properly attributed. For permission for commercial use of this work, please see paragraphs 4.2 and 5 of our Terms.
© 2022 The Author(s). This work is published and licensed by Dove Medical Press Limited. The full terms of this license are available at https://www.dovepress.com/terms.php and incorporate the Creative Commons Attribution - Non Commercial (unported, v3.0) License.
By accessing the work you hereby accept the Terms. Non-commercial uses of the work are permitted without any further permission from Dove Medical Press Limited, provided the work is properly attributed. For permission for commercial use of this work, please see paragraphs 4.2 and 5 of our Terms.