")
Back to Journals » Diabetes, Metabolic Syndrome and Obesity » Volume 13
Incidence and Intensity of Catastrophic Health-care Expenditure for Type 2 Diabetes Mellitus Care in Iran: Determinants and Inequality
Authors Piroozi B , Mohamadi-Bolbanabad A, Moradi G , Safari H , Ghafoori S, Zarezade Y, Bidarpour F, Rezaei S
Received 22 May 2020
Accepted for publication 19 July 2020
Published 18 August 2020 Volume 2020:13 Pages 2865—2876
DOI https://doi.org/10.2147/DMSO.S263571
Checked for plagiarism Yes
Review by Single anonymous peer review
Peer reviewer comments 2
Editor who approved publication: Prof. Dr. Muthuswamy Balasubramanyam
Bakhtiar Piroozi,1 Amjad Mohamadi-Bolbanabad,1 Ghobad Moradi,1 Hossein Safari,2 Shahnaz Ghafoori,1 Yadolah Zarezade,1 Farzam Bidarpour,1 Satar Rezaei3
1Social Determinants of Health Research Center, Research Institute for Health Development, Kurdistan University of Medical Sciences, Sanandaj, Iran; 2Health Promotion Research Center, Iran University of Medical Science, Tehran, Iran; 3Research Center for Environmental Determinants of Health, Health Institute, Kermanshah University of Medical Sciences, Kermanshah, Iran
Correspondence: Satar Rezaei
Research Center for Environmental Determinants of Health, Health Institute, Kermanshah University of Medical Sciences, Kermanshah, Iran
Email [email protected]
Background: The present study aimed to assess the prevalence and intensity of catastrophic health-care expenditures (CHE) relating to type 2 diabetes mellitus care and inequality in facing such expenditures in Iran.
Methods: A total of 1065 type 2 diabetes patients were included in this cross-sectional study. A multistage sampling method was used to select the samples. Data on sociodemographic characteristics, economic status, health and diabetic costs were collected using a self-constructed questionnaire. We used capacity to pay (CTP) of households to calculate the incidence of CHE due to diabetic care at four different thresholds. The mean positive overshoot (MPO) and overshoot were used to assess the intensity of CHE. The relative concentration index and slope index of inequality (SII) were used to measure socioeconomic-related inequalities in incidences of CHE. In addition, decomposition methods were used to identify the main factors affecting observed inequality in CHE.
Results: The incidence of CHE at the 10, 20, 30, and 40% of CTP thresholds for type 2 diabetes mellitus care was 57.5, 28.9, 16.5, and 11.4%, respectively. The results of CI and SII indices for CHE due to diabetic care indicated that the incidence of CHE was more prevalent among patients with lower socioeconomic groups. The decomposition analysis showed that the socioeconomic status, marital status and gender of patients were the main factors contributing to socioeconomic inequality in incidence of CHE among the poor.
Conclusion: Our study demonstrated that the incidence and intensity of CHE due to diabetic care were relatively high, particularly among socioeconomically disadvantaged patients. Modification to the present health care financing strategies is recommended in order to protect lower socioeconomic groups against the financial burden of diabetic care.
Keywords: catastrophic cost, diabetes, inequalities, socioeconomic status
Introduction
Diabetes mellitus is the most prevalent disease due to metabolic disorders and it is also one of the most costly chronic diseases around the world whose prevalence rate is rapidly on the increase in Iran and throughout the world because of the changes in lifestyle, aging of population, improvement in hygiene and treatment conditions which lead to higher life expectancy.1–3 The number of diabetics has risen from 108 million in 1980 to 422 million in 2014 and it is estimated that this number will reach up to 552 million people by 2030.4,5 The most important side-effects of diabetes can be cardiovascular diseases, kidney failure, nervous disorders, and eye complications and in 2016 it was the seventh cause of death across the world with a death toll exceeding 1.6 million.6 In Iran, in 2018, approximately 5.3 million people were diagnosed with diabetes and 805 million people with prediabetes and the prevalence of diabetes was reported 11% among people over 25. In Iran, the population of diabetics rises by one percent annually.7 Type 2 diabetes is the most common type of diabetes that includes 90% of the total diabetic cases. It is more prevalent among elderly adults but because of obesity, sedentary lifestyle and poor nutrition, it is increasingly noticeable among children, teenagers and young adults.8–10
Diabetes usually puts a heavy economic burden on patients and their families.11–13 According to a report from the International Federation of Diabetes, most countries spend approximately 10% of their total annual health budget for diabetes. The World Health Organization’s budget to treat and prevent diabetic complications was estimated to be between 673 and 1919 billion dollars in 2015. It is predicted that this number will rise to between 802 and 1452 billion dollars by 2040. The average cost for treating and managing each diabetic patient was between 1622 and 2886 dollars around the world in 2015.14,15 The annual expenditures of diabetes in Iran, including direct and indirect costs, are estimated to be four billion dollars.7 Direct and indirect expenditures of diabetes and its complications can result in imposing an economic burden on patients and their families and it may cause families to fall below the poverty line and encounter catastrophic health expenditure (CHE).8,11,16 The index of CHE is used to measure the performance of health systems in relation to patients’ financial protection against health costs.17 CHEs are considered as extremely high health-care costs in proportion to people’s income beyond which people are forced to sacrifice their basic needs. According to the World Health Organization, when a family spends more than 40% of its income for health care after food cost deductions, this cost is regarded as high; however, countries can determine that threshold according to their own socioeconomic conditions.11,18,19
Diabetics in low-income developing countries experience the high risk of economic burden and disastrous health costs due to frequent referral to health-care centers and high out-of-pocket payments (OOPs).8,20 Although some countries have health-care insurance systems to cover some diabetic costs, high OOPs can still cause a lot of problems due to the existing inefficient risk division mechanisms.8,21 Diabetics should receive high quality treatment if they suffer from acute symptoms and severe complications which are usually costly and in low-income developing countries, a high percentage of these are OOPs. This puts a lot of patients and their families at a higher financial risk. Identifying the imposed financial risk on diabetic patients due to health-care costs and the other related factors can lead to more effective efforts to alleviate this problem.11 Many studies have been conducted on health-care expenditures and have examined the incidence of CHE among households in Iran17,22-24 but no studies have been done so far among the diabetics on the index of CHE which causes poverty. A study by Rezaei and Hajizadeh25 showed that 5.26% of Iranian households faced CHE in 2017. Another study in Iran26 showed that incidence of CHE among the general population was 2.57% in 2008 and 3.25% in 2015. One of the main ways for health-care financing in Iran is OOPs and a study indicated that the OOPs accounted for 47% of total health expenditure in 2014.27 The present study aimed to assess the prevalence and intensity of CHE relating to type 2 diabetes mellitus care and inequality in facing such expenditures in Iran in 2019.
Methods
Study Setting
This was a cross-sectional study conducted on type 2 diabetic patients in Iran. The prevalence of type 2 diabetes is between 9.9 and 14.4% among Iranian adults and it is estimated that its annual growth rate will reach the second ranking in the Middle East after Pakistan by 2030.28,29 Iran is one of the 21 countries and territories of the International Diabetes Federation15 MENA region. Four hundred and sixty-three million people have diabetes in the world and 55 million people in the MENA region; by 2045, this will rise to 108 million. The prevalence of diabetes and total cases of diabetes in adults in Iran is 9.4% and 5,387,200, respectively.27
Study Participants
The study population consisted of all type 2 diabetic patients who had been referred to diabetic clinics in Iran. The sample size was 384 for each province and the total sample size for the three provinces was 1152. According to the following formula, the study population was obtained with this assumption that 50% of these families are paying CHE with a reliability of 95% and accuracy of 5%:
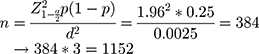
There was a multistage sampling in this research according to which provinces were divided into three clusters and one province was selected from each cluster. In the next stage, from among the list of clinics and diabetic centers in each province, four centers were chosen. Then, according to the list of patients covered in each center, the participants were selected based on simple random sampling and they were asked to refer to the center for filling out a questionnaire and periodic blood sugar tests. Having an active record and being under care for at least 12 months were among the conditions of participating in this study.
Data Collection and Variables
At first, the participants were contacted and asked whether they were willing to participate in the study or not. If they accepted, an appointment was arranged for face-to-face interview and filling out a questionnaire in diabetes care centers. The interview was conducted by a group of trained interviewers in each province. In order to be sure about the reliability of data collection, the supervisor of the interviewers checked all the questionnaires. The questionnaire included participants’ demographic information (age, sex, marital status, job, education, family size, insurance type, socioeconomic condition, health care and food costs, total family expenditures) and sickness records (the duration of diabetes, using hospitalization services, background of diabetic complications).
Variables
Independent Variables
The proposed method of O’Donnell et al was used30 to determine the socioeconomic status of the household. The questionnaire was used to assess household assets, including LCD television, separate refrigerators, washing machines, cell phones, dishwashers, microwave ovens, Internet access, private cars, and home, and the number of rooms. The asset index for each individual was calculated using principal component analysis and the studied population was classified into 4 quartiles of 1 (the poorest), 2, 3, and 4 (the richest).
The asset index has been previously used in some studies to determine SES in the Iranian population.31 Use of inpatient services is a dichotomous variable (yes/no) that is assessed by the question “Has he/she been hospitalized in the past month due to diabetes or its complications?”
The history of the complications of diabetes is also a dichotomous variable (has/does not have) that was evaluated by examining the patient’s medical record and asking the patient about the complications of diabetes, including any eye, renal, nerve, heart, and diabetes complications. Other independent variables included gender (male or female), age group (22–55, 56–65, and 66–86), household size (1–2, 3–4, and ≤5), education (illiterate/elementary, middle school/high school, university degree), marital status (never married, married, divorced/widow), employment status (housewife/unemployed, retired, self-employed, employed by an organization), type of health insurance (Iranian insurance, armed forces insurance, social security insurance, and other insurances), and duration of diabetes (≥5, 5–10, >10).
Statistical Analysis
The mean (standard deviation) for the variables of the total monthly household expenses, household food expenses, and OOP expenses for household health services was calculated. In addition, frequency distribution tables for independent and demographic variables as well as frequency percentage for incidence and intensity of CHE were calculated in four thresholds of capacity to pay (10%, 20%, 30%, and 40%).
In this study, a method presented by WHO,32 was utilized to estimate the incidence and intensity of CHE. In this study, if the amount of OOPs related to diabetes costs exceeds 40% of household’s capacity to pay, that family will be regarded as a family with CHEs. The method and details of calculating the incidence of CHE has been mentioned in some other studies.30,33 In summary, the following formula was used to calculate the incidence of CHE due to type 2 diabetes mellitus care:
Step 1: Adjusting the household size using 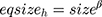 (as per pervious study; β is equal to 0.5634).
Step 2: Calculation of poverty line as follows: 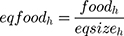 and
and 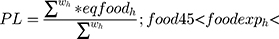
 (W is the sampling weight of household)
Step 3: Subsistence spending of household 

Step 4: Calculation of CTP
CTP= Total household expenditure- household food expenditure if 
or
CTP= Total household expenditure- seh if 
Step 5: Calculation of CHE using  (if it is ≥0.4; the household has faced CHE).
The intensity of CHE indicates how much families spend for health care beyond a defined threshold. In this research, two indices of overshoot and mean positive overshoot (MPO) were used for determining the intensity of CHE. Overshoot measure is the average amount of OOPs which exceeds the threshold (40% of household’s capacity to pay) in the total sample of families in terms of percentage. MPO shows the average OOPs for health care that exceeds the threshold just among the families who have encountered CHE. The following formulae were used to calculate the overshoot and MPO, respectively.30
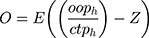
Where o is the overshoot; ooph is the OOP for health care services; ctph shows the capacity to pay of household and Z is the threshold (ie, 0.4).

Where HC is the head count and is equal to proportion of household facing the CHE.
Two methods of concentration index and slope index of inequality (SII) were used to measure socioeconomic inequalities in the incidence of CHE for type 2 diabetes mellitus care.35 The concentration index36 is defined based on the concentration curve. Concentration curve plots the cumulative percentage of respondents ordered by socioeconomic status on x-axis against the cumulative percentage of outcome variable (incidence of CHE in this study) on y-axis. If the concentration curve is below (above) the perfect equality line, it suggests that the incidence of CHE is more concentrated among the rich (poor).36 The CI is on a scale of 1 to −1, with positive (negative) values indicating greater CHE concentration in wealthy (poor) socioeconomic households.
Considering that the outcome variable in this study is binary; therefore, the estimated CI is not between −1 and +1. As suggested by Wagstaff, the CI was normalized through dividing it by  , where μ is the mean of the CHE.37 The SII is defined as the absolute difference in the incidence of CHE between the wealthiest and the poorest groups. A positive sign of SII denotes that incidence of CHE is mostly concentrated among the poor and vice versa. For instance, if the SII for incidence of CHE is 0.30, the incidence of CHE in the poorest group would be 0.30 higher than that of the wealthiest group.
Analytical approach was used to determine the variables affecting inequality in the incidence of catastrophic expenditures in diabetic patients. With regard to the following linear regression, there is a link between incidence of CHE, y, and the explanatory variable, xk.
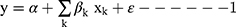
Where  is the explanatory variable mentioned above. The CI for incidence of CHE could be decomposed using the following formula:
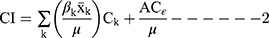
Where  shows the CI for CHE,
  is the mean of determinants
 ,
,  is the
  for explanatory factor
 ,
,  is the elasticity of incidence of CHE with respect to the explanatory variable
 . The
. The  shows the contribution of explanatory factor
 to the
  . The last term,
 , is the residual component. Considering that our measure of inequality is normalized CI; therefore, we used the following formula in the decomposition analysis.
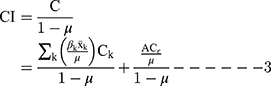
Since the outcome variable is binary in this study, we used the logistic regression model to obtain the marginal effect of the determinants in the decomposition analysis. All analyses were performed using Stata 14.2 (Stata Corporation, College Station, TX, USA) and p<0.05 was considered statistically significant.
Results
The descriptive characteristics of the study patients by incidence of CHE for type 2 diabetes mellitus care are reported in Table 1. A total of 1065 type 2 diabetes patients were included in the study, of which 70.9% (n=755) were women, 90.8% (n=967) were married and 67.1% (n=715) were housewives or unemployed. The average (SD) age of the study patients was 58.9 years (10.3). In addition, approximately 14% of patients reported that they had used inpatient services in the last year as a result of type 2 diabetes and nearly 74% had diabetes complications.
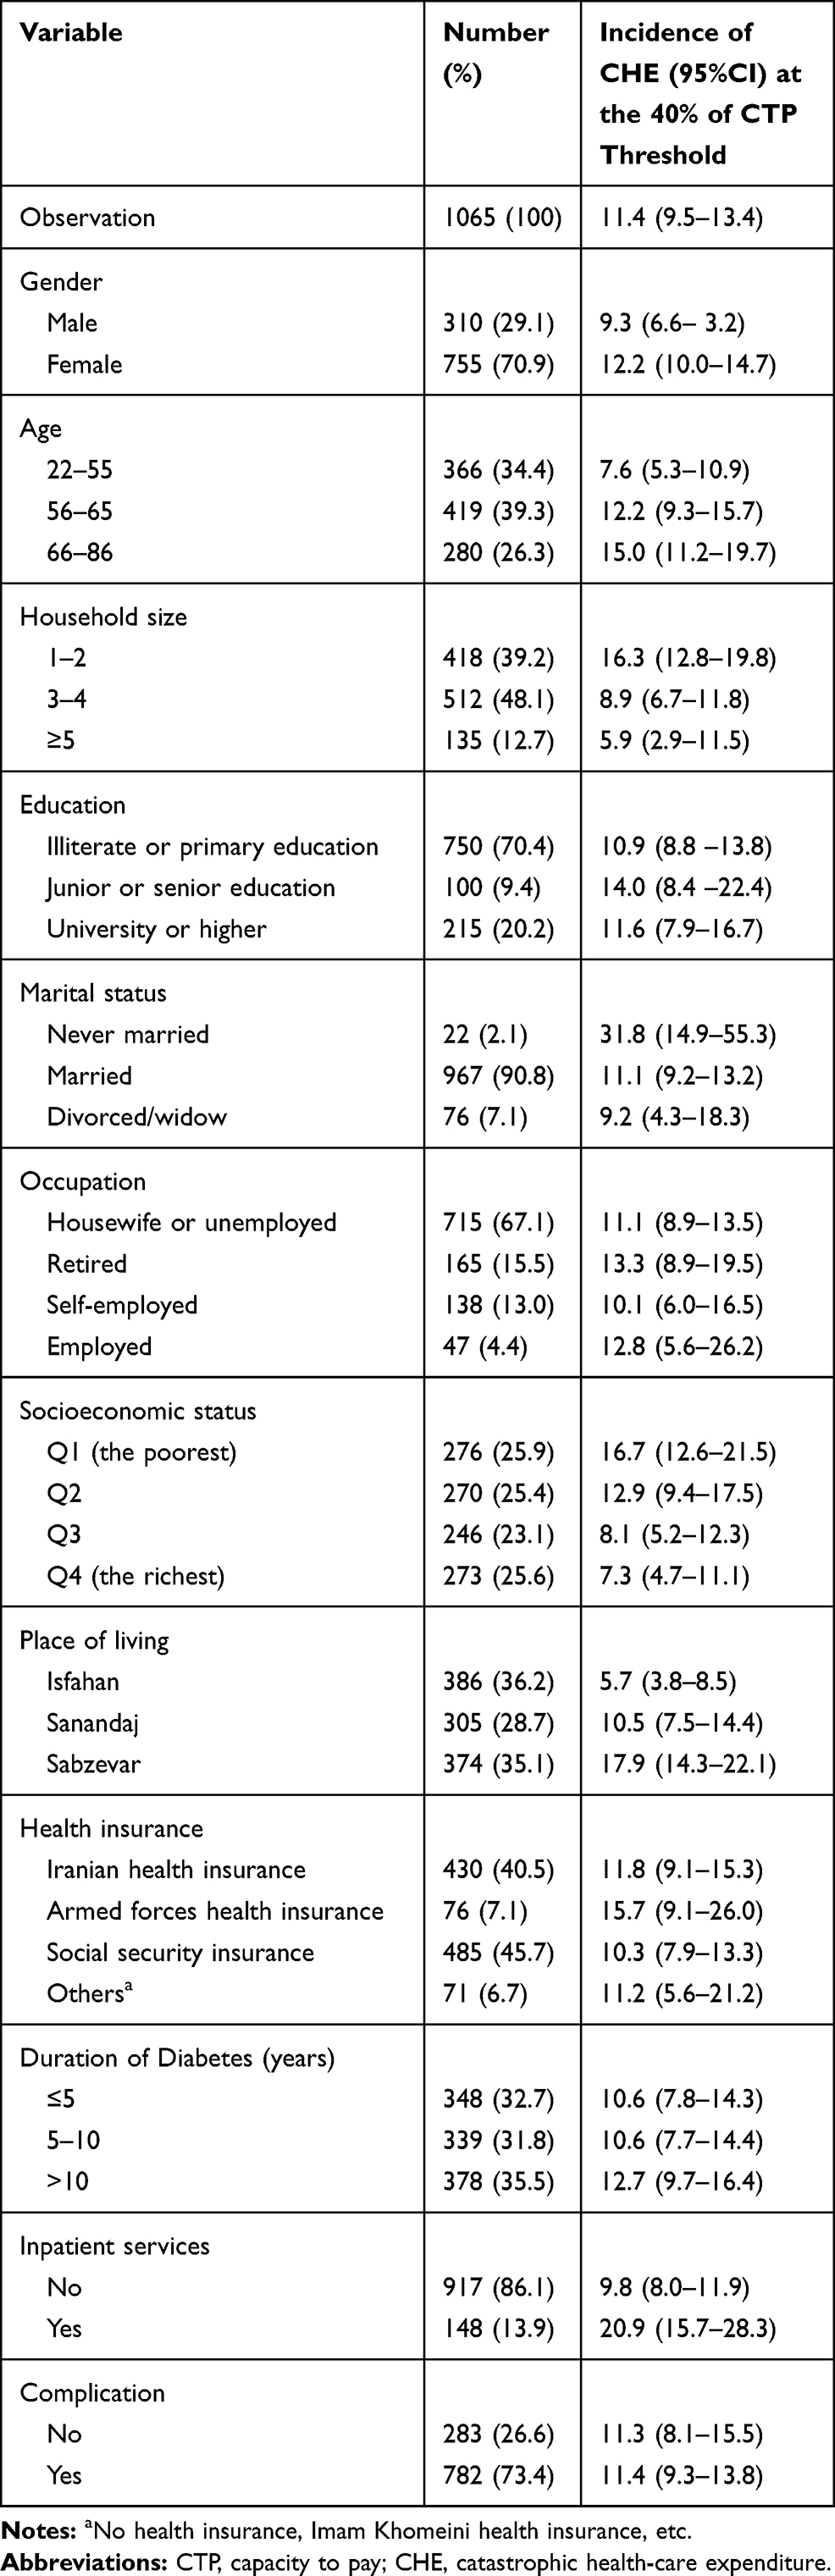 |
Table 1 Descriptive Characteristics of Type 2 Diabetes Mellitus Patients by Incidence of CHE |
The average monthly household expenditures, monthly food expenditure, OOP for health care in the last month and monthly spending for diabetic care was 17,882,910, 9,222,480, 2,574,630, and 1,547,650 Iranian Rials (IRR), respectively. On average, at the 40% of CTP threshold, 11.4% (n=121) of the total samples had faced CHE due to type 2 diabetes mellitus care over the last month (Table 2). The incidence of CHE of household for diabetic men and women was 9.3 and 12.2%, respectively. While the incidence of CHE of household for diabetic care in Isfahan city was 5.7% (95%CI: 3.8– 8.5), it was 10.5% (95%CI: 7.5– 14.4) and 17.9% (95%CI: 14.3– 22.1) in Sanandaj and Sabzevar cities, respectively.
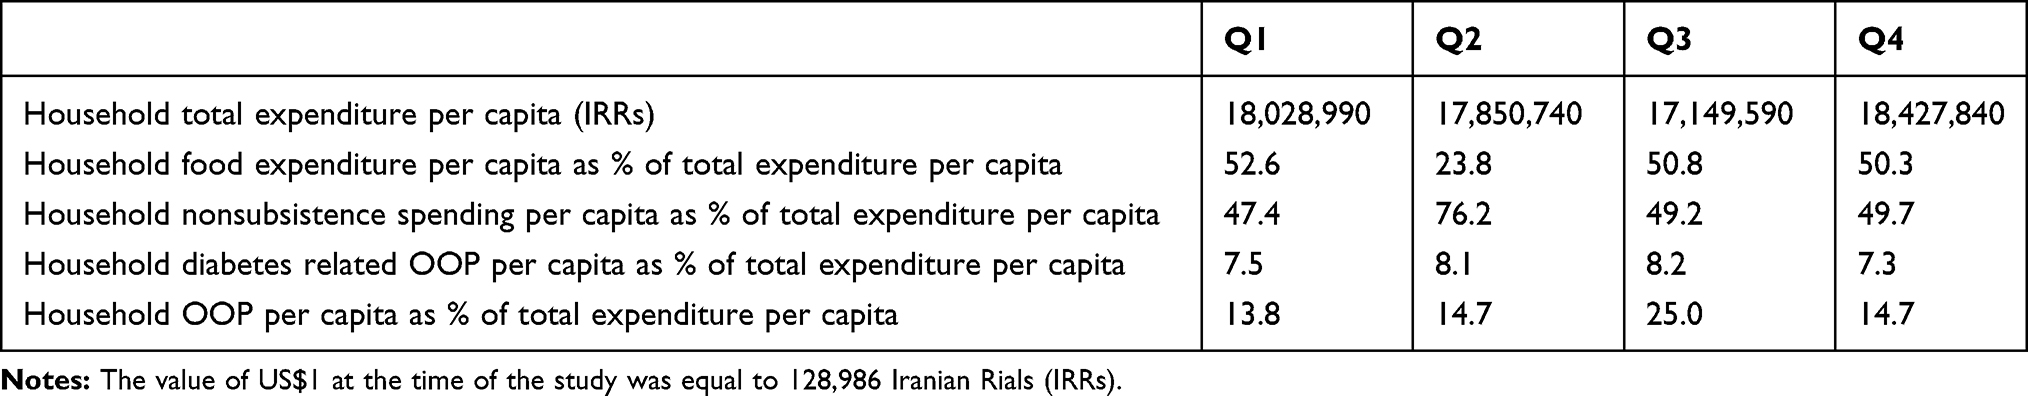 |
Table 2 Descriptive Statistics of Type of Household Expenditure by Socioeconomic Status |
The incidence and intensity of CHE at different CTP thresholds (10, 20, 30, and 40%) for type 2 diabetes mellitus care are presented in Table 3 by economic status of the households. As indicated in the table, the incidence of CHE of household for diabetic patients in quartile 1 (the poorest) is higher than quartile 4 (the richest) for all thresholds. For example, at the 20% of CTP threshold, the incidence of CHE of household among the poorest was 33.3%, while it was 25.2% in the richest groups. The study indicated that the intensity of CHE (ie, the overshoot at different thresholds) varied from 3.7% in quartile 1 to 2.0% in quartile 4. With regard to MPO, this indicator for the poorest and richest at the 40% of CTP threshold was 22.4 and 27.8%, respectively.
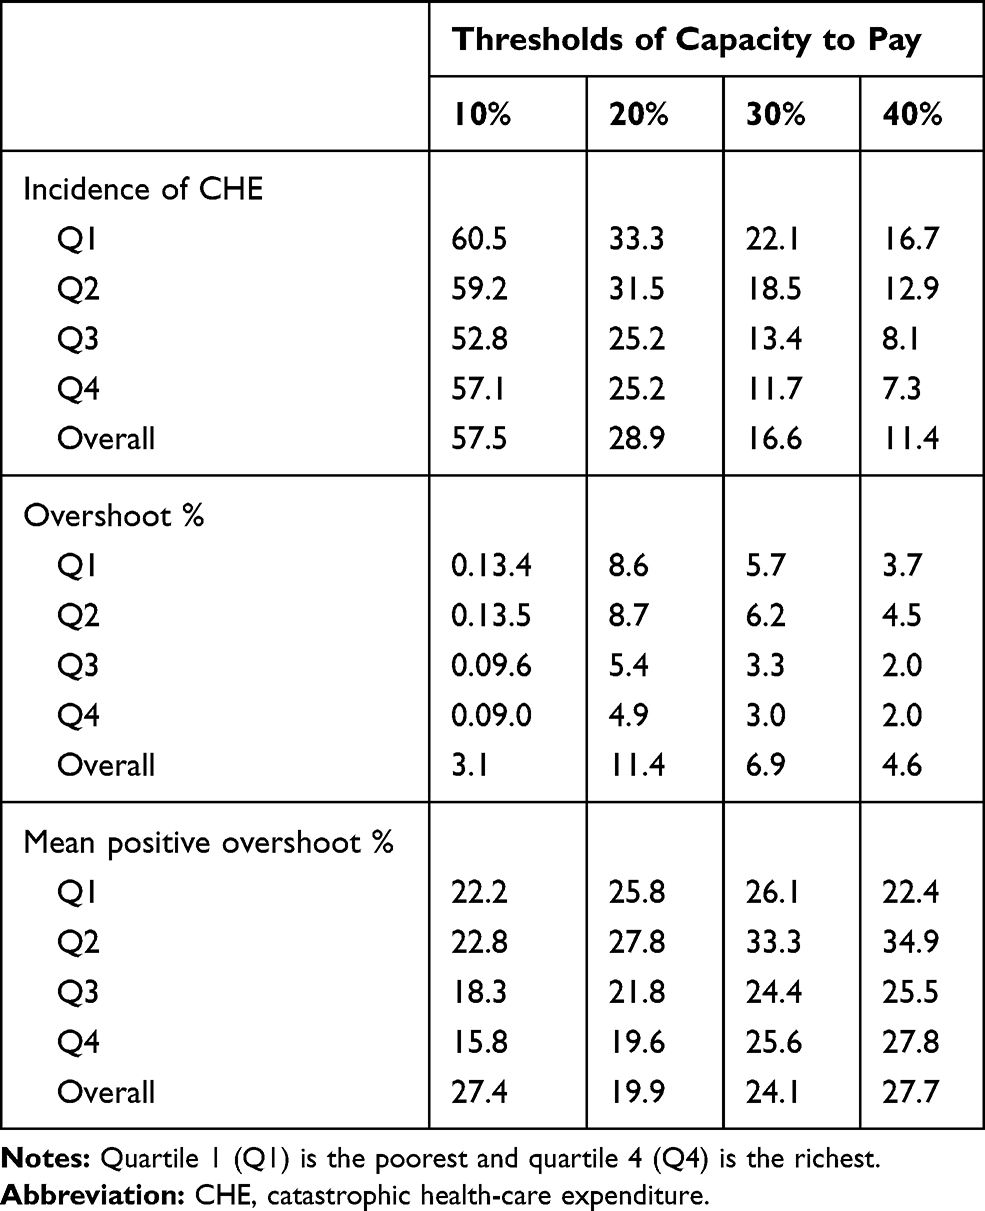 |
Table 3 Incidence and Intensity of CHE for Type 2 Diabetes Mellitus Care by Socioeconomic Status |
Table 4 presents the results of univariate and multivariate logistic regression of determinants of CHE at the 40% of CTP threshold among patients with type 2 diabetes mellitus in Iran for 2019. As illustrated in the table, univariate analyses indicate that households with older patients (p<0.05), patients from small households (p<0.05), patients from lower socioeconomic status (SES) (p<0.05), those living in Sanandaj and Sabzevar cities (p<0.05), patients who were married or widow/divorced (p<0.05) and who had used inpatient care over the past year (p<0.05) were more likely to face CHE for type 2 diabetes mellitus. Multivariate logistic indicated that older age of the patients, being female, married or widow/divorced, socioeconomic status of the households, place of living and use of inpatient services by diabetic patients were the main determinants of CHE of household for type 2 diabetes mellitus. For example, the study indicated that if a household has a female diabetic patient, that household is 1.73 times more likely to experience CHE.
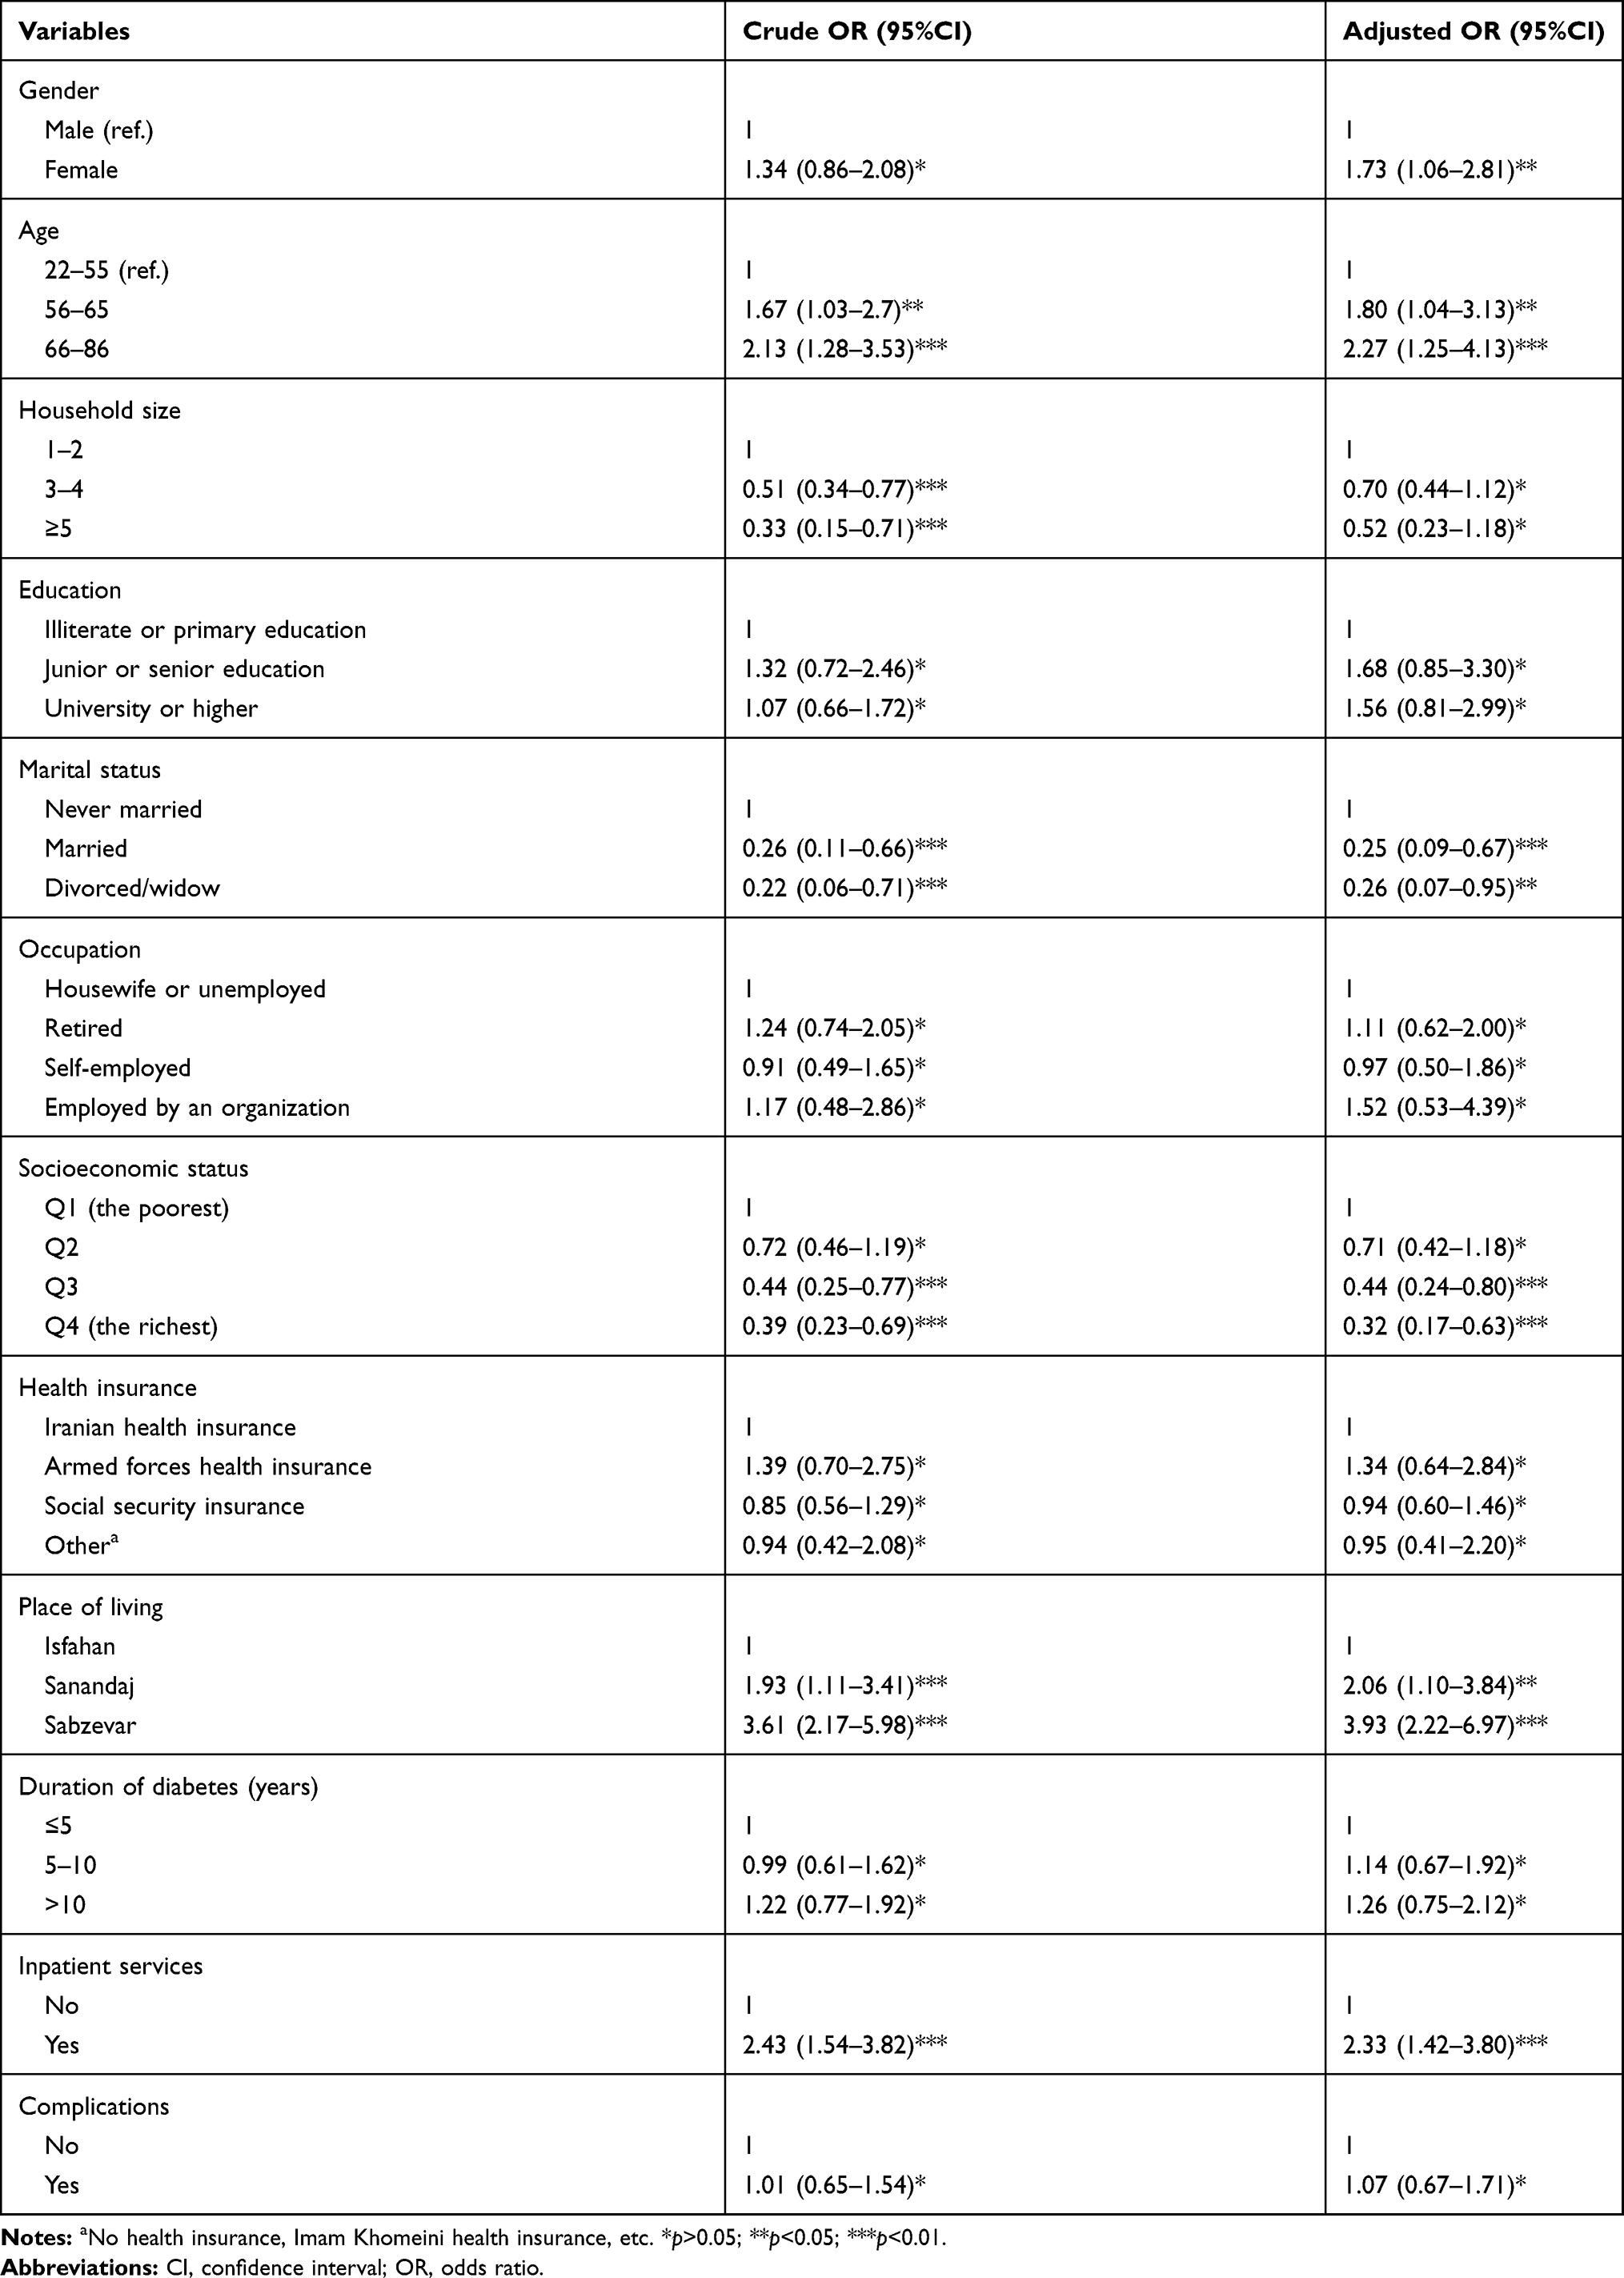 |
Table 4 Results of Multivariate Logistic Regression of Determinants of Incidence of CHE for Type 2 Diabetes Mellitus at the 40% of CTP Threshold, Iran, 2019 |
Table 5 shows the results of relative concentration index and SII of CHE for type 2 diabetes mellitus care. As indicated in the table, for both indices and for all thresholds, the incidence of CHE is more concentrated among the socioeconomically disadvantaged households. The results of CC of incidence of CHE for type 2 diabetes mellitus care are demonstrated in Figure 1. In addition, the results of concentration curve showed that the CC lies above perfect equality line for four different levels of CTP; indicating that the incidence of CHE is more prevalent among the poor.
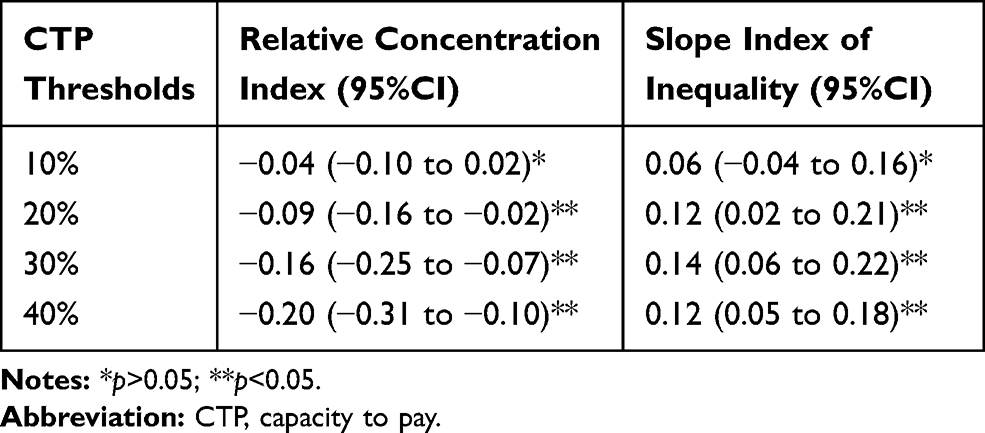 |
Table 5 Results of Relative Concentration Index and Slope Index of Inequality for Incidence of CHE Among Patients with Type 2 Diabetes Mellitus |
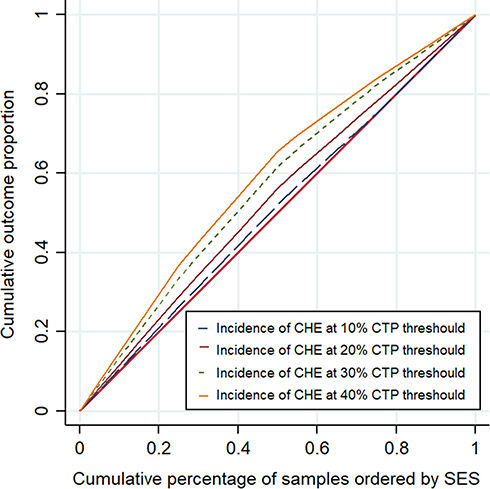 |
Figure 1 Concentration curve for incidence of CHE for type 2 diabetic care in different CTP thresholds. |
The decomposition results of the relative concentration index for incidence of CHE for type 2 diabetes mellitus care in Iran are reported in Table 6. The concentration index for explanatory variables indicated that being female, older adults (aged 66 and above), use of inpatient services and having diabetes complications are more prevalent among the households with lower socioeconomic status. While those diabetic patients who were married and widow/divorced, were more educated and who were from larger households were more concentrated among the rich families. Main findings of the decomposition analyses are reported in the last column in Table 5. As illustrated in the column, the main factors contributing to socioeconomic inequality in incidence of CHE among the poor were the socioeconomic status (88%), marital status (3.8%), gender of patients (3.2%), household size (2.7%), use of inpatient services (2.5%), diabetes complications (less than 1%), and duration of diabetes (less than 1%). The results suggested that 77.6% of socioeconomic-related inequality in incidence of CHE for type 2 diabetes mellitus care were explained by explanatory variables included in the study and the remaining 22.4% was associated with the variables that were not included in our decomposition model.
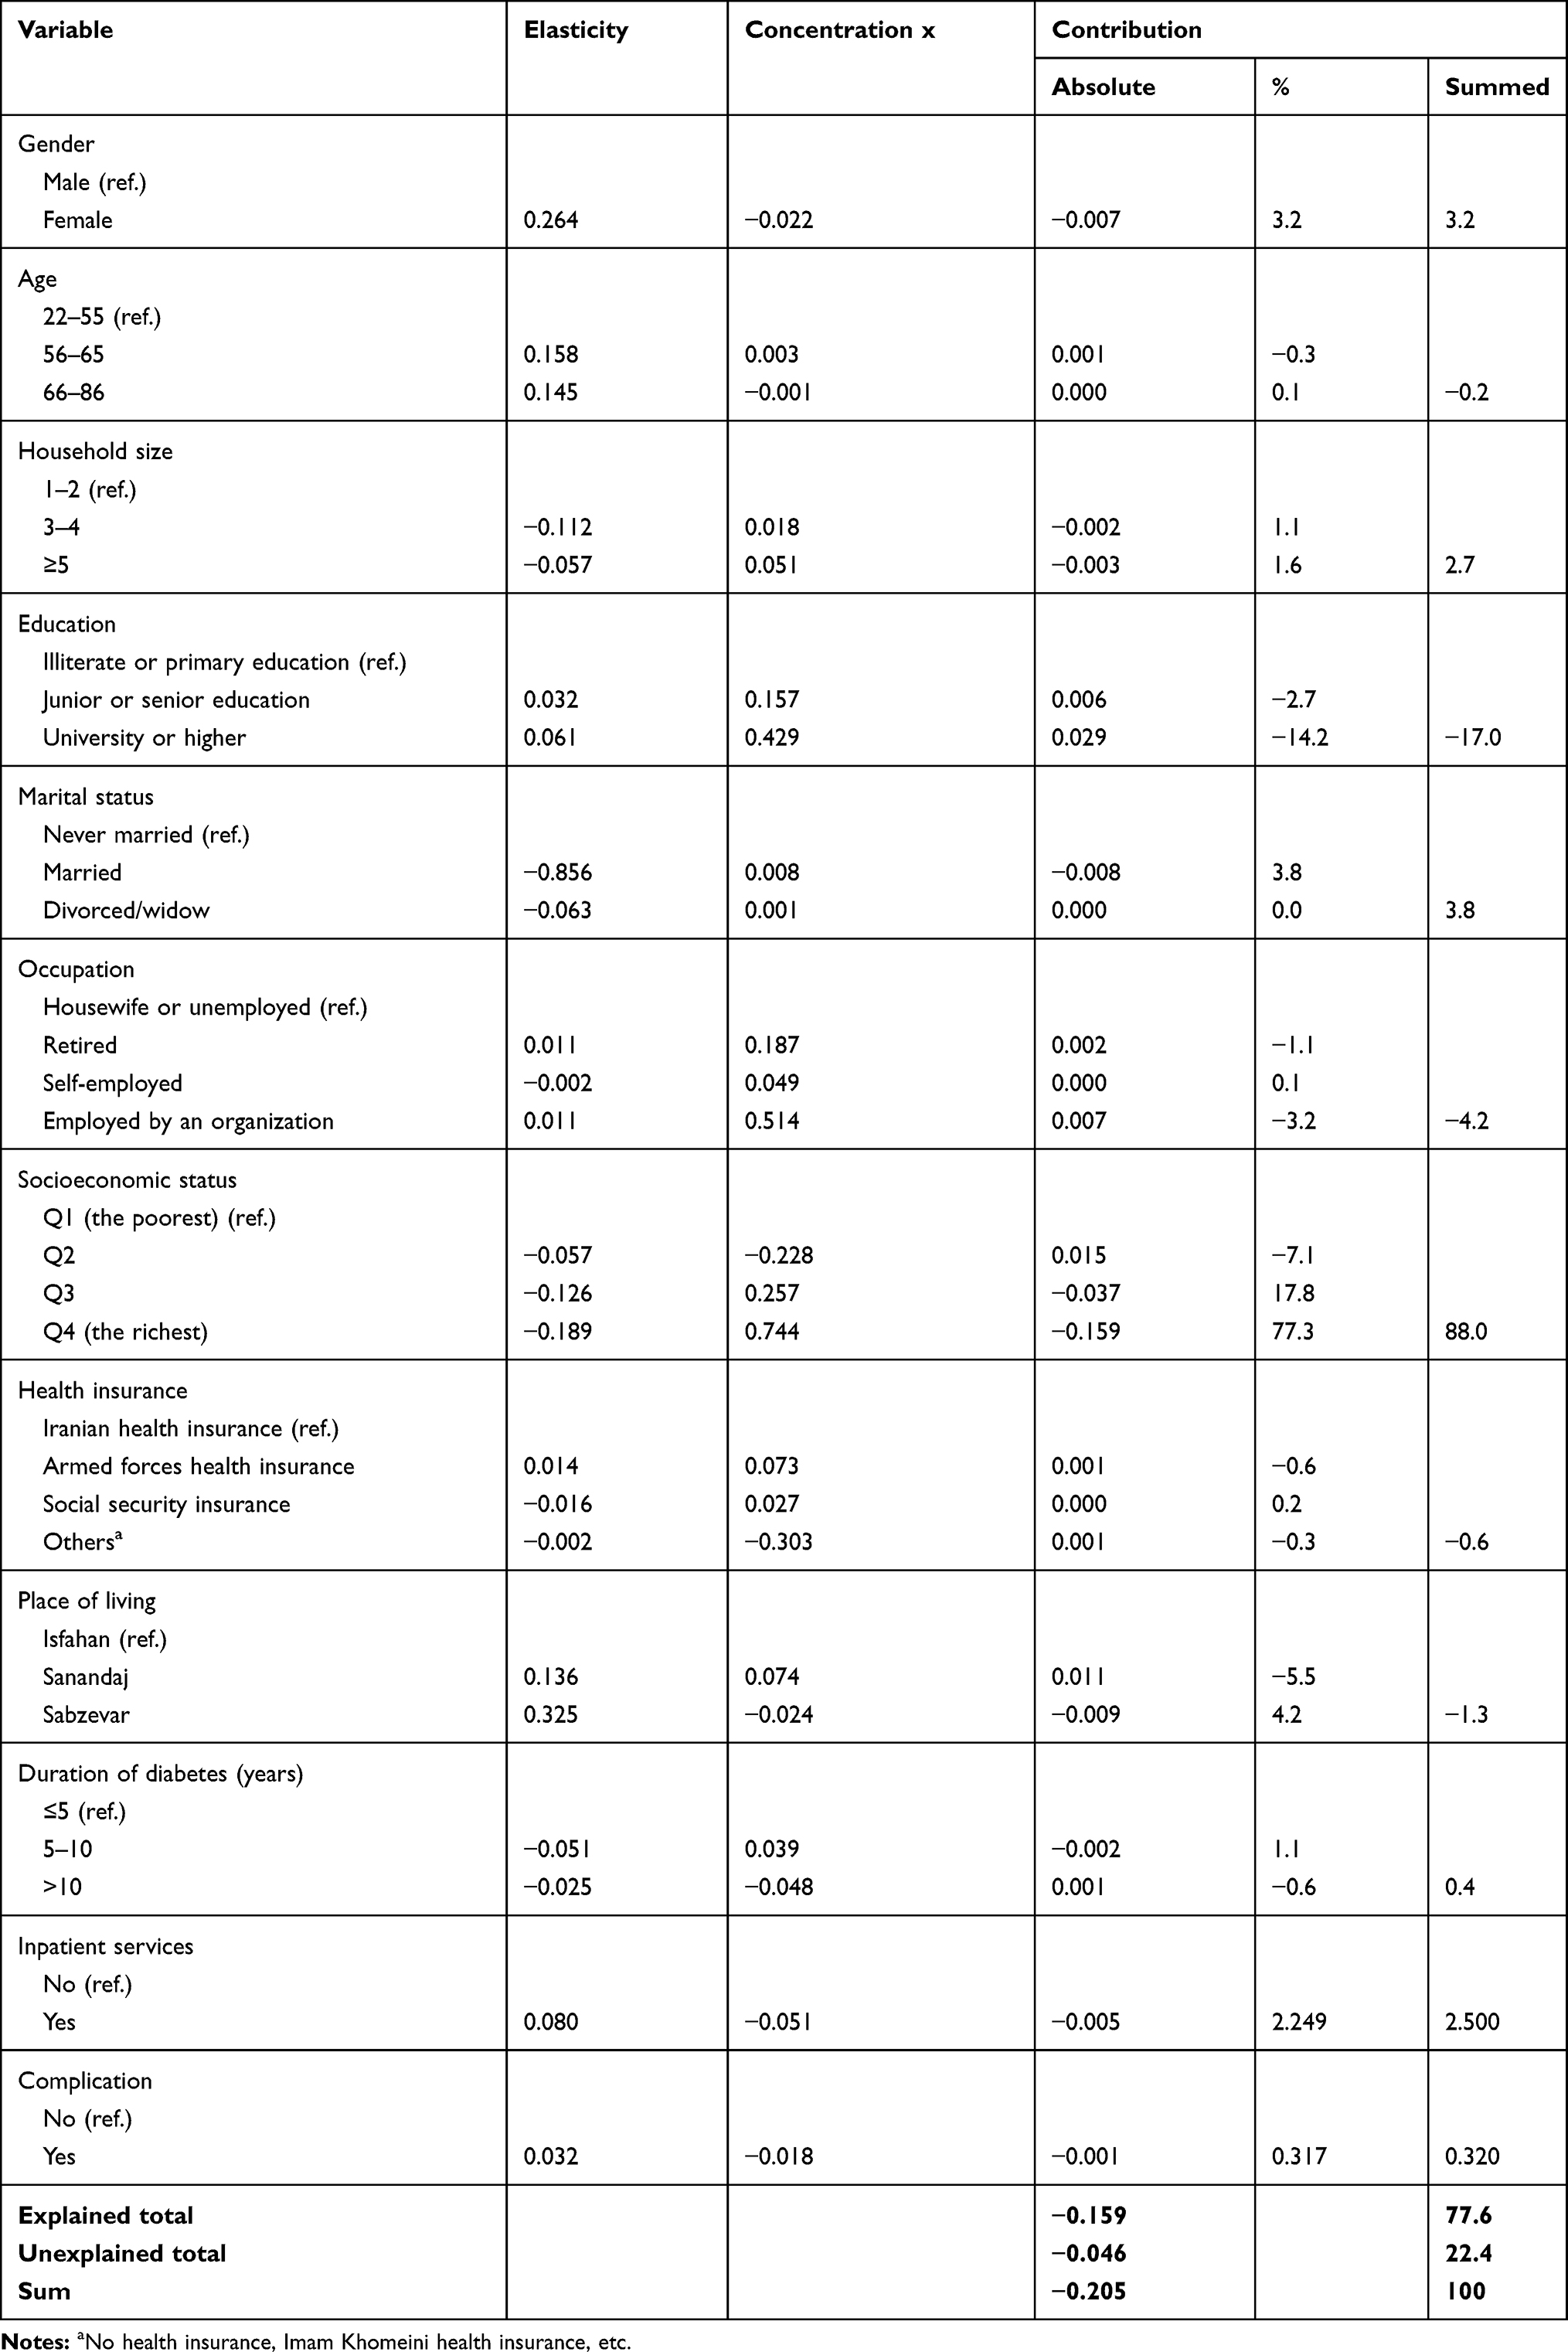 |
Table 6 Results of Decomposition Analysis of CHE Among Type 2 Diabetes Mellitus Patients |
Discussion
This study aimed to measure the incidence and intensity of CHE for type 2 diabetes mellitus care in Iran in 2019. We also explored the socioeconomic-related inequalities in CHE for type 2 diabetes mellitus care and related factors affecting it using decomposition method. To the best of our understanding, it is the first attempt to examine incidence and intensity of CHE among households and measure socioeconomic-related inequality of CHE and its related factors due to type 2 diabetes mellitus care in Iran. This study demonstrated that the incidence of CHE of household for type 2 diabetes mellitus care at the 40% of CTP threshold was 11.4%; indicating that 11.4% of households spent 40% and above of their CTP (nonfood expenditure) on diabetic care. A study by Jing et al11 in China found that the incidence of CHE among patients with type 2 diabetes mellitus at the 40% of nonfood expenditure threshold of household is about 14%. Singh et al38 investigated the economic impact of diabetes in South Asia and indicated that total costs for diabetic care in South Asia vary from $483 to $2637 per patient, and on average, 5.8% of patients with diabetes suffer from catastrophic spending at the 40% of CTP household. They also demonstrated that the mean direct costs per patient are positively associated with a country’s gross domestic product per capita. In another study, the incidence of CHE and impoverishment due to diabetic care in rural areas of China was reported 24.0% and 17.9% in 2009 and 23.6% and 17.6% in 2016, respectively.16 A study by Rezaei and Hajizadeh25 showed that 5.26% of Iranian households faced CHE in 2017. In another study in Iran,26 the results showed that incidence of CHE among general population was 2.57% in 2008 and 3.25% in 2015. A study conducted in the western part of Iran, Kermanshah province, found that incidence of CHE among households was 4.12% in 2017.17 The incidence of CHE among general population was 4.8% in one of the provinces included in this study.39 Similar to previous studies,11,26 we used the MPO and overshoot to measure the intensity of CHE for type 2 diabetes mellitus care. We found that the MPO and overshoot of the type 2 diabetes mellitus care were equal to 27.4% and 3.1%, respectively. Using the same threshold as in our study, the MPO in a study in Iran was 13.5% and 12.88% in 2014 and 2015, respectively.26 Based on the results of present study and those aforementioned studies, the incidence and intensity of CHE of household for type 2 diabetes mellitus were much greater; suggesting that type 2 diabetes mellitus had a significant financial burden on household budget in Iran.
The current study indicated that there is a statistically positive direction between socioeconomic status of household and facing CHE for type 2 diabetes mellitus care. This finding is in line with findings reported in Iran and other countries.11,17,25,39–42 The incidence of CHE for type 2 diabetes mellitus care at the 40% of CTP household was 16.7% and 7.3% among the poorest and richest households, respectively. Our logistic analysis indicated that the probability of facing CHE among households within first quartile of socioeconomic status was 3.3 times higher than those in fourth quartile. In a study conducted in China,11 the incidence of CHE for type 2 diabetes mellitus care among the poorest and richest households was 13.8% and 17.1%, respectively. However, the proportion of households facing CHE due to diabetic care was higher in lower economic status groups at all threshold levels used in this study (10%, 20%, 30% and 40% of household CTP). In addition to socioeconomic status, being female, older age, being married, use of inpatient services, and living place were identified as main factors affecting experience of CHE for type 2 diabetes mellitus care. These results are similar to the results of studies conducted in Bangladesh,43 Colombia,44 and Iran.25 Similar to the results of our study, a positive association was reported between being female and increased odds of CHE in a study conducted in South Africa.45 We did not find any statistically significant association between health insurance, education level, occupation status, duration of diabetes and diabetic-related complications with risk of CHE for type 2 diabetes mellitus. Smith-Spangler et al,46 in a study conducted on 35 developing countries, found that health insurance coverage does not have a statistically significant impact on reducing the incidence of CHE for type 2 diabetes mellitus. Sun et al8 showed that there is no statistical association between incidence of CHE for type 2 diabetic care and diabetic-related complications.
The present study also showed that a pro-poor distribution system existed in incidence of CHE for type 2 diabetes mellitus care (negative concentration index and the SII less than one); meaning that the CHE is more prevalent among type 2 diabetes mellitus patients with lower socioeconomic status. In a study conducted in Iran,24 the overall concentration index for CHE among households that utilized inpatient services in hospitals of Hamadan was −0.163; indicating that the CHE is more prevalent among the poor. Similar to our finding on distribution of CHE, a pro-poor distribution of CHE was found in previous studies conducted in Iran.17,25 Our decomposition analysis demonstrated that the main factors contributing to socioeconomic inequality in incidence of CHE due to diabetic care among the poor were the socioeconomic status, marital status and gender of patients. Mutyambizi et al45 found that at different thresholds, the value of concentration index for CHE due to diabetic care varied from −0.2299 to −0.1026. They concluded that catastrophic expenditure due to diabetic care is concentrated among the poor. Using the Blinder–Oaxaca method, a study in china indicated that the household income, occupation status, and living place were the main determinants of differences in CHE for type 2 diabetes mellitus patients.8
This study had some limitations; thus, our study’s results should be interpreted with caution. First of all, data collected in this study on costs of diabetic care was based on self-reported data with one-month recall; therefore, the over- and underestimation may have occurred. Second, the samples included in this study were chosen from three provinces; hence, our study’s findings have a poor generalizability. And third, the study design is cross-sectional, thus we are not able to establish any causal link between incidence of CHE due to diabetic care and explanatory variables included in the analysis.
Conclusion
The present study revealed that the financial burden of type 2 diabetes mellitus care on household’s budget is substantial, especially among the socioeconomically disadvantaged households. We also found that health insurance coverage does not properly protect the patients against catastrophic costs in Iran; thus, the re-visitation of the present health care financing strategies in order to protect lower socioeconomic groups is necessary.
Consent for Publication
All authors expressed consent for publication.
Data Sharing Statement
The datasets used and/or analyzed during the current study are available from the corresponding author on reasonable request.
Ethical Considerations
Participation in this study was voluntary and participants were aware of the study purposes. Before completing the questionnaire, oral and written consent was obtained from all participants and the questionnaire was collected anonymously. The proposal of this article was reviewed by the ethics committee of Kurdistan University of Medical Sciences and was approved with the ethics code IR.MUK.REC.1397.135. This study was conducted in accordance with the Declaration of Helsinki.
Funding
The present study was funded and supported by the Kurdistan University of Medical Sciences (code number: 510 1397.135). The funder had no role in study design, data collection, and data analysis and so on.
Disclosure
The authors report no conflicts of interest in this work.
References
1. Guariguata L, Whiting DR, Hambleton I, Beagley J, Linnenkamp U, Shaw JE. Global estimates of diabetes prevalence for 2013 and projections for 2035. Diabetes Res Clin Pract. 2014;103(2):137–149. doi:10.1016/j.diabres.2013.11.002
2. Zhou B, Lu Y, Hajifathalian K, et al. Worldwide trends in diabetes since 1980: a pooled analysis of 751 population-based studies with 4· 4 million participants. Lancet. 2016;387(10027):1513–1530. doi:10.1016/S0140-6736(16)00618-8
3. Haghdoost A, Rezazadeh Kermani M, Sadghirad B, Baradaran H. Prevalence of type 2 diabetes in the Islamic Republic of Iran: systematic review and meta-analysis. EMHJ. 2009;15(3):591–599. doi:10.26719/2009.15.3.591
4. Whiting DR, Guariguata L, Weil C, Shaw J. IDF diabetes atlas: global estimates of the prevalence of diabetes for 2011 and 2030. Diabetes Res Clin Pract. 2011;94(3):311–321. doi:10.1016/j.diabres.2011.10.029
5. Roglic G. WHO global report on diabetes: a summary. Int J Noncommun Dis. 2016;1(1):3. doi:10.4103/2468-8827.184853
6. WHO. Diabetes. World Health Organization; 2018. Available from: https://www.who.int/news-room/fact-sheets/detail/diabetes.
7. IRNA. The annual cost of diabetes in Iran is about $ 4 billion. The Islamic Republic news agency; 2018. Available from: www.irna.ir/news/83093821/.
8. Sun X, Liabsuetrakul T, Xie X, Liu P. Catastrophic health expenditure and impoverishment for type 2 diabetes mellitus patients in a multiethnic province in China using a Blinder–Oaxaca decomposition: a cross-sectional study. Medicine. 2019;98(39):e17376. doi:10.1097/MD.0000000000017376
9. Wu Y, Ding Y, Tanaka Y, Zhang W. Risk factors contributing to type 2 diabetes and recent advances in the treatment and prevention. Int J Med Sci. 2014;11(11):1185. doi:10.7150/ijms.10001
10. Lewis MT, Lujan HL, Tonson A, Wiseman RW, DiCarlo SE. Obesity and inactivity, not hyperglycemia, cause exercise intolerance in individuals with type 2 diabetes: solving the obesity and inactivity versus hyperglycemia causality dilemma. Med Hypotheses. 2019;123:110–114. doi:10.1016/j.mehy.2019.01.013
11. Jing Z, Chu J, Imam Syeda Z, et al. Catastrophic health expenditure among type 2 diabetes mellitus patients: a province‐wide study in Shandong, China. J Diabetes Investig. 2019;10(2):283–289. doi:10.1111/jdi.12901
12. Baudot F-O, Aguade A-S, Barnay T, Gastaldi-Menager C, Fagot-Campagna A. Impact of type 2 diabetes on health expenditure: estimation based on individual administrative data. Eur J Health Econ. 2019;20(5):657–668. doi:10.1007/s10198-018-1024-9
13. Mapa-Tassou C, Katte J-C, Maadjhou CM, Mbanya JC. Economic impact of diabetes in Africa. Curr Diab Rep. 2019;19(2):5. doi:10.1007/s11892-019-1124-7
14. Williams R, Karuranga S, Malanda B, et al. Global and regional estimates and projections of diabetes-related health expenditure: results from the International Diabetes Federation Diabetes Atlas. Diabetes Res Clin Pract. 2020;162:108072. doi:10.1016/j.diabres.2020.108072
15. IDF. IDF Diabetes Atlas.
16. Li H-F, Cai L, Golden AR. Short-term trends in economic burden and catastrophic costs of type 2 diabetes mellitus in rural Southwest China. J Diabetes Res. 2019;2019:1–6. doi:10.1155/2019/9626413
17. Rezaei S, Hajizadeh M, Ahmadi S, et al. Socioeconomic inequality in catastrophic healthcare expenditures in Western Iran. Int J Soc Econ. 2019;46(9):1049–1060. doi:10.1108/IJSE-01-2019-0034
18. Ahmadnezhad E, Murphy A, Alvandi R, Abdi Z. The impact of health reform in Iran on catastrophic health expenditures: equity and policy implications. Int J Health Plann Manage. 2019;34(4):e1833–e45. doi:10.1002/hpm.2900
19. Kavosi Z, Rashidian A, Pourreza A, et al. Inequality in household catastrophic health care expenditure in a low-income society of Iran. Health Policy Plan. 2012;27(7):613–623. doi:10.1093/heapol/czs001
20. Seuring T, Archangelidi O, Suhrcke M. The economic costs of type 2 diabetes: a global systematic review. Pharmacoeconomics. 2015;33(8):811–831. doi:10.1007/s40273-015-0268-9
21. Okoronkwo IL, Ekpemiro JN, Okwor EU, Okpala PU, Adeyemo FO. Economic burden and catastrophic cost among people living with type2 diabetes mellitus attending a tertiary health institution in south-east zone, Nigeria. BMC Res Notes. 2015;8(1):527. doi:10.1186/s13104-015-1489-x
22. Ghorbanian A, Rashidian A, Lankarani KB, Kavosi Z. The prevalence and determinants of catastrophic health expenditures in Iran: a systematic review and meta-analysis. Health Scope. 2019;8(1).
23. Esteghamati A, Etemad K, Koohpayehzadeh J, et al. Trends in the prevalence of diabetes and impaired fasting glucose in association with obesity in Iran: 2005–2011. Diabetes Res Clin Pract. 2014;103(2):319–327. doi:10.1016/j.diabres.2013.12.034
24. Vahedi S, Rezapour A, Khiavi FF, et al. Decomposition of socioeconomic inequality in catastrophic health expenditure: an evidence from Iran. Clin Epidemiol Glob Health. 2019;8(2):437–441.
25. Rezaei S, Hajizadeh M. Measuring and decomposing socioeconomic inequality in catastrophic healthcare expenditures in Iran. J Prev Med Public Health. 2019;52(4):214. doi:10.3961/jpmph.19.046
26. Yazdi-Feyzabadi V, Bahrampour M, Rashidian A, Haghdoost A-A, Javar MA, Mehrolhassani MH. Prevalence and intensity of catastrophic health care expenditures in Iran from 2008 to 2015: a study on Iranian household income and expenditure survey. Int J Equity Health. 2018;17(1):44. doi:10.1186/s12939-018-0743-y
27. International Diabetes Federation. IDF MENA Members. Available from: https://idf.org/our-network/regions-members/middle-east-and-north-africa/members/35-iran.html.
28. Akbarzadeh A, Salehi A, Vardanjani HM, et al. Epidemiology of adult diabetes mellitus and its correlates in pars cohort study in Southern Iran. Arch Iran Med. 2019;22(11):633–639.
29. Rashedi V, Asadi-Lari M, Delbari A, Fadayevatan R, Borhaninejad V, Foroughan M. Prevalence of diabetes type 2 in older adults: findings from a large population-based survey in Tehran, Iran (Urban HEART-2). Diabetes Metab Syndr. 2017;11:S347–S50. doi:10.1016/j.dsx.2017.03.014
30. O'Donnell O, van Doorslaer E, Wagstaff A, Lindelow M. Analyzing health equity using household survey data: a guide to techniques and their implementation. Bull World Health Organ. 2008;86(10):816.
31. Moradi G, Moinafshar A, Adabi H, Sharafi M, Mostafavi F, Bolbanabad AM. Socioeconomic inequalities in the oral health of people aged 15–40 years in Kurdistan, Iran in 2015: a cross-sectional study. J Prev Med Public Health. 2017;50(5):303. doi:10.3961/jpmph.17.035
32. Xu K Distribution of health payments and catastrophic expenditures methodology. Distribution of health payments and catastrophic expenditures Methodology. 2005.
33. Wagstaff A, Doorslaer E. Catastrophe and impoverishment in paying for health care: with applications to Vietnam 1993–1998. Health Econ. 2003;12(11):921–933. doi:10.1002/hec.776
34. Xu K, Evans DB, Kawabata K, Zeramdini R, Klavus J, Murray CJ. Household catastrophic health expenditure: a multicountry analysis. Lancet. 2003;362(9378):111–117. doi:10.1016/S0140-6736(03)13861-5
35. Gravelle H. Measuring income related inequality in health: standardisation and the partial concentration index. Health Econ. 2003;12(10):803–819. doi:10.1002/hec.813
36. Wagstaff A, Paci P, Van Doorslaer E. On the measurement of inequalities in health. Soc Sci Med. 1991;33(5):545–557. doi:10.1016/0277-9536(91)90212-U
37. Wagstaff A. The concentration index of a binary outcome revisited. Health Econ. 2011;20(10):1155–1160. doi:10.1002/hec.1752
38. Singh K, Narayan KMV, Eggleston K. Economic Impact of Diabetes in South Asia: the Magnitude of the Problem. Curr Diab Rep. 2019;19(6):34. doi:10.1007/s11892-019-1146-1
39. Piroozi B, Moradi G, Nouri B, Bolbanabad AM, Safari H. Catastrophic health expenditure after the implementation of health sector evolution plan: a case study in the west of Iran. Int J Health Policy Manage. 2016;5(7):417. doi:10.15171/ijhpm.2016.31
40. Adhikari SR, Maskay NM, Sharma BP. Paying for hospital-based care of Kala-azar in Nepal: assessing catastrophic, impoverishment and economic consequences. Health Policy Plan. 2009;24(2):129–139. doi:10.1093/heapol/czn052
41. Su TT, Kouyaté B, Flessa S. Catastrophic household expenditure for health care in a low-income society: a study from Nouna District, Burkina Faso. Bull World Health Organ. 2006;84:21–27. doi:10.2471/BLT.05.023739
42. Group AS. Catastrophic health expenditure and 12-month mortality associated with cancer in Southeast Asia: results from a longitudinal study in eight countries. BMC Med. 2015;13(1):190.
43. Khan JA, Ahmed S, Evans TG. Catastrophic healthcare expenditure and poverty related to out-of-pocket payments for healthcare in Bangladesh—an estimation of financial risk protection of universal health coverage. Health Policy Plan. 2017;32(8):1102–1110. doi:10.1093/heapol/czx048
44. Amaya-Lara JL. Catastrophic expenditure due to out-of-pocket health payments and its determinants in Colombian households. Int J Equity Health. 2016;15(1):182. doi:10.1186/s12939-016-0472-z
45. Mutyambizi C, Pavlova M, Hongoro C, Booysen F, Groot W. Incidence, socio-economic inequalities and determinants of catastrophic health expenditure and impoverishment for diabetes care in South Africa: a study at two public hospitals in Tshwane. Int J Equity Health. 2019;18(1):73. doi:10.1186/s12939-019-0977-3
46. Smith-Spangler CM, Bhattacharya J, Goldhaber-Fiebert JD. Diabetes, its treatment, and catastrophic medical spending in 35 developing countries. Diabetes Care. 2012;35(2):319–326. doi:10.2337/dc11-1770
 © 2020 The Author(s). This work is published and licensed by Dove Medical Press Limited. The full terms of this license are available at https://www.dovepress.com/terms.php and incorporate the Creative Commons Attribution - Non Commercial (unported, v3.0) License.
By accessing the work you hereby accept the Terms. Non-commercial uses of the work are permitted without any further permission from Dove Medical Press Limited, provided the work is properly attributed. For permission for commercial use of this work, please see paragraphs 4.2 and 5 of our Terms.
© 2020 The Author(s). This work is published and licensed by Dove Medical Press Limited. The full terms of this license are available at https://www.dovepress.com/terms.php and incorporate the Creative Commons Attribution - Non Commercial (unported, v3.0) License.
By accessing the work you hereby accept the Terms. Non-commercial uses of the work are permitted without any further permission from Dove Medical Press Limited, provided the work is properly attributed. For permission for commercial use of this work, please see paragraphs 4.2 and 5 of our Terms.