")
Back to Journals » International Journal of Nanomedicine » Volume 9 » Issue 1
In vivo tomographic imaging with fluorescence and MRI using tumor-targeted dual-labeled nanoparticles
Authors Zhang Y, Zhang B, Liu F, Luo J, Bai J
Received 4 August 2013
Accepted for publication 26 September 2013
Published 16 December 2013 Volume 2014:9(1) Pages 33—41
DOI https://doi.org/10.2147/IJN.S52492
Checked for plagiarism Yes
Review by Single anonymous peer review
Peer reviewer comments 5
Yue Zhang,1 Bin Zhang,1 Fei Liu,1,2 Jianwen Luo,1,3 Jing Bai1
1Department of Biomedical Engineering, School of Medicine, 2Tsinghua-Peking Center for Life Sciences, 3Center for Biomedical Imaging Research, Tsinghua University, Beijing, People's Republic of China
Abstract: Dual-modality imaging combines the complementary advantages of different modalities, and offers the prospect of improved preclinical research. The combination of fluorescence imaging and magnetic resonance imaging (MRI) provides cross-validated information and direct comparison between these modalities. Here, we report on the application of a novel tumor-targeted, dual-labeled nanoparticle (NP), utilizing iron oxide as the MRI contrast agent and near infrared (NIR) dye Cy5.5 as the fluorescent agent. Results of in vitro experiments verified the specificity of the NP to tumor cells. In vivo tumor targeting and uptake of the NPs in a mouse model were visualized by fluorescence and MR imaging collected at different time points. Quantitative analysis was carried out to evaluate the efficacy of MRI contrast enhancement. Furthermore, tomographic images were also acquired using both imaging modalities and cross-validated information of tumor location and size between these two modalities was revealed. The results demonstrate that the use of dual-labeled NPs can facilitate the dual-modal detection of tumors, information cross-validation, and direct comparison by combing fluorescence molecular tomography (FMT) and MRI.
Keywords: dual-modality, fluorescence molecular tomography (FMT), magnetic resonance imaging (MRI), nanoparticle
Introduction
Dual-modality imaging is a powerful method that combines the complementary advantages of different imaging modalities.1 The fusion of functional/molecular and anatomical modalities, including positron emission tomography/computed tomography (PET/CT), single-photon emission CT (SPECT)/CT, PET/magnetic resonance imaging (MRI), etc, has gained worldwide attention as providing more reliable and accurate disease detection.2 As a non-radiative functional imaging modality, fluorescence imaging is emerging as an important method and plays a significant role in tumor detection3 and drug development.4 Fluorescence imaging has several advantages over other modalities, such as high sensitivity and specificity, operational simplicity, safety and cost effectiveness.5 Lately, combined with the development of versatile fluorescent probes, especially the near-infrared fluorescent (NIRF) probes, fluorescence molecular tomography (FMT) is becoming a promising tool to noninvasively resolve three-dimensional (3D) spatial distribution of fluorescence probes associated with molecular and cellular functions.6 On the other hand, MRI provides high spatial resolution with outstanding contrast features in soft tissues,7 3D anatomic details throughout the body, and has been widely used in clinical oncology imaging.8 Novel contrast agents that modulate T1 and T2 relaxation have also rendered MRI a tool for visualizing cellular and subcellular events.9 In light of these recent advances, the combination of fluorescence imaging and MRI is particularly attractive, and has been utilized for tumor detection,8 imaging of myocardium,10 protein expression,11 etc.
Recently, nanoparticle (NP)-based imaging has attracted considerable attention. NPs have been widely used as the imaging contrast agent for their potential for earlier diagnosis,12 greater biocompatibility, and reduced toxicity.13 To achieve enhanced specificity and sensitivity, tumor-targeted NPs have been developed, and their feasibility in tumor-targeted imaging has been demonstrated in vivo.8,14 Using monoclonal antibodies targeted against the receptor, epidermal growth factor receptor (EGFR) is under intense investigation, both as a prognostic marker and for therapy by means of optical imaging15 and MRI.16 The EGFR signaling pathway plays an important role in the regulation of cell proliferation, etc.17 EGFR is overexpressed in many solid tumors, including cancers of breast, brain, colon, etc,18 and the different levels of expression between normal cells and tumor cells make EGFR a potential marker for in vivo receptor-targeted molecular imaging.15 Furthermore, dual-labeled NPs have made a significant contribution to promoting the development of dual-modality imaging. By integrating several imaging agents with different properties, dual-labeled NPs can be used to evaluate the same molecular target with multiple imaging modalities,19 quantitatively assess tumor-targeting efficacy,20 and detect tumors at early stages with high accuracy.21
In order to facilitate the cross-validation and direct comparison between the tomographic images acquired by FMT and MRI, an EGFR-targeted, dual-labeled magnetic-fluorescent NP was synthesized. Fluorescence imaging and MRI were used to observe the dual-labeled NP distribution in a mouse mammary tumor model in vivo. A series of fluorescence images and MRI images were collected at different time points to observe tumor targeting and uptake of the NPs, and quantitative analysis was carried out. Tomographic images acquired from fluorescence imaging and MRI were also shown. The results from both imaging modalities showed high correspondence with each other. Finally, histological analysis was conducted to further confirm the imaging results.
Materials and methods
Materials
Iron(III) acetylacetonate (Fe(acac)3), oleylamine, 1-ethyl- 3-(3-dimethylaminopropyl) carbodiimide (EDC), N-hydroxysulfosuccinimide sodium salt (sulfo-NHS), fetal bovine serum, Penicillin-Streptomycin were purchased from Sigma-Aldrich (St Louis, MO, USA). Diphenyl ether was purchased from Sinopharm Chemical Reagent Beijing, Co, Ltd (Beijing, People’s Republic of China). The anti-EGFR monoclonal antibody (mAb) was purchased from Boehringer Ingelheim Pharma GmbH and Co. KG. (Ingelheim, Gemany), and Cy5.5-NHS ester was purchased from GE Healthcare Life Science (Buckinghamshire, UK).
Preparation of tumor-targeted dual-labeled NP
To achieve optimal dual-modality imaging contrast, paramagnetic iron oxide (IO) NPs conjugated with NIRF dye-labeled mAbs were synthesized. IO NPs were prepared as previously described.22–24 Typically, 2.1 g of Fe(acac)3, 7.9 mL of oleylamine, and 24 g of HOOC-PEG-COOH (12 mmol, Mn =2,000) were dissolved in 100 mL of diphenyl ether solution. After being purged with nitrogen, the reaction mixture was quickly heated and kept refluxing for 0.5 hours. After the reaction mixture was cooled to room temperature, ether was used to precipitate the resultant Fe3O4 nanocrystals out of it. The precipitate was then re-dissolved in ethanol followed by addition of ether as precipitant. This purifying procedure was repeated for three cycles. The polyethylene glycol (PEG)-coated Fe3O4 nanocrystals finally obtained were dissolved in phosphate-buffered saline (PBS; Sigma, St Louis, MO, USA). Anti-EGFR mAbs were selected as the ligand for EGFR to achieve targeted delivery of the NP to the mammary tumor. The anti-EGFR mAb was dialyzed against 1 L of 0.15 M sodium chloride for 4 hours at room temperature, and was dialyzed again overnight using a fresh liter of 0.15 M sodium chloride at 4°C. A 10 mg/mL solution of Cy5.5-NHS ester in dimethyl sulfoxide (DMSO) was then added gradually to the antibody solution while stirring in the dark. To separate the free dye, the mixture was dialyzed against 1 L of 0.15 M sodium chloride for 4 hours at room temperature. This dialysis was repeated using a fresh liter of 0.15 M sodium chloride overnight at 4°C. Finally, the labeled antibody solution was filtered through a 0.22 μm syringe filter. Cy5.5 dye-labeled anti-EGFR mAbs were conjugated to the surface of IO NPs via the classical EDC/sulfo-NHS method.23,24 Typically, EDC (2.50 μmol) and sulfo-NHS (6.25 μmol) were dissolved in 950 μL of a 0.01 M PBS solution containing 2.0 mg of Fe3O4 nanocrystals. After approximately 15 minutes, 50 μL of a 0.01 M PBS solution containing 1 mg of Cy5.5 labeled anti-EGFR antibody was introduced. The reaction was run overnight at 4°C. The resultant conjugates were collected at 13,000 rpm to remove the impurities and unreacted Cy5.5 labeled anti-EGFR antibody molecules and then re-dissolved in PBS (1 mL) and kept at 4°C.
Transmission electron microscopy (TEM) of IO-anti-EGFR-Cy5.5 was used to estimate the diameter of the particle. In order to determine the concentration of iron in the probe, O-phenanthroline spectrophotometry was carried out. Firstly, the standard solution of iron was prepared and then diluted to different known concentrations. Then a 0.10% solution of O-phenanthroline and a 10% solution of hydroxylamine hydrochloride were added to the standard solutions of serial concentration. The standard curve was created by measuring the percent transmittance of the mixed solutions by using the spectrophotometer (Cary 50 UV−vis, Angilent Technologies, CA, USA). Third, the probe solution was processed as above, and the percent transmittance was also measured. Thus, the concentration of the probe could be determined according to the standard curve. The optical properties of anti-EGFR-Cy5.5 and IO-anti-EGFR-Cy5.5 were also investigated.
Cell lines
Human breast adenocarcinoma cell lines MDA-MB-231 (EGFR-positive) and MDA-MB-453 (EGFR-negative) were purchased from National Platform of Experimental Cell Resources for Sci-Tech (Beijing, People’s Republic of China), and were maintained at 37°C in a humidified atmosphere containing 5% CO2 in RPMI 1640, supplemented with 10% fetal bovine serum and 1% Penicillin- Streptomycin.
In vitro binding studies
Both cell lines cultured in a 35 mm confocal dish (Corning, New York City, NY, USA) were incubated with IO-anti-EGFR-Cy5.5 of the same concentration (containing 135 mg Fe) at 37°C for 1 hour. After washing with PBS three times, cells were fixed with 4% paraformaldehyde (Beijing Chemical Works, Beijing, People’s Republic of China) and cell nuclei were then stained with Hoechst 33342 (Sigma-Aldrich, St Louis, MO, USA) by incubating the cells with 10 mg/mL Hoechst 33342 solution for 15 minutes at 37°C. Cells were then washed again three times, and the dishes were mounted for microscopic examination using a confocal microscope (A1R MP, Nikon, Tokyo, Japan).
Mouse mammary tumor model
Animal experiments were approved by the Institutional Animal Care and Use Committee of Tsinghua University, Beijing. 5 × 10⁶ MDA-MB-231 cells in 0.15 mL PBS were injected subcutaneously into the upper right mammary fat pad of five 5-week-old female BALB/c-nude mice. When the average diameter of tumors reached ~6 mm, the mice were imaged.
In vivo fluorescent imaging
All fluorescence imaging experiments were performed on a home-made fluorescence imaging system. A 300 W Xenon lamp (Asahi Spectra, Torrance, CA, USA) was employed as the excitation source. Both reflectance imaging and tomographic imaging were carried out in the experiments. A collimation lens was used in reflectance imaging to generate approximately uniform epi-illumination; in the tomographic imaging, a fiber was attached to the lamp to generate a light spot focused onto the surface of the mouse. A 512 × 512 pixel, electron-multiplying CCD (EMCCD) camera (iXon DU-897, Andor, Belfast, Northern Ireland, UK) was cooled to −70°C and used to detect the fluorescence signals. A 35 mm f/1.6 lens (C3514-M, Pentax, Tokyo, Japan) was coupled to the EMCCD camera. The EMCCD camera and the excitation light source were vertically rotated, while the mouse was horizontally fixed on an animal holder (Figure 1A and B). The same mouse positions were carefully maintained, and identical imaging parameters were used, throughout the experiments. Fluorescent images were acquired with a 670±5 excitation filter and a Cy5.5 emission filter (695–770 nm, Caliper Life Sciences, Hopkinton, MA, USA). The mice were anesthetized with an isoflurane-oxygen gas mixture during the imaging process.
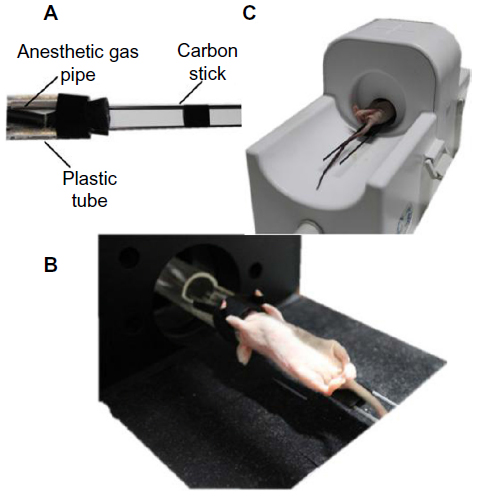 | Figure 1 The animal holder. |
A total of 75 μL of IO-anti-EGFR-Cy5.5 NPs (1.14 nM Fe per kg of mouse body weight) was administered via the tail vein before imaging. Fluorescent reflectance images were collected for each mouse (n=5) at four different time points to monitor the changes in fluorescence intensity in the tumor over time; the exposure time of CCD was 4 seconds. Fluorescent images for FMT were collected 12 hours postinjection, utilizing 36 projections with an angular increment of 10°. The total scan time for FMT was about 10 minutes. In fluorescence reconstruction, only the tumor region was reconstructed; the resulting reconstruction had the dimensions 31 × 31 × 18 with a pixel size of 1 × 1 × 1 mm3. The surface of the mouse was first extracted from the white light images by an optimal radon transform.25 A 3D solid model was constructed using this information, and then discretized into finite elements in order to calculate the light transportation using the finite elements method (FEM).26,27 The weight matrix was subsequently established by mapping the excitation light and the fluorescent images of each angle into the corresponding position of the finite element meshes. Finally, the algebraic reconstruction technique (ART) method was adopted to reconstruct the 3D dual-labeled NP distribution.
In vivo MRI
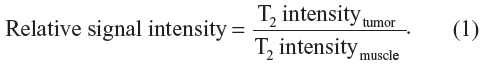
MRI experiments were performed on a 3T MRI scanner (Achieva 3.0T TX; Philips Healthcare, Best, The Netherlands) using a customized rodent coil (Figure 1C). During the experiments, mice were fixed on the same holder as in the fluorescent imaging process, and were anesthetized with intraperitoneal injection of avertin (350 mg/kg). MR images of each mouse (n=5) were collected before and 12 hours after the NP injection. The imaging sequences included T1-weighted turbo field echo method with a repetition time (TR) of 7.8 ms, an echo time (TE) of 3.3 ms, T2-weighted turbo spin echo method with a TR of 2,900 ms, and a TE of 214.1 ms. Multi-echo spin echo with six different TE values ranging from 15 ms to 90 ms were also used to obtain T2 maps of the whole mouse. Multi-echo T2 images of slices were used for calculating T2 maps using a commercial software (Volume View, Philips Healthcare, Best, The Netherlands). To estimate the contrast enhancement of NPs in the tumor at different time points, MRI signal changes were measured before and 12 hours after the injection. Using the MRI signal level of muscle tissue as a baseline, relative signal intensity was determined as follows:
Statistical analysis
Quantitative data were expressed as mean ± standard deviation (SD). The paired Student’s t-test was used to compare data in the regions of interest (ROIs) drawn around the tumor on the T2-weighted images and T2 maps from the same animal before and after injection to evaluate the efficacy of contrast enhancement. P<0.05 was considered statistically significant.
Histological analysis
After the mice were sacrificed, tumor tissues were collected and embedded optimal cutting temperature compound (OCT) (Sakura Fine-tek, Torrance, CA, USA), and 10 μm-thick sections were cut. Frozen tissue sections were incubated with Prussian blue staining solution to confirm the presence of IO NPs in the tissue sections. The slides were examined under bright field microscopy (Eclipse 90i, Nikon, Tokyo, Japan) after counterstaining with eosin (Leagene Biotech, Beijing, People’s Republic of China).
Results
Characterization of IO-anti-EGFR-Cy5.5
The components of IO-anti-EGFR-Cy5.5 are schematically depicted in Figure 2A. The NP consists of an IO core coated with PEG and Cy5.5-labeled mAbs (Figure 2A). According to the TEM images of the NPs (Figure 2A), Fe3O4 magnetic NPs were approximately spherical, and the mean size was approximately 14 nm. The concentration of Fe in the probe was 1.7 mg/mL, determined by O-phenanthroline spectrophotometry.
The fluorescence emission spectrum of IO-anti-EGFR-Cy5.5 is shown in Figure 2B, while the fluorescence absorbance spectrum and emission spectrum of anti-EGFR-Cy5.5 are shown in Figure 2C and D, respectively. As shown in fluorescence spectra of anti-EGFR-Cy5.5, its absorbance peak is 670 nm, and its emission peak is ~700 nm; filters of the corresponding wavelength are used in the following in vivo fluorescence imaging.
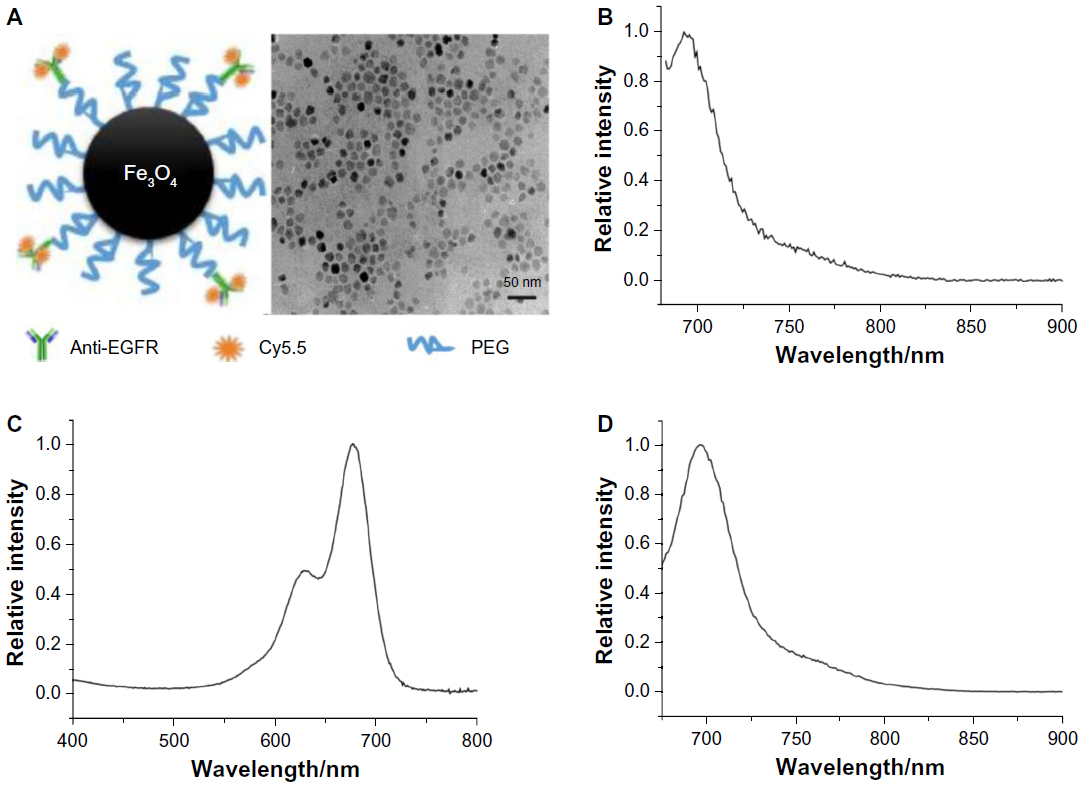 | Figure 2 Characteristics of the IO-anti-EGFR-Cy5.5 nanoparticle. |
Furthermore, according to the product protocol of Cy5.5-NHS, the ratio of antibody to Cy5.5 is 1:2, calculated as follows:
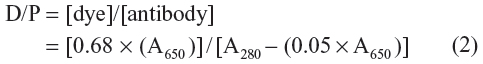
where A650 and A280 represent the absorbance of the Cy5.5-labeled anti-EGFR at the corresponding wavelengths (ie, 650 nm and 280 nm). The ratio of antibody to IO particle is 4:1. Thus, eight Cy5.5 molecules are labeled to each IO NP.
Specificity of IO-anti-EGFR-Cy5.5 to cancer cells
In vitro binding studies were carried out to evaluate the specificity of the dual-labeled NP to EGFR-expressing tumor cells. MDA-MB-231 and MDA-MB-453 cells were incubated with IO-anti-EGFR-Cy5.5 under identical circumstances. Fluorescence images of MDA-MB-231 cells (Figure 3A) indicated that a strong fluorescence signal (red) was detected in the cells. In contrast, a negligible signal was detected in MDA-MB-453 cells (Figure 3B). The cell nuclei were counterstained with Hoechst 33342 (blue).
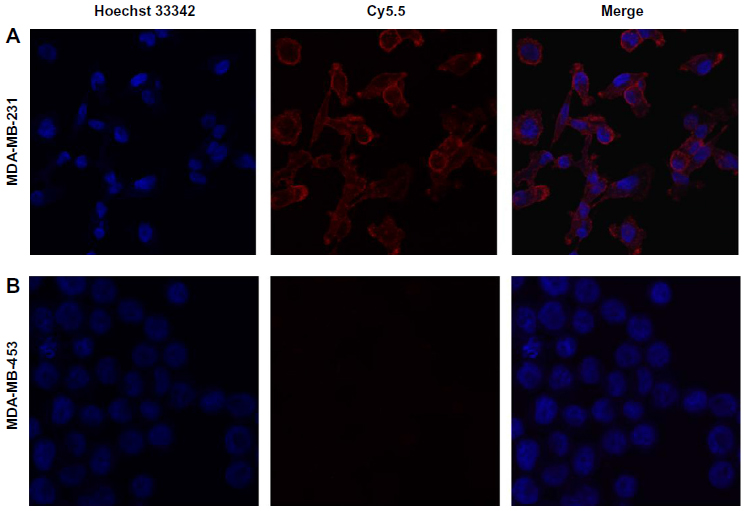 | Figure 3 Specific binding of IO-anti-EGFR-Cy5.5 to targeted tumor cells line. |
In vivo fluorescence reflectance imaging
Representative fluorescence reflectance imaging results from one mouse are shown in Figure 4; the accumulation of the NPs in the tumor area is detected, as evidenced by the changes in the fluorescent signals in serial NIR fluorescence images at four different time points. Meanwhile, strong fluorescent signals were also detected in the abdominal cavity, which was caused by the uptake of the NP by the liver and spleen.15
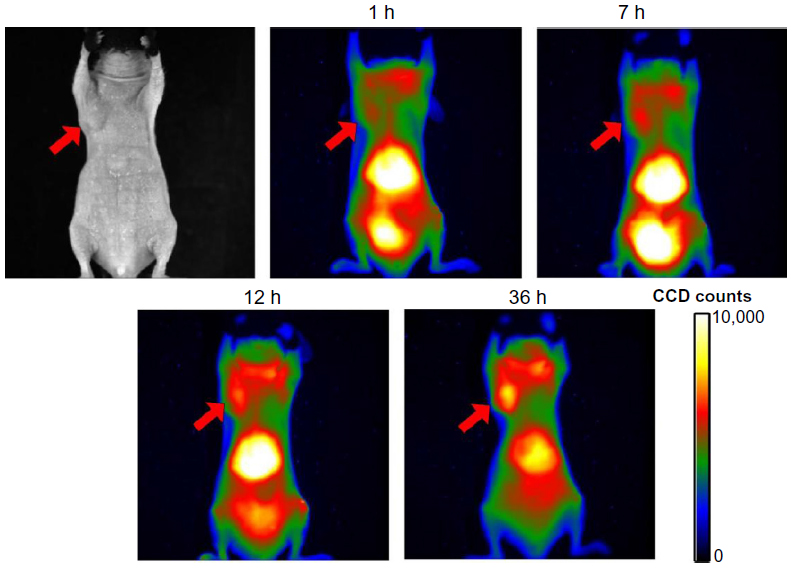 | Figure 4 Reflectance fluorescence images at four time points after the nanoparticle injection. Pixel values are reported as CCD counts, which is in proportion to fluorescence intensity. |
In vivo FMT and MRI
To achieve the 3D distribution of the dual-labeled NP, in vivo tomographic imaging of the mammary xenograft mouse model was performed using both FMT and MRI.
As shown in Figure 5A and B, the tumor can be visualized with high contrast in both axial and coronal slices. Meanwhile, reductions of T2 signal and values in T2-weighted images were observed in the area of the tumor 12 hours after the NP injection (Figure 5E–G), which suggests NP accumulation in tumors. Furthermore, signal changes in the tumor region are non-uniform, indicating the heterogeneous intratumoral distribution of the NPs. Using the MRI signal level of muscle tissue as a baseline, paired t-tests demonstrated that there was a significant change in relative magnetic signal intensity (P<0.05) 12 hours after the NP injection (Figure 6A). Similar results were obtained in the paired t-test for T2 values (Figure 6B), which further demonstrated the accumulation of the NP in the tumor. Tumor uptake of IO-anti-EGFR-Cy5.5 was confirmed by histology using Prussian blue staining. Cells with blue staining were found in tumor tissue sections (Figure 6C). At the same time, uptake of the NP in the liver was also significant, as evidenced by a conspicuous signal decrease detected in the liver (Figure 5D and H) and in liver tissue slices (Figure 6D).
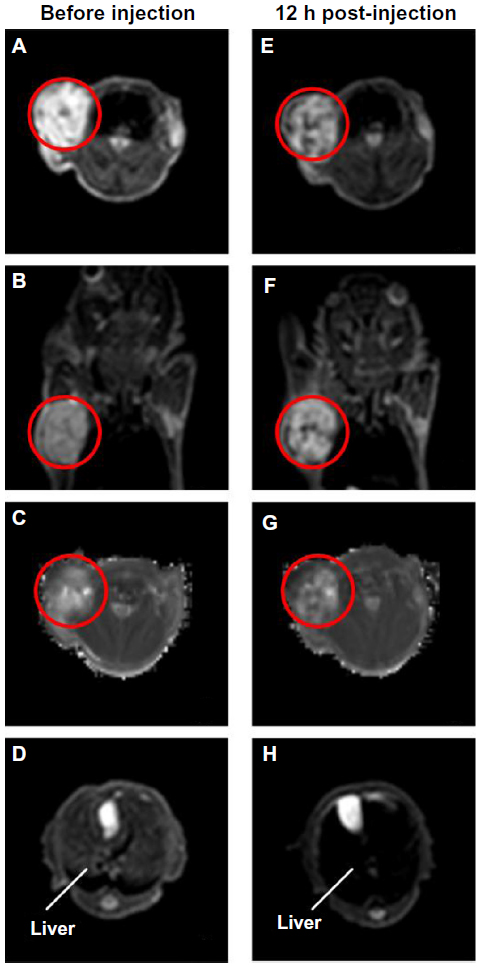 | Figure 5 In vivo MRI of MDA-MB-231 mammary tumor using IO-anti-EGFR-Cy5.5. |
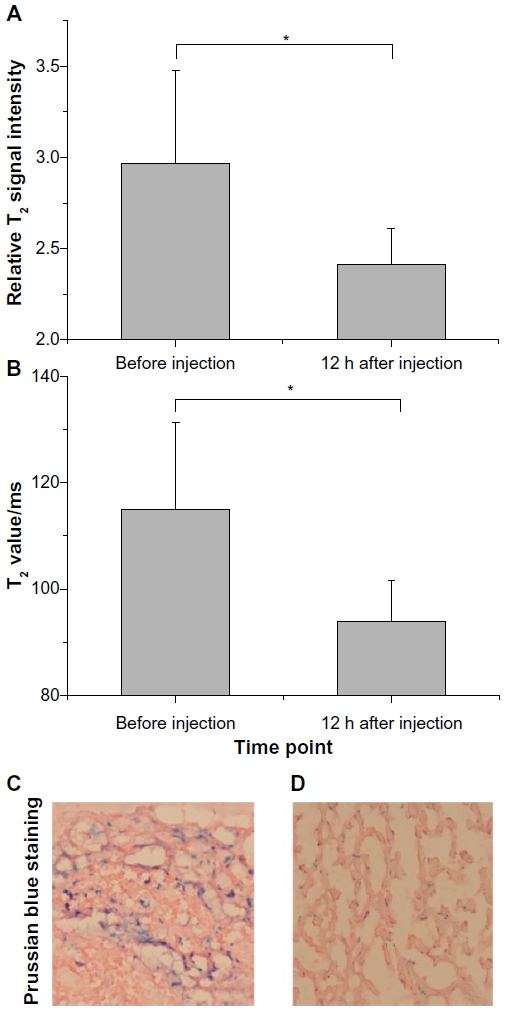 | Figure 6 Tracking changes of T2 intensity and T2 values before and after the nanoparticle injection. |
Furthermore, 3D FMT reconstruction reveals the distribution of the NPs in the tumor region 12 hours after the injection. Figure 7 shows the axial MR images and the corresponding FMT images of the same mouse. As shown, NP distribution revealed in the fluorescence tomographic images corresponds well with that revealed in the MR images.
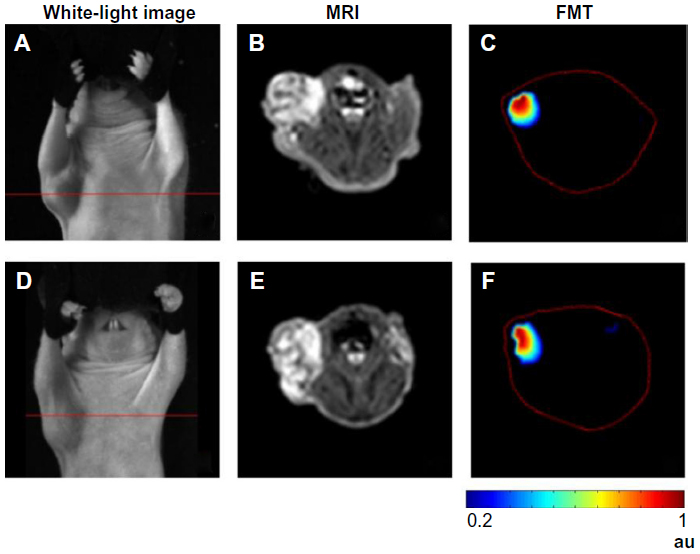 | Figure 7 Tomographic images by FMT and MRI. |
Discussion
Fluorescence imaging, especially FMT, enables noninvasive detection and 3D reconstruction of specific molecular events, while MRI allows for imaging with high spatial resolution (0.5 mm herein) anatomic information. In this work, we acquired tomographic images of MRI and fluorescence imaging, which visualized the distribution of NIR dye-labeled, tumor-targeted NPs in vivo, and signal contrasts were detected and analyzed. As shown in the results, the new application, combining our homemade FMT system and the well-established MRI system, can provide cross-validated information and direct comparison between both modalities. The comparison and cross-validation may be further used for probe design28 and quantification.29
However, fluorescence and MR images were collected sequentially and separately. Accurate fusion of the images from different imaging modalities will need non-frigid registration, which is intrinsically difficult. In contrast, simultaneous image scanning by both modalities will benefit from the inherent registration due to fixed instrument geometry.30 According to our previous investigation,31 the spatial resolution achieved by hybrid FMT-CT was at least 1.2 mm. In our future work, we are planning to simultaneously implement FMT and MR imaging on a hybrid FMT-MRI system, which enables high accuracy FMT reconstruction21 and offers high soft-tissue contrast, high resolution, and high sensitivity.30
In comparison with other dual-labeled NPs, IO-anti-EGFR-Cy5.5 NPs show excellent biocompatibility, satisfying colloidal stability, and enhanced MR contrast.24 Furthermore, Cy5.5, as one representative NIRF dye, possesses the minimum absorbance spectra in the NIR region,32 and enables characterization of deep diseased tissues.18 Dual-modality magnetic-fluorescent NP, which imparts contrast in both imaging modalities, such as the one described herein, can extend the prospects of MRI-fluorescence imaging, and facilitate information cross-validation and direct comparison between different modalities.
In addition, the toxicity of magnetic NPs is under intense investigation.33 According to our short-term (4.5 day) observation during the experiment, no side effects were observed on the mice after the probe injection. We will work on toxicity testing of the IO-anti-EGFR-Cy5.5 NP in the near future.
Conclusion
We synthesized a dual-labeled NP (IO-anti-EGFR-Cy5.5), which facilitates the tomographic visualization of tumor targeting on the macroscopic level with MRI and FMT. Information cross-validation and direct comparison between different modalities were achieved. Dual-modality imaging, combining fluorescence imaging and MRI, may have great potential in accurate 3D visualization of tumor targeting and other molecular processes in vivo.
Acknowledgments
The authors thank Le He and Yandong Zhu from the Center for Biomedical Imaging Research, Tsinghua University, for their assistance in MRI data collection. We would also like to thank Beijing Oneder-hightech Ltd for their technical support in the construction of the IO-anti-EGFR-Cy5.5 probe. This work is supported by the National Basic Research Program of China (973) under Grant No 2011CB707701; the National Natural Science Foundation of China under Grant No 81227901, 81071191, 81271617; the National Major Scientific Instrument and Equipment Development Project under Grant No 2011YQ030114; and the National Science and Technology Support Program under Grant No 2012BAI23B00. Fei Liu was supported in part by the Postdoctoral Fellowship of Center for Life Sciences.
Disclosure
The authors report no conflicts of interest in this work.
References
Zhang B, Liu S, Liu F, et al. Simultaneous fluorescence and positron emission tomography for in vivo imaging of small animals. J Biomed Opt. 2011;16(12):120511. | |
Lee DE, Koo H, Sun IC, Ryu JH, Kim K, Kwon IC. Multifunctional nanoparticles for multimodal imaging and theragnosis. Chem Soc Rev. 2012;41:2656–2672. | |
Chen X, Conti PS, Moats RA. In vivo near-infrared fluorescence imaging of integrin alphavbeta3 in brain tumor xenografts. Cancer Res. 2004;64:8009–8014. | |
Rudin M, Weissleder R. Molecular imaging in drug discovery and development. Nat Rev Drug Discov. 2003;2:123–131. | |
Liu F, Zhang Y, Liu S, et al. Monitoring of tumor response to Au nanorod-indocyanine green conjugates mediated therapy with fluorescence imaging and positron emission tomography. IEEE Trans Multimed. 2013;15(5):1025–1030. | |
Song X, Wang D, Chen N, Bai J, Wang H. Reconstruction for free-space fluorescence tomography using a novel hybrid adaptive finite element algorithm. Opt Express. 2007;15(26):18300–18317. | |
Stelter L, Pinkernelle JG, Michel R, et al. Modification of aminosilanized superparamagnetic nanoparticles: feasibility of multimodal detection using 3T MRI, small animal PET, and fluorescence imaging. Mol Imaging Biol. 2010;12(1):25–347. | |
Yang L, Peng XH, Wang YA, et al. Receptor-targeted nanoparticles for in vivo imaging of breast cancer. Clin Cancer Res. 2009;15(14):4722–4732. | |
Niedre M, Ntziachristos V. Elucidating structure and function in vivo with hybrid fluorescence and magnetic resonance imaging. Proc IEEE Inst Electr Electron Eng. 2008;96(3):382–396. | |
Sosnovik DE, Nahrendorf M, Deliolanis N, et al. Fluorescence tomography and magnetic resonance imaging of myocardial macrophage infiltration in infarcted myocardium in vivo. Circulation. 2007;115:1384–1391. | |
Kelly KA, Allport JR, Tsourkas A, Shinde-Patil VR, Josephson L, Weissleder R. Detection of vascular adhesion molecule-1 expression using a novel multimodal nanoparticle. Circ Res. 2005;96:327–336. | |
Bardhan R, Chen W, Bartels M, et al. Tracking of multimodal therapeutic nanocomplexes targeting breast cancer in vivo. Nano Lett. 2010;10(12):4920–4928. | |
Smith L, Kuncic Z, Ostrikov K, Kumar S. Nanoparticles in cancer imaging and therapy. J Nanomat. 2012;2012:1–7. | |
Montet X, Montet-Abou K, Reynolds F, Weissleder R, Josephson L. Nanoparticle imaging of integrins on tumor cells. Neoplasia. 2006;8(3):214–222. | |
Helman EE, Newman JR, Dean NR, Zhang W, Zinn KR, Rosenthal EL. Optical imaging predicts tumor response to anti-EGFR therapy. Cancer Biol Ther. 2010;10(2):166–171. | |
Liao C, Sun Q, Liang B, Shen J, Shuai X. Targeting EGFR-overexpressing tumor cells using Cetuximab-immunomicelles loaded with doxorubicin and superparamagnetic iron oxide. Eur J Radiol. 2011;80(3):699–705. | |
Tsutsui S, Ohno S, Murakami S, Hachitanda Y, Oda S. Prognostic value of epidermal growth factor receptor (EGFR) and its relationship to the estrogen receptor status in 1029 patients with breast cancer. Breast Cancer Res Treat. 2002;71(1):67–75. | |
Ke S, Wen X, Gurfinkel M, et al. Near-infrared optical imaging of epidermal growth factor receptor in breast cancer xenografts. Cancer Res. 2003;63:7870–7875. | |
Mulder WJ, Castermans K, van Beijnum JR, et al. Molecular imaging of tumor angiogenesis using alphavbeta3-integrin targeted multimodal quantum dots. Angiogenesis. 2009;12:17–24. | |
Cai W, Chen K, Li ZB, Gambhir SS, Chen X. Dual-function probe for PET and near-infrared fluorescence imaging of tumor vasculature. J Nucl Med. 2007;48:1862–1870. | |
Davis SC, Samkoe KS, O’Hara JA, Gibbs-Strauss SL, Paulsen KD, Pogue BW. Comparing implementations of magnetic-resonance-guided fluorescence molecular tomography for diagnostic classification of brain tumors. J Biomed Opt. 2010;15(5):051602. | |
Jia Q, Zeng J, Qiao R, et al. Gelification: an effective measure for achieving differently sized biocompatible Fe3O4 nanocrystals through a single preparation recipe. J Am Chem Soc. 2011;133:19512–19523. | |
Qiao R, Jia Q, Hüwel S, et al. Receptor-mediated delivery of magnetic nanoparticles across the blood-brain barrier. ACS Nano. 2012;6(4):3304–3310. | |
Liu S, Jia B, Qiao R, et al. A novel type of dual-modality molecular probe for MR and nuclear imaging of tumor: preparation, characterization and in vivo application. Mol Pharm. 2009;6(4):1074–1082. | |
Liu X, Wang D, Bai J. Fluorescence molecular tomography with optimal radon transform based surface reconstruction. Conf Proc IEEE Eng Med Biol Soc. 2009;2009:1404–1407. | |
Deliolanis N, Lasser T, Hyde D, Soubret A, Ripoll J, Ntziachristos V. Free-space fluorescence molecular tomography utilizing 360 degrees geometry projections. Opt Lett. 2007;32(4):382–384. | |
Song X, Wang D, Bai J, Wang H. Reconstruction for free-space fluorescence tomography using a novel hybrid adaptive finite element algorithm. Opt Express. 2007;15(26):18300–18317. | |
Paudyal P, Paudyal B, Iida Y, et al. Dual functional molecular imaging probe targeting CD20 with PET and optical imaging. Oncol Rep. 2009;22(1):115–119. | |
Wehrl HF, Judenhofer MS, Wiehr S, Pichler BJ. Pre-clinical PET/MR: technological advances and new perspectives in biomedical research. Eur J Nucl Med Mol Imaging. 2009;36 Suppl 1:S56–S68. | |
Stuker F, Baltes C, Dikaiou K, et al. Hybrid small animal imaging system combining magnetic resonance imaging with fluorescence tomography using single photon avalanche diode detectors. IEEE Trans Med Imaging. 2011;30(6):1265–1273. | |
Zhang G, Cao X, Zhang B, Liu F, Luo J, Bai J. MAP estimation with structural priors for fluorescence molecular tomography. Phys Med Biol. 2013;58(2):351–372. | |
Cai W, Shin DW, Chen K, et al. Peptide-labeled near-infrared quantum dots for imaging tumor vasculature in living subjects. Nano Lett. 2006; 6(4):669–676. | |
Weissleder R, Stark DD, Engelstad BL, et al. Superparamagnetic iron oxide: pharmacokinetics and toxicity. AJR Am J Roentgenol. 1989; 152(1):167–173. |
 © 2013 The Author(s). This work is published and licensed by Dove Medical Press Limited. The full terms of this license are available at https://www.dovepress.com/terms.php and incorporate the Creative Commons Attribution - Non Commercial (unported, v3.0) License.
By accessing the work you hereby accept the Terms. Non-commercial uses of the work are permitted without any further permission from Dove Medical Press Limited, provided the work is properly attributed. For permission for commercial use of this work, please see paragraphs 4.2 and 5 of our Terms.
© 2013 The Author(s). This work is published and licensed by Dove Medical Press Limited. The full terms of this license are available at https://www.dovepress.com/terms.php and incorporate the Creative Commons Attribution - Non Commercial (unported, v3.0) License.
By accessing the work you hereby accept the Terms. Non-commercial uses of the work are permitted without any further permission from Dove Medical Press Limited, provided the work is properly attributed. For permission for commercial use of this work, please see paragraphs 4.2 and 5 of our Terms.