")
Back to Journals » International Journal of Nanomedicine » Volume 12
In vivo biodistribution and behavior of CdTe/ZnS quantum dots
Authors Zhao Y, Zhang Y, Qin G, Cheng J, Zeng W, Liu S, Kong H , Wang X, Wang Q, Qu H
Received 30 August 2016
Accepted for publication 30 November 2016
Published 9 March 2017 Volume 2017:12 Pages 1927—1939
DOI https://doi.org/10.2147/IJN.S121075
Checked for plagiarism Yes
Review by Single anonymous peer review
Peer reviewer comments 3
Editor who approved publication: Dr Linlin Sun
Yan Zhao,1,* Yue Zhang,2,* Gaofeng Qin,1 Jinjun Cheng,1 Wenhao Zeng,2 Shuchen Liu,1 Hui Kong,1 Xueqian Wang,1 Qingguo Wang,1 Huihua Qu3
1School of Basic Medical Sciences, 2School of Chinese Materia Medica, 3Center of Scientific Experiment, Beijing University of Chinese Medicine, Beijing, People’s Republic of China
*These authors contributed equally to this work
Abstract: The unique features of quantum dots (QDs) make them desirable fluorescent tags for cell and developmental biology applications that require long-term, multitarget, and highly sensitive imaging. In this work, we imaged fluorescent cadmium telluride/zinc sulfide (CdTe/ZnS) QDs in organs, tissues, and cells, and analyzed the mechanism of their lymphatic uptake and cellular distribution. We observed that the fluorescent CdTe/ZnS QDs were internalized by lymph nodes in four cell lines from different tissue sources. We obtained the fluorescence intensity–QD concentrations curve by quantitative analysis. Our results demonstrate that cells containing QDs can complete mitosis normally and that distribution of QDs was uniform across cell types and involved the vesicular transport system, including the endoplasmic reticulum. This capacity for CdTe/ZnS QD targeting provides insights into the applicability and limitations of fluorescent QDs for imaging biological specimens.
Keywords: quantum dots, lymph nodes, fluorescence imaging, biodistribution
Introduction
Fluorescent semiconductor nanocrystals, also known as quantum dots (QDs), have several unique optical and chemical features.1 These features make them desirable fluorescent tags for cell and developmental biology applications requiring long-term, multitarget, highly sensitive imaging and be regarded as promising reporters or biosensors.2,3 To limit the potentially toxic effects caused by the release of heavy metals due to either oxidation of the core or surface defects, the core is encapsulated in a shell of organic material.4 Semiconductor QDs are usually described as fluorophores having remarkable photostability,5 narrow size distributions, tunable emission peaks, and high quantum yields.6,7 These properties make QDs powerful tools for labeling8 and optical imaging in the biological9,10 and biomedical fields.11 The improved synthesis of water-stable QDs and the development of approaches for biological imaging using QDs have triggered the recent explosion in imaging techniques. QDs have been used for many applications, such as in sensing of inorganic ions, organic small molecules, and biological macromolecules; in bioconjugation and cell staining; for live imaging in animals; as cellular effectors and reporters; and in therapeutic applications.12–15
Cadmium telluride/zinc sulfide (CdTe/ZnS) nanocrystals are the most commonly used core/shell QDs. These have been used as selective inorganic ion probes to detect pesticides,16 nitrobenzene,17 and Hg2+,18 or to label functional groups.19 Recently, we reported the development of a novel biosensor using CdTe/ZnS QD-conjugated monoclonal antibody as a highly sensitive probe.20 The passive targeting of QDs also allows their application in drug delivery21,22 and imaging.21,23,24 Despite the significant attention given to CdTe/ZnS QDs, however, studies on the in vivo biodistribution and the behavior of CdTe/ZnS QDs are still relatively limited and nonsystematic.
The established view dictates that cellular uptake is sensitive to functional groups on the QD surface.22,25 Nevertheless, many researchers have observed various nonspecific imaging and passive targeting properties of QDs, namely, the behavior of the QDs but not the functional groups.26,27 Therefore, to better understand and predict the efficacy and side effects of QDs in vivo, some key questions need to be addressed: Where are these nanocrystals deposited within the tissue and cell? How long do the deposited QDs remain in the tissues or organs? What happens to the QD particles when they are in a biological system? To address these issues, in this work, we imaged CdTe/ZnS QDs at the integral, organ, tissue, and cell levels, and analyzed the mechanisms of their internalization.
Materials and methods
Materials
Activated CdTe/ZnS QD nanocrystals (QD2605; peak emission wavelength: 605 nm) were obtained from JiaYuan QDs (Wuhan, China). All other chemicals were of analytical grade. DioC6 was purchased from Sigma (St Louis, MO, USA). Female BALB/c mice (10–12 weeks old) were obtained from Spfanimals Co (Beijing, China). All animal subjects underwent a routine examination prior to inclusion. The Joint Ethical Review Committee approved our ethics application for the animal study (number 2015BZHYLL00107) and experiments were carried out in accordance with the Beijing University of Chinese Medicine (BUCM) Joint Ethical Review Committee guidelines for the care and use of laboratory research animals. A Clariostar fluorescence microplate reader (filters: 240–900 nm for fluorescence and 200–900 nm for absorbance) was purchased from BMG Labtech (Ortenberg, Germany). All other analytical grade chemical reagents were obtained from Sinopharm Chemical Reagents Beijing (Beijing, China).
The synthesis method of CdTe/Zns QDs is described in the Supplementary materials.
Measurement of spectral properties
The ultraviolet-and-visible (UV–vis) absorption spectrum of QD2605 was determined with a PerkinElmer Lambda UV–vis spectrophotometer (Waltham, MA, USA), with background correction for the contribution of water. The measured range was from 200 to 600 nm. The fluorescence spectrum of diluted QDs was determined using an Applied NanoFluorescence spectrometer (Houston, TX, USA) at room temperature with laser excitation at 298 nm. The curves of the spectra were drawn according to the intensity of each nanometer of light emitted between 500 and 800 nm.
Transmission electron microscopy
The transmission electron microscopy (TEM) images were obtained with a JEM-1230 electron microscope (JEOL Ltd., Tokyo, Japan) at an acceleration voltage of 80 kV. TEM specimens were prepared by evaporating one drop of nanocrystal solution on carbon-coated copper grids, according to previous studies.28–30 The size and size distribution data were obtained by counting >100 individual particles using Digital micrograph 3.9.
In vivo lymphatic imaging
The study protocol was approved by the Joint Ethical Review Committee of the BUCM. QD2605 was diluted to 2 μM with normal saline. Two groups of animals (n=3 each) were used for lymphatic imaging and subsequent histological analysis. Mice were anesthetized in all experiments. Seven mice were subdermally injected with 20 μL QD2605 at two sites – the left and right middle phalanges of the upper extremities – using a Hamilton gas-tight syringe (Figure 1F inset). In vivo visible multicolor fluorescence imaging was not performed due to the high autofluorescence of mouse hairs. At 24 h after injection, four of the mice were sacrificed, and their lymph nodes were exposed under 365 nm for in situ fluorescence imaging using a modified real-time fluorescence imaging system23,24,31 (FluorVivo; INDEC BioSystems, Santa Clara, CA, USA). Passive control mice were treated with an identical volume of two organic fluorescent dyes: fluorescein isothiocyanate (FITC), exposed under 488 nm (Figure S1), and rhodamine isothiocyanate (Figure S2), exposed under 565 nm. Blank control mice were treated with an identical volume of normal saline. An additional group of seven mice were injected in the caudal vein with 20 μL of QD2605 (2 μM). To better observe the behavior of the QDs, the right ear of each animal was dabbed with 20 μL xylene to increase blood flow to that area. Within 10 min of injection, fluorescence was observed in areas where the blood vessels were close to the skin surface, including the nose, eyelid, and right ear. Mice were euthanized 24 h after injection and their lymph nodes were exposed for in situ fluorescence imaging. Two control mice were treated with an identical volume of normal saline.
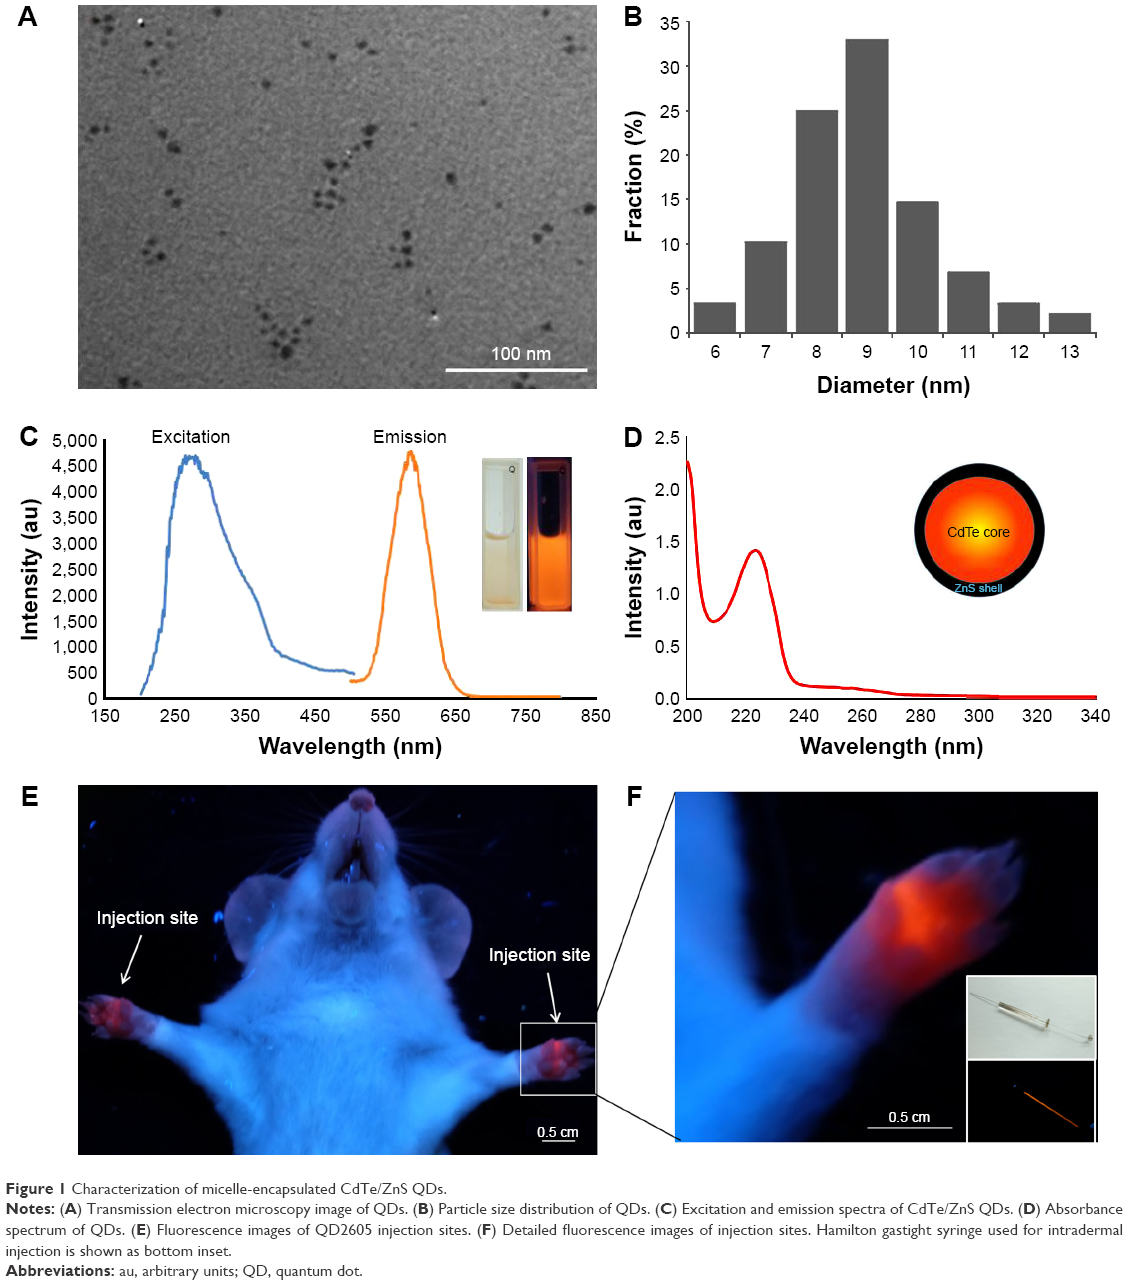 | Figure 1 Characterization of micelle-encapsulated CdTe/ZnS QDs. |
Histological analysis
After in vivo fluorescence imaging, axillary lymph nodes (containing QD2605) were removed and fixed in 10% formaldehyde for 48 h. The tissue was dehydrated through a graded series of ethanol, followed by xylene, and then embedded in paraffin. The samples were cut into 4 μm-thick sections with a rotary microtome32 (Leica, Nussloch, Germany), which were evaluated with a fluorescence microscope (LX73; Olympus, Melville, NY, USA) equipped three bandpass filters (excitation: 340–390/460–495/530–550 nm; and emission: 420–900/510–900/575–625 nm). Sections were also stained with hematoxylin and eosin.
Cell culture
All cell lines were obtained from the American Type Culture Collection (ATCC; Manassas, VA, USA). The RAW264.7 cell line derived from an Abelson murine leukemia virus-induced tumor was cultured in Dulbecco’s Modified Eagle’s medium containing 10% inactivated fetal calf serum and 1% penicillin (10,000 IU)–streptomycin (10,000 mg/mL). Human umbilical vein endothelial cells (HUVECs) derived from normal umbilical vein/vascular endothelium were cultured in endothelial cell medium containing 10% inactivated fetal calf serum, epidermal growth factor, and 1% penicillin/streptomycin. PC-3 cells derived from human prostate and SH-SY5Y cells derived from human neuroblastoma were cultured in F-12K medium containing 10% inactivated fetal calf serum and 1% penicillin/streptomycin.33,34 Control cells were treated with 4′,6-diamidino-2-phenylindole (DAPI) only. Cells were cultured in an atmosphere of 95% air/5% CO2 at 37°C.
Cell toxicity tests
The effect of QDs on the viability of HUVECs was evaluated using the 3-(4,5-dimethylthiazol-2-yl)-2,5-diphenyltetrazolium bromide (MTT) assay and cell counting. Briefly, HUVECs were seeded in 96-well plates, and after 24 h, the culture medium was replaced with 200 mL QD suspension at concentrations of 0–7 μM. After the incubation period (24 or 48 h), cells were washed and a 50 mL volume of MTT (2 mg/mL) was added to each well, followed by incubation at 37°C for 3 h. Water-insoluble formazan crystals were solubilized with dimethyl sulfoxide (DMSO), and the optical density at 490 nm was determined with a Clariostar fluorescence microplate reader (BMG Labtech).
According to the MTT assay, HUVECs were incubated in endothelial cell medium containing 2 (low-dose) and 7 μM (high-dose) QDs. Blank control cells were seeded in normal endothelial cell medium. Cell counting was performed at 24, 48, and 96 h after exposure. The original cell count was 105.
Visualization of QD2605 uptake and intracellular localization
QD2605 internalization was examined in RAW264.7, PC-3, and SH-SY5Y cells, as well as in HUVECs. To eliminate autofluorescence from the plastic culture plate, cells (1×10⁵) were seeded on 12 mm sterile coverslips placed in a six-well plate. After culturing for 24 h, the cells were incubated with QD2605 (0.1 μM) for 24 h. After three washes with phosphate-buffered saline (PBS), the cells were incubated with DAPI for 10 min, then fixed for 10 min in 100 μL of 4% paraformaldehyde, before another wash in PBS. Coverslips were mounted on glass slides with 10 μL of 50% glycerol/PBS (v/v) and visualized by fluorescence microscopy.34
Quantitative analysis of QD2605 fluorescence in cells
RAW264.7 cells were used for quantitative analysis of QD2605 fluorescence. The cells were seeded in black 96-well culture plates (10,000 cells per well) and incubated for 24 h at 37°C and 5% CO2. The culture medium was replaced with fresh medium supplemented with different concentrations of QD2605 (0.4, 0.8, 1.6, 3.125, 6.25, 12.5, 25, 50, and 100 nM) and incubated for 24 h. Cells were then washed with PBS and fixed for 10 min in 100 μL of 4% paraformaldehyde. As a measure of cellular uptake of QDs, the fluorescence intensity of fixed cells was determined with the Clariostar fluorescence microplate reader.
Visualization of QDs in the endoplasmic reticulum (ER) of HUVECs
The ER-specific dye DioC6 was used to better visualize the biodistribution of QDs in HUVECs. DioC6 was dissolved in DMSO, diluted with PBS to 1 mg/mL for storage, and further diluted to 1 nM for the working solution. Cells were incubated with DioC6 for 10 min, washed, and fixed for analysis.
Mitosis in HUVECs containing QDs
The fluorescence image in live cells was determined using the Cell^R live cell imaging system (Olympus, Melville, NY, USA) equipped with digital image correlation system and DP26 black-and-white charge-coupled device camera. The HUVECs were seeded on a culture dish, incubated with QD2605 (0.1 μM) for 24 h and Hoechest (DNA dye) for 10 min. After washing, the fluorescence image of the cells was gathered by the CCD camera every 10 min. In addition, the images of mitosis in fixed and live cells were observed using fluorescence microscope.
Results
Spectral properties of QD2605
The TEM image of QD2605 is shown in Figure 1A. The particle size distribution of QDs is shown in Figure 1B, which shows that QD2605 has an average diameter of 9 nm. The excitation and emission wavelengths of QD2605 were between 200 and 500 nm and between 500 and 650 nm, respectively, with maximum absorption and emission at 287 and 605 nm, respectively (Figure 1C). QDs with a quantum yield of nearly 70% exhibited peak emission at 605 nm and presented typical broadband absorption. The absorbance spectra of the diluted QDs are shown in Figure 1D, with maximum absorbance at around 197 nm.
In situ lymphatic imaging of QD2605
The sites of subdermal injection of mice with QD2605 were subjected to in situ fluorescence imaging (Figure 1E and F). Red fluorescence corresponding to the QD2605 signal was clearly observed at four sites (white arrows in Figure 2A), which were presumed to be the bilateral proper and accessory axillary lymph nodes (Figure 2B and C). This is consistent with the results of previous studies.23,24,31,35–37 Within 10 min of intravenous injection of the caudal vein, fluorescence was observed in superficial areas of the mouse, such as the tip of the nose, eyelids, and front paws (Figure 2D). The appearance of the left ear was normal; however, the right ear (treated with xylene) showed obvious fluorescence, indicating that local inflammation upon xylene application caused an increase in blood flow, yielding a stronger fluorescence signal. Thus, QDs are distributed rapidly by systemic blood flow. In situ fluorescence imaging revealed QD signals in the bilateral superficial parotid, accessory mandibular, proper axillary, accessory axillary, and medical iliac lymph nodes (Figure 2E). These results indicate that more lymph nodes are labeled by intravenous administration compared to subcutaneous injection of QDs. Interestingly, regardless of the route of administration, the fluorescence showed an aureole-like pattern, which is characteristic of lymph node distribution.
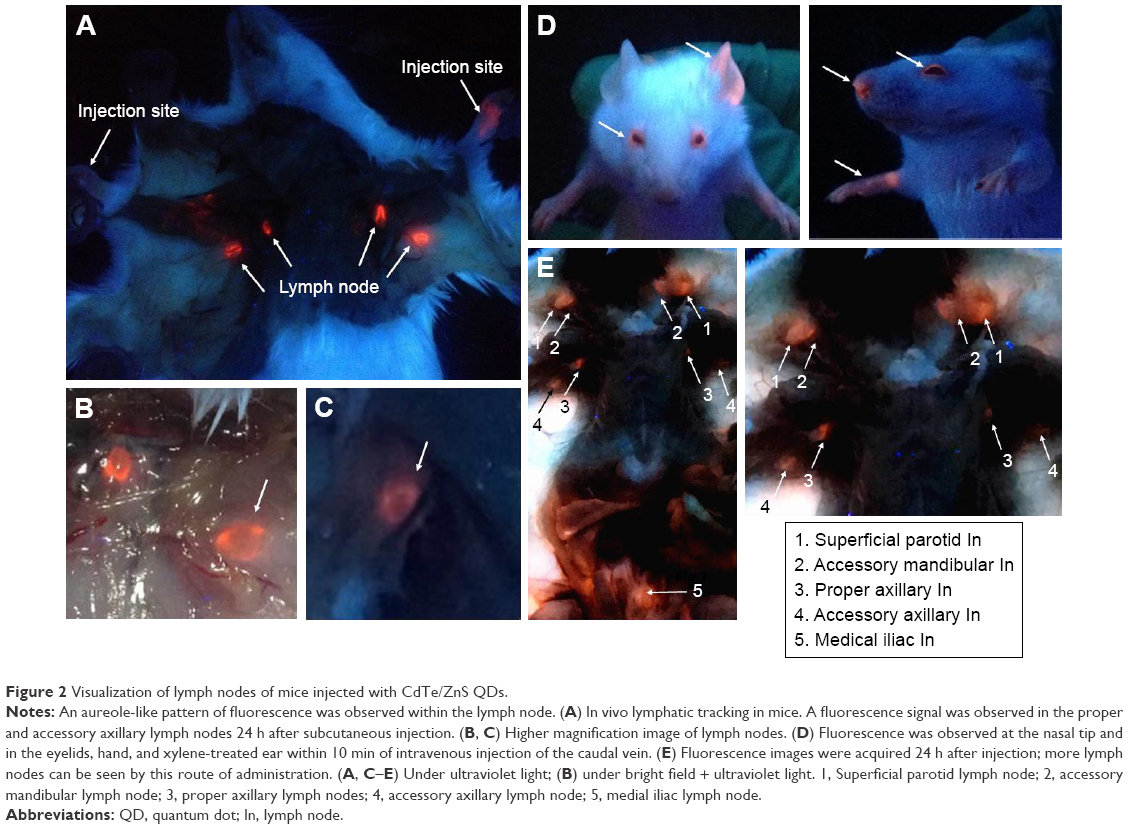 | Figure 2 Visualization of lymph nodes of mice injected with CdTe/ZnS QDs. |
As the control, unlike QD2605, the two organic fluorescent dyes did not show any fluorescence signal in the body except at the injection sites (Figure S3), which shows the excellent properties of QDs in the field of biomedical imaging.
Cell toxicity tests
As shown in Figure S4, QD2605 was found to be biocompatible with HUVECs. At all the concentrations tested (1–7 μM), the survival of the cells was found to be >80%. At 1 μM, only 5% of the cells were killed, whereas at 7 μM, 80.32% cells were found to be alive. This indicates the exceptional biocompatibility of QD2605 for novel biological applications.
As shown in Figure S5, the treated cells experienced slow growth and even the cell count decreased within the first 24 h. The cell count results indicate that HUVECs exposed to QDs proliferated slowly, in contrast to the control cells, which grew exponentially.
Histological analysis
After imaging, lymph nodes in the neck were processed for histological analysis. In contrast to organic fluorescent dyes, QD2605 showed good stability and resistance to photobleaching in paraffin sections. Many researchers had reported the QD distribution in lymph nodes.27,32,35–39 In this work, we obtained more details. QDs spread along the edges of lymph nodes around the lymph node capsule, suggesting that they were transported in the lymph fluid from afferent lymphatic vessels that enter the subcapsular sinus and then flowed through the medullary sinuses (Figure 3A and B). QDs were distributed around every germinal center but were rarely seen within this denser tissue (Figure 3). High-magnification images revealed that the QDs were nodular – with dark areas in the center – rather than diffusely distributed, indicating that QDs accumulate in the cytoplasm of cells within lymphatic sinuses (Figure 3C and D).
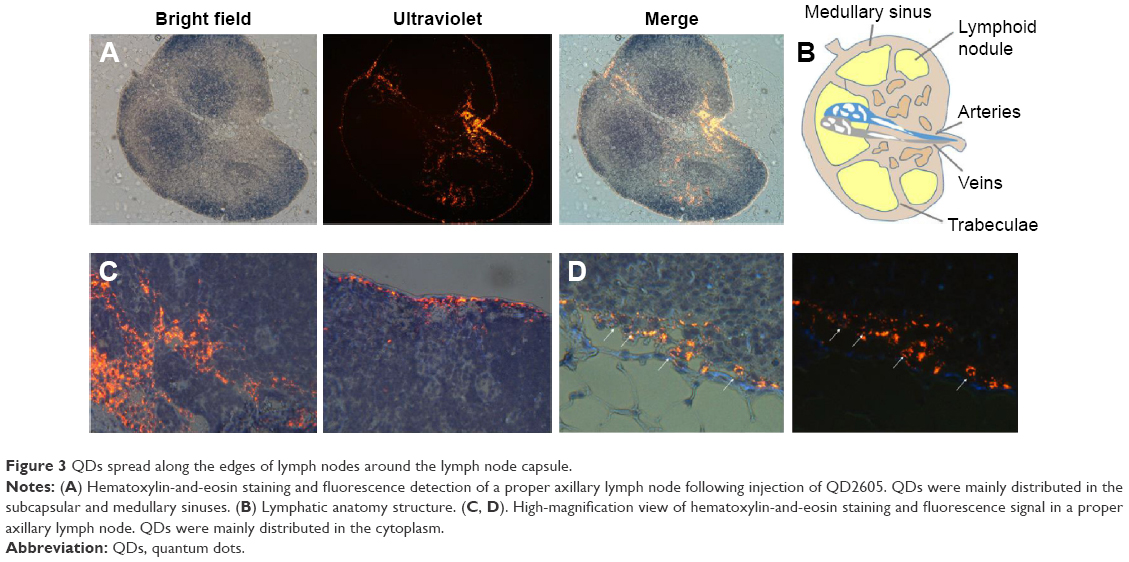 | Figure 3 QDs spread along the edges of lymph nodes around the lymph node capsule. |
Visualization of QD2605 uptake and intracellular localization
QD2605 internalization was evaluated in four cell lines from different tissue sources. RAW264.7, PC-3, and SH-SY5Y cells, as well as HUVECs, were incubated with 1 μg/mL CdTe/ZnS QDs for 24 h and then washed to remove any unbound QDs. The fluorescence signal from encapsulated QDs was observed in all four cell lines (Figure 4), in contrast to untreated control cells, in which only the DAPI signal was detected. This QD signal was consistent with its distribution in lymphoid cells and in accordance with previous studies of core/shell QDs;33,34,40 however, it contradicts other reports.41 Interestingly, the distribution of the QD2605 signal was uniform across cell types; the QDs showed spotty distribution in the cytoplasm of the four cell lines rather than moving into the nucleus.
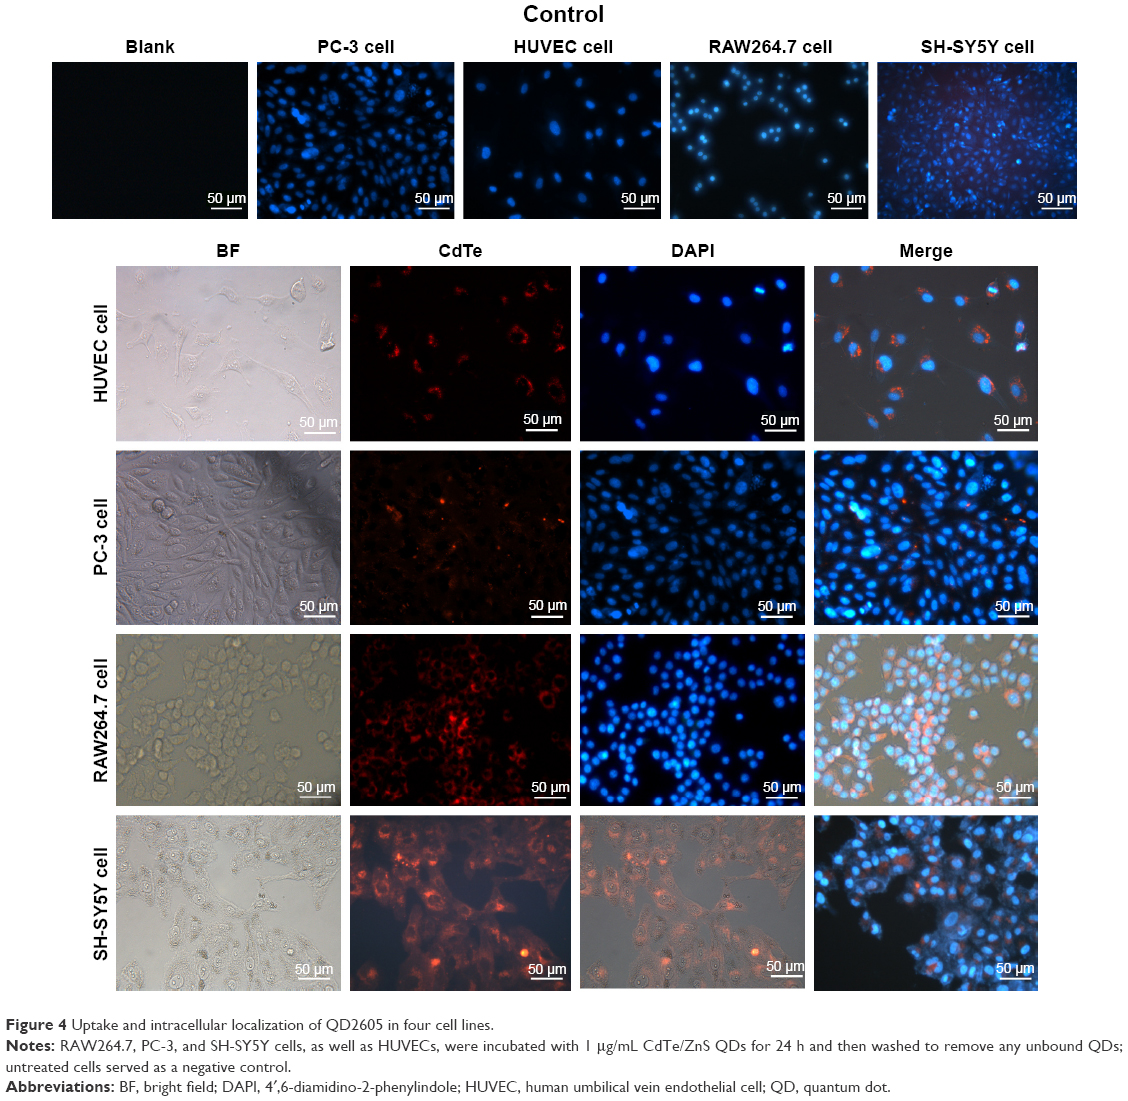 | Figure 4 Uptake and intracellular localization of QD2605 in four cell lines. |
Quantitative analysis of QD2605 fluorescence in cells
RAW264.7 cells were incubated with different concentrations of QD2605 for 24 h. Fluorescence intensity increased as a function of QD2605 concentration (Figure 5A). Using a 30×30 scan pattern, we obtained 900 quantitative results in one 0.32 cm2 well, which more accurately reflected the exclusive distribution of the fluorescence signal in the well (Figure 5B). The fluorescence intensity–QD concentration curve was fitted with an equation (Figure 5C).
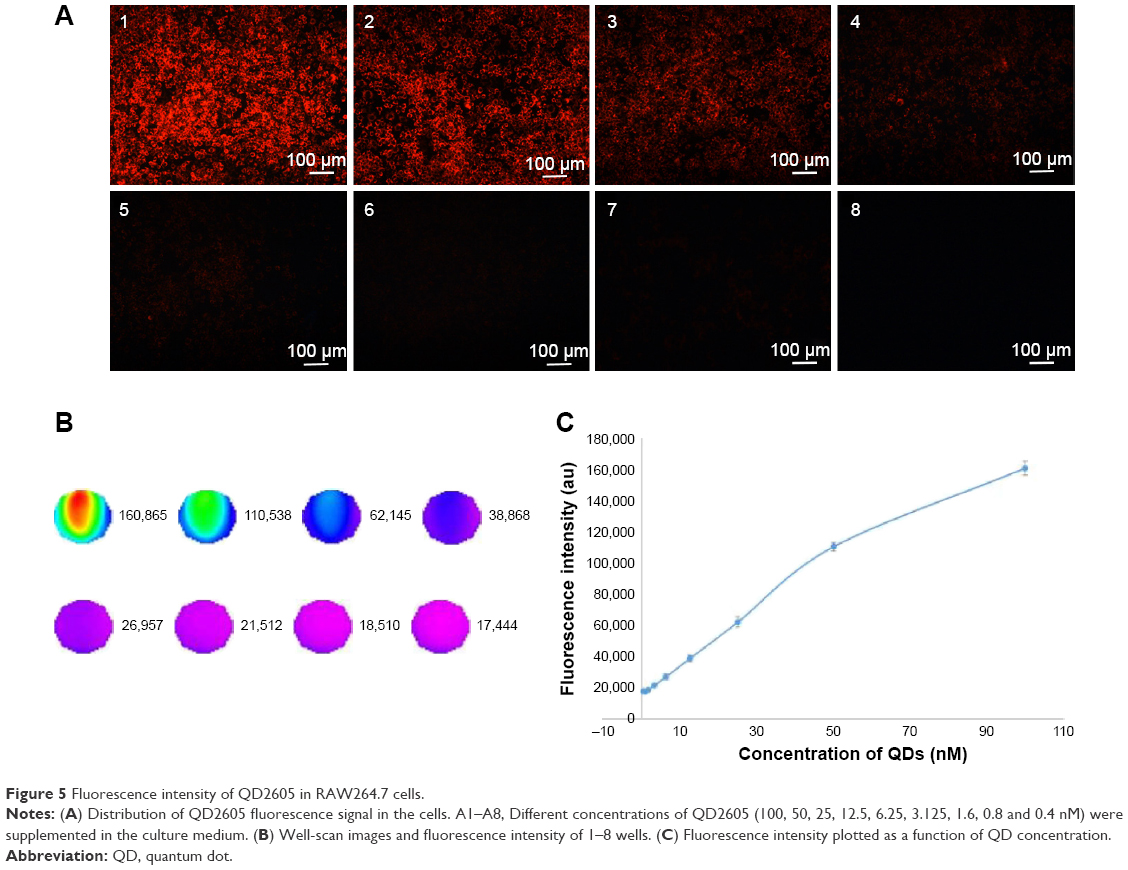 | Figure 5 Fluorescence intensity of QD2605 in RAW264.7 cells. |
Visualization of QD uptake and ER localization in HUVECs
The internalization of hydrophilic macromolecules by cells is achieved via endocytosis. We therefore presumed that the fluorescence signal in the four cell lines were cytosolic vesicles containing QDs. These vesicles tended to cluster around the nucleus (Figure 6A) in the location of the ER (Figure 6B). As we all know, the transport of hydrophilic macromolecules via endocytosis is mainly facilitated by vesicular trafficking, which is a critical point in the endocytic pathway. We therefore labeled the ER of HUVECs containing QDs with DioC6 and observed colocalization of the red and green fluorescence signals corresponding to QD2605 and DioC6, respectively (Figure 6C). In the merged image, we found that the red and green fluorescence images fitted perfectly, which suggested that the distribution of QDs was well correlated with the hydrophilic macromolecules.
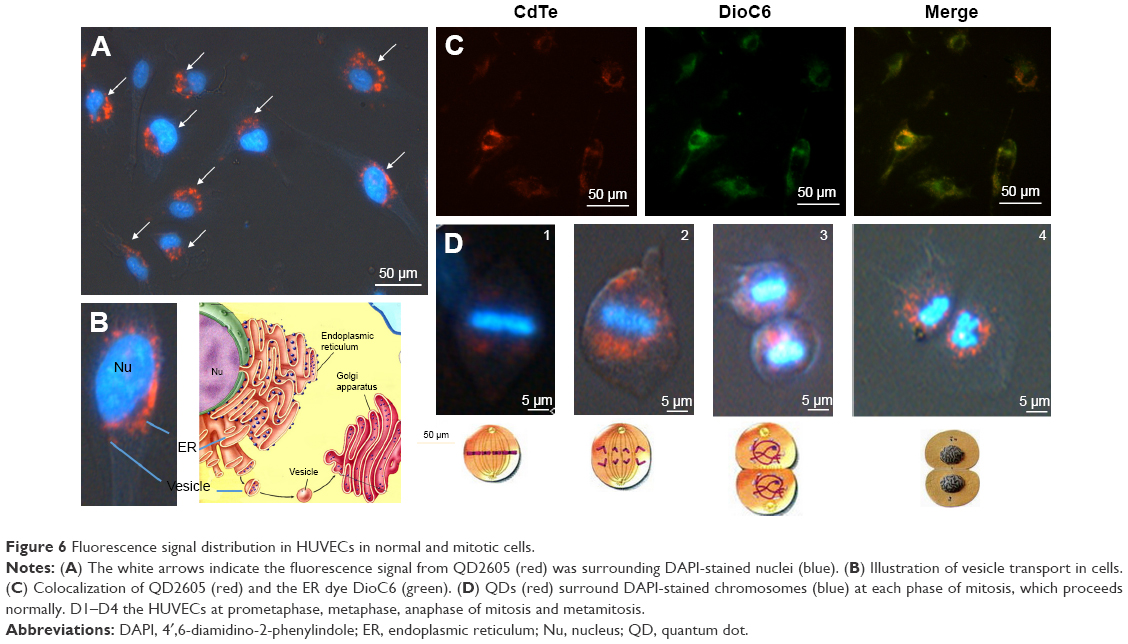 | Figure 6 Fluorescence signal distribution in HUVECs in normal and mitotic cells. |
Mitosis in HUVECs containing QDs
Mitosis was visualized in fixed HUVECs containing QDs (Figure 6D). We observed compacted chromosomes aligned at the metaphase plate; sister chromatids were pulled toward opposite poles during anaphase, with chromatin separation occurring during telophase. At this point, the QDs were randomly distributed in the cytoplasm. The division process of live cells containing QDs was recorded by the living cell imaging system (Figure S6) and the fluorescence microscope (Figure S6). The results of fixed cell (Figure 6) and live cell (Figure S6) imaging demonstrated that cells containing QDs can complete mitosis.
Discussion
In this work, we visualized CdTe/ZnS QDs at the integral, organ, tissue, and cell levels, which revealed the following: After subcutaneous injection, QDs entered nearby lymph nodes and became distributed in a ring pattern, encircling the lymph node capsule. QDs appeared nodular—with dark central areas—rather than diffuse, indicating that they accumulated in the cytoplasmic vesicles of cells within the lymphatic sinuses that were mainly distributed in the ER around the nucleus. We also observed that mitosis proceeded normally in HUVECs containing QDs.
Compared with the traditional dyes, QDs showed entirely different characteristics. First, the QDs are macromolecules that may tend to accumulate in the lymphatic system more than the organic dyes (micromolecules). Second, the QDs have much higher quantum yield (nearly 70%) than the fluorescent dyes, which can provide a high-resolution image. The fluorescence signal of FITC/rhodamine at the injection sites was weaker than that of QDs. Third, the organic dyes are easy to quench, which made it difficult to observe the fluorescence image. Therefore, stability of QDs against photobleaching is a big advantage for imaging.
Moreover, in contrast to organic fluorescent dyes, QD2605 showed good stability and resistance to photobleaching in processed paraffin sections. After tissue fixation and various treatments, the QDs in lymph nodes still emitted a strong fluorescence signal. We still observed the signal of QDs in lymph nodes 72 h later. Some studies have shown that QDs can exist for more than 7 days23 in the body and cadmium remained in the liver after 90 days,42 compared to several days for carbon dots.
Interestingly, the distribution of the QD2605 signal was uniform across cell types; they showed spotty distribution in the cytoplasm of the four cell lines rather than moving into the nucleus. We could speculate that the distribution of QDs is closely related to its own characters. Cells can internalize small molecules, through membrane diffusion or via membrane protein channels. However, transport of macromolecules such as QDs is generally considered to be mediated by the membrane-bound vesicles that trigger QDs to enter the cells via a series of processes termed endocytosis. The exact mechanism is still to be proved by more solid evidence in further work.
Conclusion
We observed that the fluorescent CdTe/ZnS QDs were internalized by lymph nodes in the four cell lines from different tissue sources. We obtained the fluorescence intensity–QD concentration curve by quantitative analysis. Our results demonstrated that cells containing QDs can complete mitosis normally and that distribution of QDs was related to the vesicular transport system, including vesicles, ER, and lysosomes. This targeting ability of CdTe/ZnS QDs may hold great significance in the potential application of fluorescent QDs for biological imaging in the future.
Acknowledgments
The authors thank Elsevier Editing for providing language assistance and for proofreading the manuscript. The National Natural Science Foundation of China (grant numbers 81430102, 81473338, and 81274043) and the Classical Prescription Basic Research Team of the Beijing University of Chinese Medicine who supported this work.
Disclosure
The authors report no conflicts of interest in this work.
References
Jaiswal JK, Simon SM. Potentials and pitfalls of fluorescent quantum dots for biological imaging. Trends Cell Biol. 2004;14(9):497–504. | ||
Wegner KD, Hildebrandt N. Quantum dots: bright and versatile in vitro and in vivo fluorescence imaging biosensors. Chem Soc Rev. 2015;44(14):4792–4834. | ||
Bentolila LA, Ebenstein Y, Weiss S. Quantum dots for in vivo small-animal imaging. J Nucl Med. 2009;50(4):493–496. | ||
Robe A, Pic E, Lassalle HP, Bezdetnaya L, Guillemin F, Marchal F. Quantum dots in axillary lymph node mapping: biodistribution study in healthy mice. BMC Cancer. 2008;8:1–9. | ||
Liu W, Choi HS, Zimmer JP, Tanaka E, Frangioni JV, Bawendi M. Compact cysteine-coated CdSe(ZnCdS) quantum dots for in vivo applications. J Am Chem Soc. 2007;129(47):14530–14531. | ||
Chan WCW, Maxwell DJ, Gao X, Bailey RE, Han M, Nie S. Luminescent quantum dots for multiplexed biological detection and imaging. Curr Opin Biotechnol. 2002;13(1):40–46. | ||
Gao X, Yang L, Petros JA, Marshall FF, Simons JW, Nie S. In vivo molecular and cellular imaging with quantum dots. Curr Opin Biotechnol. 2005;16(1):63–72. | ||
Liu W, Howarth M, Greytak AB, et al. Compact biocompatible quantum dots functionalized for cellular imaging. J Am Chem Soc. 2008;130:1274–1284. | ||
Wu X, Liu H, Liu J, et al. Immunofluorescent labeling of cancer marker Her2 and other cellular targets with semiconductor quantum dots. Nat Biotechnol. 2003;21(1):41–46. | ||
Michalet X, Pinaud FF, Bentolila LA, et al. Quantum dots for live cells, in vivo imaging, and diagnostics. Science. 2005;307(5709):538–544. | ||
Ballou B, Lagerholm BC, Ernst LA, Bruchez MP, Waggoner AS. Noninvasive imaging of quantum dots in mice. Bioconjug Chem. 2004;15(1):79–86. | ||
Wang C, Gao X, Su X. In vitro and in vivo imaging with quantum dots. Anal Bioanal Chem. 2010;397(4):1397–1415. | ||
Ma Q, Su X. Recent advances and applications in QDs-based sensors. Analyst. 2011;136(23):4883–4893. | ||
Algar WR, Tavares AJ, Krull UJ. Beyond labels: a review of the application of quantum dots as integrated components of assays, bioprobes, and biosensors utilizing optical transduction. Anal Chim Acta. 2010;673(1):1–25. | ||
Jin Z, Hildebrandt N. Semiconductor quantum dots for in vitro diagnostics and cellular imaging. Trends Biotechnol. 2012;30(7):394–403. | ||
Hai NN, Chinh VD, Thuy UTD, et al. Detection of the pesticide by functionalised quantum dots as fluorescence-based biosensor. Key Eng Mater. 2012;495:314–318. | ||
Pazhanivel T, Nataraj D, Devarajan VP, Mageshwari V, Senthil K, Soundararajan D. Improved sensing performance from methionine capped CdTe and CdTe/ZnS quantum dots for the detection of trace amounts of explosive chemicals in liquid media. Anal Methods. 2013;5:910–916. | ||
Saikia D, Dutta P, Sarma NS, Adhikary NC. CdTe/ZnS core/shell quantum dot-based ultrasensitive PET sensor for selective detection of Hg (II) in aqueous media. Sens Actuator B Chem. 2016;230:149–156. | ||
Pang L, Jian X, Chang S, et al. Characterization and cancer cell targeted imaging properties of human antivascular endothelial growth factor monoclonal antibody conjugated CdTe/ZnS quantum dots. Luminescence. 2014;29(8):1177–1182. | ||
Qu H, Yue Z, Qu B, et al. Rapid lateral-flow immunoassay for the quantum dot-based detection of puerarin. Biosens Bioelectron. 2016;81:358–362. | ||
Wang LW, Peng CW, Chen C, Li Y. Quantum dots-based tissue and in vivo imaging in breast cancer researches: current status and future perspectives. Breast Cancer Res Treat. 2015;151(1):7–17. | ||
Nam J, Won N, Bang J, et al. Surface engineering of inorganic nanoparticles for imaging and therapy. Adv Drug Deliv Rev. 2013;65(5):622–648. | ||
Kobayashi H, Hama Y, Koyama Y, et al. Simultaneous multicolor imaging of five different lymphatic basins using quantum dots. Nano Lett. 2007;7(6):1711–1716. | ||
Kosaka N, Ogawa M, Sato N, Choyke PL, Kobayashi H. In vivo real-time, multicolor, quantum dot lymphatic imaging. J Invest Dermatol. 2009;129(12):2818–2822. | ||
Jayagopal A, Russ PK, Haselton FR. Surface engineering of quantum dots for in vivo vascular imaging. Bioconjug Chem. 2007;18(5):1424–1433. | ||
Gopee NV, Roberts DW, Webb P, et al. Quantitative determination of skin penetration of PEG-coated CdSe quantum dots in dermabraded but not intact SKH-1 hairless mouse skin. Toxicol Sci. 2009;111(1):37–48. | ||
Kosaka N, Mitsunaga M, Choyke PL, Kobayashi H. In vivo real-time lymphatic draining using quantum-dot optical imaging in mice. Contrast Media Mol Imaging. 2013;8(1):96–100. | ||
Chen O, Riedemann L, Etoc F, et al. Magneto-fluorescent core-shell supernanoparticles. Nat Commun. 2014;5:5093–5093. | ||
Yang T, Li YK, Chen ML, Wang JH. Supported carbon dots decorated with metallothionein for selective cadmium adsorption and removal. Chin Chem Lett. 2015;26:1496–1501. | ||
Yang ST, Cao L, Luo PG, et al. Carbon dots for optical imaging in vivo. J Am Chem Soc. 2009;131(32):11308–11309. | ||
Mathieu E, Gupta N, Macdonald RL, Ai J, Yucel YH. In vivo imaging of lymphatic drainage of cerebrospinal fluid in mouse. Fluids Barriers CNS. 2013;10(1):35. | ||
Robe A, Pic E, Lassalle HP, Bezdetnaya L, Guillemin F, Marchal F. Quantum dots in axillary lymph node mapping: biodistribution study in healthy mice. BMC Cancer. 2008;8:111. | ||
Erogbogbo F, Yong KT, Roy I, Xu GX, Prasad PN, Swihart MT. Biocompatible luminescent silicon quantum dots for imaging of cancer cells. ACS Nano. 2008;2(5):873–878. | ||
Sarah PR, Danny B, Vincent E, Martin P, Frédéric C. Internalization of targeted quantum dots by brain capillary endothelial cells in vivo. J Cereb Blood Flow Metab. 2016;36(4):731–742. | ||
Helle M, Cassette E, Bezdetnaya L, et al. Visualisation of sentinel lymph node with indium-based near infrared emitting quantum dots in a murine metastatic breast cancer model. PLoS One. 2012;7(8):e44433. | ||
Pic E, Pons T, Bezdetnaya L, et al. Fluorescence imaging and whole-body biodistribution of near-infrared-emitting quantum dots after subcutaneous injection for regional lymph node mapping in mice. Mol Imaging Biol. 2010;12(4):394–405. | ||
Chou LY, Fischer HC, Perrault SD, Chan WC. Visualizing quantum dots in biological samples using silver staining. Anal Chem. 2009;81(11):4560–4565. | ||
Sen D, Deerinck TJ, Ellisman MH, Parker I, Cahalan MD. Quantum dots for tracking dendritic cells and priming an immune response in vitro and in vivo. PLoS One. 2008;3(9):e3290. | ||
Wu Q, Chu M. Self-illuminating quantum dots for highly sensitive in vivo real-time luminescent mapping of sentinel lymph nodes. Int J Nanomedicine. 2012;7:3433–3443. | ||
Tang R, Xue J, Xu B, Shen D, Sudlow GP, Samuel A. Tunable ultrasmall visible-to-extended near-infrared emitting silver sulfide quantum dots for integrin-targeted cancer imaging. ACS Nano. 2015;9(1):220–230. | ||
Reyes-Esparza J, Martínez-Mena A, Gutiérrez-Sancha I, et al. Synthesis, characterization and biocompatibility of cadmium sulfide nanoparticles capped with dextrin for in vivo and in vitro imaging application. J Nanobiotechnology. 2015;13:1–14. | ||
Ye L, Yong KT, Liu L, et al. A pilot study in non-human primates shows no adverse response to intravenous injection of quantum dots. Nat Nanotechnol. 2012;7(7):453–458. |
Supplementary materials
Synthesis of CdTe/ZnS QDs
The cadmium telluride/zinc sulfide CdTe/ZnS quantium dots (CdTe/Zns QDs) was synthesized according to previous reports.1,2 Sodium borohydride and tellurium powder were stirred until the color of the solution turned white. Mercaptopropionic acid (MPA) and sodium telluride (NaHTe) were injected into a nitrogen-saturated 0.02 mol/L CdCl2 aqueous solution at pH 11.4. The molar ratio of CdTe:MPA was fixed at 1:0.5:2.5. The whole process was conducted in the presence of N2 and in an ice bath. Finally, the CdTe precursors were transferred into a pot of polytetrafluoroethylene. The freshly prepared CdTe samples were then purified and dried. Then, 0.5 mmol of ZnSO4, 25 mg of the purified CdTe QDs, and 1.6 mmol of MPA were added to a 100 mL three-necked flask. The pH of the mixture was adjusted to 11.4 using 1 mol/L NaOH. Then, 0.5 mmol Na2S solution was transferred into the flask. The mixture was refluxed at 100°C. The CdTe/ZnS core/shell QDs were precipitated using methanol and then dried under vacuum after centrifugation.
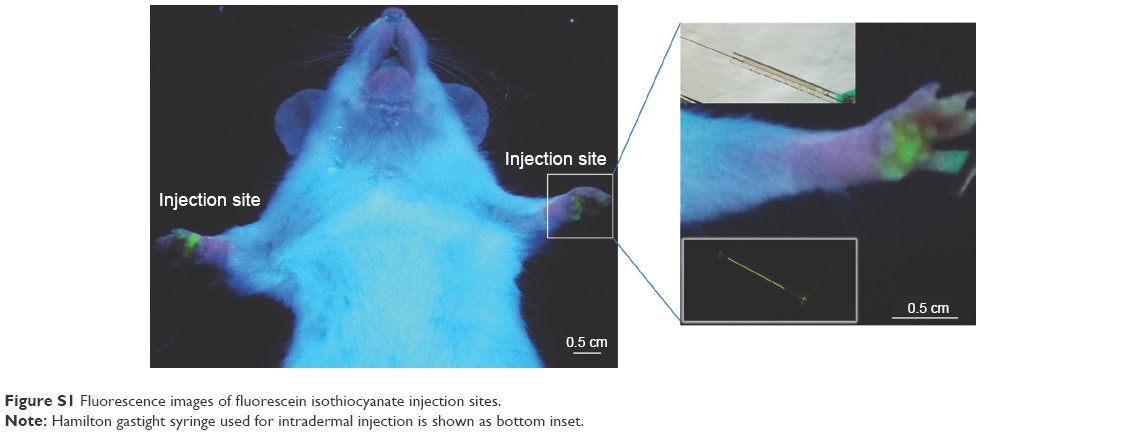 | Figure S1 Fluorescence images of fluorescein isothiocyanate injection sites. |
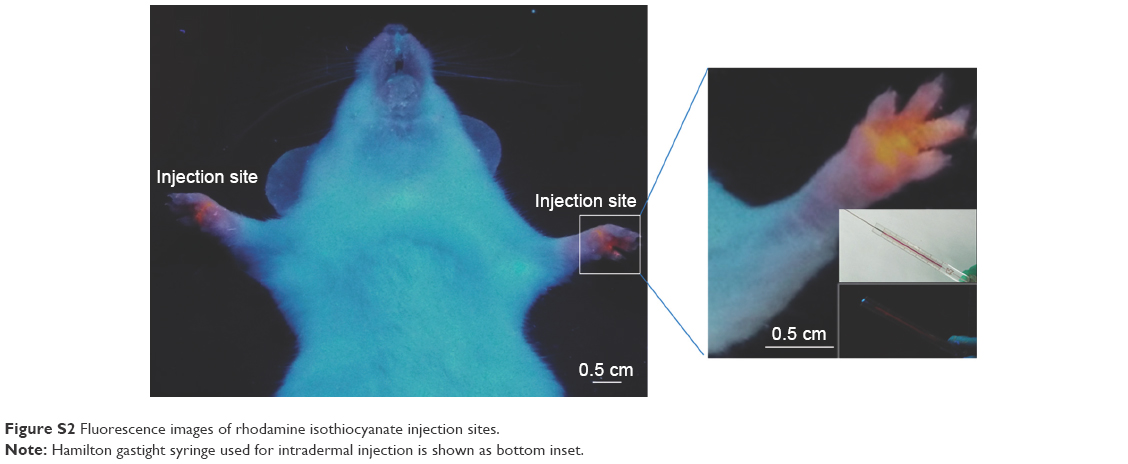 | Figure S2 Fluorescence images of rhodamine isothiocyanate injection sites. |
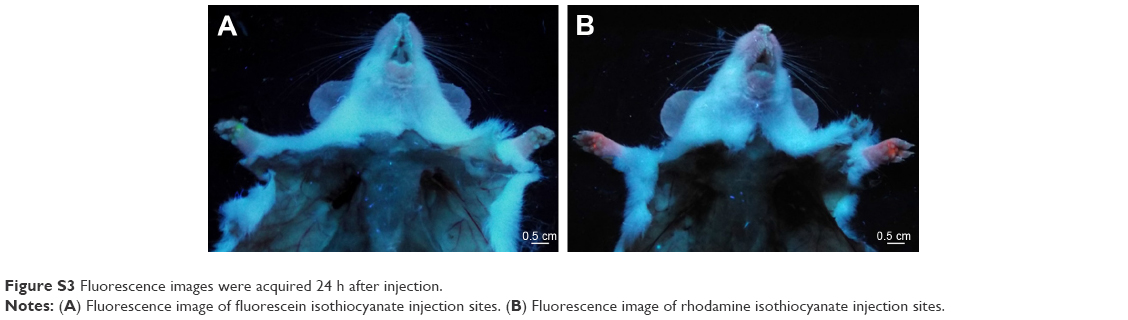 | Figure S3 Fluorescence images were acquired 24 h after injection. |
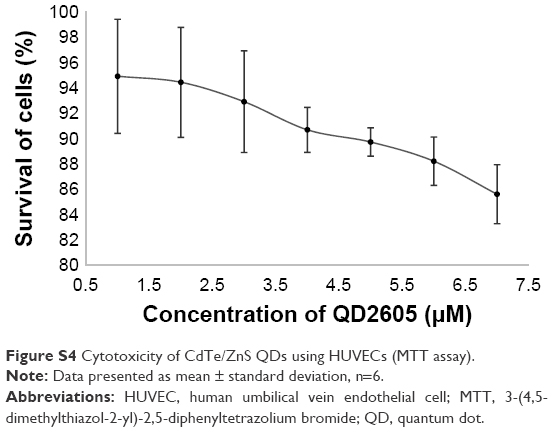 | Figure S4 Cytotoxicity of CdTe/ZnS QDs using HUVECs (MTT assay). |
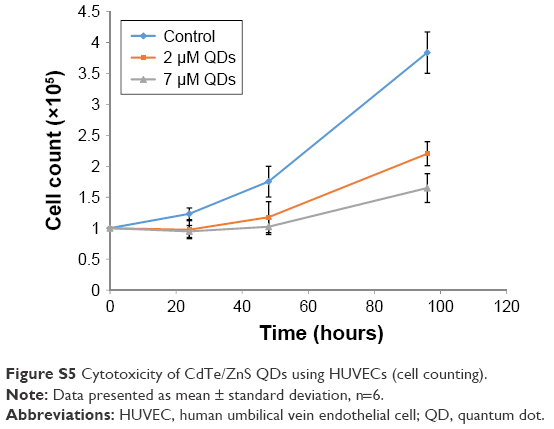 | Figure S5 Cytotoxicity of CdTe/ZnS QDs using HUVECs (cell counting). |
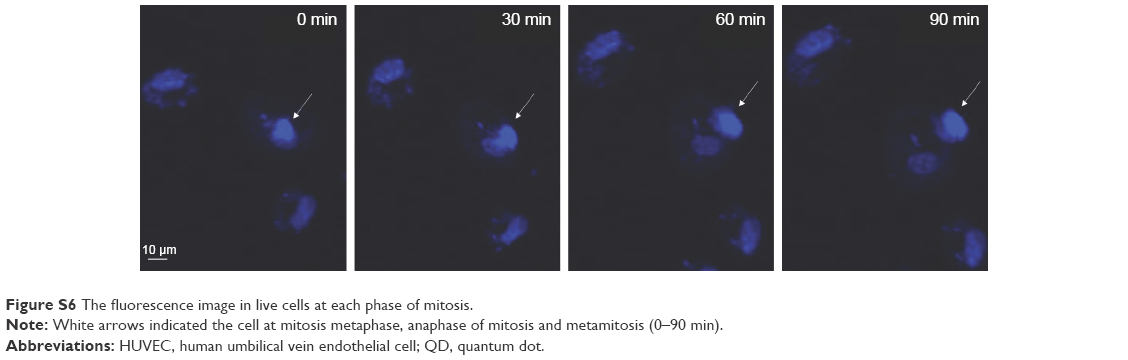 | Figure S6 The fluorescence image in live cells at each phase of mitosis. |
References
Hai NN, Chinh VD, Thuy UTD, et al. Detection of the pesticide by functionalised quantum dots as fluorescence-based biosensor. Key Eng Mater. 2012;495:314–318. | ||
Pazhanivel T, Nataraj D, Devarajan VP, Mageshwari V, Senthil K, Soundararajan D. Improved sensing performance from methionine capped CdTe and CdTe/ZnS quantum dots for the detection of trace amounts of explosive chemicals in liquid media. Anal Methods. 2013;5:910–916. |
 © 2017 The Author(s). This work is published and licensed by Dove Medical Press Limited. The full terms of this license are available at https://www.dovepress.com/terms.php and incorporate the Creative Commons Attribution - Non Commercial (unported, v3.0) License.
By accessing the work you hereby accept the Terms. Non-commercial uses of the work are permitted without any further permission from Dove Medical Press Limited, provided the work is properly attributed. For permission for commercial use of this work, please see paragraphs 4.2 and 5 of our Terms.
© 2017 The Author(s). This work is published and licensed by Dove Medical Press Limited. The full terms of this license are available at https://www.dovepress.com/terms.php and incorporate the Creative Commons Attribution - Non Commercial (unported, v3.0) License.
By accessing the work you hereby accept the Terms. Non-commercial uses of the work are permitted without any further permission from Dove Medical Press Limited, provided the work is properly attributed. For permission for commercial use of this work, please see paragraphs 4.2 and 5 of our Terms.