")
Back to Journals » Breast Cancer: Targets and Therapy » Volume 13
In vitro to Clinical Translation of Combinatorial Effects of Doxorubicin and Abemaciclib in Rb-Positive Triple Negative Breast Cancer: A Systems-Based Pharmacokinetic/Pharmacodynamic Modeling Approach
Authors Fleisher B, Lezeau J, Werkman C, Jacobs B, Ait-Oudhia S
Received 21 November 2020
Accepted for publication 19 January 2021
Published 18 February 2021 Volume 2021:13 Pages 87—105
DOI https://doi.org/10.2147/BCTT.S292161
Checked for plagiarism Yes
Review by Single anonymous peer review
Peer reviewer comments 2
Editor who approved publication: Professor Pranela Rameshwar
Brett Fleisher,1 Jovin Lezeau,1 Carolin Werkman,1 Brehanna Jacobs,1 Sihem Ait-Oudhia2
1Center for Pharmacometrics and Systems Pharmacology, Department of Pharmaceutics, College of Pharmacy, University of Florida, Orlando, Florida, USA; 2Quantitative Pharmacology and Pharmacometrics (QP2), Merck & Co, Inc, Kenilworth, New Jersey, USA
Correspondence: Sihem Ait-Oudhia
Merck & Co, Inc, Kenilworth, New Jersey, USA
Email [email protected]
Background: Doxorubicin (DOX) and its pegylated liposomal formulation (L_DOX) are the standard of care for triple-negative breast cancer (TNBC). However, resistance to DOX often occurs, motivating the search for alternative treatment approaches. The retinoblastoma protein (Rb) is a potential pharmacological target for TNBC treatment since its expression has been associated with resistance to DOX-based therapy.
Methods: DOX (0.01– 20 μM) combination with abemaciclib (ABE, 1– 6 μM) was evaluated over 72 hours on Rb-positive (MDA-MB-231) and Rb-negative (MDA-MB-468) TNBC cells. Combination indices (CI) for DOX+ABE were calculated using Compusyn software. The TNBC cell viability time-course and fold-change from the control of phosphorylated-Rb (pRb) protein expression were measured with CCK8-kit and enzyme-linked immunosorbent assay. A cell-based pharmacodynamic (PD) model was developed, where pRb protein dynamics drove cell viability response. Clinical pharmacokinetic (PK) models for DOX, L_DOX, and ABE were developed using data extracted from the literature. After scaling cancer cell growth to clinical TNBC tumor growth, the time-to-tumor progression (TTP) was predicted for human dosing regimens of DOX, ABE, and DOX+ABE.
Results: DOX and ABE combinations were synergistic (CI< 1) in MDA-MB-231 and antagonistic (CI> 1) in MDA-MB-468. The maximum inhibitory effects (Imax) for both drugs were set to one. The drug concentrations producing 50% of Imax for DOX and ABE were 0.565 and 2.31 μM (MDA-MB-231) and 0.121 and 1.61 μM (MDA-MB-468). The first-orders rate constants of abemaciclib absorption (ka) and doxorubicin release from L_DOX (kRel) were estimated at 0.31 and 0.013 h− 1. Their linear clearances were 21.7 (ABE) and 32.1 L/h (DOX). The estimated TTP for intravenous DOX (75 mg/m2 every 21 days), intravenous L_DOX (50 mg/m2 every 28 days), and oral ABE (200 mg twice a day) were 125, 31.2, and 8.6 days shorter than drug-free control. The TTP for DOX+ABE and L_DOX+ABE were 312 days and 47.5 days shorter than control, both larger than single-agent DOX, suggesting improved activity with the DOX+ABE combination.
Conclusion: The developed translational systems-based PK/PD model provides an in vitro-to-clinic modeling platform for DOX+ABE in TNBC. Although model-based simulations suggest improved outcomes with combination over monotherapy, tumor relapse was not prevented with the combination. Hence, DOX+ABE may not be an effective treatment combination for TNBC.
Keywords: phosphorylated retinoblastoma protein, clinical prediction, drug-drug interaction, time-to-tumor Progression, nonlinear mixed effect modeling
Introduction
Triple-negative breast cancer (TNBC), as defined by the lack of the three hallmark receptors (estrogen receptor (ER), progesterone receptor (PR), and human epidermal growth factor receptor 2 (HER2))1 tends to be more aggressive than other BC subtypes.2,3 Clinical biomarkers validated by the US Food and Drug Administration (FDA) for predicting the clinical outcome of TNBC patients’ subpopulations to a specific therapy are not currently available in the clinic.4 Because of the lack of FDA-approved targeted therapy for TNBC, the anthracycline, doxorubicin (DOX), is the mainstay of treatment.5–7 However, DOX-based therapy is limited due to life-threatening cardiotoxicities8 in addition to the emergence of drug-resistance in TNBC.7 The pegylated liposomal formulation of DOX (L_DOX) improves the efficacy-toxicity tradeoff by reducing the peak-to-trough fluctuations of unencapsulated DOX in the plasma.9 L_DOX accumulates in the highly vascularized tumor tissue and slowly releases unencapsulated DOX within the tumor,10 thus localizing cytotoxicity at the tumor site and reducing myocardial toxicity.11
DOX acts as an intercalant agent into the DNA, where it induces DNA damage by forming a covalent bond between topoisomerase II and DNA.12 The effectiveness of DOX in TNBC decreases over time due to the emergence of resistance,7 necessitating improved therapy. The retinoblastoma protein (Rb) signaling pathway has been suggested as a potential pathway involved in patients‘ resistance to DOX chemotherapy.13 One proposed mechanism of resistance is that in response to DNA-damage, the tumor cells upregulate mitogenic signaling proteins to increase the expression of the cyclin D-CDK4/6 complex as well as the phosphorylate Rb (pRb) protein.14–16 The latter will dissociate from the E2F transcription factor, hence allowing for cancer cells to transition from G1 to S phase, and subsequently for cell cycle progression.17 The addition of a CDK4/6 inhibitor is postulated to prevent Rb-mediated resistance to DOX, but the clinical benefit of this combination is unclear.18–21
Pharmacokinetic/pharmacodynamic (PK/PD) modeling has been previously used to capture Rb-mediated tumor growth and to, ultimately, simulate the tumor response after exposure to novel therapeutics.22 Poor outcomes in TNBC patients after being treated with current chemotherapy treatment strategies7,23 warrant the search for targeted therapeutic combinations. This study aimed to explore the clinical benefit of combining abemaciclib (ABE), a potent CDK4/6 inhibitor with DOX in Rb-positive TNBC, using an extended PK/PD modeling approach. The nature of ABE+DOX interaction (synergism, additivity, or antagonism) was examined first in vitro on Rb-positive (MDA-MB-231) and Rb-negative (MDA-MB-468) TNBC cells.18 Next, an in vitro cell-based PD model was developed to characterize the concentration-dependent and time-dependent relationships between drugs and pRb-mediated cell proliferation in MDA-MB-231, which was scaled-up from an in vitro growth setting to a clinical solid tumor growth setting. Finally, clinical PK models for DOX, L_DOX, and ABE were developed and integrated into a final “humanized“ systems-based PD model. The latter served as an in silico simulation platform to predict patients’ outcomes for the proposed combination. The developed systems-based PK/PD modeling approach serves as a proof-of-concept in silico simulation tool. Its use was explored using the optimized dosing regimen for ABE given alone and/or in combination with DOX or L_DOX to Rb-positive TNBC patients.
Materials and Methods
Cell Culture and Reagents
MDA-MB-231 and MDA-MB-468 were purchased from American Type Culture Collection (Manassas, VA, USA). Cells were maintained in Dulbecco’s Modified Eagle Medium (DMEM) containing 10% sterile filtered fetal bovine serum (FBS, Sigma-Aldrich, Saint Louis, MO, USA) and 1% penicillin/streptomycin. The cells were cultured at 37°C in a 5% CO2 incubator. DOX (99.69% purity) and ABE (99.82% purity) were both supplied from Selleck Chemicals LLC (Houston, TX, USA). Stock solutions of 30 mM DOX and employing mM ABE were prepared in Millipore water and stored as 20 μL aliquots at −80°C.
Cell Growth Inhibition Assay
Cells were seeded in 96-well plates at a density of 2 × 10³ cells/well in three replicates. Cells were allowed to adhere overnight at 37°C and 5% CO2. Cells were then exposed over 72 hours to a range of concentrations of DOX (0.01–20 μM) or ABE (0.1–20 μM). The relative cell density was measured using the Cell Counting Kit-8 assay (CCK-8; Sigma-Aldrich, Saint Louis, MO, USA). Briefly, after the desired length of drug exposure, cells were incubated with CCK-8 (10% dilution in 10% FBS DMEM) for 1 hour at 37°C, and absorbance was measured at 450 nm using the Epoch microplate reader (BioTek, Winooski, VT, USA). The percent cell viability was calculated by dividing the absorbance of each treatment by the absorbance of cells grown in the drug-free medium at respective time points. In vitro growth inhibition assay was performed twice for each cell line and treatment. The resulting data were pooled and presented as mean ± SEM.
Concentration-Effect Relationships for Single Agents
The measured percent cellular viabilities of each cell lines versus DOX, ABE, and their combination was modeled using a sigmoidal Hill inhibitory function such as:
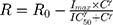
where R represents the percentage (%) of viable cells. R0 is the % cell viability at a time equal to 0. Imax is the maximum drug inhibitory effect, which was fixed to 1 since, at high concentrations, both agents led to ~100% killing of cancer cells. IC50 is the drug concentration that produces half the Imax, γ is the Hill coefficient, and C is the drug’s concentration. The parameters IC50 and γ were estimated using GraphPad Prism Version 5 and determined as means ± % residual standard error (%RSE)
Drugs Combinatorial Effect
Cells were seeded in triplicate wells in 96-well plates at a seeding density of 2 × 10³ cells/well. Cells were allowed to adhere overnight in the cell culture medium. Four treatment arms were examined: 1) control treatment arm where cells were seeded in cell culture devoid of drug, 2) ABE treatment arm at concentrations ranging at 1–6 μM in MDA-MB-231 and at 1–2.5 μM in MDA-MB-468, 3) DOX treatment arm at its IC50 of 0.565 and 0.121 μM in MDA-MB-231 and MDA-MB-468, and 4) combination of ABE+DOX at their respective IC50. The cellular absorbance was measured at 450 nm and normalized using the method described in the Cell Growth Inhibition Assay section. The analysis was run in duplicate. The overall nature of interaction for DOX at its IC50 and ABE concentrations after 72 hours of exposure was determined by calculating the Combination Index (CI) using CompuSyn software. The fractional inhibition (Fa = 100 – (% cell viability)/100), which represents the relative inhibition potency of a reversible inhibitor to the target, served as inputs for Compusyn.24,25 The supplementary Figure S1 depicts the calculated mean Fa ± SEM for DOX (0.1–20 µM for MDA-MB-231 and 0.01–20 µM for MDA-MB-468), ABE (1–6 µM and 1–2.5 µM), and DOX IC50 with ABE.
Cell Viability Time-Course
Cells were seeded in triplicate wells using 96-well plates at a seeding density of 2 × 10³ cells/well. Cells adhered overnight and were exposed to media devoid of the drug (Control), ABE at 2 μM in MDA-MB-231, DOX at its IC50 of 0.565 μM, or combination of ABE (2 μM) + DOX (0.565 μM). Concentrations preparation was described in the Drugs Combinatorial Effect section, and absorbance was measured using the method described in the Cell Growth Inhibition Assay section. The cellular absorbances at each time point for each treatment arms were normalized to the ones of the respective treatment arms at time zero.
Total Cell Protein Extraction for Western Blotting and Enzyme-Linked Immunosorbent Assay
Cells were seeded at a seeding density of 3 × 10⁵ cells/well in 6-well plates. Cells were allowed to adhere overnight in a cell culture medium devoid of drug. Then, cells were exposed to drugs or fresh medium alone for 72 hours. Sampling times included 0, 1, 3, 6, 12, 24, 48, 72 hours post-treatment. At each time point, floating and adherent cells were collected via trypsinization, pooled, centrifuged at 900 rpm for 4 minutes, and washed with PBS. Cells were suspended in 75 μL ice-cold Milliplex® MAP Lysis Buffer supplemented with protease/phosphatase inhibitor, then shaken for 10 minutes at 4°C, and finally incubated on ice for 10 minutes. Lysed cells were centrifuged at 10,000 G for one minute, and then the supernatant was collected, aliquoted, and stored at −80°C. The total cellular protein concentration was measured using the Bicinchoninic Acid (BCA) Protein Assay Kit (Thermo Fisher Scientific Inc., Waltham, Massachusetts USA).
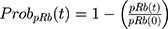
The Fold Change in pRb Over Time
The expression of pRb (Ser780) protein in Rb-positive (MDA-MB-231) and Rb-negative (MDA-MB-468) cells was confirmed by Western blot method. Briefly, the primary antibodies used were anti-phospho-Rb (Ser780) (D59B7) and GAPDH (2118S). The secondary antibody used was the anti-rabbit HRP-linked IgG (7074S; Cell Signaling, Danvers, Massachusetts, USA). Both primary and secondary antibodies were diluted 1000-fold in phosphate-buffered saline with tween (PBST; 9809S; Cell Signaling Technologies, Danvers, Massachusetts, USA). Approximately 30 µg of total protein was loaded per lane of 12% MP TGX Stain-Free Gel and transferred onto trans-Blo Turbo Mini Polyvinylidene fluoride (PVDF; Bio-Rad, Hercules, California, USA) membrane. The PVDF membrane was blocked using 5% non-fat dry milk in 1x PBST for 60 minutes at room temperature. The membrane was incubated with primary antibodies overnight with gentle agitation at 4°C, washed with PBST, and incubated with secondary antibody for 1 hour at room temperature. Blots were imaged using Chemiluminescence (ECL; Bio-Rad, Hercules, California, USA). The time-course expression of pRb protein was measured in MDA-MB-231 after exposure to control (medium devoid of drugs), DOX (0.565 µM), ABE (2 µM), and DOX (0.565 µM) with ABE (2 µM). The pRb protein expression over 0–72 hours at 0, 1, 3, 6, 12, 24, 48, 72 hours post-treatment was measured using the PathScan© phosphor-Rb (Ser780) Sandwich enzyme-linked immunosorbent assay kit (ELISA, Cell Signaling Technologies, Danvers, Massachusetts, USA). Samples were run in quadruplicate at a protein concentration of 60 ng/mL per well. Per the manufacturer’s protocol, samples were incubated overnight in pre-coated 96-well plates at 4°C. The next day, wells were incubated with the detection antibody at 37°C for one hour, incubated with HRP-Linked secondary antibody at 37°C for 30 minutes, and incubated with TMB substrate at room temperature for 30 minutes with washing between steps using 1x wash buffer. After the addition of the stop solution (number 7002, Cell Signaling Technologies, Danvers, Massachusetts, USA), the optic density (OD) from pRb protein absorbance at 450 nm was measured using an Epoch microplate reader (BioTek, Winooski, VT, USA). Fold change was calculated by dividing the OD of the control, DOX, ABE, or combination by the mean OD of the control at each time point. The observed data are presented as mean ± SEM. The fold change from control was calculated such as:
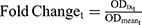
where ODtx_t is the measured OD for drug-exposed cells at tth sampling time, and ODmean_t is the mean OD for the control at tth sampling time. Fold change was used as a pharmacodynamic (PD) variable bridging between drug-exposure and downstream drug cell-killing effect in the cell-based PD model.
Cell-Based Pharmacodynamic Model
pRB Protein
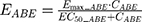
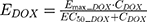
The final PD model representing the Rb pathway (Figure 1) is comprised of a series of transit compartments representing the pharmacological targets of DOX and ABE. The concentration-effects of DOX (EDOX) and ABE (EABE) are represented by using the following equations:
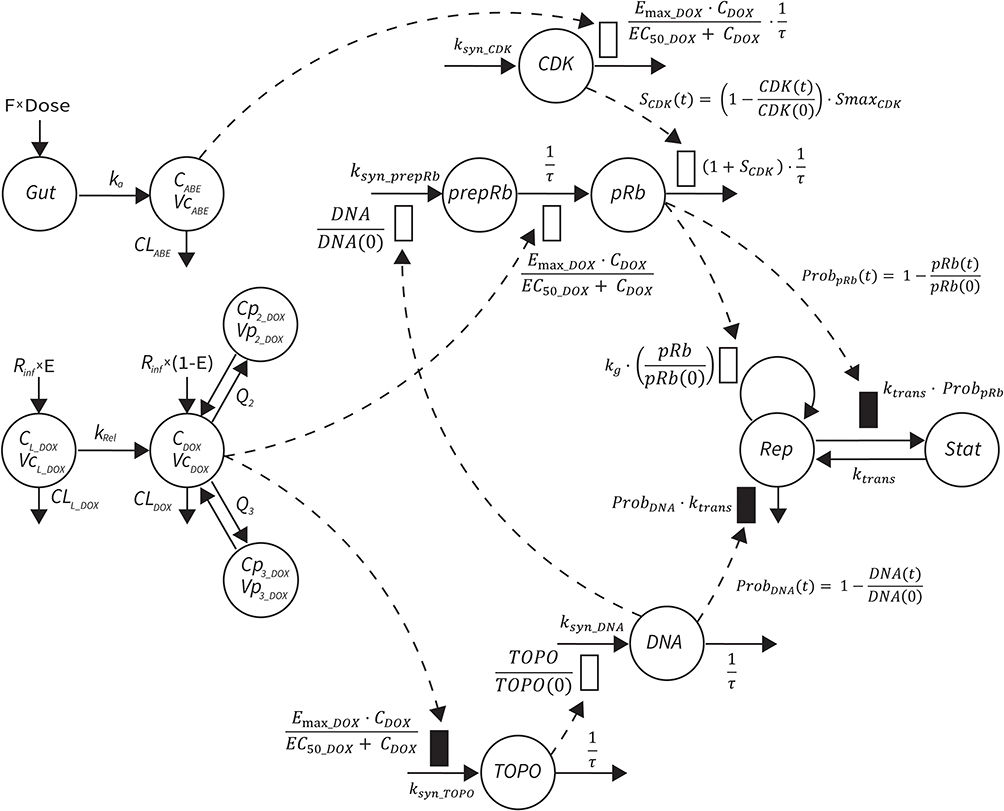 |
Figure 1 Systems-based PK/PD model for abemaciclib (ABE), doxorubicin (DOX), and pegylated liposomal DOX (L_DOX) in Rb-positive TNBC. A one-compartment model with first-order elimination and absorption rate constants best captured the PK of ABE, while a three-compartment model with linear elimination best described the PK of free DOX. An additional one compartmental model with a first-order release rate constant into the DOX central compartment best captured the PK of L_DOX. A series of compartments represent DOX and ABE targets, eg, topoisomerase II (TOPO) and cyclin-dependent kinase 4/6 (CDK). ABE stimulates the removal of pRb, whereas DOX influences pRb expression in addition to stimulating cell death. Abbreviations: CDOX, DOX concentration in the central compartment; Cp2, drug concentration in the first peripheral compartment; Cp3, drug concentration in the second peripheral compartment; CLABE, linear clearance (CL) for ABE from central compartment; CLL, CL of liposomal DOX via reticuloendothelial system; CLDOX, linear CL of DOX from the central compartment; DOSE, dose of drug; E, fraction of DOX in pegylated liposomal form; F, oral bioavailability; Gut, gut compartment; ka, first-order absorption rate constant; kg, first-order growth rate constant for cancer cell; kRel, first-order release rate constant; ksyn_CDK, zero-order production rate constant for CDK; ksyn_prepRb, zero-order production rate constant for the precursor pool of pRb (prepRb); ksyn_TOPO, zero-order production rate constant for TOPO; ProbDNA, the probability cell growth inhibition from decrease in functional DNA; ProbpRB, probability of cell stasis via pRb inhibition; Q2, intercompartmental CL between the central and the first peripheral compartments for DOX; Q3, intercompartmental CL between the central and the second peripheral compartments for DOX; Rinf, rate of drug infusion; τ, transit time between compartments; VcABE, central volume of distribution for ABE; VcDOX, central volume of distribution for DOX; VL, Vd of liposomal drug; Vp2, volume of distribution for the first peripheral compartment for DOX; Vp3, volume of distribution for the second peripheral compartment for DOX. |
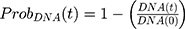
where Emax is the maximum drug effect, EC50 is the concentration of the drug allowing 50% of Emax, and C is the concentration of the drug. DOX forms an irreversible complex with Topoisomerase II (TOPO) and DNA. Covalently bound TOPO is unable to repair DNA, leading to strand breaks and apoptosis.12 DOX-induced TOPO inhibition and subsequent DNA damage (eg, reduction in functional DNA) are represented by the following equations:
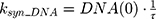
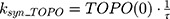
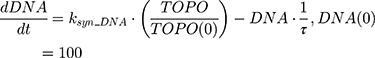
ksyn_TOPO and ksyn_DNA represent the rate of synthesis for TOPO and DNA. The initial conditions for each compartment are set to 100, maintaining a theoretical steady-state in the absence of the drug. τ is the transit between PD compartments. The effects of ABE and DOX converge on the Rb pathway. ABE inhibits cyclin-dependent kinase 4/6 (CDK), leading to a reduction in pRb.18 DOX exposure initially increases pRb, but DNA damage leads to a reduction in Rb-pathway activity26–28 and a delayed decrease in pRb. The CDK-pRb pathway is described using the following equations:
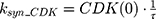
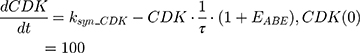
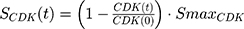
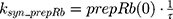
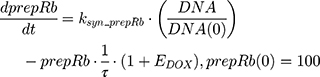
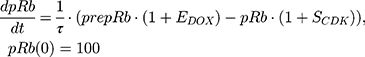
A precursor pool compartment (prepRb) was used to describe activity upstream of pRb. ksyn_CDK and ksyn_pRb are the zero-order production rate of the CDK and prepRb compartments. The lack of active CDK stimulates pRb loss (SCDK) by the maximum stimulation constant (SmaxCDK). The initial conditions for prepRb and pRb compartment are set to 100 because the pRb is normalized to control.
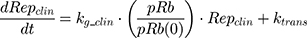
Cell Growth Inhibition Model
The in vitro killing of cancer cells was captured with the following equation:
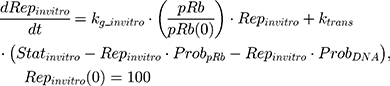
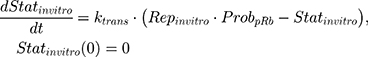

where kg_invitro is a first-order rate constant, which dictates in vitro cancer cell growth of the replicating cancer cells (Rep). ktrans is a first-order rate constant describing both the transit between Rep and static cancer cells (Statinvitro) and the death rate of replicating cells. The inhibition of functional DNA increases the probability of cell death (ProbDNA), and the lack of pRb increases the probability of stasis (ProbpRb). The sum of Rep and Stat cells equates to the total number of cells measured (Cellsinvitro). Because the total number of cells in the no-drug control exhibited log-phase growth, the initial values of Rep and Stat were set to 100 and 0, respectively.
Clinical PK Models
Source of Data
A literature search was conducted using Pubmed Central (PMC) and Google Scholar to collect the PK data for ABE and DOX. The criteria for selection for the source publications were: 1) the dosing and infusion time for intravenous (IV) formulation are specified; 2) the lower limit of quantification (LOQ) is defined for the measurement technique used; and 3) the plasma concentrations are provided as mean values. Plasma concentration-time course data for ABE,29 total DOX, free DOX, and L_DOX (Supplementary Table S1) were digitized using “GetData Graph Digitizer” (http://getdata-graph-digitizer.com).
PK Model Structures
The plasma concentration-time course data were obtained from the literature for ABE29 as well as for DOX, L_DOX, and total DOX (free DOX + DOX bound to plasma proteins) as summarized in Supplementary Table S1. Data were extracted using “GetData Graph Digitizer” (http://getdata-graph-digitizer.com). Noncompartmental analysis (NCA) using Phoenix software (Version 8.1, Certara, St. Louis, MO USA) was employed to determine the initial PK parameters, and nonlinear mixed-effects modeling (NLME) was used to estimate the parameters typical values as well as the between-study variability (BSV) and residual variability (RV). An internal model qualification strategy was adopted through graphical and numerical inspections by generating visual predictive checks (VPCs) and 95th bootstrap confidence intervals from 1000 simulated individuals.
PK Model for ABE
The absolute clearance (CLABE) parameter was calculated by multiplying the oral bioavailability (F) as published by the FDA30 by the apparent clearance generated (CL0) generated from the non-compartmental analysis. Then, CLABE was multiplied by mean residence time (MRT) from NCA to calculate the volume of distribution (VdABE). The PK of ABE was described using a one-compartment model with a first-order absorption process as follows:

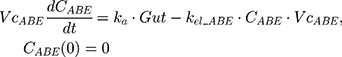
The tablet formulation of ABE is administered into a Gut compartment where bioavailability F governs the extent of the drug entering the plasma. The transit of ABE through the GI tract is characterized by the first-order absorption constant, ka. CABE is the estimated concentration of ABE in the central compartment, and VcABE is the volume of distribution of ABE in the central compartment. The elimination of ABE from the central compartment is characterized by the first-order rate constant, kel_ABE. The apparent CLABE and VdABE derived from NCA and served as the initial parameter estimates for model fitting. kel_ABE was calculated from CLABE and VcABE: 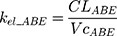 .
.
PK Model for DOX
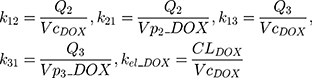
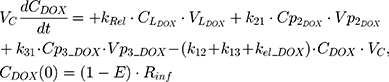
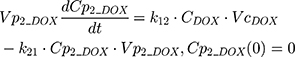
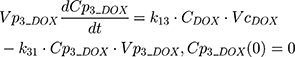
The PK of an intravenous (IV) bolus infusion of DOX was described using a three-compartment model with the following equations:
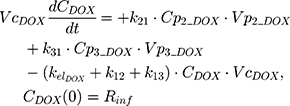
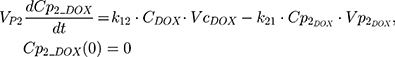
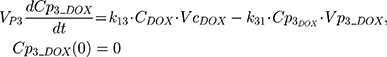
The clinical dosing scenarios were simulated at 60 and 75 mg/m2 IV bolus infusion of DOX over 15 minutes.31,32 The average BSA of 1.71 m2 reported from a previously published clinical study in breast cancer patients32 was used to calculate the DOX amount (mg). CDOX, Cp2, and Cp3 represent drug amounts in the central and two peripheral compartments; kel_DOX is the first-order elimination rate constant of DOX from the central compartment; k12, k21, k13, k31 are first-order inter-compartmental transfer rate constants; VcDOX, Vp2, and Vp3 represent the volumes of distribution in the central and two peripheral compartments. The first-order rate constants were calculated from CLDOX, inter-compartmental clearances Q2 and Q3, and volumes of distributions:
PK for Liposomal DOX
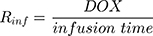
An additional compartment was added to the PK model of DOX to account for the slow release of DOX from the liposome nanocarrier, such as:
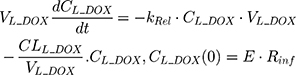
Rinf is the zero-order infusion rate of L_DOX. E represents the fraction of L_DOX in the pegylated liposomal form.33,34 The clinical dosing of 50 mg/m2 of L_DOX over a 1-hour infusion time is based on the approved dosing for L_DOX administration to metastatic breast cancer patients.11 The rate of L_DOX eliminated via the reticuloendothelial system (RES, CLL_DOX) was fixed to zero due to the slow uptake of the L_DOX formulation by RES.33 L_DOX was subsequently released to DOX via the first-order rate constant, kRel. Parameters describing the PK of DOX were previously described (PK Model for DOX section). Total DOX was described as the sum of DOX (ie, DOX not encapsulated within the pegylated liposomal formulation) and L_DOX in the PK model. DOX and ABE concentrations were further converted into micromolar concentrations based on their published molecular weights and then converted into unbound concentrations (Cunbound) in plasma by multiplying the concentration of the drug by the fraction of drug unbound to protein (fu) obtained from the FDA reviews.30,35 Cunbound of ABE and DOX in the central compartments served as input for the translational growth model.
Clinical Translation of in vitro Growth Model
A clinical growth model was translated from the in vitro model previously described. Assuming that the growth rate of a tumor is proportional to that of an in vitro cell culture, kgclin as published by Kay et al36 was applied to in vitro growth model to estimate clinical TNBC tumor growth (Cellsclin):
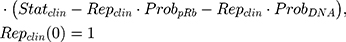
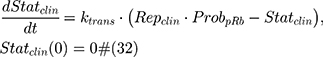

where Repclin and Statclin represent replicating and static tumor cells, and the sum of both represents the total tumor size (Cellsclin).
Time-to-Tumor Progression (TTP)
The Response Evaluation Criterion in Solid Tumors (RECIST) and the World Health Organization (WHO) criterion define time-to-disease progression (TTP) as the amount of time for a tumor to increase in diameter by 20% and 25%.37,38 As published by Kay et al,36 a spherically shaped tumor volume (V) would meet TTP as defined by RECIST (20%) and WHO (25%) criteria of TTP when V increases by 1.73 and 1.95 times the baseline assuming spherical geometry. The diameter (D) of the tumor at baseline (ie, time=0) was set to 1 cm for ease of calculations. Clinical regimens of IV DOX at 65 or 75 mg/m2 once every 21 days (q21d), L_DOX at 50 mg/m2 once every 28 days (q28d), and oral ABE at 150 or 200 mg twice daily (BID) were simulated alone and in combination over a treatment duration of 60 days using the final clinically translated model (Equation 33).
Data Analysis
In vitro Cell-Based Model
Mathematical modeling was performed using the Simbiology® toolbox in MATLAB® (version R2019a, Mathworks Inc., Natick, Massachusetts, USA). Parameter fitting was conducting using the first-order conditional estimation method (FOCE) within the Statistics and Machine learning Toolbox™ in MATLAB®. The cell growth parameter, kginvitro, was estimated for the in vitro time-course %cell viability measurements in the control arm and fixed for drug treatment arms. The %cell viability reduction under ABE treatment occurs primarily through the change in pRb.17,39 Conversely, the %cell viability reduction under DOX treatment occurred through the inhibition of cancer cell growth and the stimulation of cancer cells' cytotoxicity.12,18 ECmaxDOX was set to 1 because of the high-affinity binding between DOX and TOPO,40 and EmaxABE was fixed to 20 because ABE quickly reduces CDK4/6 expression.17 After local sensitivity analysis was conducted, τ was fixed to 20 hr, or approximately half the doubling time of MDA-MB-231, to improve the accuracy of the parameter estimations. Model parameters were fit simultaneously to pRb fold-change time-course data (Figure 4B) and %cell viability (Figure 4C) using a combined additive and proportional residual error model.41
Clinical PK Models
Due to the observed variability in the PK data, nonlinear mixed effect modeling (NONMEM) approach was employed using Phoenix WinNonlin software (Version 8.1, Certara, St. Louis, MO USA). The parameters were estimated using the first-order conditional estimation method. The hierarchical model structure was evaluated by examining the minimization of the objective function value (OFV), visual inspection of the goodness-of-fit plots (eg, conditional weighted residuals (CWRES) vs time; observation (DV) vs individual predictions (IPRED) (Supplementary Figure S3), and visual predictive checks (VPC) (Supplementary Figure S4)). The interindividual variability (IIV) was described using an exponential error model. PK parameters were estimated using a proportional residual error model.41
Results
The final developed systems-based PK/PD model is depicted in Figure 1.
Greater Resistance to DOX and ABE in Rb-Positive Than Rb-Negative TNBC Cells
Increasing DOX and ABE concentrations decrease %cell viability in both TNBC cell lines, the Rb-positive, MDA-MB-231, and Rb-negative, MDA-MB-468 (Figure 2). The IC50 of DOX is approximately 4-fold higher in MDA-MB-231 than MDA-MB-468 (0.565 vs 0.121 μM) (Table 1), demonstrating that MDA-MB-231 is more resistant to DOX than MDA-MB-468. An increase in ABE concentration from 0.1 to 20 μM decreased the mean %cell viability from approximately 100% to 0% in both cell lines. This result indicates that ABE induces cytotoxicity in both Rb-positive and Rb-negative TNBC. The IC50 for ABE in MDA-MB-231 and MDA-MB-468 were 1.61 and 2.31 μM, suggesting that MDA-MB-231 being slightly less sensitive to ABE than MDA-MB-468.
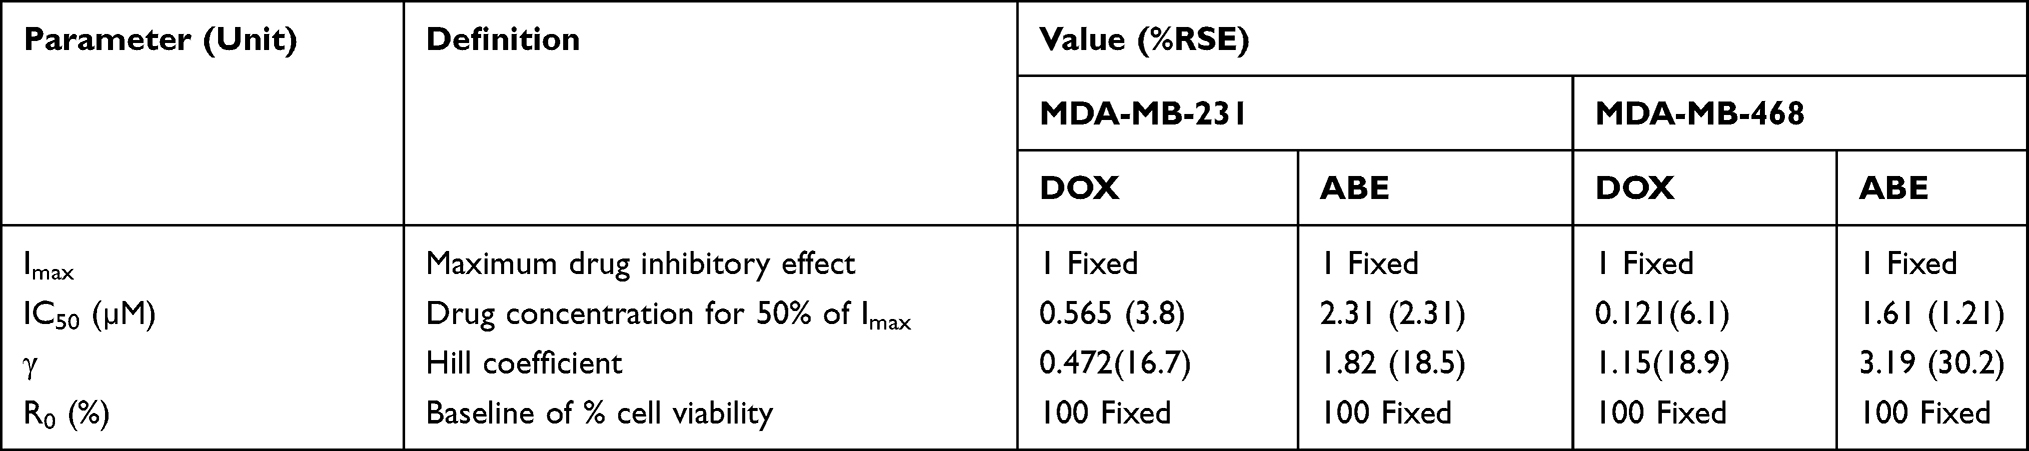 |
Table 1 Model Estimated Parameters for the Concentration–Effect Relationships of Single Agents. Parameters are Reported as Mean Values and Precisions are Reported as the % Residual Standard Error (%RSE) |
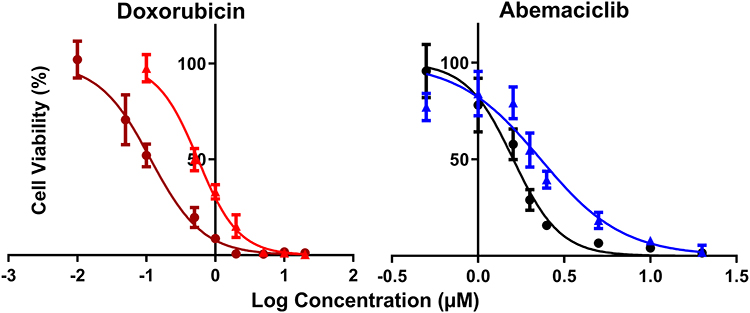 |
Figure 2 Model fittings of the concentration-effect relationships for single agents in TNBC cell lines, MDA-MB-231 (doxorubicin: red, abemaciclib: blue) and MDA-MB-468 (doxorubicin: dark red, abemaciclib: black). Symbols represent the mean of observed data (n=6), and bars represent the standard errors on the means (SEM). Lines represent model predictions. |
DOX and ABE Combinatorial Effects are Synergistic in Rb-Positive but Not Rb-Negative TNBC Cells
The combinatorial effects of DOX with ABE were evaluated at drug concentrations corresponding to the IC50 for DOX (0.565 μM in MDA-MB-231 or 0.121 μM in MDA-MB-468)and for ABE (1–6 μM in MDA-MB-231 or 1–2.5 μM in MDA-MB-468). In MDA-MB-231 cells, the interaction between DOX and ABE was synergistic with calculated combination indices (CI) at values below 1 for all tested regimens (Figure 3). This result indicates a synergistic interaction between DOX and ABE (CI<1) at killing Rb-positive TNBC cells. The greatest synergistic combination (ie, smallest CI=0.48) was observed at concentrations of 2 μM for ABE with 0.565 μM for DOX. In contrast, DOX interaction with ABE in MDA-MB-468 is antagonistic for all tested regimens, as determined by the calculated CI values higher than 1. This result indicates that DOX and ABE act oppositely at killing Rb-positive TNBC cells.
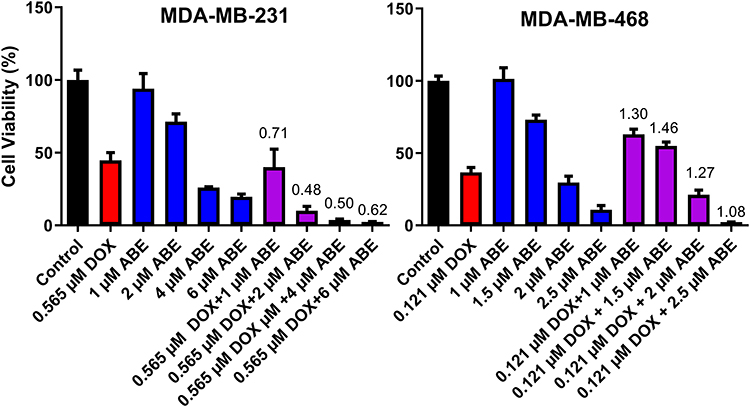 |
Figure 3 % Cell viability of MDA-MB-231 and MDA-MB-468 cells normalized to cell culture medium devoid of a drug (Control, black) after 72 hours of exposure to doxorubicin (DOX, red), abemaciclib (ABE, blue), or DOX+ABE (purple) at their respective concentrations. Each bar represents the mean of observed data (n=6) ± standard error on the mean (SEM). Numerical values of combination indices (CI) calculated for the various concentrations of DOX+ABE combinations are recorded above respective bars. |
PD Model for pRb and Cancer Cell Growth Inhibition
The pRb protein served as a surrogate biomarker for cancer cell cycle proliferation in Rb-positive TNBC.17 The results from the Western blot analysis confirmed the presence and absence of pRb in MDA-MB-231 and MDA-MB-468 (Supplementary Figure S2). Exposure to DOX and ABE over 72 hours reduced pRb expression in MDA-MB-231 (Figure 4A). The temporal changes in the %cell viability and pRb dynamics using the MDA-MB-231 cells were used to develop the systems-based model linking pRb-expression with the in vitro cancer cell growth. The results from the ELISA in MDA-MB-231 cells revealed that ABE decreased pRb protein expression to 25% from the control arm within 24 hours of exposure. DOX exposure initially increased the pRb protein expression over the first 24 hours by 20%, then decreased it to approximately 65% from the control arm after 72 hours of exposure (Figure 4B). The pRb protein expression time-course profiles following the combination of ABE+DOX showed a similar trend as for the ABE treatment arm during the initial 24 hours of exposure, then reduced the pRb protein expression relative to the control to 11% after 72 hours of exposure. Upon visual inspection, the trend of pRb observed data as well as the % cell viability time-course data were captured reasonably well (Figure 4C). Altogether these results indicate that the ABE+DOX combination resulted in improved suppression of pRb protein and an increase in cytotoxicity as compared to individual agents.
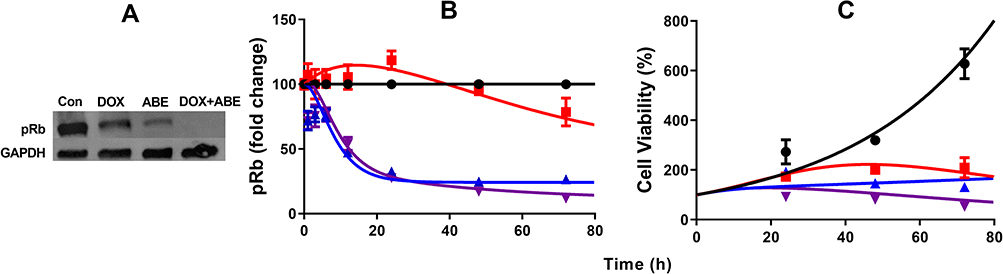 |
Figure 4 Time-course profiles of pharmacodynamic measurements in MDA-MB-231 cells. (A) Western blot image of phosphorylated retinoblastoma (pRb) protein and house keeping protein glyceraldehyde 3-phosphate dehydrogenase (GAPDH) after exposure to control (no-drug), 0.565 doxorubicin (DOX), 2µM abemaciclib (ABE), and combination (DOX+ABE) over 72 hours. (B) Fold-change from control in the expression of pRb over time measured using an ELISA assay kit. (C) % Cell viability over time for control (black), ABE at 2µM (blue), DOX at 0.565 2µM (red), and DOX+ABE (purple). Symbols represent the mean of observed data (n=3), while bars are the standard error on the mean (SEM), and the lines are model fittings. |
PK Models
The plasma concentration time-course profiles of DOX over a clinical range (25–75 mg/m2) of doses was captured well with a three-compartment model with linear elimination (Figure 5B). An additional one compartment representing the liposome nanocarrier for L_DOX from which DOX is released via a first-order release rate constant into the DOX central compartment captured well the PK of L_DOX in a clinical range of doses (10–50 mg/m2) (Figure 5C and 5D). Similarly, the PK of ABE was captured well with a one-compartment model with first-order absorption and elimination rate constants (Figure 5A).
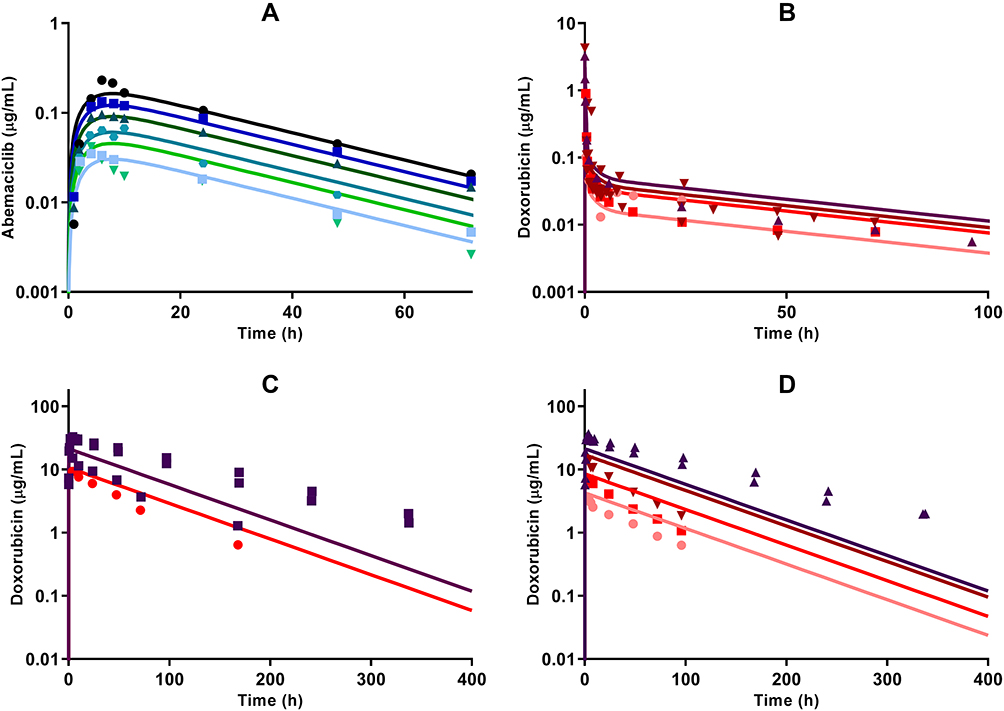 |
Figure 5 Clinical pharmacokinetic profiles of (A) abemaciclib (ABE) 50 mg (light blue square), 75 mg (green upside down triangle), 100 mg (green circle), 150 mg (green triangle), 200 mg (blue square), and 270 mg (black circle); (B) free doxorubicin (DOX) 25 mg/m2 (pink circle), 50 mg/m2 (red square), 60 mg/m2 (dark red upside down triangle), and 75 mg/m2 (brown triangle); (C) pegylated liposomal DOX (L_DOX) 25 mg/m2 (red circle) and 50 mg/m2 (brown square); and (D) total DOX 10 mg/m2 (pink circle), 20 mg/m2 (red square), 40 mg/m2 (dark red upside down triangle), and 50 mg/m2 (brown triangle). Symbols represent observed data extracted from literature for ABE,29 DOX, L_DOX, and total DOX (Table S1). Lines are model fittings. |
All model parameters for both PK models of DOX and ABE were estimated with reasonable precision and were consistent with bootstrap estimates as parameter values were determined within the 95% confidence interval (95% CI) of the mean bootstrap estimates (Table 2). The estimated plasma and inter-compartment clearances for DOX such as: CL, Q2, Q3 (62.4 L/hr, 50.7 L/hr, 28.4 L/hr) as well as the volumes of distribution such as: Vc, Vp2, Vp3 (0.17 L, 1699 L, 121.3 L) are similar to the published parameter estimates obtained using a similar NONMEM approach.42 Further, VL and kRel were 3.93 L and 0.013 hr−1, and are comparable to L_DOX parameters from previously reported values.9,10,43 Collectively, the final DOX model parameter estimates are consistent with values from the literature.42 Additionally, the goodness-of-fit plots in supplementary Figure S3 suggest an appropriate fit of data as no systematic deviations were observed for ABE (Figure S3A), DOX (Figure S3B), and L_DOX (Figure S3C and S3D). The visual predictive checks (VPC) of the final model in supplementary Figure S4 support the reasonable predictive capacity of our model to describe the plasma time-course data for ABE (Figure S4A), DOX (Figure S4B), and L_DOX (Figure S4C and S4D).
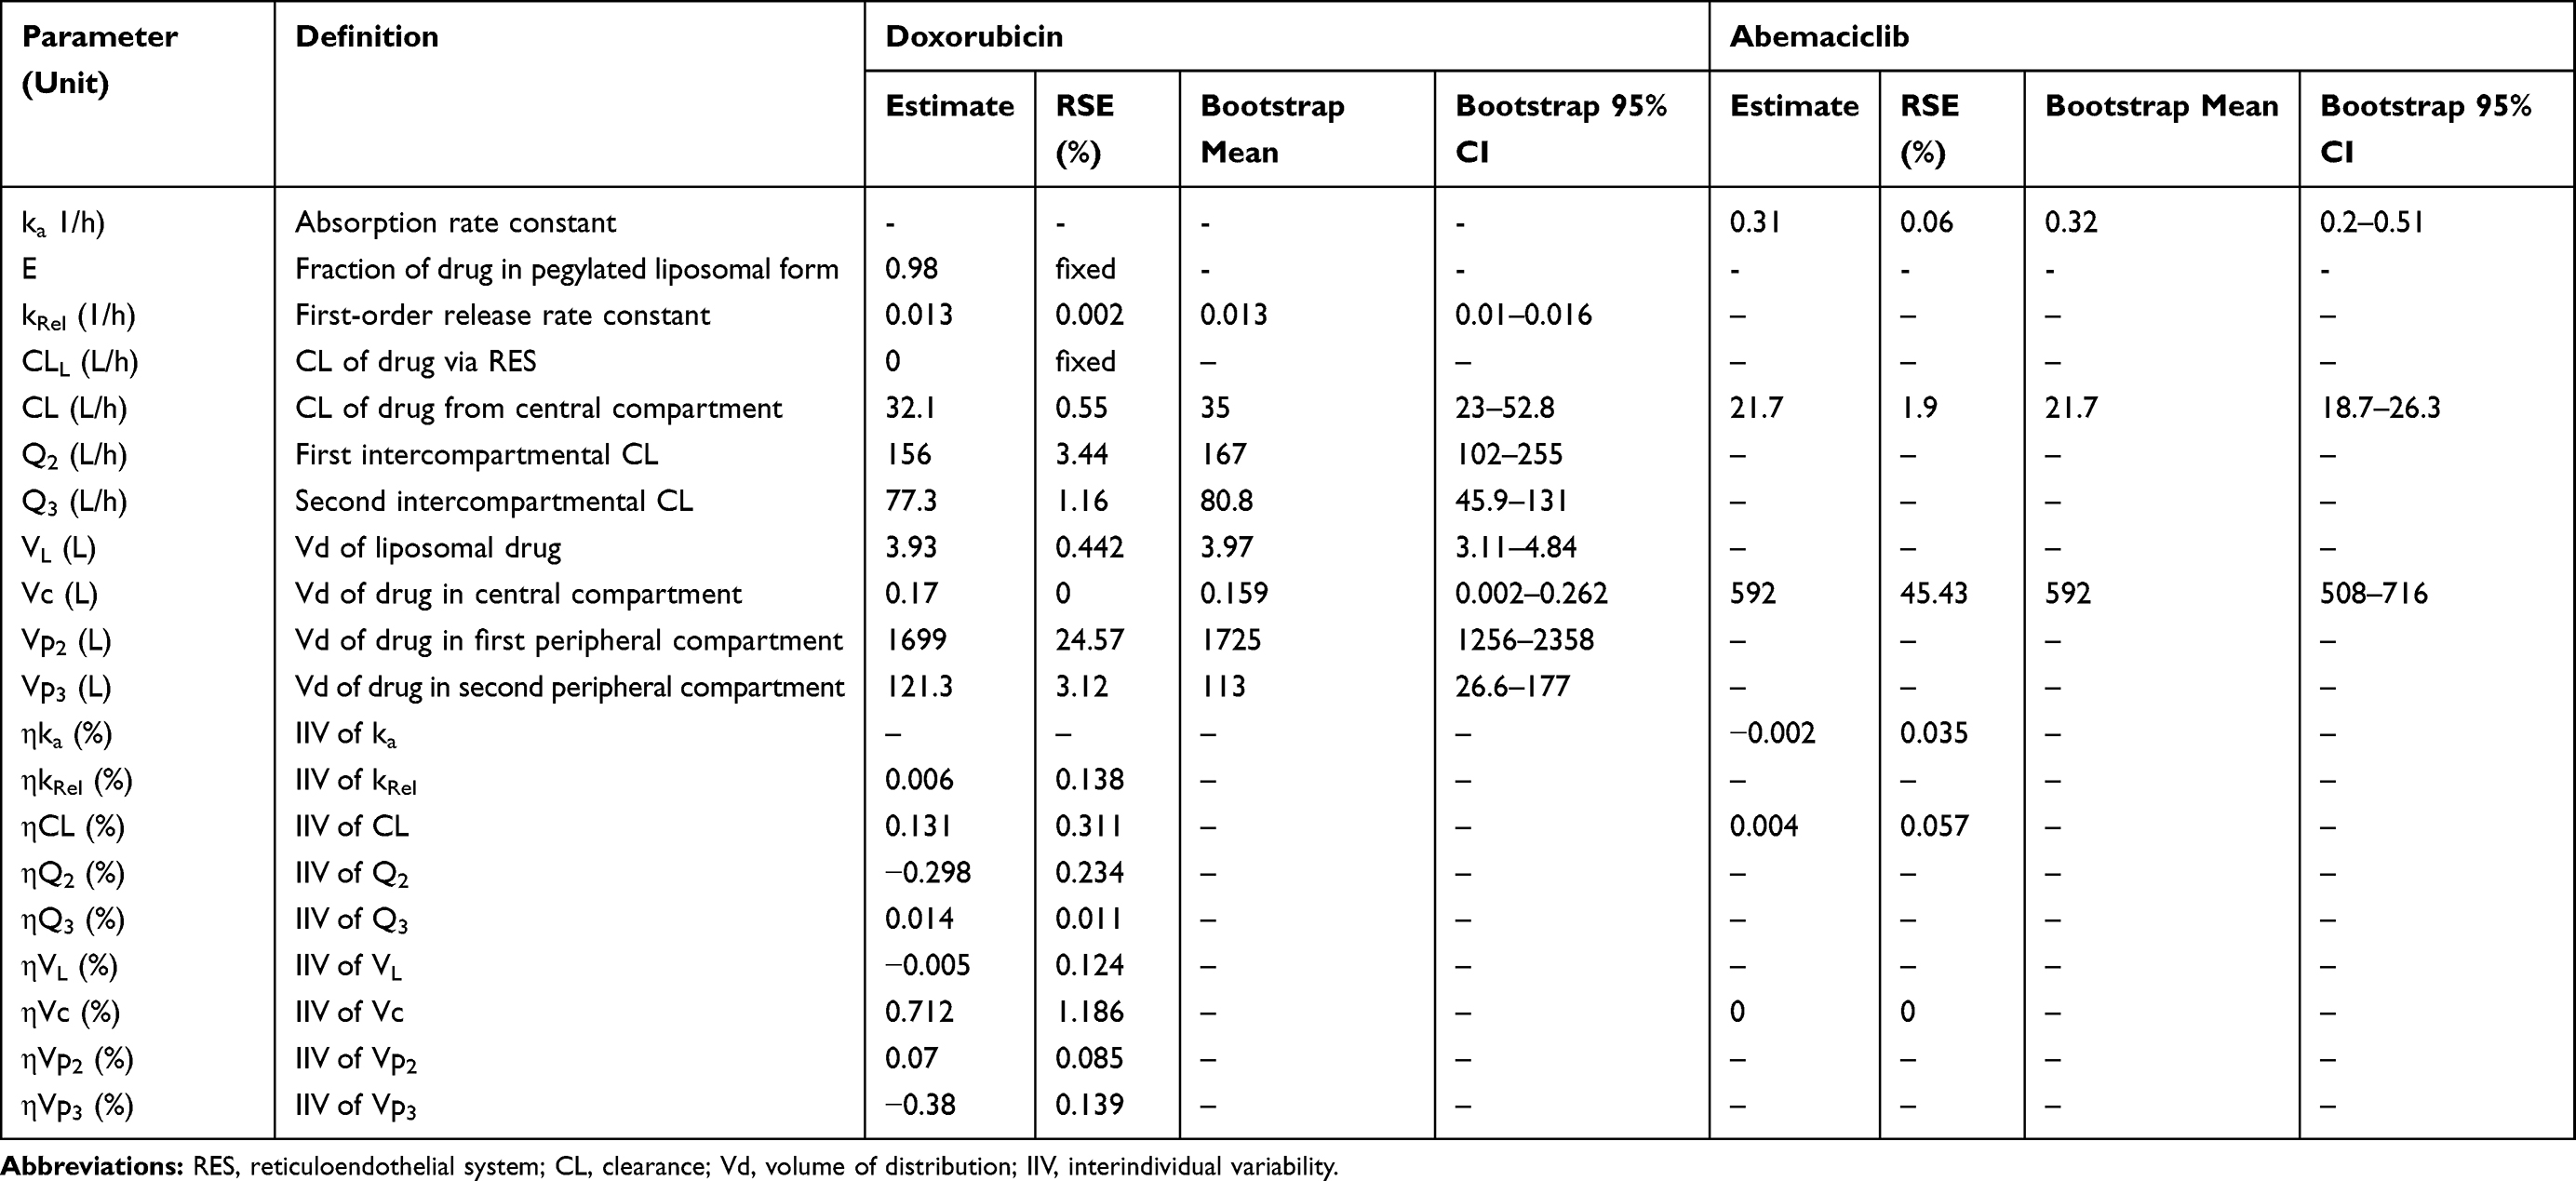 |
Table 2 Model Parameters from Population PK Analysis. Parameters are Reported as Mean Values and Residual Standard Error (RSE %). Bootstrap of Final Model Parameters Was Conducted Using 1000 Replicates. Bootstrap Parameters are Reported as Mean and 95% Confidence Interval (95% CI) |
Model-Based Simulations
Clinical PK
Model-based simulations of clinical dosing regimens for DOX, L_DOX (Figure 6A), and ABE (Figure 6B) provide time-course profiles of unbound drug concentrations in the plasma. After IV administration of DOX at 75 and 60 mg/m2 for 60 days, unbound DOX concentrations in the central compartment reached 1.3 and 0.7 µM on days 1, 21, and 42 followed by a rapid 10-fold decrease one-day post-administration (Figure 6A). This result indicates that the unbound DOX plasma concentrations are initially within the range of the in vitro concentrations examined in Figure 2. However, shortly after the end of the IV infusion, DOX unbound concentrations decline below the minimum bound of the in vitro range of concentrations, suggesting a minimal cytotoxic effect on Rb-positive TNBC. The IV administration of L_DOX at 50 mg/m2 for 60 days maintained the unbound DOX concentrations at ~0.006 µM on days 1, 28, and 56 for four days post-administration. These results agree well with concentrations reported in the literature.9,44 Similarly, the unbound DOX plasma concentrations released from the L_DOX showed a trend and magnitude comparable to DOX with a decline to values below the minimum bound of the in vitro range of concentrations cytotoxicity range (Figure 2). These findings also suggest that the free DOX released from the L_DOX formulation will produce a minimal cytotoxicity effect on Rb-positive TNBC. Following ABE oral administration of 150 and 200 mg BID for 60 days, the steady-state unbound concentrations were attained on day six and reached 0.017 and 0.022 µM (Figure 6B). This finding is consistent with previously reported steady-state concentrations for ABE previously published.45 Unbound ABE concentrations are near the minimum of in vitro cytotoxicity range for MDA-MB-231 (Figure 2), suggesting sustained albeit low cytotoxicity.
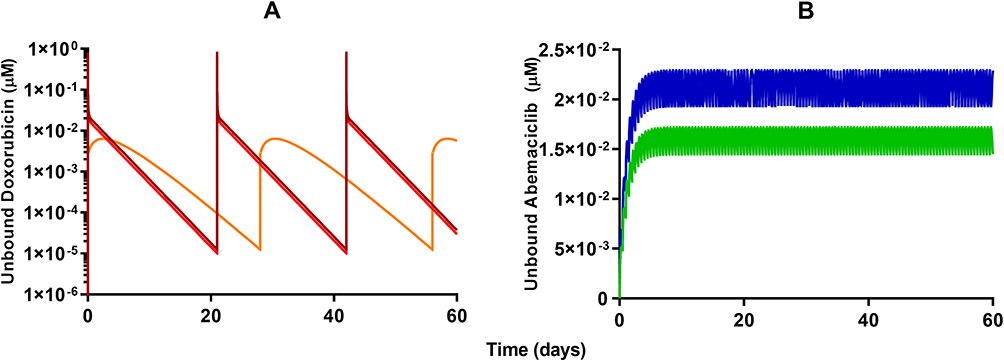 |
Figure 6 Model-based simulations of time-course profiles for unbound plasma concentrations of (A) 60 mg/m2 (red) or 75 mg/m2 (dark red) free doxorubicin once every 21 days, 50 mg/m2 pegylated liposomal doxorubicin (light orange) once every 28 days, and (B) 150 mg (green) or 200 mg (dark blue) abemaciclib twice daily. |
Clinical Growth Inhibition and TTP
The %cell growth for replicating cells in vitro, kginvitro (0.026 mass⋅hr−1) (Table 2), was replaced with the “humanized“ first-order rate constants, kgclin, to predict unperturbed tumor growth (ie, placebo) in TNBC patients. The initial TTP estimates without drug exposure based on calculations using the WHO and RECIST criteria were 34.1 and 41.8 days. The calculated 7.7 days difference in the TTP for the control group coincides with the 5% difference between the two criteria for TTP calculation (20 vs 25%). Nevertheless, the TTP was the shortest in the ABE treatment arm regardless of the criterion used for its calculation. The TTP in ABE 150 mg BID alone extended TTP by 6.5–8 days longer than control (40.6–49.9 days), and, in 200 mg BID alone, the TTP was extended by 8.6–10.6 days longer than control (42.7–52.4 days). These results indicate that, although ABE targets the Rb pathway in Rb-proficient TNBC,17 CDK4/6 inhibitors do not entirely suppress Rb-proficient TNBC tumor-growth.20,46
Treatment with DOX-based therapy alone produced significantly greater TTP compared to the control arm. 50 mg/m2 L_DOX extended TTP by 31.2–34 days (65.3–75.7 days), 60 mg/m2 DOX extended TTP by 63.9–76.5 days (98–118 days), and 75 mg/m2 DOX extended TTP by 126–157 days (160–198 days). The predicted relapse after DOX based-therapy aligns with the reduced sensitivity (higher IC50) of DOX in Rb-positive TNBC observed in Figure 2. Further, combining ABE with L_DOX or DOX increased TTP compared to DOX alone, which agrees with our in vitro results of synergistic interaction of DOX+ABE. ABE 150 or 200 mg BID with 50 mg/m2 L_DOX q28d increased TTP by 44–57.6 days (78.2–99.4 days) and 47–62 days (81.6–104 days). The rise in TTP after combination was more pronounced with DOX than with L_DOX. ABE 150 or 200 mg BID with 60 mg/m2 DOX increased TTP by 105–121 (139–163 days) days and 125–142 days (159–183 days) and with 75 mg/m2 DOX increased TTP by 249–286 days (283–328 days) and 312–368 days (347–410 days).
Discussion
TNBC is highly metastatic, difficult-to-treat, and lacks targeted therapy.47 The Rb protein plays a critical role in regulating cellular replication and is a well-studied biomarker in breast cancer subtypes, including TNBC.13,17,47–49 The difficult-to-treat nature of TNBC may be attributed to the active Rb-pathway, whereby Rb-expressing TNBC cells tend to be more resistant to traditional chemotherapy than Rb-negative TNBC cells.13 MDA-MB-231 is a well-characterized Rb-positive TNBC cell line and is identified as being more resistant to DOX than the Rb-negative MDA-MB-468 cell line.18 This decrease in DOX sensitivity is indicated by a higher IC50 (0.565 vs 0.121 µM; Table 1), suggesting that MDA-MB-231 resistance to DOX may be attributed to an active Rb-pathway.
ABE, a CDK4/6 inhibitor, demonstrated a greater IC50 (reduced sensitivity) in MDA-MB-231 than MDA-MB-468 cells (2.31 vs 1.61 µM) (Table 1). This result was not anticipated based on the ABE mechanism of action. While ABE induces cytotoxicity in MDA-MB-231 cells via inhibition of pRb,17 the MDA-MB-468 cells lack expression of this target (Supplementary Figure S2). However, reports have shown that the cytotoxicity of CDK4/6 inhibitors in Rb-negative TNBC may occur through off-target mechanisms such as permeabilization of the lysosomes, thereby causing the release of the hydrolytic contents into the cytoplasm and stimulation of apoptosis.46,50,51 The exposure-response profiles in MDA-MB-468 cells exhibited a steeper profile; hence, a higher value for the Hill coefficient compared to MDA-MB-231 cells (3.19 vs 1.82), indicating that ABE killing of MDA-MB-468 cells greatly diminishes as concentrations decrease below its IC50. O’Brien et al17 conducted an extensive examination of the effectiveness of ABE in a panel of TNBC cell lines, including MDA-MB-231 and MB-MDA-468 cells, and found the cell line MDA-MB-231 to be more sensitive to ABE than MDA-MB-468. The knockout of the Rb1 gene expression effectively diminished the effect of ABE on MDA-MB-231,17 suggesting that the therapeutic response to ABE in Rb-positive TNBC cells is primarily driven through inhibition of the Rb pathway.17,39 Similarly, Asghar et al39 showed that the MDA-MB-468 cell line was relatively insensitive to the CDK4/6 inhibitor, Palbociclib (Ibrance®), as compared to other TNBC subtypes. The simulated PK profile of unbound plasma concentrations of ABE after 200 mg BID dosing (Figure 6) does not reach sustained concentrations near 1.61 µM (IC50 of ABE in MDA-MB-468). Therefore, ABE will not likely elicit a clinically significant response in Rb-negative TNBC.
ABE was examined in combination with DOX because DOX is often used as a neoadjuvant chemotherapeutic treatment in TNBC52,53 and reportedly works through different mechanisms of action to ABE. Concentrations of ABE, 1–2.5 µM for MDA-MB-468 and 1–6 µM for MDA-MB-231 were used in combination with DOX administered at its IC50 value (Figure 2). ABE and DOX combinations were antagonistic (CI>1) in MDA-MB-468 cells. ABE and DOX may exhibit antagonism in Rb-negative TNBC by competing for apoptosis activation via lysosomal permeabilization.46,51,54,55
Conversely, in MDA-MB-231 cells, the relationship between DOX+ABE was synergistic (CI>1) (Figure 3). Resistance to DOX chemotherapy is proposed to be circumvented by inhibition of pRb-mediated proliferation.13–17,56 Within our model, growth was driven by a zero-order rate constant, kginvitro (Figure 1), which captured the natural growth of control cells. Both the rates of transition from a replicating state to a nonreplicating state26,27,57 and apoptosis26 were driven by the first-order rate constant, ktrans. The fast-onset of observed pRb inhibition by ABE was captured using a Hill function stimulating the reduction of CDK, which is required to maintain steady-state levels of pRb. DOX exposure produced an initial increase in the pRb expression, followed by a delayed hypophosphorylation. This relationship has previously been observed in MCF-7 breast cancer,28 but to our knowledge, it has not been studied in TNBC.
Model estimations (Table 3) suggest that DOX produces a significantly larger effect on the proposed cytotoxic pathway than ABE because of the lower EC50 from DOX compared to ABE (EC50DOX 0.509 µM vs.EC50ABE 12.7 µM). These results are not surprising considering that DOX exposure induces strand breakages in supercoiled DNA, promoting cell death.12 As a result, MDA-MB-231 is approximately four times more sensitive to DOX (IC50 0.565 µM, Table 1) than ABE (IC50 2.31 μM, Table 1). DOX also produces radical intermediates,12 which is hypothesized to activate the p38 mitogen-activated protein network through oxidative stress causing an initial increase in the pRb protein.56,58 Prolonged exposure to DOX leads to sustained activation of the p38 pathway,59 which decreases pRb28 by increasing in Rb-E2F binding.59,60
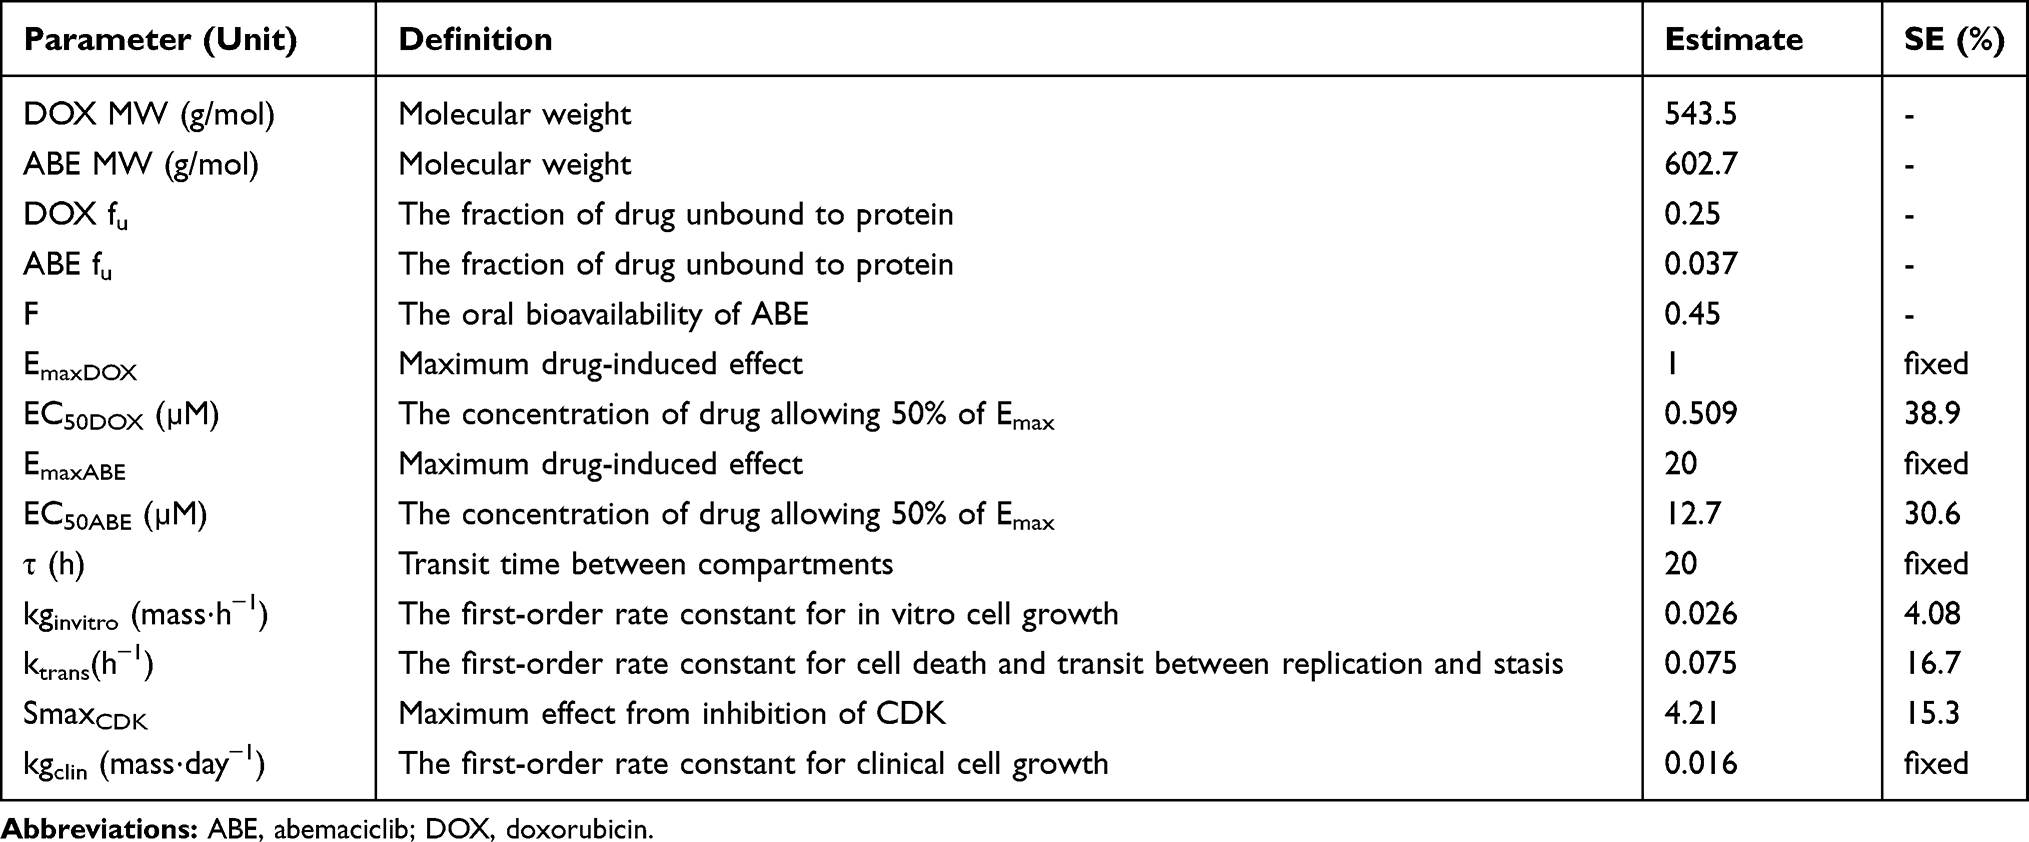 |
Table 3 Model Estimated Parameters for Pharmacodynamic Analysis. Parameters are Reported as Mean and Standard Error (SE, %) |
The cytostatic effects from DOX and ABE converge on the pRb pathway.17,18,61–63 τ (20 hr) describes the latency of full pharmacological effect on compartments TOPO, DNA, CDK, and pRb and describes the transit time from prepRb to pRb. The lack of CDK induced by ABE drives a reduction in pRb proportional to SmaxCDK (4.21) and inhibits G1-S phase progression within the cell cycle.17 In parallel, DOX inhibits G2-M phase transition in Rb-positive TNBC18,61–63 via p38-mediated activity,61 resulting in improved cytostatic activity when administered with ABE18,26 over an extended time interval. An examination into mechanisms for the transient hyperphosphorylation of Rb from DOX and quantification of biomarkers within the p38 pathway may improve model structure by removing the structural need for a pRb precursor pool compartment as well as provide further insights into the mechanisms of interaction between ABE and DOX.
Model predictions with ABE administration suggest continuous tumor growth despite the constant administration of ABE (Figure 7). Our findings disagree with published results from an in vivo study conducted on mice xenografted with MDA-MB-231 cells then treated with ABE, where a shrinkage in the tumor volume was observed.17 Notwithstanding that in this study, mice were exposed to 3 days of continuous dosing, which does not reflect the clinically approved ABE treatment regimen. Our simulated clinical PK profile shows that the steady-state unbound ABE concentration in the central compartment (0.022 µM, Figure 6) does not reach a large enough concentration to significantly impact MDA-MB-231 cell growth (0.2 µM17). Our rationale for selecting high ABE concentrations for the in vitro examination of the proposed combination was based on in vitro studies measuring single-agent concentration-effect (Figure 2) and combinatorial effect (Figure 3). These tested concentrations produced a measurable change in cell response. Further, the 2 μM ABE was used for the combination with DOX because it demonstrated the greatest synergism (CI =0.48) in MDA-MB-231 and antagonism in MDA-MB-468.
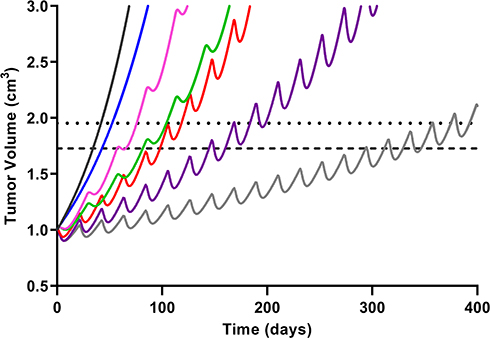 |
Figure 7 Simulated triple-negative breast cancer (TNBC) tumor growth. Growth within the no-drug control (black) and treatment arms were simulated using a previously published TNBC tumor growth rate.36 Mono- and combination drug arms were simulation using 400 days of continual dosing. Abemaciclib (ABE) was dosed as a 200 mg tablet (blue) twice daily (BID). Dosing regimens for free doxorubicin (DOX) were 60 mg/m2 dose (red) and 75 mg/m2 dose (purple) every 21 days (q21d), and pegylated liposomal doxorubicin (L_DOX) was 50 mg/m2 (pink) every 28 days (q28d). ABE 200 mg BID was dosed in combination with L_DOX 50 mg/m2 q28d (green) and with DOX 75 mg/m2 q21d (grey). The upper dotted horizontal line represents the 25% or 1.95-fold growth from baseline (WHO criterion for TTP). The lower horizontal dotted line represents the 20% or 1.73-fold growth from baseline (RECIST criterion for TTP), assuming the tumor spherical. |
In contrast, DOX-based simulations pronounced a significantly greater response than ABE, although tumor relapse still occurred. The dose of DOX at 75 mg/m2 infused over 15 minutes generated an initial unbound DOX concentration of 1.3 µM in the central compartment, surpassing the MDA-MB-231 IC50 value. However, unbound DOX concentrations (active pharmacological entity) in the central compartment declined to 0.008 µM after 72 hours results in a plasma concentration that is well below the minimum of the cytotoxicity range tested for MDA-MB-231 (0.1 µM, Figure 2). DOX simulations align with previously published clinical data where the progression-free survival (PFS) in TNBC patients treated with DOX 60 mg/m2 plus cyclophosphamide 600 mg/m2 every 3 weeks23 was approximately twice that of our simulated TTP for DOX monotherapy (eg, 243 days vs 98.0–118 days). Considering that combining DOX with cyclophosphamide will increase PFS/TTP relative to single agents, our DOX monotherapy simulations are plausible. DOX simulations suggest a greater reduction in tumor size than L_DOX. Unbound free DOX plasma concentrations 72 hours post-administration after a 50 mg/m2 L_DOX infusion over 1 hour are predicted to reach 0.006 µM, lower than the minimum of the cytotoxicity range tested for MDA-MB-231 (0.1 µM, Figure 2). To our knowledge, L_DOX response in Rb-positive TNBC is not fully characterized. However, DOX is dosed more frequently than L_DOX (eg, q21 days vs q28 days), leading to greater exposure throughout treatment. Regardless of the DOX formulation, the simulations suggest that relapse will reoccur. These predictions agree with the clinical observations, where DOX has shown modest efficacy in Rb-positive TNBC13 and was frequently deemed inefficacious in TNBC patients.52,65,66
Model-based simulations suggest combining DOX with ABE results in added benefit, eg, an increase in TTP (Table 4), due to an increase in cytostatic activity.18,26 However, simulations also suggest that the drug combination will not eliminate the tumor burden. DOX stimulates cell death primarily in replicating cells.67 By inhibiting replication, ABE may reduce the susceptible cell population and antagonize DOX-induced cytotoxicity.18 The predicted model-based tumor relapse after combination, together with the potential trade-off between cytostasis and cytotoxicity, suggests that adding ABE to DOX-based therapy may not be a feasible TNBC treatment strategy.
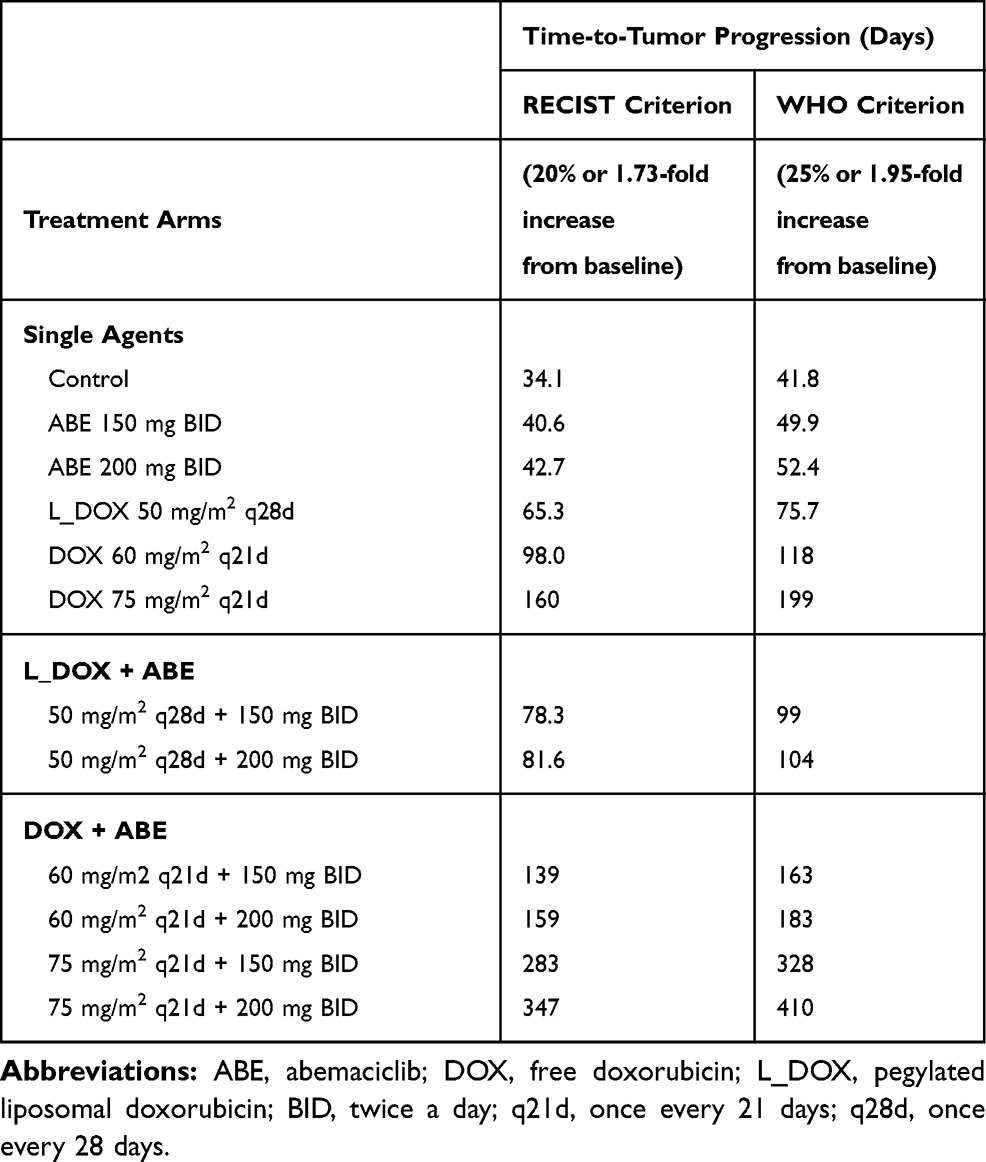 |
Table 4 Time-to-Tumor Progression (TTP) Values Calculated from RECIST and WHO Criteria. The TTP is Defined as an Event or Disease Progression at 20 (RECIST) and 25% (WHO) Increase from Baseline. This Corresponds to a Fold Increase of 1.73 and 1.95 in Baseline Tumor Diameter, Assuming the Tumor Has a Spherical Shape |
Despite the encouraging in vitro findings and the utility of our in vitro-to-clinical translational approach, our study presents with limitations. TNBC is a heterogeneous collection of BC subtypes often undistinguished within clinical trials.68 Thus, assessing individual growth rates of TNBC subtypes (including Rb-positive TNBC) in patients based on available clinical data remains a limitation. Considering that TNBC is more aggressive than other BC categories (eg, HER2, ER, PR),2 the developed translational PK/PD model assumed that the natural growth of in vitro Rb-positive TNBC is proportional to the natural growth of a TNBC tumor.36 Further, multiple methods exist for scaling from preclinical to clinical models.69 The approach used in our study is considered an adequate method because our simulated TNBC doubling time of 43.3 days is comparable to the published doubling time of 1.44 months.36 Finally, our PD model focused solely on the fold change of the pRb protein relative to the control as a marker of efficacy.17 However, the expression of biomarkers that work in concert within the Rb-signaling cascade (eg, p16 or Cyclin E1)17,49 may also influence ABE efficacy. While clinical evidence is currently not available to compare against our ABE simulations, future results of NCT03130439, an ongoing Phase II clinical study, will provide efficacy data for ABE in Rb-positive TNBC. Data from this study may be used to assess the validity of our simulations and whether pRb can be used as a primary predictor of ABE efficacy.
Conclusion
In this work, we explored the clinical effectiveness of the DOX and ABE combination using an extended PK/PD modeling approach. The interaction between both agents was found to produce synergy in Rb-positive TNBC cell line, MDA-MB-231 (and antagonism in Rb-negative TNBC). The model-based simulations suggest that clinical concentrations of both agents will result in improve activity for Rb-positive TNBC. However, the combination may only delay and not prevent tumor relapse. Our results agree with conclusions drawn from previous works where combining CDK4/6 inhibitors with cytotoxic agents (eg, DOX) may not benefit patients with difficult-to-treat cancers.18,20,21
Acknowledgments
The authors thank Dr. Sietse Braakman from MathWorks for support for Simbiology toolbox in Matlab and Dr. Folakemi Odedina for supporting the Comprehensive Cancer Research Training Opportunities for Outstanding Leaders (C-ReTOOL) Program. This work was funded in part by the American Foundation for Pharmaceutical Education (AFPE). The poster’s abstract was published in “Experimental Biology 2020 Meeting Abstracts” in Volume 34, Issue S1 in Federation of American Societies for Experimental Biology (FASEB) Journal: https://doi.org/10.1096/fasebj.2020.34.s1.02500. Brett Fleisher is currently affiliated with Genentech, Inc, South San Francisco, CA, USA (Email: [email protected]).
Author Contributions
All authors made a significant contribution to the work reported, whether that is in the conception, study design, execution, acquisition of data, analysis and interpretation, or in all these areas; took part in drafting, revising or critically reviewing the article; gave final approval of the version to be published; have agreed on the journal to which the article has been submitted; and agree to be accountable for all aspects of the work.
Disclosure
Sihem Ait-Oudhia is an employee of Merck & Co, Inc, Kenilworth, New Jersey, USA. The authors declare that there is no other conflict of interest.
References
1. Podo F, Buydens LM, Degani H, et al. Triple-negative breast cancer: present challenges and new perspectives. Mol Oncol. 2010;4(3):209–229.
2. Siegel RL, Miller KD, Jemal A. Cancer statistics, 2018.. CA Cancer J Clin. 2018;68(1):7–30. doi:10.3322/caac.21442
3. Bender RJ, Mac Gabhann F, Schönbach C. Expression of VEGF and semaphorin genes define subgroups of triple negative breast cancer. PLoS One. 2013;8(5):e61788. doi:10.1371/journal.pone.0061788
4. Fleisher B, Clarke C, Ait-Oudhia S. Current advances in biomarkers for targeted therapy in triple-negative breast cancer.. Breast Cancer (Dove Medical Press). 2016;8:183–197. doi:10.2147/BCTT.S114659
5. Rugo HS, Olopade OI, DeMichele A, Yau C. Adaptive randomization of veliparib–carboplatin treatment in breast cancer. N Engl J Med. 2016;375(1):23–34. doi:10.1056/NEJMoa1513749
6. Sikov WM, Berry DA, Perou CM, et al. Impact of the Addition of carboplatin and/or bevacizumab to neoadjuvant once-per-week paclitaxel followed by dose-dense doxorubicin and cyclophosphamide on pathologic complete response rates in stage ii to iii triple-negative breast cancer: CALGB 40603 (alliance). J Clin Oncol. 2014.
7. Liedtke C, Mazouni C, Hess KR, et al. Response to Neoadjuvant Therapy and Long-Term Survival in Patients With Triple-Negative Breast Cancer. J Clin Oncol. 2008;26(8):1275–1281.
8. Khouri MG, Douglas PS, Mackey JR, et al. Cancer therapy-induced cardiac toxicity in early breast cancer: addressing the unresolved issues. Circulation. 2012;126(23):2749–2763.
9. Gabizon A, Shmeeda H, Barenholz Y. Pharmacokinetics of pegylated liposomal Doxorubicin: review of animal and human studies. Clin Pharmacokinet. 2003;42(5):419–436.
10. Charrois GJR, Allen TM. Drug release rate influences the pharmacokinetics, biodistribution, therapeutic activity, and toxicity of pegylated liposomal doxorubicin formulations in murine breast cancer. Biochimica Et Biophysica Acta. 2004;1663(1–2):167–177. doi:10.1016/j.bbamem.2004.03.006
11. O’Brien ME, Wigler N, Inbar M, et al. Reduced cardiotoxicity and comparable efficacy in a phase III trial of pegylated liposomal doxorubicin HCl(CAELYX™/Doxil®) versus conventional doxorubicin for first-line treatment of metastatic breast cancer. Ann Oncol. 2004;15(3):440–449. doi:10.1093/annonc/mdh097
12. Tacar O, Sriamornsak P, Dass CR. Doxorubicin: an update on anticancer molecular action, toxicity and novel drug delivery systems. J Pharm Pharmacol. 2013;65(2):157–170. doi:10.1111/j.2042-7158.2012.01567.x
13. Robinson TJW, Liu JC, Vizeacoumar F, et al. RB1 status in triple negative breast cancer cells dictates response to radiation treatment and selective therapeutic drugs. PLoS One. 2013;8(11):e78641. doi:10.1371/journal.pone.0078641
14. Christowitz C, Davis T, Isaacs A, van Niekerk G, Hattingh S, Engelbrecht A-M. Mechanisms of doxorubicin-induced drug resistance and drug resistant tumour growth in a murine breast tumour model. BMC Cancer. 2019;19(1):757. doi:10.1186/s12885-019-5939-z
15. Lange CA, Yee D. Killing the second messenger: targeting loss of cell cycle control in endocrine-resistant breast cancer. Endocr Relat Cancer. 2011;18(4):C19–24. doi:10.1530/ERC-11-0112
16. Lee E-R, Kim J-Y, Kang Y-J, et al. Interplay between PI3K/Akt and MAPK signaling pathways in DNA-damaging drug-induced apoptosis. Biochimica Et Biophysica Acta. 2006;1763(9):958–968. doi:10.1016/j.bbamcr.2006.06.006
17. O’Brien N, Conklin D, Beckmann R, et al. Preclinical Activity of Abemaciclib Alone or in Combination with Antimitotic and Targeted Therapies in Breast Cancer. Mol Cancer Ther. 2018;17(5):897–907. doi:10.1158/1535-7163.MCT-17-0290
18. McClendon AK, Dean JL, Rivadeneira DB, et al. CDK4/6 inhibition antagonizes the cytotoxic response to anthracycline therapy. Cell Cycle. 2012;11(14):2747–2755. doi:10.4161/cc.21127
19. Liu C-Y, Lau K-Y, Hsu -C-C, et al. Combination of palbociclib with enzalutamide shows in vitro activity in RB proficient and androgen receptor positive triple negative breast cancer cells. PLoS One. 2017;12(12):e0189007. doi:10.1371/journal.pone.0189007
20. Roberts PJ, Bisi JE, Strum JC, et al. Multiple Roles of Cyclin-Dependent Kinase 4/6 Inhibitors in Cancer Therapy. JNCI. 2012;104(6):476–487. doi:10.1093/jnci/djs002
21. Murphy CG, Dickler MN. The Role of CDK4/6 Inhibition in Breast Cancer. The Oncologist. 2015;20(5):483–490. doi:10.1634/theoncologist.2014-0443
22. Tate SC, Cai S, Ajamie RT, et al. Semi-mechanistic pharmacokinetic/pharmacodynamic modeling of the antitumor activity of LY2835219, a new cyclin-dependent kinase 4/6 inhibitor, in mice bearing human tumor xenografts. Clin Cancer Res. 2014;20(14):3763–3774. doi:10.1158/1078-0432.CCR-13-2846
23. Yi SY, Ahn JS, Uhm JE, et al. Favorable response to doxorubicin combination chemotherapy does not yield good clinical outcome in patients with metastatic breast cancer with triple-negative phenotype. BMC Cancer. 2010;10(1):527. doi:10.1186/1471-2407-10-527
24. Zhang N, Fu J-N, Chou T-C. Synergistic combination of microtubule targeting anticancer fludelone with cytoprotective panaxytriol derived from panax ginseng against MX-1 cells in vitro: experimental design and data analysis using the combination index method. Am J Cancer Res. 2016;6(1):97–104.
25. Chou T-C. Drug combination studies and their synergy quantification using the Chou-Talalay method. Cancer Res. 2010;70(2):440–446. doi:10.1158/0008-5472.CAN-09-1947
26. Inao T, Kotani H, Iida Y, et al. Different sensitivities of senescent breast cancer cells to immune cell-mediated cytotoxicity. Cancer Sci. 2019;110(9):2690–2699. doi:10.1111/cas.14116
27. Hou J-G, Jeon B-M, Yun Y-J, Cui C-H, Kim S-C. Ginsenoside Rh2 Ameliorates Doxorubicin-Induced Senescence Bystander Effect in Breast Carcinoma Cell MDA-MB-231 and Normal Epithelial Cell MCF-10A. Int J Mol Sci. 2019;20(5):1244. doi:10.3390/ijms20051244
28. Jackson JG, Pereira-Smith OM. Primary and compensatory roles for RB family members at cell cycle gene promoters that are deacetylated and downregulated in doxorubicin-induced senescence of breast cancer cells. Mol Cell Biol. 2006;26(7):2501–2510. doi:10.1128/MCB.26.7.2501-2510.2006
29. Patnaik A, Rosen LS, Tolaney SM, et al. Efficacy and Safety of Abemaciclib, an Inhibitor of CDK4 and CDK6, for Patients with Breast Cancer, Non–Small Cell Lung Cancer, and Other Solid Tumors. Cancer Discov. 2016;6(7):740–753. doi:10.1158/2159-8290.CD-16-0095
30. Verzenio© (abemaciclib) application number 208716Orig1s000; 2020. [Multi-Discipline Review] Available from: https://www.accessdata.fda.gov/drugsatfda_docs/nda/2017/208716Orig1s000MultidisciplineR.pdf.
31. Greene RF, Collins JM, Jenkins JF, Speyer JL, Myers CE. Plasma pharmacokinetics of adriamycin and adriamycinol: implications for the design of in vitro experiments and treatment protocols.. Cancer Res. 1983;43(7):3417–3421.
32. Liang S, Brundage RC, Jacobson PA, Blaes A, Kirstein MN. Pharmacokinetic–pharmacodynamic modelling of acute N-terminal pro B-type natriuretic peptide after doxorubicin infusion in breast cancer. Br J Clin Pharmacol. 2016;82(3):773–783. doi:10.1111/bcp.12989
33. Gabizon A, Catane R, Uziely B, et al. Prolonged circulation time and enhanced accumulation in malignant exudates of doxorubicin encapsulated in polyethylene-glycol coated liposomes.. Cancer Res. 1994;54(4):987–992.
34. Janssen. DOXIL (Doxorubicin HCl Liposome Injection) for Intravenous Infusion; 2013.
35. Uziely B. Doxorubicin Hydrochloride for Injection, USP. Kalamazoo, MI: Edited by Company PU; 2003.
36. Kay K, Dolcy K, Bies R, Shah DK. Estimation of Solid Tumor Doubling Times from Progression-Free Survival Plots Using a Novel Statistical Approach. AAPS J. 2019;21(2):27. doi:10.1208/s12248-019-0302-5
37. Golshan M, Cirrincione CT, Sikov WM, et al. Impact of Neoadjuvant Chemotherapy in Stage II–III Triple Negative Breast Cancer on Eligibility for Breast-conserving Surgery and Breast Conservation Rates. Ann surg. 2004;1663(1–2):434–439. doi:10.1093/jnci/92.3.205
38. Organization WH. WHO Handbook for Reporting Results of Cancer Treatment. Geneva: World Health Organization; 1979.
39. Asghar US, Barr AR, Cutts R, et al. Single-Cell Dynamics Determines Response to CDK4/6 Inhibition in Triple-Negative Breast Cancer. Clin Cancer Res. 2017;23(18):5561–5572. doi:10.1158/1078-0432.CCR-17-0369
40. Eissa IH, Metwaly AM, Belal A, et al. Discovery and antiproliferative evaluation of new quinoxalines as potential DNA intercalators and topoisomerase II inhibitors. Arch Pharm. 2019;352(11):e1900123.
41. MathWorks®. Simbiology® User’s Guide (R2020a); 2020.
42. Perez-Blanco JS, Santos-Buelga D, Hernández-Rivas JM, Martín A, García MJ. Population pharmacokinetics of doxorubicin and doxorubicinol in patients diagnosed with non-Hodgkin’s lymphoma. Br J Clin Pharmacol. 2016;82(6):1517–1527. doi:10.1111/bcp.13070
43. Hsu L-F. Investigation of the Discriminatory Ability of Pharmacokinetic Metrics for the Bioequivalence Assessment of PEGylated Liposomal Doxorubicin. Pharm Res. 2018;35(5):106. doi:10.1007/s11095-018-2387-4
44. Bhowmik S, Bhowmick S, Maiti K, et al. Two multicenter Phase I randomized trials to compare the bioequivalence and safety of a generic doxorubicin hydrochloride liposome injection with Doxil® or Caelyx® in advanced ovarian cancer.. Cancer Chemother Pharmacol. 2018;82(3):521–532. doi:10.1007/s00280-018-3643-3
45. Tate SC, Sykes AK, Kulanthaivel P, Chan EM, Turner PK, Cronier DM. A Population Pharmacokinetic and Pharmacodynamic Analysis of Abemaciclib in a Phase I Clinical Trial in Cancer Patients. Clin Pharmacokinet. 2018;57(3):335–344. doi:10.1007/s40262-017-0559-8
46. Knudsen ES, Hutcheson J, Vail P, Witkiewicz AK. Biological specificity of CDK4/6 inhibitors: dose response relationship, in vivo signaling, and composite response signature. Oncotarget. 2017;8(27):43678–43691. doi:10.18632/oncotarget.18435
47. Neophytou C, Boutsikos P, Papageorgis P. Molecular Mechanisms and Emerging Therapeutic Targets of Triple-Negative Breast Cancer Metastasis. Front Oncol. 2018;8:31. doi:10.3389/fonc.2018.00031
48. Knudsen ES, Wang JYJ. Targeting the RB-pathway in Cancer Therapy. Clin Cancer Res. 2010;16(4):1094. doi:10.1158/1078-0432.CCR-09-0787
49. Martin JM, Goldstein LJ. Profile of abemaciclib and its potential in the treatment of breast cancer. OncoTargets Therapy. 2018;11:5253–5259. doi:10.2147/OTT.S149245
50. Dean JL, Thangavel C, McClendon AK, Reed CA, Knudsen ES. Therapeutic CDK4/6 inhibition in breast cancer: key mechanisms of response and failure. Oncogene. 2010;29(28):4018–4032. doi:10.1038/onc.2010.154
51. Llanos S, Megias D, Blanco-Aparicio C, et al. Lysosomal trapping of palbociclib and its functional implications. Oncogene. 2019;38(20):3886–3902. doi:10.1038/s41388-019-0695-8
52. Costa RLB, Gradishar WJ. Triple-Negative Breast Cancer: current Practice and Future Directions. J Oncol Pract. 2017;13(5):301–303. doi:10.1200/JOP.2017.023333
53. Golshan M, Cirrincione CT, Sikov WM, et al. Impact of neoadjuvant chemotherapy in stage II-III triple negative breast cancer on eligibility for breast-conserving surgery and breast conservation rates: surgical results from CALGB 40603 (Alliance). Ann Surg. 2015;262(3):434–439.
54. Allison SE, Chen Y, Petrovic N, et al. Activation of ALDH1A1 in MDA-MB-468 breast cancer cells that over-express CYP2J2 protects against paclitaxel-dependent cell death mediated by reactive oxygen species. Biochem Pharmacol. 2017;143:79–89.
55. Zhang Y, Yang ND, Zhou F, et al. Epigallocatechin-3-gallate induces non-apoptotic cell death in human cancer cells via ROS-mediated lysosomal membrane permeabilization. PLoS One. 2012;7(10):e46749.
56. Vurusaner B, Poli G, Basaga H. Tumor suppressor genes and ROS: complex networks of interactions. Free Radic Biol Med. 2012;52(1):7–18.
57. Hanahan D, Weinberg RA. Hallmarks of cancer: the next generation. Cell. 2011;144(5):646–674.
58. Gubern A, Joaquin M, Marques M, et al. The N-terminal phosphorylation of RB by p38 bypasses its inactivation by cdks and prevents proliferation in cancer cells. Mol Cell. 2016;64(1):25–36.
59. Zhang Y, Gao Y, Zhao L, et al. Mitogen-activated protein kinase p38 and retinoblastoma protein signalling is required for DNA damage-mediated formation of senescence-associated heterochromatic foci in tumour cells. FEBS J. 2013;280(18):4625–4639.
60. Zhang X, Kim J, Ruthazer R, et al. The HBP1 transcriptional repressor participates in RAS-induced premature senescence. Mol Cell Biol. 2006;26(22):8252–8266.
61. Reinhardt HC, Aslanian AS, Lees JA, Yaffe MB. p53-deficient cells rely on ATM- and ATR-mediated checkpoint signaling through the p38MAPK/MK2 pathway for survival after DNA damage. Cancer Cell. 2007;11(2):175–189.
62. Bar-On O, Shapira M, Hershko DD. Differential effects of doxorubicin treatment on cell cycle arrest and Skp2 expression in breast cancer cells. Anticancer Drugs. 2007;18(10):1113–1121.
63. Foroodi F, Duivenvoorden WC, Singh G. Interactions of doxycycline with chemotherapeutic agents in human breast adenocarcinoma MDA-MB-231 cells. Anticancer Drugs. 2009;20(2):115–122.
64. Green H, Stål O, Bachmeier K, et al. Pegylated liposomal doxorubicin as first-line monotherapy in elderly women with locally advanced or metastatic breast cancer: novel treatment predictive factors identified. Cancer Lett. 2011;313(2):145–153.
65. Yu K-D, Zhu R, Zhan M, et al. Identification of Prognosis-Relevant Subgroups in Patients with Chemoresistant Triple Negative Breast Cancer. Clin Cancer Res. 2013;19(10):2723–2733.
66. Sharma P, López-Tarruella S, García-Saenz JA, et al. Efficacy of neoadjuvant carboplatin plus docetaxel in triple negative breast cancer: combined analysis of two cohorts. Clin Cancer Res. 2017;23(3):649–657.
67. Mansilla S, Priebe W, Portugal J. Mitotic catastrophe results in cell death by caspase-dependent and caspase-independent mechanisms. Cell Cycle. 2006;5(1):53–60.
68. Lehmann BD, Bauer JA, Chen X, et al. Identification of human triple-negative breast cancer subtypes and preclinical models for selection of targeted therapies. J Clin Invest. 2011;121(7):2750–2767.
69. Mager DE, Woo S, Jusko WJ. Scaling pharmacodynamics from in vitro and preclinical animal studies to humans. Drug Metab Pharmacokinet. 2009;24(1):16–24.
 © 2021 The Author(s). This work is published and licensed by Dove Medical Press Limited. The full terms of this license are available at https://www.dovepress.com/terms.php and incorporate the Creative Commons Attribution - Non Commercial (unported, v3.0) License.
By accessing the work you hereby accept the Terms. Non-commercial uses of the work are permitted without any further permission from Dove Medical Press Limited, provided the work is properly attributed. For permission for commercial use of this work, please see paragraphs 4.2 and 5 of our Terms.
© 2021 The Author(s). This work is published and licensed by Dove Medical Press Limited. The full terms of this license are available at https://www.dovepress.com/terms.php and incorporate the Creative Commons Attribution - Non Commercial (unported, v3.0) License.
By accessing the work you hereby accept the Terms. Non-commercial uses of the work are permitted without any further permission from Dove Medical Press Limited, provided the work is properly attributed. For permission for commercial use of this work, please see paragraphs 4.2 and 5 of our Terms.