")
Back to Journals » Journal of Inflammation Research » Volume 14
In vitro Phenotype Induction of Circulating Monocytes: CD16 and CD163 Analysis
Authors Karsulovic C , Tempio F, Lopez M, Guerrero J, Goecke A
Received 24 November 2020
Accepted for publication 7 January 2021
Published 26 January 2021 Volume 2021:14 Pages 191—198
DOI https://doi.org/10.2147/JIR.S292513
Checked for plagiarism Yes
Review by Single anonymous peer review
Peer reviewer comments 3
Editor who approved publication: Professor Ning Quan
Claudio Karsulovic,1,2 Fabian Tempio,3,4 Mercedes Lopez,3,4 Julia Guerrero,1 Annelise Goecke1,2
1Laboratorio de Inmunomodulación Neuroendocrina, Instituto de Ciencias Biomédicas, Facultad de Medicina, Universidad de Chile, Santiago, Chile; 2Seccion de Reumatología, Hospital Clínico Universidad de Chile, Universidad de Chile, Santiago, Chile; 3Laboratorio de Regulación e Inmunología del Cáncer, Facultad de Medicina, Universidad de Chile, Santiago, Chile; 4Instituto Milenio de Inmunología e Inmunoterapia, Facultad de Medicina, Universidad de Chile, Santiago, Chile
Correspondence: Annelise Goecke
Seccion de Reumatologia, Hospital Clínico Universidad de Chile, Universidad de Chile, Santos Dumont 999, Independencia, Santiago, Chile
Tel +56-229788000
Email [email protected]
Introduction: CD14 (monocyte differentiation antigen, LPS binding protein – endotoxin receptor) and CD16 (FcγRIII, Low-affinity receptor for IgG) define three subpopulations of circulating monocytes with different inflammatory and phagocytic capabilities. Contradictory reports exist regarding both in vivo monocyte phenotype-disease association and response of these circulating monocytes to in vitro stimulation. We analyzed phenotypic changes in circulating monocytes when stimulated with LPS (pro-inflammatory stimulus) and IL-4 (alternative inflammatory stimulus).
Methods: Mononuclear cells from nine healthy donors were extracted and studied for surface and intracellular markers using flow cytometry. PBMC were extracted using Ficoll technic and immediately analyzed using flow cytometry. Pro-inflammatory interleukin IL-1β and IL-6 were measured by intracellular cytometry. Mononuclear cells were stimulated using LPS and IL-4 as previously described. Changes against non-stimulated populations were statistically analyzed.
Results: Compared to non-stimulated and IL-4 stimulated monocytes, LPS-stimulated cells display a singular pattern of markers, with higher levels of intracellular IL-1β and IL-6 directly correlating with CD14+CD163- cell frequency and diminishing membrane CD163 fluorescence. CD14+CD16- classical monocytes show greater percentage of CD163- cells upon LPS stimulation. CD86 levels on monocytes’ surface did not change with LPS or IL-4 stimulation.
Conclusions and Discussion: We showed that CD14+CD16- classical monocytes display higher sensitivity to LPS stimulation, with more IL-1β and IL-6 levels than intermediate and non-classical monocytes. This subset also diminishes its CD163 levels on the membrane after LPS stimulation with a contemporary raise in CD163- cells, suggesting that classical monocytes preferentially acquire CD163- defined M1 characteristics upon in vitro LPS stimulation. Intermediate and non-classical monocytes respond with lower levels of interleukins and display surface proteins in an M2-type profile (CD163+).
Keywords: classical, intermediate, non-classical, monocytes, phenotype, stimulation
Introduction
In 2010, an international meeting sponsored by the IUIS (International Union of Immunological Societies) and the WHO (World Health Organization) proposed a subset classification for circulating monocytes.1 CD14 (monocyte differentiation antigen, LPS binding protein – endotoxin receptor) and CD16 (FcγRIII, Low-affinity receptor for IgG) were used to define three subpopulations of circulating monocytes with different attributes in terms of inflammatory protein expression and phagocytic capabilities.2 Classical monocytes (CD14++CD16-) are 80–90% percent of the entire monocyte population, express low levels of pro-inflammatory interleukins and high phagocytic characteristics. Intermediate monocytes (CD14+CD16+) are 5–15% of the total, express variable levels of inflammatory cytokines and intermediate phagocytic capacities. Non-classical monocytes (CD14+CD16++)3 – approximately 5% – express higher levels of pro-inflammatory cytokines and minor phagocytic characteristics. The latter two have been related to inflammatory conditions since they express higher levels of pro-inflammatory cytokines when stimulated with LPS.4,5
Recently, multiple studies have been published associating expansion or contraction of inflammatory or non-inflammatory monocyte subpopulations in diseases like rheumatoid arthritis, atherosclerosis, or sepsis.5–7 Intermediate monocytes have shown to be expanded in infectious and inflammatory/non-infectious diseases, however, many studies present inconsistent and contradictory data.8–10 In cardiovascular diseases, intermediate monocytes have been reported both expanded and contracted,8,11 meanwhile, classical monocytes show higher frequencies in atherosclerotic lesions despite inflammatory status.11,12
In 2017, Williams et al classified circulating monocytes from post-stroke patients, using CD86 (co-stimulatory T signal, typically described M1 Monocyte/Macrophage phenotype) and CD163 (High-affinity scavenger receptor typically related with M2 Monocyte/Macrophage phenotype) to group monocytes as M1 and M2 in an attempt to emulate macrophage classification. They showed that M1/M2 ratio (CD86/CD163 ratio) was higher in post-stroke patients.13,14 In other clinical entities like membranous glomerulopathy, similar results have been found using a broader group of markers defining M1 and M2 phenotypes.15
Therefore, it is necessary to establish a more accurate monocyte subpopulation classification system, pointing out that CD163 and CD16 proteins – which define current monocyte classification – do not always correlate with the presence of an inflammatory disease.4
Most of the available information about monocyte’s response to TLR stimulators in vitro are extracted from studies where monocytes are differentiated, using colony-stimulating factors, to a specific macrophage phenotype. Mukherjee et al showed that when intermediate and non-classical monocytes are stimulated with LPS express higher levels of IL-1β and TNF-α. However, under LPS stimulation the intermediate subset, also rises its IL-10 levels.5 In subsequent years, new results showed that classical monocytes are the most responsive subset to TLR2 and TLR4 agonists.16
Given the current SARS-Cov2 pandemic, there is a renewed interest in monocytes due to its proven participation in the “cytokine storm” and hemophagocytic lymphohistiocytosis-like syndrome that presents in some of these patients.17 Pandemic-time studies showed that non-classical and intermediate subsets are significantly decreased in acutely ill SARS-Cov2 patients.18 In addition to traditionally used CD14 and CD16 markers, other surface proteins have also been incorporated into the analysis including high-affinity scavenger receptor CD163 and co-stimulatory T signal protein CD86.14 Typically, CD163 protein has been associated with a more phagocytic and regulatory behavior, and higher levels have been found in neoplastic diseases.19 CD86 has been associated with an inflammatory response in circulating monocytes.20 Soluble CD163 (sCD163) has also been associated with neoplastic and chronic inflammatory diseases.21 All these recent results reinforce the notion that we are not being able to properly classify the response of monocytes to TLR agonists or in vivo infectious diseases; hence, it will be cumbersome to interpret circulating-monocyte behavior in other inflammatory pathologies.
Therefore, in this study, we analyze how each subset of monocytes in PBMC responds to a pro-inflammatory and an alternative inflammatory stimuli in vitro, without prior differentiation to macrophage linage and minimal manipulation. This approach allowed us to “simulate” monocyte response to stimuli when circulating before reaching target tissue and differentiate to macrophages.
Materials and Methods
Healthy Donors
We recruited nine healthy donors ranging from 26 to 40 years, five men and four women, from our facility. A medical evaluation, confirming the absence of chronic inflammatory or metabolic diseases, was performed by an internal medicine specialist before whole blood extraction. No medication used nor relevant medical history was reported. All participants provided informed consent, in accordance with the Declaration of Helsinki. The protocol was approved by both Medicine Faculty, Human Research Ethics Committee at Universidad de Chile, and Research Ethics Committee at Hospital Clinico Universidad de Chile (proy N° 191–2016; Acta N° 127).
PBMC Extraction and Flow Cytometry
Venous blood (30mL) was obtained by cubital venopunction from all participants using BD Vacutainer 10mL green cap heparin tubes (BD Biosciences, NY, US). PBMC Ficoll extraction was performed. PBMC were stained in duplicate with the following antibodies: V710-anti-CD3, V650-anti-CD19, FITC-A-anti-CD14, APC-H7-anti CD16, PERCP-Cy5.5-anti-CD86, and APC-A-anti-CD163 (BioLegend, CA, USA) at room temperature for 30 minutes. Finally, cells we fixed and permeabilized using a BD Cytofix/Cytoperm fixation/permeabilization Kit (BD Biosciences, NY, USA) and stained with V450-A-anti-IL-1β and Anti Human IL-6 PE (BioLegend, CA, USA)
LPS, IL-4 Stimulation and Flow Cytometry Analysis
To phenotype monocyte subsets, 1 × 10⁶/cells per tube were cultivated in RPMI 1640 (BD Biosciences, NY, US) medium mixed with 10% fetal bovine serum (BD Biosciences, NY, USA) in the presence or absence of lipopolysaccharide (1 µg/mL) (BD Biosciences, NY, US) or IL-4 (200 U/mL) (BD Biosciences, NY, US) for 2 h and 4 h respectively at 37°C in 5% CO2 and exposed to brefeldin A (BD Biosciences, NY, US) as described in previous studies.22 Then, the cells were washed, followed by staining with Cell Viability Kit (BD Biosciences, NY, USA), (cell viability pre- and post-LPS 98.4±1.2 vs 97.6±.2.0, p=0.4), V710-anti-CD3 (BioLegend, CA, USA), V650-anti-CD19 (BioLegend, CA, USA), FITC-A-anti-CD14, APC-H7-anti CD16, PERCP-Cy5.5-anti-CD86, APC-A-anti-CD163 (BioLegend, CA, USA). Subsequently, they were fixed, permeabilized and stained with V450-A-anti-IL-1β and Anti Human IL-6 PE (BioLegend, CA, USA). The monocyte subsets’ frequencies were assessed on a FACS LSRFortessa instrument (BD, Franklin Lakes, USÁ). The data were analyzed with FlowJo software (v7.6.1 and v10.7; TreeStar; Ashland, USA).
Statistical Analysis
Variables are shown as mean and standard deviation values. The one-way ANOVA test was used to evaluate the differences among groups. The correlation between variables was analyzed by the Spearman rank correlation test. All the analysis was done with GraphPad Prism version 6.01 software. P value <0.05 was considered statistically significant.
Results
Classical Monocytes Have Higher Intracellular Levels of IL-1β and Raise the Most of the IL-1β+ Cell Percentage Upon LPS Stimulation
Monocytes were gated using a negative selection of CD3 and CD19 cells and then CD14 and CD16 were used for the usual three-subset classification (Figure 1A). The percentage of classical monocytes was significantly higher than intermediate and non-classical monocytes in basal conditions as previously described (Figure 1B).1 Neither LPS nor IL4 induced significant changes in the percentage of the monocyte subsets (Figure 1B). In each subpopulation, the levels of IL-1β, measured as mean fluorescence intensity (MFI) and percentage of IL-1β+ monocytes, were higher when stimulated with LPS (Figure 1C and D). The magnitude of LPS-induced IL-1β MFI and count of IL-1β+ monocytes was significantly higher in classical versus non-classical monocytes (325±102 vs 126±24, p=0.006) and (84.8%±4.7% vs 41.9%±10.3%, p=0.007) (Figure 1C and D). These same results were obtained when intracellular IL-6 MFI values were measured (410±108 vs 209±43, p=0.008) (Supplementary Figure 1B).
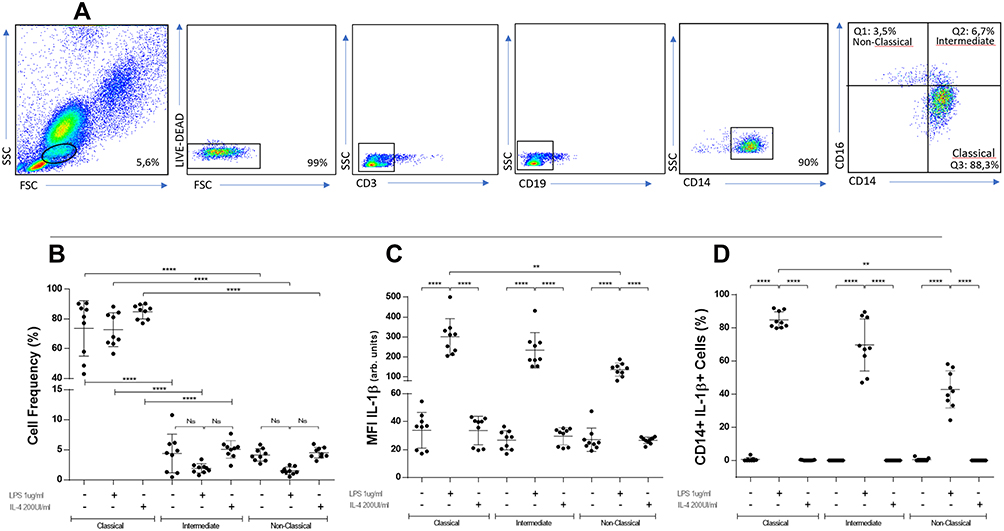 |
Figure 1 Gating strategy, flow cytometry analysis and intracellular IL-1β in CD14-CD16 defined subpopulations under different stimulation conditions. PBMC from healthy donors were stained with anti-CD3, anti-CD19, anti-CD14, anti-CD16, anti-CD86 and anti-CD163. Live cells were gated first by granularity and subsequently on CD3-CD19-CD14+ cells. Afterwards, the percentage of CD14++CD16-, CD14+CD16+ and CD14+CD16++ were determined by flow cytometry. Representative panels of non-stimulated cells (A). Classical monocytes are significantly higher than intermediate and non-classical monocytes in any condition (B) (****p≤0.0001). In each subpopulation, levels of IL-1β are higher when stimulated with LPS, being significantly higher in classical versus non-classical monocytes (C) (****p≤0.0001; **p≤0.006). When percentages of IL-1β+ cells are analyzed, LPS-stimulated monocytes show significantly higher values in classical versus non-classical monocytes (D) (****p≤0.0001; **p≤0.007). BD LSRFortessa cytometer. One-way ANOVA test used in all panels. |
CD14+CD163- Cells Rise in Response to LPS and Show Higher Levels of Intracellular IL-1β and IL-6
After negative selection of CD3 and CD19 cells, CD14 cells were then gated using CD163 marker finding two different subpopulations: CD14+ CD163+ and CD14+ CD163-, which show similar percentages (Figure 2A). When incubated with LPS, CD14+CD163- cell percentage raises to 96.1%±0.8% and there was a significant increase in pro-inflammatory cytokines (Figure 2C and D). However, CD14+CD163- cells contained significantly higher levels of IL-1β and IL-6 than CD14+CD163+ cells (298±112 vs 117±38.2, p=0.007) and (261.6±60 vs 144.5±57.2, p=0.04) (Figure 2C and D).
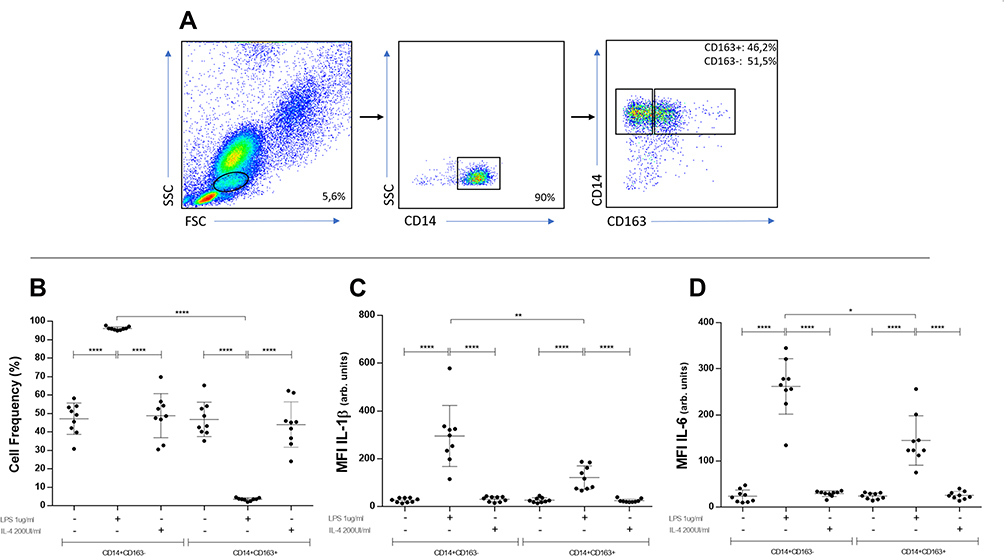 |
Figure 2 Gating strategy, flow cytometry analysis, intracellular IL-1β in CD14-CD163 defined subpopulations under different stimulation conditions. PBMC from healthy donors were stained with anti-CD3, anti-CD19, anti-CD14, anti-CD16, anti-CD86 and anti-CD163. Live cells were gated firstly by granularity and subsequently on CD3-CD19-CD14+ cells. Afterwards, the percentage of CD14+CD163- and CD14+CD163+ were determined by flow cytometry (A). CD163- cells count raises only when stimulated with LPS, reciprocally to CD163+ cells (B) (****p≤0.0001). CD163- cells contains significantly higher levels of IL-1β than CD163+ monocytes (C) (**p≤0.007) (****p≤0.0001). When IL-6 is analyzed, CD163- cells contains also higher levels than CD163+ when stimulated with LPS (D) (*p≤0.04) (****p≤0.0001). BD LSRFortessa cytometer. One-way ANOVA test used in all panels. |
Changes in CD163 Marker Upon LPS Stimulation are Mainly Seen in CD14++CD16- Classical Monocytes
When cells were stimulated with LPS there was an increase in CD14+CD163-/CD14+CD163+ ratio in classical monocytes as compared to intermediate and non-classical (82.4±36.2 vs 1.36±0.53 vs 2.48±1.2, p=0.0001) (Figure 3A). In terms of MFI, CD163 changed significantly in all subsets after LPS stimulation versus non-stimulated conditions (Figure 3B). Interestingly, in classical monocytes, unlike intermediate and non-classical monocytes, CD163 MFI values fell after LPS, reaching a mean value fold-change of 3.365 times less compared to non-stimulated cells (Figure 3C). No changes were observed after stimulation with IL-4 (Figure 3A–C). Since CD163 showed evident changes after LPS stimulation, we analyzed CD86 MFI values in every subset. Even when CD86 levels were higher in non-classical monocytes versus classical monocytes, no variations were seen between stimulated and non-stimulated conditions (Supplementary Figure 1A).
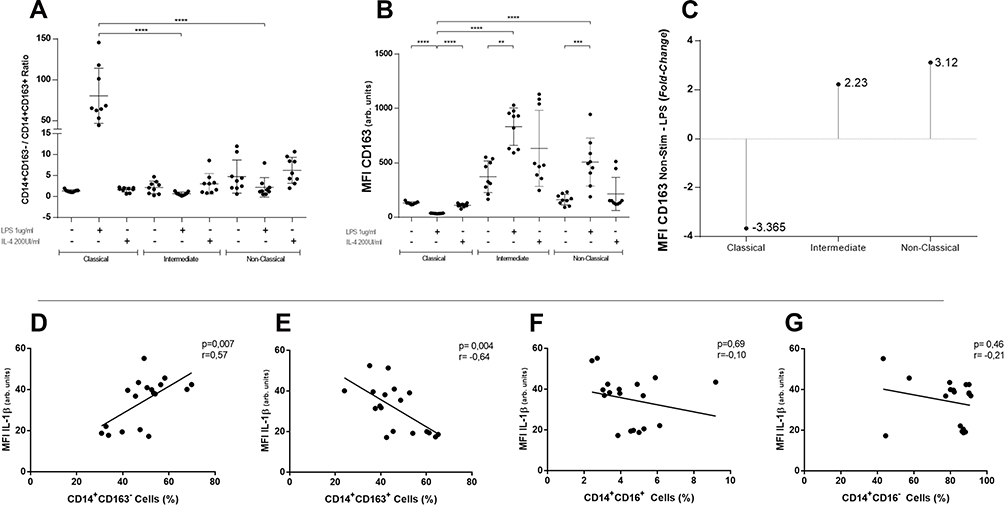 |
Figure 3 CD163 analysis in each subset and correlations of CD163 and CD16 defined subpopulations with intracellular IL-1β. CD14+CD163-/CD14+CD163+ ratio was graphed in each traditional subset. Only in classical monocytes stimulated with LPS, CD163-/CD163+ ratio raises (A) (****p≤0.0001). CD163 median fluorescence intensity changes significantly after LPS stimulation in classical, intermediate, and non-classical monocytes (B) (****p≤0.0001; ***p≤0.003; **p≤0.006). Folds of change of CD163 fluorescence intensity after LPS compared to non-stimulated condition. Classical monocytes diminish its mean MFI CD163 values by 3.365 times (C). In (D and E), intracellular IL-1β correlates positively and significantly with CD163- cell percentage and negatively with CD163+. In (F and G), IL-1β does not correlate with CD16+ and CD16- cells percentages. BD LSRFortessa cytometer. One-way ANOVA test used in panels (A–C). Spearman rank correlation test (n=18) in panels (D–G). |
Only CD163 and Not CD16 Shows a Correlation with IL-1β and IL-6 Levels After LPS Stimulation
Knowing that CD163 levels changed in all subsets but diminished only in classical monocytes, we aimed to analyze separately the levels of IL-1β and IL-6 after LPS stimulation versus positivity to either CD163 or CD16 MFI values (Figure 3D–G). CD14+CD163- cells’ percentage showed positive correlation with IL-1β levels (r=0.57, p=0.007) and the opposite result was seen for CD14+CD163+ cells (r=−0.64, p=0.004) (Figure 3D and E). There was no correlation between IL-1β levels and CD16± cells’ percentage (Figure 3F and G). When this analysis was repeated for intracellular IL-6, similar results were obtained, finding correlation only with CD14+CD163± cells’ percentage (Supplementary Figure 1C–F).
Discussion
During the last years, numerous studies have looked for an association between certain monocyte subpopulations and prevalent inflammatory and metabolic diseases. Autoimmune diseases and atherosclerosis as metabolic dysregulation are the most usually studied conditions; nevertheless, their correlation with expansion or contraction of these subpopulations has been difficult to study and not completely reproducible.16 Many reasons for the latter have been proposed. One of the most frequently claimed explanations is how difficult is to separate three “different” subpopulations using only a small group of markers.12
Thomas et al were able to demonstrate using tSNE with multiple different parameters, that a group of at least 12 commonly available markers, needed to be used to perform positive and negative selection in order to obtain a proper separation.12 Even when these markers help to better classify circulating monocytes, this approach is expensive and time consuming.
When these monocyte subpopulations are analyzed in vitro, their response to stimuli behaves more erratically. Most of the available studies are prone to point to intermediate monocyte subpopulation as the most predictable in terms of response to LPS. Many times, intermediate monocytes are presented as a transition subpopulation with oscillations on percentages attributed to inflammatory nature of each pathology.2,7 However, until today, there is no clear correlation between any subset rate changes and clinical course in inflammatory or non-inflammatory diseases.
In this study, we worked with PBMC Ficoll extraction method, a conservative and efficient technic to process cells with minimum manipulation and in a cost-effective way, that mimics monocytes’ conditions since they circulate with other mononuclear cells in vivo. We showed that in basal conditions, IL-1β and IL-6 MFI levels are similar in all monocyte subsets. However, classical monocytes respond with higher levels of pro-inflammatory cytokines to LPS stimuli (Figure 1C and Supplementary Figure 1B); even more, LPS induced a 32% more intracellular IL-1β as compared to intermediate and 163% more than non-classical subsets (Figure 1B). These results are in the line with increasingly frequent reports where classical monocytes are raised in acute inflammatory conditions.
In our experiments, CD163 but not CD86 behaved as a better marker to response to LPS stimulation, both in terms of changes in cell percentage and mean fluorescence intensity. Upon LPS stimulation CD163 seems to withdraw from classical monocyte subset, which raises the question of whether it could be a good marker to, at least in vitro, improve response-to-stimuli prediction of monocyte subsets. In our case, we were able to show not only that CD163- cells reside mainly in the classical subset but also contain higher levels of traditionally inflammatory cytokines and correlate directly with its values. CD163 has been associated with M2 phenotype in circulating monocytes and mainly to neoplastic diseases when analyzed in vivo, allowing to propose that the fall in its values could be associated with a particular M1 compromise of classical monocytes. Whether intermediate and non-classical monocytes respond less, differently, or just need more time to raise intracellular cytokine levels is a question out of the range of this investigation but a remarkably interesting matter yet to clarify.
Therefore, these results suggest that incorporating the study of CD163 as a marker could help to better identify a more responsive subset of monocytes in terms of cytokine production to LPS stimuli which in our case, correspond to CD14+CD16-CD163- cells.
More studies are needed to understand if this subpopulation correlates better with the presence of autoimmune or inflammatory conditions and also, to know if this response is similar to other agents, like viral, regulatory, or another alternative inflammatory stimulus. It would also be interesting to contrast these results with the use of more markers and multiparametric analysis.
Conclusion
Monocytes have been traditionally difficult to classify in phenotypes mainly because of two main aspects: Unavailability of transcription markers to define their specific commitment to a subset and complex “life cycle” where changes in markers’ expression occur constantly. As a result, reports about which phenotype are more active in a specific disease has been contradictory until today. In vitro, stimulation with common inflammatory stimuli as LPS or IL-4 has also been difficult to systematize. Previous to further studies of monocytes in chronic inflammatory diseases, we aimed to thoroughly analyze the behavior of commonly used markers (CD16, CD163, and CD86). Surprisingly, we were able to clarify two main issues: classical monocytes respond with higher levels of traditionally inflammatory cytokines to LPS, and CD163 is useful to select a more “active” group of cells – in terms of cytokine production – upon LPS stimulation. More studies are needed to understand if this subpopulation better correlates with the presence of autoimmune or inflammatory conditions. It is also of interest to know if this response is similar to other stimuli like viral, regulatory, or another alternative inflammatory stimulus. Likewise, will be noteworthy to contrast these results with the usage of more markers and multiparametric analysis.
Ethics Approval
Informed consent was approved by both Medicine Faculty, Human Research Ethics Committee at Universidad de Chile, and Research Ethics Committee at Hospital Clinico Universidad de Chile (proj. N° 191-2016; Acta N° 127).
Consent for Publication
All participants in the study provided informed consent. Available upon requirement.
Author Contributions
All authors contributed to data analysis, drafting or revising the article, have agreed on the journal to which the article will be submitted, gave final approval of the version to be published, and agree to be accountable for all aspects of the work.
Funding
Funds were obtained at Investigation Support Office (OAIC) at Hospital Clinico de la Universidad de Chile.
Disclosure
The authors report no conflicts of interest for this work.
References
1. Ziegler-Heitbrock L, Ancuta P, Crowe S, et al. Nomenclature of monocytes and dendritic cells in blood. Blood. 2010;116(16):e74–e80. doi:10.1182/blood-2010-02-258558
2. Ziegler-Heitbrock L. Blood monocytes and their subsets: established features and open questions. Front Immunol. 2015;6:423. doi:10.3389/fimmu.2015.00423
3. Burbano C, Vasquez G, Rojas M. Modulatory effects of CD14+CD16++ monocytes on CD14++CD16- monocytes: a possible explanation of monocyte alterations in systemic lupus erythematosus. Arthritis Rheumatol. 2014;66(12):3371–3381. doi:10.1002/art.38860
4. Rana AK, Li Y, Dang Q, Yang F. Monocytes in rheumatoid arthritis: circulating precursors of macrophages and osteoclasts and, their heterogeneity and plasticity role in RA pathogenesis. Int Immunopharmacol. 2018;65:348–359. doi:10.1016/j.intimp.2018.10.016
5. Mukherjee R, Kanti Barman P, Kumar Thatoi P, Tripathy R, Kumar Das B, Ravindran B. Non-classical monocytes display inflammatory features: validation in sepsis and systemic lupus erythematous. Sci Rep. 2015;5:13886. doi:10.1038/srep13886
6. Rossol M, Kraus S, Pierer M, Baerwald C, Wagner U. The CD14(bright) CD16+ monocyte subset is expanded in rheumatoid arthritis and promotes expansion of the Th17 cell population. Arthritis Rheum. 2012;64(3):671–677. doi:10.1002/art.33418
7. Leers MPG, Stockem C, Ackermans D, et al. Intermediate and nonclassical monocytes show heterogeneity in patients with different types of acute coronary syndrome. Cytometry A. 2017;91(11):1059–1067. doi:10.1002/cyto.a.23263
8. Wildgruber M, Czubba M, Aschenbrenner T, et al. Increased intermediate CD14(++)CD16(++) monocyte subset levels associate with restenosis after peripheral percutaneous transluminal angioplasty. Atherosclerosis. 2016;253:128–134. doi:10.1016/j.atherosclerosis.2016.09.002
9. SahBandar IN, Ndhlovu LC, Saiki K, et al. Relationship between circulating inflammatory monocytes and cardiovascular disease measures of carotid intimal thickness. J Atheroscler Thromb. 2020;27(5):441–448. doi:10.5551/jat.49791
10. Graziano F, Vicenzi E, Poli G. Plastic restriction of HIV-1 replication in human macrophages derived from M1/M2 polarized monocytes. J Leukoc Biol. 2016;100(5):1147–1153. doi:10.1189/jlb.4AB0316-158R
11. Ammirati E, Moroni F, Magnoni M, et al. Circulating CD14+ and CD14(high)CD16- classical monocytes are reduced in patients with signs of plaque neovascularization in the carotid artery. Atherosclerosis. 2016;255:171–178. doi:10.1016/j.atherosclerosis.2016.10.004
12. Thomas GD, Hamers AAJ, Nakao C, et al. Human blood monocyte subsets: a new gating strategy defined using cell surface markers identified by mass cytometry. Arterioscler Thromb Vasc Biol. 2017;37(8):1548–1558. doi:10.1161/ATVBAHA.117.309145
13. Fukui S, Iwamoto N, Takatani A, et al. M1 and M2 monocytes in rheumatoid arthritis: a contribution of imbalance of M1/M2 monocytes to osteoclastogenesis. Front Immunol. 2017;8:1958. doi:10.3389/fimmu.2017.01958
14. Williams H, Cassorla G, Pertsoulis N, et al. Human classical monocytes display unbalanced M1/M2 phenotype with increased atherosclerotic risk and presence of disease. Int Angiol. 2017;36(2):145–155. doi:10.23736/S0392-9590.16.03661-0
15. Hou J, Zhang M, Ding Y, et al. Circulating CD14(+)CD163(+)CD206(+) M2 monocytes are increased in patients with early stage of idiopathic membranous nephropathy. Mediators Inflamm. 2018;2018:5270657. doi:10.1155/2018/5270657
16. Boyette LB, Macedo C, Hadi K, et al. Phenotype, function, and differentiation potential of human monocyte subsets. PLoS One. 2017;12(4):e0176460. doi:10.1371/journal.pone.0176460
17. Karsulovic C, Lopez M, Tempio F, Guerrero J, Goecke A. mTORC inhibitor sirolimus deprograms monocytes in “cytokine storm” in SARS-CoV2 secondary hemophagocytic lymphohistiocytosis-like syndrome. Clin Immunol. 2020;218:108539. doi:10.1016/j.clim.2020.108539
18. Gatti A, Radrizzani D, Vigano P, Mazzone A, Brando B. Decrease of non-classical and intermediate monocyte subsets in severe acute SARS-CoV-2 infection. Cytometry A. 2020;97(9):887–890. doi:10.1002/cyto.a.24188
19. Fogg KC, Miller AE, Li Y, et al. Ovarian cancer cells direct monocyte differentiation through a non-canonical pathway. BMC Cancer. 2020;20(1):1008. doi:10.1186/s12885-020-07513-w
20. Motz K, Lina I, Murphy MK, et al. M2 macrophages promote collagen expression and synthesis in laryngotracheal stenosis fibroblasts. Laryngoscope. 2020. doi:10.1002/lary.28980
21. Krijgsman D, De Vries NL, Andersen MN, et al. CD163 as a biomarker in colorectal cancer: the expression on circulating monocytes and tumor-associated macrophages, and the soluble form in the blood. Int J Mol Sci. 2020;21(16).
22. Foster B, Prussin C, Liu F, Whitmire JK, Whitton JL. Detection of intracellular cytokines by flow cytometry. Curr Protoc Immunol. 2007;Chapter 6:Unit 6 24. doi:10.1002/0471142735.im0624s78
 © 2021 The Author(s). This work is published and licensed by Dove Medical Press Limited. The full terms of this license are available at https://www.dovepress.com/terms.php and incorporate the Creative Commons Attribution - Non Commercial (unported, v3.0) License.
By accessing the work you hereby accept the Terms. Non-commercial uses of the work are permitted without any further permission from Dove Medical Press Limited, provided the work is properly attributed. For permission for commercial use of this work, please see paragraphs 4.2 and 5 of our Terms.
© 2021 The Author(s). This work is published and licensed by Dove Medical Press Limited. The full terms of this license are available at https://www.dovepress.com/terms.php and incorporate the Creative Commons Attribution - Non Commercial (unported, v3.0) License.
By accessing the work you hereby accept the Terms. Non-commercial uses of the work are permitted without any further permission from Dove Medical Press Limited, provided the work is properly attributed. For permission for commercial use of this work, please see paragraphs 4.2 and 5 of our Terms.