")
Back to Journals » Pathology and Laboratory Medicine International » Volume 6
In vitro determination of hemoglobin A1c for diabetes diagnosis and management: technology update
Authors English E, Milosevich E, John WG
Received 21 March 2014
Accepted for publication 14 April 2014
Published 16 July 2014 Volume 2014:6 Pages 21—31
DOI https://doi.org/10.2147/PLMI.S48403
Checked for plagiarism Yes
Review by Single anonymous peer review
Peer reviewer comments 3
Emma English,1 Elise T Milosevich,1 W Garry John2
1School of Medicine, University of Nottingham, Royal Derby Hospital, Derby, United Kingdom; 2Department of Clinical Biochemistry, Norfolk and Norwich University Hospital, Norwich, United Kingdom
Abstract: It is fascinating to consider the analytical improvements that have occurred since glycated hemoglobin was first used in routine clinical laboratories for diabetes monitoring around 1977; at that time methods displayed poor precision, there were no calibrators or material with assayed values for quality control purposes. This review outlines the major improvements in hemoglobin A1c (HbA1c) measurement that have occurred since its introduction, and reflects on the increased importance of this hemoglobin fraction in the monitoring of glycemic control. The use of HbA1c as a diagnostic tool is discussed in addition to its use in monitoring the patient with diabetes; the biochemistry of HbA1c formation is described, and how these changes to the hemoglobin molecule have been used to develop methods to measure this fraction. Standardization of HbA1c is described in detail; the development of the IFCC Reference Measurement Procedure for HbA1c has enabled global standardization to be achieved which has allowed global targets to be set for glycemic control and diagnosis. The importance of factors that may interfere in the measurement of HbA1c are highlighted.
Keywords: glycated hemoglobin, HbA1c, IFCC
Introduction
Diabetes mellitus is one of the most common noncommunicable diseases globally, affecting an astounding 382 million people worldwide in 2013, and estimated to increase to 592 million by 2035. Predominantly, affected individuals are between the ages of 40–59 years and 80% of the affected population are in low- and middle-income countries. However, the number of individuals with type 2 diabetes continues to rise in every country.1
The Expert Committee on the Diagnosis and Classification of Diabetes Mellitus refers to diabetes mellitus as a group of metabolic disorders characterized by the presence of hyperglycemia due to defective insulin secretion, insulin action, or both.2 Additionally, the World Health Organization (WHO) describes diabetes mellitus as a metabolic disorder with heterogeneous etiologies determined by chronic hyperglycemia and disturbance to carbohydrate, protein, and fat metabolism, which induces the risk of microvascular damage.3 The long-term complications of diabetes are extensive, with retinopathy leading to vision loss, nephropathy leading to chronic kidney disease, and peripheral neuropathy being the most common microvascular complications. In addition, cardiovascular disease, peripheral artery disease, and stroke are common macrovascular complications.
The American Diabetes Association further classifies diabetes mellitus into four categories: type 1, type 2, gestational, and other specific types.2 These classifications replaced the outdated terms “insulin-dependent diabetes mellitus”, and “noninsulin-dependent diabetes mellitus”, which divided patients according to treatment rather than the etiology of their disease process. Type 1 diabetes mellitus is a disorder that arises from the destruction of the β-cells of the islets of Langerhans through autoimmune action or idiopathic mechanisms. The most common form of diabetes is type 2 diabetes mellitus, a heterogeneous group ranging from primarily insulin resistance and a relative lack of insulin action, through to a defect in secretion with concomitant insulin resistance. The other specific types include genetic defects, drug induced, infection related, endocrinopathies, and various others. Gestational diabetes is a carbohydrate intolerance resulting in hyperglycemia of variable severity with onset or first recognition during pregnancy.4
Hemoglobin A1c (HbA1c) as a clinical tool
In 1969, Rahbar et al5 made the connection between elevated levels of HbA1c and diabetes, and further studies investigated this link in a number of small patient cohorts.6,7 Early studies indicated that monitoring of HbA1c levels allowed changes in therapy and subsequent reduction of measured HbA1c levels, but did not show that this improved patient outcome.8 However, there was an evident lack of standardization in these studies, both in terms of analytical performance and clinical utility. There were no uniform HbA1c target values for maintaining blood glucose control; accordingly, there was no consensus on whether strict glucose control was of benefit in improving patient outcomes. The increase in popularity of HbA1c as a marker of glycemic control came with the publication of the Diabetes Control and Complications Trial (DCCT)9 and the UK Prospective Diabetes Study (UKPDS)10 studies. These large longitudinal studies, involving people with type 1 and type 2 diabetes, respectively, addressed the question of whether tight control of glucose levels in these patients resulted in a decrease in complication rates.
The DCCT study was a multicenter, randomized clinical trial involving 1,441 people with type 1 diabetes. The study was designed to assess if intensive therapy could be used to prevent or delay the progression of early vascular or neurological complications, using retinopathy as the primary study outcome. The treatment goal for the conventional therapy group was an absence of symptoms attributable to glycosuria or hyperglycemia, whereas the intensive therapy group targets were near-normal glucose levels.9
The primary outcome measure of the study was a sustained change in levels of retinopathy; over the mean follow-up period of 6 years, the intensive therapy reduced the adjusted mean risk by 76% (P<0.001).9
The Epidemiology of Diabetes Interventions and Complications (EDIC) study11 followed the patients enrolled in the DCCT study for a further 20 years with no attempt to formally continue the original therapy regimes of the DCCT study, although mean HbA1c values have converged between the two groups as a result of the change in practice brought about by the results of the original trial. Data from the EDIC follow-on study showed that the reduction in risk for any fatal and nonfatal cardiovascular disease event (including confirmed angina, or the need for coronary artery revascularization) was 42% in intensive versus conventional treatment streams and 5% in fatal and nonfatal myocardial infarction and stroke.11
The UKPDS study recruited 3,867 newly diagnosed patients with type 2 diabetes who were randomized by weight, then into conventional and intensive therapy regimes.10 The conventional regime aimed to avoid marked hyperglycemia (fasting plasma glucose [FPG] >15 mmol/L and/or symptoms of hyperglycemia) and was primarily based on diet and lifestyle advice alone. The intensive therapy group aimed to achieve an FPG of <6.0 mmol/L with treatment using insulin or sulfonylureas. Unlike the DCCT study, a target value of HbA1c was not assigned in either of the therapy groups.
In regards to the study endpoints, the reduction in microvascular complications was the most significant, with a reduction of 25% in the intensive therapy group, predominantly attributable to retinopathy (two-stage progression of disease).10
After the completion of the UKPDS, the patients continued to be monitored in a follow-up study to determine if there were longer-term effects of the therapy regimes.12 No attempt was made to maintain the initial therapy randomization; patients were returned to routine care with clinic follow-ups for the first 5 years and questionnaires for the following 5 years. The between-group differences in HbA1c levels were lost within the first year of follow-up, but, overall, the levels decreased over the time of the post-trial study. This may, in part, be due to the implementation of guidelines for stricter glycemic control in diabetic patients that arose as an outcome to the original study. Results of the follow-up showed a 24% risk reduction in microvascular complications, 15% risk reduction in myocardial infarction (MI), and 13% risk reduction for all-cause mortality. This risk reduction despite the loss in differences of HbA1c has been termed the “legacy effect”. When the relative risk profiles for micro- and macrovascular complications are compared, they show a significantly different profile; higher HbA1c values contribute to a greater proportional risk in cases of microvascular disease, but a wider range of HbA1c (including lower “nondiabetic”) values contribute to increased risk in macrovascular disease. The data from these two seminal trials showed that early, intensive therapy could significantly reduce the risk of a range of complications, even after the initial therapy has been discontinued. Accordingly, these studies permitted the establishment of precise target HbA1c values for treatment goals.
HbA1c as a diagnostic tool
An International Expert Committee, appointed by the American Diabetes Association (ADA), the International Diabetes Federation (IDF), and the European Association for the Study of Diabetes (EASD) published a report in 2009 recommending the use of glycated hemoglobin (HbA1c) for the diagnosis of diabetes.13 HbA1c reflects average plasma glucose over the previous 8–12 weeks, providing a precise and consistent indicator of circulatory glucose levels, allowing for accurate assessment of glycemic control as well as the potential to act as a diagnostic marker of type 2 diabetes. Based on the evidence that HbA1c level correlates with adverse disease outcomes and the fact that HbA1c targets are used for patient treatment, use of HbA1c as a diagnostic tool seemed a logical progression. The committee proposed a diagnostic cut-off point of 48 mmol/mol (6.5%) HbA1c.13
In 2011, the WHO also endorsed the use of HbA1c for the diagnosis of type 2 diabetes, stating that HbA1c can be used as a diagnostic test provided the following conditions are met:
- Stringent quality assurance tests are in place
- Methods are standardized to the International Reference Measurement Procedure
- An HbA1c cut point of 48 mmol/mol (6.5%) is recommended for diagnosing diabetes.3
In addition the WHO suggest that a diagnosis of diabetes (when based on a glucose criteria) is not excluded if Hba1c is below 48 mmol/mol (6.5%).3
There are numerous advantages to HbA1c compared to glucose testing: HbA1c can be performed at any time throughout the day and does not require the patient to fast, and HbA1c can avoid the day-to-day variability of glucose values, therefore making it the preferred diagnostic test.14–16 There are, however, various limitations to the use of HbA1c for the diagnosis of diabetes linked to several physiological and pathological conditions that influence HbA1c concentration. HbA1c cannot be used for the diagnosis of diabetes in children, for the diagnosis of gestational diabetes, or for type 1 diabetes.17 Additionally, HbA1c should not be used for the diagnosis or monitoring of patients with diabetes with certain hemoglobinopathies or with disorders that affect red cell lifespan.18
Biochemistry of HbA1c
The International Federation of Clinical Chemistry and Laboratory Medicine (IFCC) committee on Nomenclature, Properties and Units defined HbA1c as “Haemoglobin beta chain(Blood)-N-(1-deoxyfructos-1-yl)haemoglobin beta chain; substance fraction”.19
This definition describes HbA1c as modified hemoglobin, with a stable adduct of glucose (covalently linked) to the N-terminal valine of the β-chain. Normal adult hemoglobin consists predominantly of HbA (α2β2), HbA2 (α2δ2), and fetal hemoglobin ([HbF] α2γ2) (97%, 2.5%, and 0.5% of total hemoglobin, respectively). About 6% of total HbA is termed HbA1, which in turn is made up of HbA1a1, HbA1a2, HbA1b, and HbA1c.20 These fractions are defined by their electrophoretic and chromatographic properties, which differ slightly from those of the major component HbA0, despite the amino acid sequences of HbA1 and HbA0 being identical. HbA1c is the most abundant of these minor fractions and comprises approximately 5% of the total HbA1 fraction. Structural and chemical investigations elucidated that glucose, in the open chain format, binds to the N-terminal to form an aldimine (Schiff base) before undergoing an Amadori rearrangement to form a more stable ketoamine.21–23 This is a nonenzymatic process that occurs continuously in vivo.24 Glycation of hemoglobin occurs predominantly between glucose and the N-terminal valine of the β-chain of hemoglobin to form HbA1c.25 In individuals with poorly controlled diabetes, the amounts of these glycated hemoglobins are greater than in the healthy population.
Methods of HbA1c analysis
The measurement of HbA1c is based on changes that occur following glycation of the hemoglobin molecule; glycation of the N-terminal residue changes its structure and decreases the positive charge of HbA. Methods make use of this difference in charge between HbA1c and HbA0, or the structural differences between glycated and nonglycated forms of hemoglobin. The slight difference in isoelectric point between HbA1c and HbA0 allows them to be separated by charge, or the presence of the glucose adduct on HbA1c allows for the separation by structural difference.26 Thus, methods of HbA1c analysis can be divided into two categories: methods based on the charge differences and methods based on the structural differences.
Methods based on charge differences
Cation-exchange chromatography
When glucose binds at the beta N-terminal valine of hemoglobin to form HbA1c, the hemoglobin molecule undergoes a conformational change that results in the molecule presenting with an extra negative charge. This results in HbA1c and HbA0 having a subtle difference in their isoelectric points, allowing them to be separated on this basis.
Cation-exchange chromatography allows for the separation of hemoglobin species based on the difference in isoelectric point between HbA1c and HbA0. Separation is achieved by utilizing differences in ionic interactions between the cation exchange group on the column resin surface and the hemoglobin components in the sample. Ion-exchange chromatographic methods include procedures ranging from those that employ disposable microcolumns through to high-performance automated systems that also quantify several minor hemoglobin species.
Whole-blood samples are diluted with a hemolysis reagent to break open the red blood cells and release the hemoglobin for analysis. The hemolysate is then injected via an autosampler into the analytical column of known volume. A programmed buffer gradient of increasing ionic strength (the mobile phase) is delivered to the column and the hemoglobins are then separated based on their ionic interactions with the column material. The stationary phase surface displays negatively charged functional groups that interact with positively charged cations in the sample; physical characteristics such as surface charge, as well as the presence of hydrophilic and hydrophobic groups, determine the rate at which each hemoglobin species migrates through the column. More highly charged molecules are more tightly bound to the resin, and so travel slowly and are eluted later, moderately charged molecules equilibrate between the resin and the moving buffer more readily, and less charged molecules bind less strongly to the resin, equilibrate with the moving buffer more readily, and so travel rapidly and are eluted sooner. Upon elution from the column, the separated hemoglobins pass through the spectrophotometric detector at different rates where detection occurs via measured changes in the absorbance at a wavelength of 415 nm.
Capillary electrophoresis
Capillary electrophoresis uses the principle of liquid-flow capillary electrophoresis in free solution. With this technique, charged molecules are separated by their electrophoretic mobility in an alkaline buffer with a specific pH. Separation also occurs according to the electrolyte pH and electro-osmotic flow. The separation of the different hemoglobin fractions takes place in silica capillary tubes of internal diameter <25 μm, and the migration is performed at a high voltage (eg, 9,800 volts) under tight temperature control using a Peltier device. The high voltages allow for short run times and the high surface-to-volume ratio in the capillary tube allows for good dissipation of the heat generated. The hemoglobins are directly detected at a specific absorption wavelength of 415 nm at the cathodic end of the capillary using an optical detector. Current automated methods use a very small sample size and offer the potential for precise separation of different hemoglobin fractions.27
Methods based on structural differences
Immunoassay
The immunoassay technique is based on the binding of antibodies targeted against the β-N-terminal glycated tetrapeptide or hexapeptide group. Assay design is variable, but, in principle, an excess of antibodies, which bind specifically to HbA1c, is added to a hemolyzed sample. After binding to the HbA1c the excess antibodies agglutinate and the resultant turbidity from the immunocomplexes is measured using a turbidimeter or nephelometer. In parallel, the total hemoglobin concentration is measured bichromatically in the pre-incubation phase.28,29 There are a number of commercial assays that are applicable to a broad variety of general chemistry analyzers. Immunochemical assays are not affected by problems related to electrical charge and can be adapted easily for use in the routine medical laboratory. However, they all suffer with the general drawback of immunochemistry, ie, nonlinear calibration, which requires multilevel calibration. As stability of the reagent is limited (variably from test to test), relatively frequent recalibration is needed. Also, to quantitate HbA1c, as a ratio, total hemoglobin is measured separately, using a different analytical principle that introduces additional uncertainty to the outcome.
Affinity chromatography
Affinity chromatography is a separation method that uses a biologically/structurally related agent, or “affinity ligand”, as a stationary phase to selectively retain analytes or to study biological interactions. The affinity ligand can consist of a large variety of binding agents, for example, affinity separation of glycated hemoglobin typically utilizes m-aminophenylboronic acid and depends on a specific interaction between the glucose on glycated hemoglobin and the immobilized boronic acid.
A whole-blood sample hemolysate is applied to the affinity column and the glycated hemoglobin that contains coplanar cis-diol groups interacts strongly with boronic acid immobilized on an agarose gel. Ionic and hydrophobic forces also contribute to this interaction. The nonglycated hemoglobin elutes directly off the column with the first buffer. After elution of the nonglycated fraction, bound hemoglobin (the glycated fraction) can be dissociated by the use of a counter-ligand, which effectively competes with bound glycated hemoglobin for the boronic acid sites on the gel surface. The absorbance of each of the hemoglobin fractions can be measured at 415 nm and the ratio determined. The results are expressed as a ratio of glycated to total hemoglobin.
Enzymatic assay
Enzymatic assays utilize proteases to cleave the β-chain of hemoglobin to liberate peptides that are then reacted in a two-step reaction to quantify HbA1c. After lysis, the whole-blood samples are subjected to extensive proteolytic digestion; this process releases amino acids, including glycated valines, from the hemoglobin β-chains. In the direct enzymatic HbA1c assay, glycated valines serve as substrates for a specific recombinant fructosyl valine oxidase enzyme. The recombinant fructosyl valine oxidase specifically cleaves N-terminal valines and produces hydrogen peroxide in the presence of selective agents. This, in turn, is measured using a horseradish peroxidase catalyzed reaction and a suitable chromagen. The signal produced in the reaction is used to directly report the %HbA1c of the sample using a suitable linear calibration curve expressed in %HbA1c. Enzymatic assays include oxidizing agents in the lysis buffer that react with the whole-blood sample to eliminate low-molecular-weight and high-molecular-weight signal-interfering substances. In parallel, the total hemoglobin concentration is measured photometrically.30
Point-of-care testing (POCT) devices
The use of POCT has increased dramatically over recent years with the advantage of more timely availability of results and the subsequent expedient modification of therapy or interventions.31 There are several POCT devices available for the measurement of HbA1c that are generally based on either affinity separation or immunoassay techniques. Performance of these analyzers is variable, with some performing as well as mainstream larger analyzers and some with poor performance. In a recent study, six out of eight POC devices tested did not meet accepted analytical performance criteria and all showed considerable variability depending on the reagent lot numbers used.32
Standardization of HbA1c analysis
The need for standardization
Early HbA1c methods, which were introduced into routine practice in the late 1970s, produced significantly different results with between-laboratory coefficient of variation (CV) values of 11.2%–20.1% observed.33,34 The disparate results obtained were because of the range of methods being used by laboratories, the lack of standardization, and lack of a primary reference material. Although the new generation of HbA1c methods now demonstrate a degree of precision that could not be imagined 30 years ago, comparison of results from different laboratories would remain, at best, difficult – or, more likely, impossible – if not for standardization schemes.
Harmonization
The publication of the DCCT accelerated the need for the standardization of HbA1c methods in order to implement safe and accurate patient monitoring. Early nationally based systems include the National Glycohemoglobin Standardization Program (NGSP), the Japan Diabetes Society/Japanese Society for Clinical Chemistry program, and the Swedish standardization program. These national programs achieved HbA1c harmonization but, due to the variety of approaches used, still yielded variable results.
IFCC standardization and Reference Measurement Procedure (RMP)
While these systems provide excellent harmonization of HbA1c values, they cannot replace uniform worldwide standardization anchored on a metrologically sound international reference measurement system comprising:
- a clear definition of the analyte based on its molecular structure;
- a primary reference material containing the analyte in a pure form; and
- a validated reference method that specifically measures the analyte in human samples.35
In 1995, the IFCC formed its Working Group on HbA1c Standardization with the objective to develop a reference measurement system for the measurement of HbA1c based on these metrological principles.36 The IFCC Working Group decided to base the standardization of HbA1c on the stable adduct of glucose to the N-terminal amino group of the β-chain of HbA0 (N-[1-deoxyfructosyl] hemoglobin). The rationale was that HbA1c is biochemically well characterized; is the major form of glycated hemoglobin in human blood; and most of the commercial glycated hemoglobin tests claim to measure this fraction. Even affinity chromatography methods can be standardized against an HbA1c comparison method since there is a close correlation between the total glycated hemoglobin measured by affinity chromatography and HbA1c.
The RMP is based on the enzymatic cleavage of the intact hemoglobin molecule with endoproteinase Glu-C to obtain the β-N-terminal hexapeptides of HbA1c and HbA0 (thus avoiding the heterogeneity created by modifications of other glycation sites of the hemoglobin molecule). The peptides are then separated by reverse-phase high-performance liquid chromatography, and quantified by electrospray ionization mass spectrometry or by capillary electrophoresis. Both methods have been proven to be specific for the measured defined. The RMP is used to assign values to whole-blood panels that serve as calibrators for manufacturers. The manufacturers then subsequently use these to assign values to the calibrators provided in their kits, providing traceability from the patient sample back through the RMP to the defined pure materials.
There is no interference from abnormal hemoglobins such as sickle-cell hemoglobin (HbS) and HbC and no interference from acetylated or carbamylated hemoglobin. Importantly, both methods are linear in the clinically relevant concentration range from 27–97 mmol/mol (2.5%–11%) HbA1c.
International network of reference laboratories
The RMP is established in a network of 15 reference laboratories located worldwide using either the electrospray ionization mass spectrometry or the capillary electrophoresis option. The purpose of this network is to assign values to a range of standard materials, including the blood panels used by manufacturers; the values are assigned to the material using the entire network of laboratories, rather than individual centers resulting in a very low level of uncertainty.
The International HbA1c Consensus Committee statement
In order to meet the criteria established by the WHO for the diagnosis of diabetes, patient samples should be measured using “assays [that] are standardized to criteria aligned to the international reference values”,3 which is only represented by the IFCC RMP. In addition to this, the IFCC recommends that the HbA1c concentration of patients should be reported in units as per The International System of Units (SI). In order to corroborate this, in 2007, an International HbA1c Consensus Committee was formed from members of the ADA, EASD, IDF, and the IFCC, which agreed a consensus statement, which was then updated in 2010.37,38 The key points highlighted in the consensus statement included:
- Methods for the measurement of HbA1c should be standardized to the IFCC Reference System, this is to ensure traceability to a defined reference material.
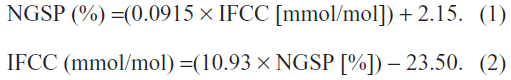
- HbA1c values should be reported in SI (Système International) units of mmol/mol and NGSP units (%) should be derived using the master equation for the two systems.
- In order to facilitate the move to SI units editors are strongly recommended to require that manuscripts present both units.
- HbA1c is the term used to describe glycated hemoglobin (GHb) although A1c may also be used in guidelines and educational materials.37,38
Master equations for the conversion between IFCC and NGSP units are as follows:
Analytical goals for HbA1c analysis
In clinical practice, clinicians often consider a change in value of 5 mmol/mol (0.5%) in successive samples as a clinically significant change in the patient’s glycemic control.39 Therefore, the within-laboratory (intra-laboratory) CV of HbA1c values should be <3% (<2% with NGSP units). The overall between-laboratory (inter-laboratory) CV should be <5% (<3.5% with NGSP units) and the between-laboratory CV for the same method should be <4.5% (<3% with NGSP units).40 The difference in values between the two units (SI and %) is due to the measurement of nonspecific interferences in the NGSP reference method.41
Analytical interferences of HbA1c testing
In certain situations in which hemoglobin variants or adducts (derivatives) are present, method-specific interferences may occur, and therefore HbA1c could be unreliable. The most common analytical interferences are hemoglobin variants, elevated HbF, and hemoglobin adducts.42
Hemoglobin variants
The four most common hemoglobin variants worldwide are HbS (high prevalence in black Africans and Americans, Indians, and people of Mediterranean descent), HbE (Southeast Asians), HbC (black Africans and Americans), and HbD (globally distributed); each of these hemoglobins has a single amino acid substitution in the β-chain.43 These hemoglobin variants can interfere with HbA1c measurement in different ways depending on the technical features of the method used, independently of any effects caused by shortened erythrocyte survival.40 Approximately 900 hemoglobin variants have been identified, many of which are clinically silent.29
With hemoglobin variants S, C, D, and E, the amino acid substitution results in an alteration of the net charge, which will cause interference with charge-based methods of HbA1c measurement.43 Thus, charge-based methods such as cation-exchange chromatography and capillary electrophoresis are vulnerable to the effect of hemoglobin variants. Modern analyzers utilizing these methods can often indicate the presence of clinically silent hemoglobin variants from the abnormal peaks in the chromatograms, but some older-generation analyzers may lack the resolution required to differentiate between them.44 Inaccurate HbA1c values can result when the variant hemoglobin, both glycated and nonglycated, cannot be separated from HbA or HbA1c; consequently, they co-elute or co-migrate with HbA1c, leading to a substantial overestimation of HbA1c.43
Hemoglobin variants may also affect methods based on structure, such as with immunoassay-based methods. Since these methods utilize antibodies that identify the N-terminal glycated amino acids in the first four to ten amino acids of the hemoglobin β-chain, any hemoglobin variants, such as HbS and HbC, with a mutation involving that particular epitope will interfere with HbA1c measurement. In order to assess whether an individual analyzer is likely to be affected, readers are referred to the NGSP website, where a table of assay interferences details current knowledge covering a wide range of analyzers.45
An HbA1c deviation of 10.9 mmol/mol (1%) reveals an approximate change of 1.4–1.9 mmol/L in average blood glucose concentration, therefore an inaccurate HbA1c value due to a clinically silent hemoglobin variant can result in incorrect treatment for patients.46
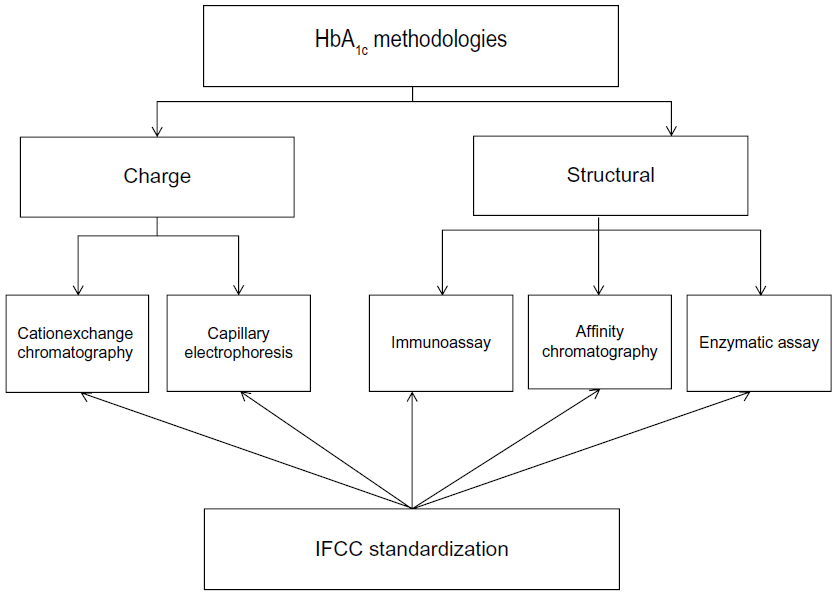 | Figure 1 Overview of the different methodologies available for the measurement of HbA1c. |
HbF
Elevated HbF is another possible interference in the measurement of HbA1c. HbF contains two α-chains and two γ-chains and, in adults, the upper limit of normal is generally around 1%.43 An abnormal increase of HbF may occur due to pathologic conditions, such as thalassemia, sickle cell disease, leukemia, or a hereditary persistence of HbF. As HbF does not have β-chains and the γ-chain has a terminal glycine rather than a valine, it can only be glycated at lysine residues. Glycation of HbF is approximately one-third that of HbA.
It is necessary to isolate HbF to reduce the risk of any possible interference of HbA1c measurement.47 Currently, many of the ion-exchange high-performance liquid chromatography methods are able to separate normal level HbF, as well as elevated HbF, into a separate peak. Boronate affinity methods, however, are affected by elevated HbF levels, as the method measures the ratio of glycated to nonglycated hemoglobin, irrespective of the hemoglobin structure, and elevated HbF can interfere with the measurement. Results may be falsely low due to a lower glycated rate for HbF than HbA and the concomitant elution of HbF in the nonglycated fraction. In addition, immunoassay results will be similarly affected with a decrease of approximately 7 mmol/mol for immunoassay and 10 mmol/mol for boronate affinity methods per 1% increase in HbF. This interference becomes significant at HbF levels exceeding 10%.29
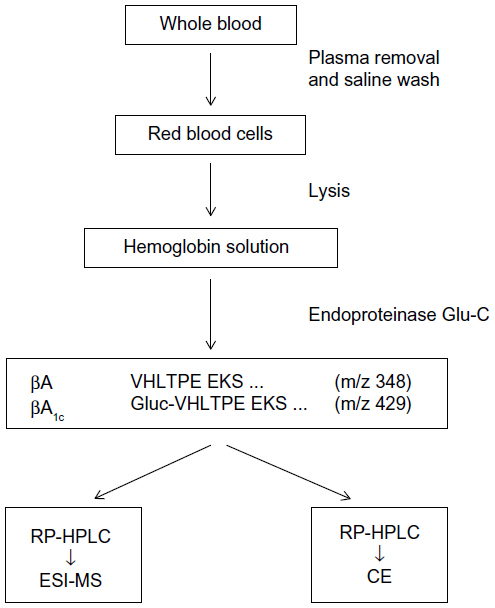 | Figure 2 Flow diagram of the IFCC Reference Measurement Procedure for HbA1c. |
Factors that affect the interpretation of HbA1c results
Carbamylation of hemoglobin
In addition to genetic variants, chemical modifications of hemoglobin may affect the measurement of HbA1c.48 These modifications may lead to inaccurate HbA1c results, particularly when charge-based methods of separation are used. The most common derivative is carbamylated hemoglobin (carbamyl-Hb), which is elevated in uremic patients. Carbamyl-Hb has an isoelectric point similar to that of HbA1c and can therefore interfere with charge-based methods by co-eluting with HbA1c and causing a false overestimation of HbA1c. In order to maintain accurate HbA1c results, carbamyl-Hb must be sufficiently separated from HbA1c. Additionally, uremic patients are subject to factors that affect red cell turnover, such as shortened erythrocyte lifespan in hemodialysis patients, which will significantly affect the concentration of HbA1c. Most modern analyzers separate carbamyl-Hb sufficiently well to not cause a significant interference.
Acetylation of hemoglobin
Elevated concentrations of acetylated hemoglobin result from rare mutations at the NH2 terminus of the β-globin chain that causes an increase in formation of acetylated hemoglobin in vivo. Exposure of normal hemoglobin to aspirin may modify several sites, likely lysine residues on both the α- and β-chains of HbA. Acetylation of lysine residues with aspirin creates a negative charge on the modified protein. This modified hemoglobin has altered electrophoretic and chromatographic (ion-exchange) properties, causing it to migrate ahead of HbA0, like HbA1. Although there is in vitro evidence to show interference by acetylation, it is ambiguous as to what degree this is a disruption in vivo and to what extent, if any, chronic use of aspirin may have an effect on HbA1c measurement.49
Labile HbA
Another common derivative is pre-HbA1c, or labile HbA.29 Labile HbA1c is an intermediate in the synthesis of HbA1c and is characterized by the reversible binding of glucose to hemoglobin as a Schiff base.50 The quantity of labile HbA1c is fairly variable from one patient to another and its biological variation correlates to fluctuating glycemic levels. The formation of labile HbA1c (as well as the retro reaction back to hemoglobin and glucose) proceeds fast, and therefore a steady state is reached after a couple of hours. At glucose levels of 30 mmol/L, the level of labile HbA1c is 3.5%.51 Therefore, sufficient removal of the labile fraction is vital for accurate HbA1c measurement.
Reduced lifespan of red blood cells
The lifespan of erythrocytes is a key determinant of hemoglobin concentration, and any condition that shortens erythrocyte survival or lowers mean erythrocyte age in patients, as well as hemolytic anemia or acute or chronic blood loss, will cause inaccurate HbA1c results, regardless of the method used. Hemolytic anemia and, in particular, renal anemia can lead to HbA1c values that are lower than expected because of reduced red cell survival.52,53 However, iron deficiency anemia can lead to an inappropriate rise in HbA1c, which may fall after iron replacement therapy.54,55
Jaundice and hyperlipidemia
Patient samples that are severely icteric may give falsely elevated HbA1c values with methods relying on charge separation if whole-blood hemolysates are used, since bilirubin migrates with the fast hemoglobin and absorbs at the detecting wavelength. Additionally, hyperlipidemia can also cause false elevation of HbA1c depending on the method; lipids elute in the first HbA1c fraction and are absorbed at 415 nm.56
Vitamins C and E
Another situation in which HbA1c test results may be affected is with the use of vitamins C and E, which are reported to, at times, underestimate HbA1c values.40 Vitamins C and E may reduce the rate of glycation of hemoglobin; however, the amount to which this occurs with pharmacological doses is unknown. Several cross-sectional studies indicate that there is no significant relationship between vitamin C and E and HbA1c when taken at a normal clinical dose.57
Aging, ethnicity, and sex
Aging and ethnicity can affect HbA1c results: older nondiabetic individuals seem to have higher HbA1c values than younger people. A meta-analysis of data from the Framingham Offspring Study and the National Health and Nutrition Examination Survey showed that, in nondiabetic patients, there is an approximate increase of 7 mmol/mol HbA1c (0.6%) between the ages of 40 and 70 years.58 This suggests that nonglycemic factors may contribute to the HbA1c–age relationship.
Additionally, HbA1c appears to be higher by a similar margin in Afro-Caribbeans than in white Europeans and is not explained by differences in glycemia.59 In a meta-analysis of data from six different population studies,60 comparison of white, black African, and Indian populations displayed significant differences in correlation between diagnosis with HbA1c ≥48 mmol/mol and oral glucose tolerance tests. In two of the three white populations, over 90% of those with a diagnosis of diabetes by oral glucose tolerance test would also have an HbA1c ≥48 mmol/mol, but this fell to 50% and 62% in black African and Indian populations, respectively. The reasons for these differences in ethnicity are still relatively unclear, and, although there are no current guidelines on interpretation of HbA1c values in relation to race or ethnicity, the evidence suggests that this is an area that warrants further investigation.
Although there is no difference in mean HbA1c values between males and females, the intraindividual variation is greater in females than in males; however, the difference does not appear to be significant.14
Conclusion
The science of HbA1c measurement has progressed in huge leaps since its first inception and, through the efforts of the IFCC, NGSP, and instrument manufacturers, improvements are continually being made. It is important from a global perspective to strive toward unified standardization of measurements and reporting of HbA1c values to enable safe and effective patient care. The IFCC RMP represents the only valid anchor, and all manufacturers should align to this system. Users should be encouraged to ensure that the analytical instruments they are using for patient care are IFCC-aligned, especially if being used for the diagnosis of diabetes.
Disclosure
The authors report no conflicts of interest in this work.
References
International Diabetes Federation. IDF Atlas. 6th ed. Brussels: International Diabetes Federation; 2013. | |
American Diabetes Assocation. Diagnosis and classification of diabetes mellitus. Diabetes Care. 2012;35 Suppl 1:S64–S71. | |
World Health Organization. Use of Glycated Haemoglobin (HbA1c) in the Diagnosis of Diabetes Mellitus. Abbreviated Report of a WHO Consultation. Contract No: WHO/NMH/CHP/CPM/11.1. Geneva: World Health Organization; 2011. Available from: http://www.who.int/diabetes/publications/report-hba1c_2011.pdf. Accessed June 5, 2014. | |
Diagnostic Criteria and Classification of Hyperglycaemia First Detected in Pregnancy. Contract No: WHO/NMH/MND/13.2. Geneva: World Health Organization; 2013. | |
Rahbar S, Blumenfeld O, Ranney HM. Studies of an unusual hemoglobin in patients with diabetes mellitus. Biochem Biophys Res Commun. 1969;36(5):838–843. | |
Koenig RJ, Peterson CM, Jones RL, Saudek C, Lehrman M, Cerami A. Correlation of glucose regulation and hemoglobin A1c in diabetes mellitus. New Engl J Med. 1976;295(8):417–420. | |
Koenig RJ, Peterson CM, Kilo C, Cerami A, Williamson JR. Hemoglobin A1c as an indicator of degree of glucose intolerance in diabetes. Diabetes. 1976;25(3):230–232. | |
Larsen ML, Hørder M, Mogensen EF. Effect of long-term monitoring of glycosylated hemoglobin levels in insulin-dependent diabetes mellitus. N Engl J Med. 1990;323(15):1021–1025. | |
[No authors listed]. The effect of intensive treatment of diabetes on the development and progression of long-term complications in insulin-dependent diabetes mellitus. The Diabetes Control and Complications Trial Research Group. N Engl J Med. 1993;329(14):977–986. | |
[No authors listed]. Intensive blood-glucose control with sulphonylureas or insulin compared with conventional treatment and risk of complications in patients with type 2 diabetes (UKPDS 33). UK Prospective Diabetes Study (UKPDS) Group. Lancet. 1998;352(9131):837–853. | |
Nathan DM, Bayless M, Cleary P, et al; DCCT/EDIC Research Group. Diabetes control and complications trial/epidemiology of diabetes interventions and complications study at 30 years: advances and contributions. Diabetes. 2013;62(12):3976–3986. | |
Holman RR, Paul SK, Bethel MA, Matthews DR, Neil HA. 10-year follow-up of intensive glucose control in type 2 diabetes. N Engl J Med. 2008;359(15):1577–1589. | |
International Expert Committee. International Expert Committee report on the role of the A1C assay in the diagnosis of diabetes. Diabetes Care. 2009;32(7):1327–1334. | |
Braga F, Dolci A, Montagnana M, et al. Revaluation of biological variation of glycated hemoglobin (HbA(1c)) using an accurately designed protocol and an assay traceable to the IFCC reference system. Clin Chim Acta. 2011;412(15–16):1412–1416. | |
Troisi RJ, Cowie CC, Harris MI. Diurnal variation in fasting plasma glucose: implications for diagnosis of diabetes in patients examined in the afternoon. JAMA. 2000;284(24):3157–3159. | |
Carlsen S, Petersen PH, Skeie S, Skadberg Ø, Sandberg S. Within-subject biological variation of glucose and HbA(1c) in healthy persons and in type 1 diabetes patients. Clin Chem Lab Med. 2011;49(9):1501–1507. | |
John WG; UK Department of Health Advisory Committee on Diabetes. Use of HbA1c in the diagnosis of diabetes mellitus in the UK. The implementation of World Health Organization guidance 2011. Diabet Med. 2012;29(11):1350–1357. | |
The American Diabetes Association - American Diabetes Association: Standards of medical care in diabetes—2007 [Position Statement]. Diabetes Care. 2007;30(Suppl1):S4–S41. | |
International Federation Of Clinical Chemistry And Laboratory Medicine, IFCC Scientific Division, Nordin G, Dybkaer R. Recommendation for term and measurement unit for “HbA1c”. Clin Chem Lab Med. 2007;45(8):1081–1082. | |
McDonald MJ, Shapiro R, Bleichman M, Solway J, Bunn HF. Glycosylated minor components of human adult hemoglobin. Purification, identification, and partial structural analysis. J Biol Chem. 1978;253(7):2327–2332. | |
Bunn HF, Haney DN, Gabbay KH, Gallop PM. Further identification of the nature and linkage of carbohydrate in hemoglobin A1c. Biochem Biophys Res Commun. 1975;67(1):103–109. | |
Bunn HF, Shapiro R, McManus M, et al. Structural heterogeneity of human hemoglobin A due to nonenzymatic glycosylation. J Biol Chem. 1979;254(10):3892–3898. | |
Koenig RJ, Blobstein SH, Cerami A. Structure of carbohydrate of hemoglobin A1c. J Biol Chem. 1977;252(9):2992–2997. | |
Higgins PJ, Bunn HF. Kinetic analysis of the nonenzymatic glycosylation of hemoglobin. J Biol Chem. 1981;256(10):5204–5208. | |
Bunn HF, Haney DN, Kamin S, Gabbay KH, Gallop PM. The biosynthesis of human hemoglobin A1c. Slow glycosylation of hemoglobin in vivo. J Clin Invest. 1976;57(6):1652–1659. | |
Weykamp C, John WG, Mosca A. A review of the challenge in measuring hemoglobin A1c. J Diabetes Sci Technol. 2009;3(3):439–445. | |
Weykamp C, Waenink-Wieggers H, Kemna E, Siebelder C. HbA1c: performance of the Sebia Capillarys 2 Flex Piercing. Clin Chem Lab Med. 2013;51(6):e129–e131. | |
John WG, Gray MR, Bates DL, Beacham JL. Enzyme immunoassay – a new technique for estimating hemoglobin A1c. Clinical Chem. 1993;39(4):663–666. | |
Weykamp C. HbA1c: a review of analytical and clinical aspects. Ann Lab Med. 2013;33(6):393–400. | |
Liu L, Hood S, Wang Y, et al. Direct enzymatic assay for %HbA1c in human whole blood samples. Clin Biochem. 2008;41(7–8):576–583. | |
Cagliero E, Levina EV, Nathan DM. Immediate feedback of HbA1c levels improves glycemic control in type 1 and insulin-treated type 2 diabetic patients. Diabetes Care. 1999;22(11):1785–1789. | |
Lenters-Westra E, Slingerland RJ. Six of eight hemoglobin A1c point-of-care instruments do not meet the general accepted analytical performance criteria. Clin Chem. 2010;56(1):44–52. | |
Boucher BJ, Burrin JM, Gould BJ, et al. A collaborative study of the measurement of glycosylated haemoglobin by several methods in seven laboratories in the United Kingdom. Diabetologia. 1983;24(4):265–271. | |
John WG. Glycated haemoglobin analyses – assessment of within- and between-laboratory performance in a large UK region. Ann Clin Biochem. 1987;24(Pt 5):453–460. | |
Müller MM. Implementation of reference systems in laboratory medicine. Clin Chem. 2000;46(12):1907–1909. | |
Hoelzel W, Miedema K. Development of a reference system for the international standardization of HbA1c/glycohemoglobin determinations. J Int Fed Clin Chem. 1996;8(2):62–64, 66–67. | |
Consensus Committee. Consensus statement on the worldwide standardization of the hemoglobin A1C measurement: the American Diabetes Association, European Association for the Study of Diabetes, International Federation of Clinical Chemistry and Laboratory Medicine, and the International Diabetes Federation. Diabetes Care. 2007;30(9):2399–2400. | |
Hanas R, John G; International HbA(1c) Consensus Committee. 2010 consensus statement on the worldwide standardization of the hemoglobin A1c measurement. Clin Chem. 2010;56(8):1362–1364. | |
Little RR, Rohlfing CL, Sacks DB; National Glycohemoglobin Standardization Program (NGSP) Steering Committee. Status of hemoglobin A1c measurement and goals for improvement: from chaos to order for improving diabetes care. Clin Chem. 2011;57(2):205–214. | |
Sacks DB, Arnold M, Bakris GL, et al. Guidelines and recommendations for laboratory analysis in the diagnosis and management of diabetes mellitus. Clin Chem. 2011;57(6):e1–e47. | |
Weykamp CW, Mosca A, Gillery P, Panteghini M. The analytical goals for hemoglobin A(1c) measurement in IFCC units and National Glycohemoglobin Standardization Program Units are different. Clin Chem. 2011;57(8):1204–1206. | |
Little RR, Rohlfing CL. The long and winding road to optimal HbA1c measurement. Clin Chim Acta. 2013;418:63–71. | |
Little RR, Roberts WL. A review of variant hemoglobins interfering with hemoglobin A1c measurement. J Diabetes Sci Technol. 2009;3(3):446–451. | |
Lahousen T, Roller RE, Lipp RW, Schnedl WJ. Silent haemoglobin variants and determination of HbA(1c) with the HPLC Bio-Rad Variant II. J Clin Pathol. 2002;55(9):699–703. | |
HbA1c Assay Interferences [webpage on the Internet]. National Glycohemoglobin Standardization Program. Available from: http://www.ngsp.org/interf.asp. Accessed July 1, 2013. | |
Nasir NM, Thevarajah M, Yean CY. Hemoglobin variants detected by hemoglobin A1c (HbA1c) analysis and the effects on HbA1c measurements. Int J Diabetes Dev Ctries. 2010;30(2):86–90. | |
Rohlfing CL, Connolly SM, England JD, et al. The effect of elevated fetal hemoglobin on hemoglobin A1c results: five common hemoglobin A1c methods compared with the IFCC reference method. Am J Clin Pathol. 2008;129(5):811–814. | |
Bry L, Chen PC, Sacks DB. Effects of hemoglobin variants and chemically modified derivatives on assays for glycohemoglobin. Clin Chem. 2001;47(2):153–163. | |
Bridges KR, Schmidt GJ, Jensen M, Cerami A, Bunn HF. The acetylation of hemoglobin by aspirin. In vitro and in vivo. J Clin Invest. 1975;56(1):201–207. | |
John WG. Effect of Schiff base (labile fraction) on the measurement of glycated hemoglobin by affinity chromatography. Clin Chem. 1984;30(6):1111–1112. | |
Weykamp CW, Penders TJ. Mechanism and speed of reactions between haemoglobin and glucose consequences for the measurement of glycosylated haemoglobins in patient material. Clin Chim Acta. 1982;125(3):341–350. | |
Inaba M, Okuno S, Kumeda Y, et al; Osaka CKD Expert Research Group. Glycated albumin is a better glycemic indicator than glycated hemoglobin values in hemodialysis patients with diabetes: effect of anemia and erythropoietin injection. J Am Soc Nephrol. 2007;18(3):896–903. | |
Peacock TP, Shihabi ZK, Bleyer AJ, et al. Comparison of glycated albumin and hemoglobin A(1c) levels in diabetic subjects on hemodialysis. Kidney Int. 2008;73(9):1062–1068. | |
Coban E, Ozdogan M, Timuragaoglu A. Effect of iron deficiency anemia on the levels of hemoglobin A1c in nondiabetic patients. Acta Haematol. 2004;112(3):126–128. | |
Tarim O, Küçükerdoğan A, Günay U, Eralp O, Ercan I. Effects of iron deficiency anemia on hemoglobin A1c in type 1 diabetes mellitus. Pediatr Int. 1999;41(4):357–362. | |
Goldstein DE, Little RR, Wiedmeyer HM, England JD, McKenzie EM. Glycated hemoglobin: methodologies and clinical applications. Clin Chem. 1986;32(Suppl 10):B64–B70. | |
Camargo JL, Stifft J, Gross JL. The effect of aspirin and vitamins C and E on HbA1c assays. Clin Chim Acta. 2006;372(1–2):206–209. | |
Pani LN, Korenda L, Meigs JB, et al. Effect of aging on A1C levels in individuals without diabetes: evidence from the Framingham Offspring Study and the National Health and Nutrition Examination Survey 2001–2004. Diabetes Care. 2008;31(10):1991–1996. | |
Herman WH, Ma Y, Uwaifo G, et al; Diabetes Prevention Program Research Group. Differences in A1C by race and ethnicity among patients with impaired glucose tolerance in the Diabetes Prevention Program. Diabetes Care. 2007;30(10):2453–2457. | |
Christensen DL, Witte DR, Kaduka L, et al. Moving to an A1C-Based Diagnosis of Diabetes Has a Different Impact on Prevalence in Different Ethnic Groups. Diabetes Care. 2010;33(3):580–582. |
 © 2014 The Author(s). This work is published and licensed by Dove Medical Press Limited. The full terms of this license are available at https://www.dovepress.com/terms.php and incorporate the Creative Commons Attribution - Non Commercial (unported, v3.0) License.
By accessing the work you hereby accept the Terms. Non-commercial uses of the work are permitted without any further permission from Dove Medical Press Limited, provided the work is properly attributed. For permission for commercial use of this work, please see paragraphs 4.2 and 5 of our Terms.
© 2014 The Author(s). This work is published and licensed by Dove Medical Press Limited. The full terms of this license are available at https://www.dovepress.com/terms.php and incorporate the Creative Commons Attribution - Non Commercial (unported, v3.0) License.
By accessing the work you hereby accept the Terms. Non-commercial uses of the work are permitted without any further permission from Dove Medical Press Limited, provided the work is properly attributed. For permission for commercial use of this work, please see paragraphs 4.2 and 5 of our Terms.