")
Back to Journals » International Journal of Nanomedicine » Volume 14
In vitro cytotoxicity and transfection efficiency of pDNA encoded p53 gene-loaded chitosan-sodium deoxycholate nanoparticles
Authors Hashem FM, Nasr M , Khairy A, Alqurshi A
Received 14 February 2019
Accepted for publication 16 April 2019
Published 5 June 2019 Volume 2019:14 Pages 4123—4131
DOI https://doi.org/10.2147/IJN.S205324
Checked for plagiarism Yes
Review by Single anonymous peer review
Peer reviewer comments 3
Editor who approved publication: Prof. Dr. Anderson Oliveira Lobo
Fahima M Hashem,1 Mohamed Nasr,1 Ahmed Khairy,2 Abdulmalik Alqurshi3
1Department of Pharmaceutics and Industrial Pharmacy, Faculty of Pharmacy, Helwan University, Cairo, Egypt; 2Department of Pharmaceutics, National Organization for Drug Control and Research (NODCAR), Cairo, Egypt; 3Department of Pharmaceutics and Pharmaceutical Technology, College of Pharmacy, Taibah University, Medina, KSA
Purpose: The objective of this work was to formulate a delivery system of pDNA encoded p53 gene-loaded chitosan-sodium deoxycholate (CS-DS) nanoparticles, and to evaluate their influence on in vitro cytotoxicity and transfection efficiency of p53 gene.
Methods: The prepared pDNA-loaded CS-DS nanoparticles were evaluated for morphology, particle size, zeta potential, entrapment efficiency %, in vitro release, in vitro cytotoxicity, and transfection efficiency.
Results: The mean particle size ranged from from 96.5 ± 11.31 to 405 ± 46.39 nm. All nanoparticles had good positive zeta potential values. Entrapment efficiency % ranged from 38.25 ± 3.25 to 94.89 ± 5.67. The agarose gel electrophoresis confirmed the strong binding between plasmid and CS. The in vitro pDNA release from nanoparticles exhibited an initial burst effect followed by a sustained drug release over a period of 6 days. In vitro cytotoxicity against human Caco-2 cells showed low cell cytotoxicity of plain CS-DS nanoparticles, while pDNA-loaded CS-DS nanoparticles showed a cytotoxic effect with increasing nanoparticles’ concentration. Gene transfection, analyzed by PCR and ELISA, showed a direct correlation between gene expression and concentration of pDNA. The highest expression of the gene was achieved with pDNA concentration of 9 μg/mL with 5.7 times increase compared to naked pDNA of the same concentration.
Conclusion: The obtained results were very encouraging and offer an alternative approach to enhancing the transfection efficiency of genetic material-loaded chitosan-based delivery systems.
Keywords: p53 gene, chitosan-sodium deoxycholate nanoparticles, in vitro cytotoxicity, gene transfection
Introduction
A commonly investigated polymer used as nanoparticles in gene delivery, is the biodegradable and non-toxic chitosan (CS). This is mainly due to its positive charge, which conveniently allows it to form complexes with the negatively charged DNA macromolecules,1,2 thus avoiding nuclease degradation.3 Moreover, the intensity of surface charge, and mucoadhesion property of CS-based nanoparticles influence their ability to efficiently condensate DNA, facilitating the penetration of large molecules across the mucosal surface4 and protects encapsulated DNA from degradation due to lysosomal enzymes.5 DNA-loaded CS nanoparticle complexes have shown promising applications as gene delivery vehicles,6,7 nevertheless, they suffer from endosomal escape and weak cellular uptake.8 Numerous studies signify the potential of CS nanoparticles as pDNA carrier through non-invasive nasal route,9–11 pulmonary administration,12 and injectable depot systems for local gene therapy.13
Several derivatives of CS have been synthesized to improve transfection efficiency of loaded DNA,6 including conjugation of CS with transferrin protein,14 deoxycholic groups,15 and lactose.16 The formation of complexes between CS and bile salts, such as sodium deoxycholate (DS), was shown to improve paracellular transport of hydrophilic drugs, where at a certain concentration, bile salts could form reverse micelles that include water molecules, thus creating hydrophilic pores in cell membranes.17 Furthermore, the formation of a structurally stable CS-DS complex,18,19 through intermolecular forces between the positively charged amine functional group of CS and the negatively charged deoxycholate, allows a more efficient transport of proteins and peptides through phospholipid membranes, prompted by the bile salt-lipid membrane interactions.20,21
The encapsulation of pDNA, potentially used for cancer treatment,22 in nanoparticle complexes may discourage their degradation23 and thus allow for their controlled release.24 For example, the successful delivery of the p53 gene, coding for a tumor suppressant protein, can lead to apoptosis in target cancer cells.25
The objective of the present study was to develop nanoparticles based on the combination of CS and DS as a delivery system for pDNA, aiming at enhancing transfection efficiency of the loaded gene.
Materials and methods
Materials
pDNA (pcDNA3 p53 WT) was a gift from David Meek (Addgene plasmid #69003). CS low molecular weight, degree of deacetylation 75%–85%, was purchased from Sigma-Aldrich Co. (St Louis, MO, USA). DS was purchased from Alfa Aesar (Karlsruhe, Germany). Potassium dihydrogen phosphate (NaH2PO4) and sodium monohydrogen phosphate (Na2HPO4) were purchased from Adwic, EL-Nasr Pharmaceutical Chemical Company (Cairo, Egypt). Caco-2 cell line was purchased from Vacsera-Holding Company for Biological Products and Vaccines (Giza, Egypt).
Plasmid production and purification
pcDNA3 p53 WT was amplified in a cell culture of Escherichia coli DH5-Alpha. Luria-Bertani medium containing 100 µg/mL of ampicllin was used to grow the bacteria.26 The medium was incubated overnight at 37°C. Cells were recovered by centrifugation and the plasmid was purified by a kit-free alkaline lysis plasmid miniprep. The concentration and purity of pDNA were determined spectrophotometrically by measuring absorption at 260 and 280 nm using the following equations:
To determine the purity of pDNA preparations, the OD260/OD280 ratio was calculated, where a value ≈1.8 indicates that there is no contamination with protein or phenol.
Preparation of pDNA-loaded CS-DS nanoparticles
An ionic gelation technique, described by Cadete et al,27 was used to prepare pDNA-loaded CS-DS nanoparticles. Briefly, CS and DS were dissolved separately in 0.1% acetic acid solution and deionized water respectively, creating stock solutions at concentrations of 1 mg/mL. While the CS solution was stirred at 300 rpm (for 15 minutes at room temperature), different amounts of the DS solution were added dropwise. For the preparation of pDNA-loaded nanoparticles, the same method was used with the addition of pDNA in the DS stock solution. The obtained dispersion was centrifuged at 12,000 rpm for 20 minutes at 4°C and nanoparticles residue was re-suspended in deionized water and centrifuged again. The compositions of different formulas of pDNA-loaded CS-DS nanoparticles are shown in Table 1. All formulations were prepared in triplicate.
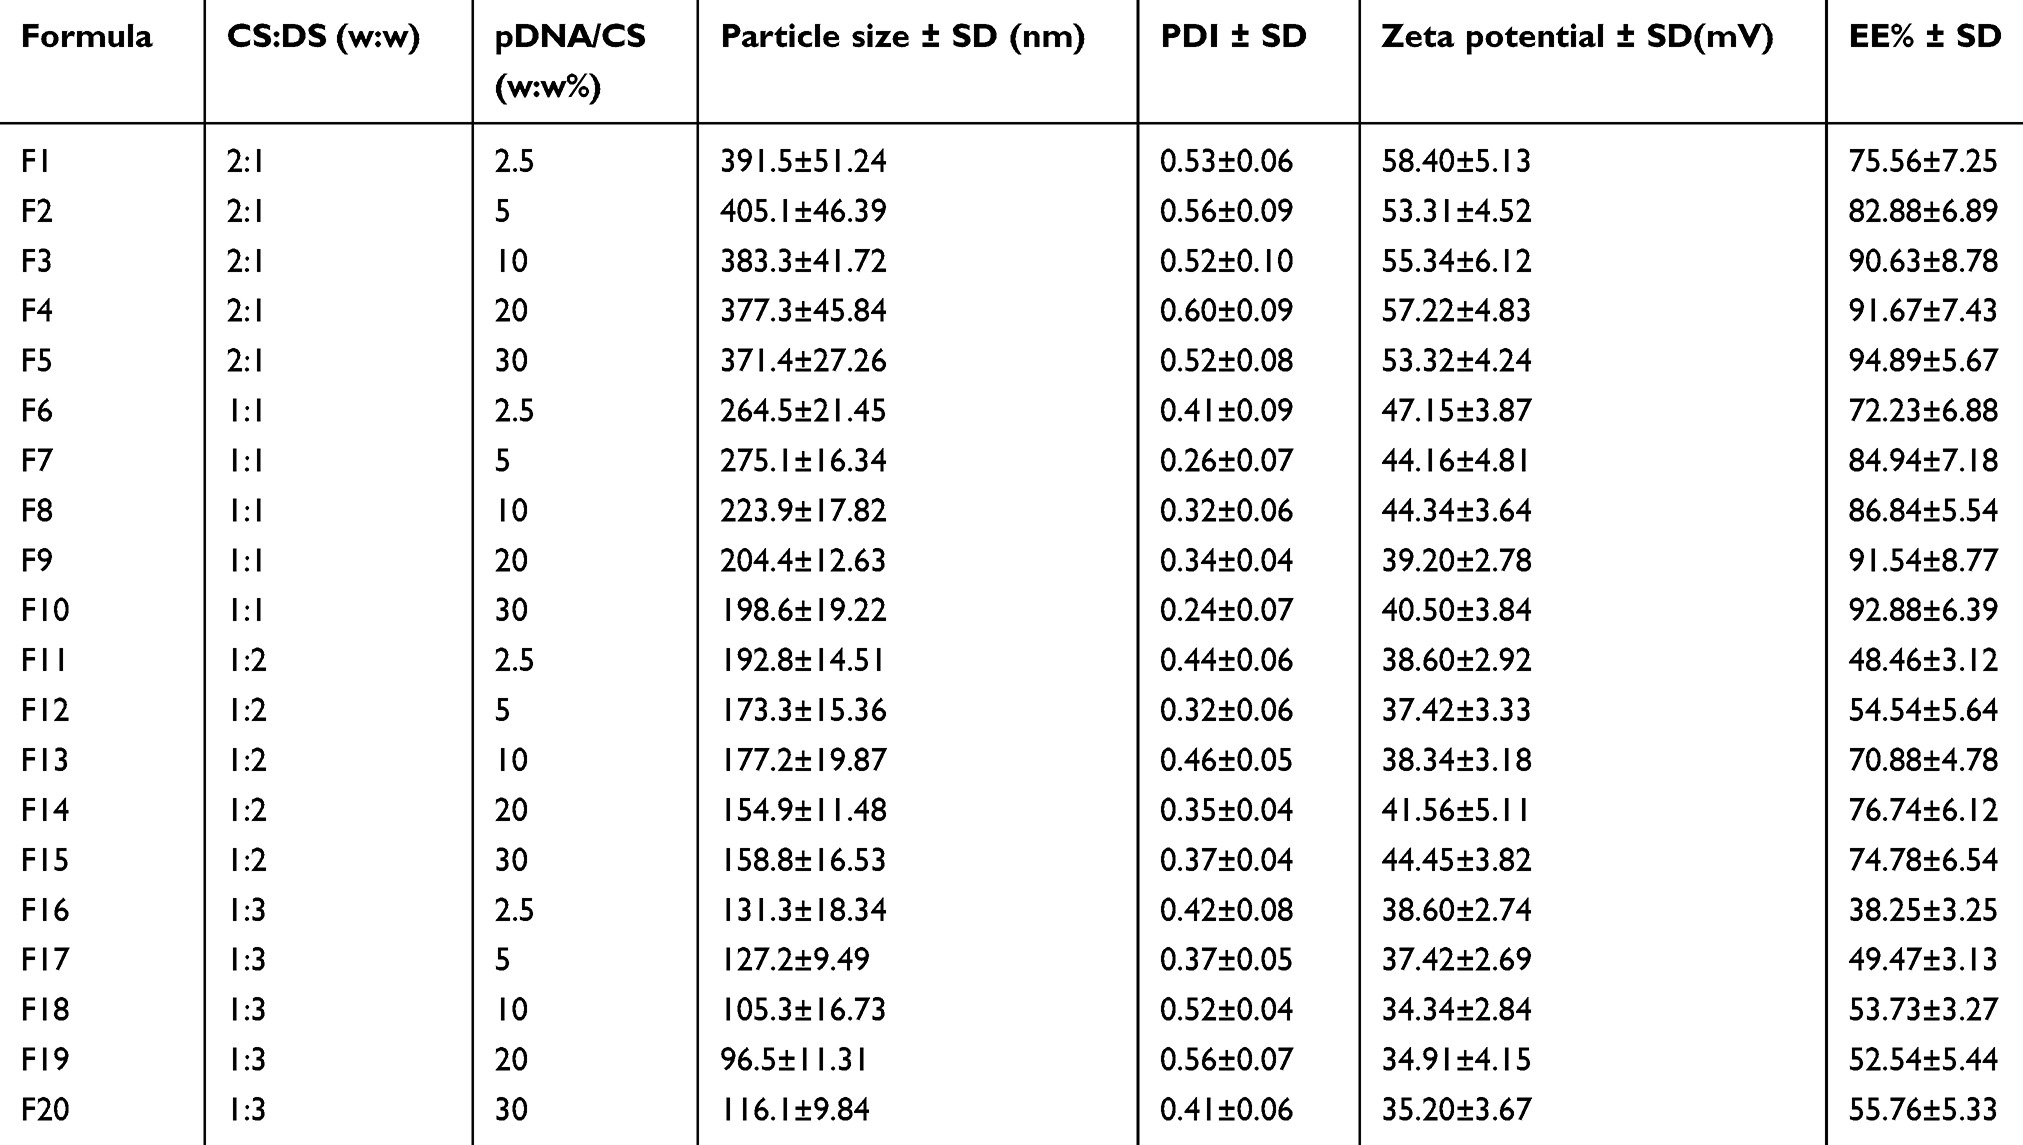 | Table 1 Mean particle size, polydispersity index (PDI), zeta potential, and entrapment efficiency % (EE%) of pDNA-loaded chitosan-sodium deoxycholate (CS-DS) nanoparticles |
Particle size analysis and zeta potential
The particle size (Z-average), polydispersity index (PDI), and zeta potential of pDNA-loaded CS-DS nanoparticles were measured, using a Zeta Sizer Nano-series (Nano ZS), Malvern Instruments, Malvern, UK, via dynamic light scattering. Deionized water was used to dilute all samples before measurements at 25±0.5°C (in triplicate).
Morphology of pDNA-loaded CS-DS nanoparticles
A transmission electron microscope (JEOL JEM Dos electron microscope, JEOL, Tokyo, Japan) was used to investigate the morphology of pDNA-loaded nanoparticles. A small amount of sample was added onto a 200 mesh carbon-coated copper grid. Absorbent filter paper was used to remove any excess fluid from the sample. An amount of 1% sodium phosphotungstate solution was used to stain samples. Magnifications of up to 1,000,000× were used to view samples.
Entrapment efficiency (EE) %
Centrifugation method28 was used to determine EE% calculated using Equation 1. Where the separation of free pDNA from pDNA-loaded nanoparticles in a 1 mL sample was achieved via a 20-minute centrifugation step at 12,000 rpm and 4°C. Nanoparticles residue was further washed to completely remove any free pDNA residue. This was achieved by re-suspending nanoparticle residue in deionized water to be centrifuged again. UV absorbance of the collected supernatant fractions were measured at λmax =260 nm29 and were used to calculate the total amount of free pDNA.
The EE% was determined using the following equation:

Where:
Winitial pDNA: is the total amount of pDNA in the dispersion
Wfree pDNA in supernatant: is the determined amount of free pDNA in supernatant
Agarose gel electrophoresis
To verify that pDNA is attached to the nanoparticles and the resulting nanoparticles are established enough, agarose gel electrophoresis was carried out. Free pDNA and pDNA-loaded CS-DS nanoparticles (F6, F7, F8, F9, and F10 as representative formulations for 2.5, 5, 10, 20, and 30% w/w pDNA/CS, respectively) were applied onto a 1% agarose gel containing Tris-acetate/EDTA buffer (pH 8) at constant voltage (100 V). Then, the gel was stained with ethidium bromide and visualized under UV light.30,31
In vitro pDNA release
In vitro release studies of pDNA from nanoparticles were performed according to a previously published method.32 Briefly, separated pDNA-loaded nanoparticles, from the aqueous dispersion (equivalent to 100 µg pDNA), were placed into a small vial and re-suspended in 3 mL phosphate buffer (pH 7.4) at 37°C under shaking conditions. A separate vial was prepared for each time point. At predetermined time points (1, 2, 4, 8, 16, 24, 48, 72, 96, 120, and 144 hours), one entire vial sample was removed and centrifuged at 12,000 rpm for 15 minutes and the supernatant was used to determine the amount of pDNA released spectrophotometrically at 260 nm. All experiments were run in triplicate.
Stability studies
Stability studies were performed on pDNA-loaded nanoparticles (F10 and F15). F10 and F15 were selected as representative formulations for 1:1 and 1:2 w/w ratio of CS:DS and for their reasonable particle size, EE%, and zeta potential. Nanoparticles residue, prepared following the method described previously, was allowed to dry overnight at room temperature and then stored at 4°C in light-protected glass vials for a period of 1–3 months. Once the storage period was complete, samples were dispersed in deionized water and were analyzed for zeta potential, mean particle size, and EE% values.
Cells and culture conditions
Caco-2 cells (colorectal adenocarcinoma) have been used as a model cell for evaluation of cytotoxicity of nanoparticles containing p53 gene. DMEM was used for culturing and maintenance of the human tumor cell line Caco-2 cells. The medium was brought up to 37°C using a water bath and supplemented with 1% antibiotic (penicillin G potassium (SERVA) + streptomycin, 10% FBS)..
In vitro cytotoxicity of pDNA-loaded CS-DS nanoparticles
Comparison of in vitro cytotoxicity of pDNA-loaded CS-DS nanoparticles, free pDNA, and plain nanoparticles was carried out in the Central laboratory, Faculty of agriculture, Cairo University. Neutral red uptake assay was used to determine the in vitro cytotoxicity; this was based on viable cells’ ability to incorporate and bind the supravital neutral red dye.33 After cell seeding and attachment, the media discarded gently and different concentrations of the compounds were prepared by dissolving and diluting it with DMEM. Treatment media (200 μL) were dispensed into four replicates for each concentration, other wells were filled with media only (as a negative control) and wells were filled with media containing doxorubicin HCL (6 µg/mL) as a positive control. After that, the 96-well plate was covered with a lid and incubated at 37°C for 48 hours. After the incubation period, the medium was decanted from the wells, and 100 µL of neutral red medium (which was prepared and incubated at 37°C for 24 hours and centrifuged at 1,800 rpm for 10 minutes to remove any precipitated dye crystals) was added into each well and incubated again for 3 hours at 37°C. After incubation, the dye containing medium was decanted and each well was rinsed gently two times with 150 µL PBS solution to remove the unabsorbed neutral red dye contained in the wells. An amount of 150 µL of destain solution was added and incubated for 10 minutes with shaking. The absorbance of acidified ethanol solution containing extracted neutral red dye was measured using a microplate reader and cell viability was calculated. The optical densities were measured at 540 nm. The cell viability % was calculated using the following equation:

In vitro transfection studies
An in vitro transfection method was adapted from a previously published study34 using Caco-2 cell line as a model. The cells were grown and prepared for cell seeding and attachment, once completed, the media were discarded gently. Using DMEM, a range of dilutions were prepared of the compounds. An amount of 200 μL of treatment media were dispensed into four replicates of each concentration, after which the covered 96-well plate was incubated at 37°C for 4 hours. Following this, the media were changed and re-incubated for 44 hours. The transfection efficiency was evaluated by quantification of p53 gene expression levels by qPCR and p53 protein content by ELISA kit.
p53 gene expression evaluated by qPCR
The collected culture supernatants were analyzed for the measurement of p53 gene expression. RNA was extracted from Caco-2 cells via homogenization of cells followed by purification and reverse transcription into cDNA using RT-PCR kit supplied by SuperScript Choice System (Life Technologies, Thermo Fisher Scientific, Waltham, MA, USA). cDNA (0.5 µL) was added to the individual PCR tubes containing the real time-PCR reaction mixture for a final volume of 50 μL. Reactions were run on an ABI PRISM 7900 HT detection system (Applied Biosystems, Thermo fisher Scientific) and the PCR conditions were as follows: 40 cycles of denaturation at 95°C for 1 minute, annealing at 60°C for 1 minute, and elongation at 72°C for 1 minute. Data were analyzed with the ABI Prism sequence detection system software and quantified using the v1.7 sequence detection software from PE Biosystems (Foster City, CA, USA). The relative expression of studied genes was calculated using the comparative cycle threshold (Ct) method. The 2−∆∆Ct method35 was used to determine relative quantitative level of target gene. The ∆Ct was calculated by subtracting GAPDH Ct from that of target gene whereas ∆∆Ct was obtained by subtracting the ∆Ct of control from that of target gene.
p53 protein content evaluated by ELISA kit
ELISA was used to evaluate p53 protein content in Caco-2 cells after treatment with naked pDNA and pDNA-loaded CS-DS nanoparticles (F10) using the p53 ELISA kit (catalog no MBS355295, MyBioSource Company, San Diego, CA, USA).
Statistical analysis
The SPSS program (version 12.0, SPSS Inc., Chicago, IL, USA) was used to compare results via Student’s t-test. Paired t-test was used to compare stability data. Values were reported as mean ± SD. A significant difference was considered at P<0.05.
Results and discussion
Particle size analysis and zeta potential
The size of pDNA-loaded nanoparticles ranged from 96.50±11.31–405.10±46.39 nm while PDI values ranged from 0.24±0.04–0.60±0.09 (Table 1). These results revealed that the amount of DS in the formulation and the resulting mean particle size were inversely correlated (r2=0.965, P<0.05). However, increasing the amount of entrapped pDNA did not seem to significantly affect the mean particle size as well as the size distribution within the same formulation. Similar results were previously reported.27
The values of zeta potential (Table 1) ranged between +34.34 and +58.40 mV. The higher values of zeta potential are considered as an indicator of physical stability of the prepared pDNA-loaded nanoparticle dispersions. The obtained results indicated that values of zeta potential have significantly (P<0.05) decreased as DS concentration increased. This might be due to the masking effect of DS on the free positively charged amino groups of CS. Moreover, the higher entrapment % of the negatively charged pDNA leads to greater decrease in values of zeta potential.36
EE%
Table 1 shows that the EE% of the prepared pDNA-loaded CS-DS nanoparticles ranged from 38.25±3.25%–94.89±5.67%. These results indicate that, at constant pDNA concentration, increasing % of CS in the nanoparticles resulted in a significant (P<0.05) increase in EE%. This may be due to the presence of a higher CS concentration in the preparation medium which led to the binding of more pDNA.37,38 Moreover, EE% of pDNA is improved as the concentration of pDNA increased at constant CS:DS ratio.
Transmission electron microscopy (TEM)
The TEM microphotographs of representative pDNA-loaded CS-DS nanoparticles (F10 and F15, Figure 1A and B, respectively) revealed that pDNA-loaded nanoparticles of both formulations exhibited aggregation-free spherical shapes. Furthermore, particle dimensions were shown to be of nano-size, thus in agreement with particle size analysis performed by dynamic light scattering.
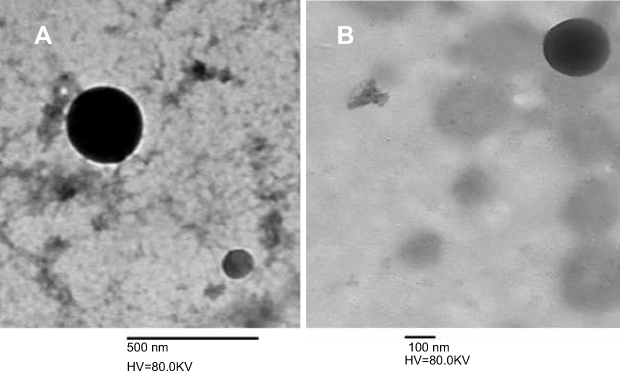 | Figure 1 Transmission electron microscopy image of pDNA-loaded chitosan-sodium deoxycholate nanoparticles (A) F10 and (B) F15. |
Agarose gel electrophoresis
The ability of CS-DS nanoparticles to attach to pDNA and the stability of such complex were evaluated by agarose gel electrophoresis. Figure 2, lane 1 represents the intact pDNA, while lanes 2–6 represent pDNA-loaded CS-DS (F6–F10 respectively). The strong attachment of pDNA to the CS-DS nanoparticles is demonstrated in F6–F10’s resistance to migration. Furthermore, no unbound pDNA was detected, further confirming the strong attachment between CS-DS nanoparticles and pDNA.6
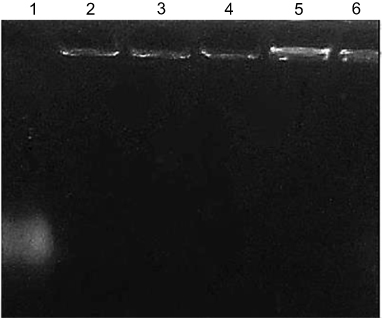 | Figure 2 Electrophoretic analysis of the free pDNA and pDNA loaded chitosan-sodium deoxycholate (CS-DS) nanoparticles, lane1: free pDNA, lane 2–6: pDNA-loaded CS-DS nanoparticles (F6–F10, respectively). |
In vitro release of pDNA from CS-DS nanoparticles
The release profiles of pDNA from CS-DS nanoparticle formulations prepared with 30% of pDNA (F5, F10, F15, and F20) are illustrated in Figure 3. The release profiles showed an initial rapid release of approximately 15% of the loaded pDNA during the first 4 hours, which may be attributed to the dissociation of the loosely bound pDNA molecules, as well as the diffusion of pDNA molecules dispersed close to the surface.39 Furthermore, a slow release of pDNA was observed over the remaining 144 hours, attributed to the steady release of entrapped pDNA.40
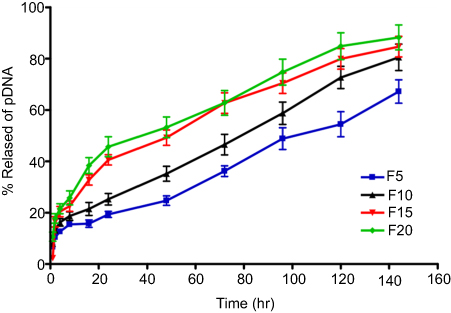 | Figure 3 In vitro release profiles of pDNA from different formulations prepared from chitosan-sodium deoxycholate nanoparticles with 30% of pDNA (F5, F10, F15, and F20). |
Stability of the selected pDNA-loaded CS-DS nanoparticle formulations
Results of the stability study for F10 and F15 before and after storage at 4°C for 1 and 3 months are shown in Table 2. The results indicate that the mean particle size, zeta potential, and EE% of pDNA-loaded CS-DS nanoparticles were not affected by storage compared to values of the same parameter measured before storage. The slight change in the mean particle size, zeta potential, and EE% was found to be statistically insignificant (P>0.05, paired t-test) indicating the stability of pDNA-loaded CS-DS nanoparticles at 4°C.
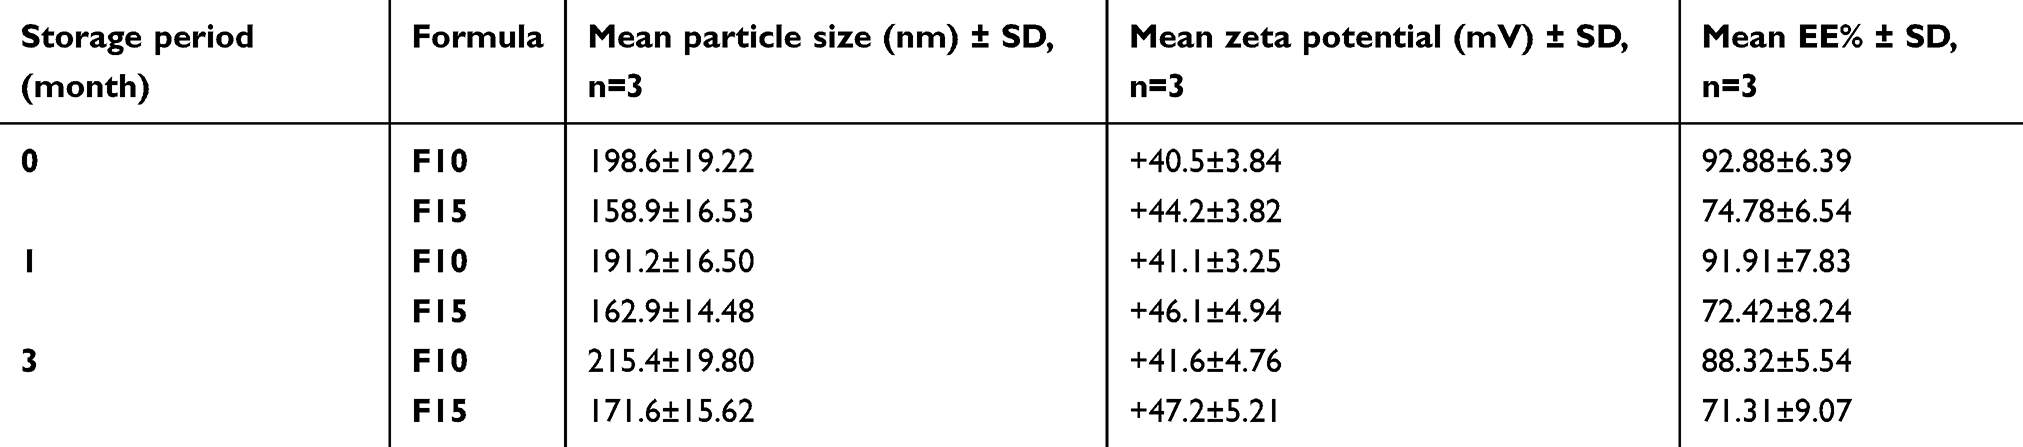 | Table 2 Mean particle size, zeta potential, and entrapment efficiency % (EE%) of F10 and F15 before and after storage at 4°C |
In vitro cytotoxicity effect of pDNA-loaded CS-DS nanoparticles on Caco-2 cells
The selection of F10 as an optimum formulation for pDNA-loaded CS-DS nanoparticles to evaluate their in vitro cytotoxicity and transfection assays, was made based on their small and homogenous particle size (198.6 nm, PDI =0.24) in addition to their positive zeta potential values (+40.50 mV). Plain CS-DS nanoparticles (without pDNA) and untreated cells were used as controls. In this study, plain 1:1 CS:DS nanoparticles were prepared and diluted in such a way that the nanoparticle dispersions contained 5, 10, 15, 20, 30, and 40 μg/mL of CS. pDNA-loaded CS-DS nanoparticles were diluted in the same manner to have the same CS concentrations and pDNA equivalent to 1.5, 3, 4.5, 6, 9, and 12 μg/mL. In vitro cytotoxicity effect of plain nanoparticles on Caco-2 cells after 48 hours (Figure 4A) showed no cytotoxicity up to 10 μg/mL. However, as the concentration of CS in plain nanoparticles increased, the cell viability began to decrease and showed slight cytotoxicity. The reduced cell viability might be attributed to the higher CS concentration. Similar results have been previously reported.41
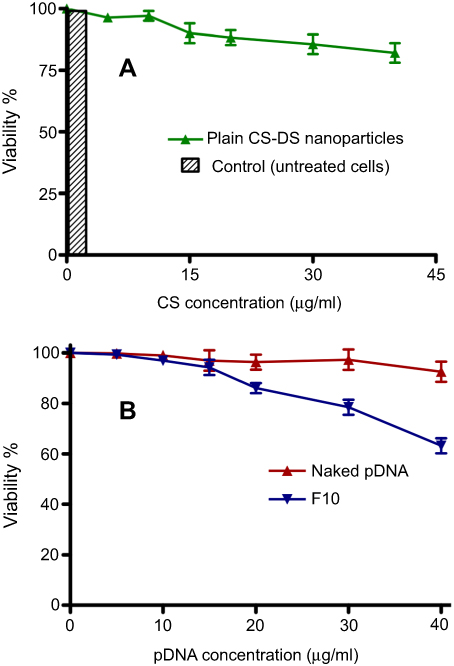 | Figure 4 In vitro cytotoxicity on Caco-2 cells of (A) plain chitosan-sodium deoxycholate (CS-DS) nanoparticles (represented as CS concentration) and (B) pDNA-loaded CS-DS nanoparticles (F10) compared to naked pDNA. |
In vitro cytotoxicity of different concentrations of naked pDNA (Figure 4B) showed that cell viability remains roughly the same (≈96%) even when the concentration of pDNA was raised from 1.50 to 12 μg/mL, there was no significant change in cell viability. On the other hand, cell viability % in case of pDNA-loaded CS-DS nanoparticles (Figure 4B) gradually decreased reaching 63.20%±3.80% at pDNA concentration of 12 µg/mL. The reduction in cell viability may be attributed to cell apoptosis as a result of cellular uptake of loaded p53.
In vitro transfection efficiency
p53 gene expression evaluated by qPCR
PCR was used to evaluate the in vitro transfection of pDNA into Caco-2 cells after treatment with different concentrations (1.5, 3, 4.5, 6, 9, and 12 μg/mL) of naked pDNA and pDNA-loaded CS-DS nanoparticles (F10). Figure 5 shows the fold expression of p53 gene in Caco-2 cells after both treatments. The results revealed a negligible increase in p53 gene expression levels for all naked pDNA concentrations. On the other hand, there was a significant increase (P<0.05) in p53 gene expression levels for all concentrations of pDNA-loaded nanoparticles when compared to the control. The improvement in transfection efficiency of 1.5, 3, 4.5, 6, 9, and 12 μg/mL pDNA-loaded in F10 was 3.72, 3.81, 3.99, 4.99, 5.7, and 4.26 times, respectively, compared to the fold expression obtained with the same concentrations of naked pDNA.
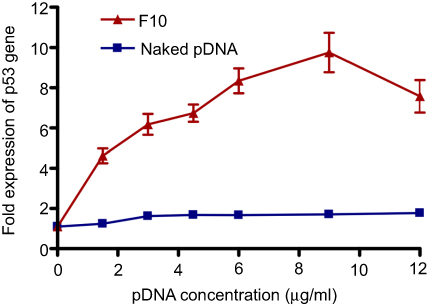 | Figure 5 Fold expression of p53 gene in Caco-2 cells treated with naked pDNA and pDNA-loaded chitosan-sodium deoxycholate nanoparticles (F10). |
p53 protein content evaluated by ELISA kit
ELISA was used to measure p53 protein content in Caco-2 cells (Figure 6) after treatment with naked pDNA and pDNA-loaded CS-DS nanoparticles (F10). The increase in p53 protein content by pDNA-loaded in F10 was 1.23, 1.66,1.78, 1.89, 2.82, and 2.01 times for 1.5, 3, 4.5, 6, 9, and 12 μg/mL pDNA, respectively, compared to the same concentrations of naked pDNA. These results are in good agreement with qPCR p53 gene expression. The higher cellular uptake and improved transfection were attributed to several reasons such as the positive surface charge of the pDNA-loaded nanoparticles that allows an electrostatic interaction between negatively charged cellular membranes and positively charged nanoparticles. Moreover, the presence of DS has an impact on cell permeability.27 In addition, the nanosized particles cross the cells easily and can deliver the pDNA in appropriate amounts.31
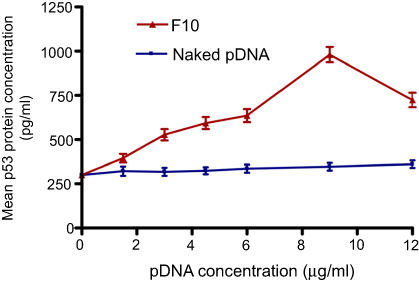 | Figure 6 Mean p53 protein concentrations (±SD, n=3) in Caco-2 cells treated with naked pDNA and pDNA-loaded chitosan-sodium deoxycholate nanoparticles (F10). |
Conclusion
pDNA encoded p53 gene was successfully incorporated into CS-DS nanoparticles. The nanoparticles were prepared without the need for reactions involving chemicals or solvents. The prepared nanoparticles exhibited nanometer-sized particles and entrapment efficacy ranged from 38.25%–94.89% of pDNA and released the loaded pDNA in a sustained release manner. The prepared nanoparticles showed higher transfection efficiency than naked p53 in Caco-2 cells. Our results indicate the success of cellular transfection and consequent protein p53 expression. The present work demonstrated that p53-loaded CS-DS nanoparticles can be considered as a good candidate for anti-cancer gene delivery systems. Although important development was achieved in CS-based systems for gene delivery, clinical trials are still required.
Disclosure
The authors report no conflicts of interest in this work.
References
1. Janes K, Calvo P, Alonso M. Polysaccharide colloidal particles as delivery systems for macromolecules. Adv Drug Deliv Rev. 2001;47:83–97.
2. Richardson SW, Kolbe HJ, Duncan R. Potential of low molecular mass chitosan as a DNA delivery system: biocompatibility, body distribution and ability to complex and protect DNA. Int J Pharm. 1999;178:231–243.
3. Cui Z, Mumper RJ. Chitosan-based nanoparticles for topical genetic immunization. J Control Release. 2001;75:409–419.
4. Illum L, Jabbal-Gill I, Hinchcliffe M, Fisher A, Davis S. Chitosan as a novel nasal delivery system for vaccines. Adv Drug Deliv Rev. 2001;51:81–96.
5. Panyam J, Labhasetwar V. Biodegradable nanoparticles for drug and gene delivery to cells and tissue. Adv Drug Deliv Rev. 2003;55:329–347.
6. Corsi K, Chellat F, Yahia LH, Fernandes JC. Mesenchymal stem cells, MG63 and HEK293 transfection using chitosan-DNA nanoparticles. Biomaterials. 2003;24:1255–1264.
7. Romøren K, Thu BJ, Evensen Ø. Immersion delivery of plasmid DNA: II. A study of the potentials of a chitosan based delivery system in rainbow trout (Oncorhynchus mykiss) fry. J Control Release. 2002;85:215–225.
8. Dufès C, Uchegbu IF, Schätzlein AG. Dendrimers in gene delivery. Adv Drug Deliv Rev. 2005;57(15):2177–2202. doi:10.1016/j.addr.2005.09.017
9. Khatri K, Goyal AK, Gupta PN, Mishra N, Vyas SP. Plasmid DNA loaded chitosan nanoparticles for nasal mucosal immunization against hepatitis B. Int J Pharm. 2008;354:235–241. doi:10.1016/j.ijpharm.2007.11.027
10. Sun CJ, Pan SP, Xie QX, Xiao LJ. Preparation of chitosan-plasmid DNA nanoparticles encoding zona pellucida glycoprotein-3α and its expression in mouse. Mol Reprod and Dev. 2004;68:182–188. doi:10.1002/mrd.20058
11. Kumar M, Behera AK, Lockey RF, et al. Intranasal gene transfer by chitosan–DNA nanospheres protects BALB/c mice against acute respiratory syncytial virus infection. Hum Gene Ther. 2002;13:1415–1425. doi:10.1089/10430340260185058
12. Bivas-Benita M, van Meijgaarden KE, Franken KL, et al. Pulmonary delivery of chitosan-DNA nanoparticles enhances the immunogenicity of a DNA vaccine encoding HLA-A* 0201-restricted T-cell epitopes of Mycobacterium tuberculosis. Vaccine. 2004;22:1609–1615. doi:10.1016/j.vaccine.2003.09.044
13. Lee JI, Kim HS, Yoo HS. DNA nanogels composed of chitosan and pluronic with thermo-sensitive and photo-crosslinking properties. Int J Pharm. 2009;373:93–99. doi:10.1016/j.ijpharm.2009.01.016
14. Mao HQ, Roy K, Troung-Le VL, et al. Chitosan-DNA nanoparticles as gene carriers: synthesis, characterization and transfection efficiency. J Control Release. 2001;70:399–421.
15. Lee K, Kwon I, Kim Y-H, Jo W, Jeong S. Preparation of chitosan self-aggregates as a gene delivery system. J Control Release. 1998;51:213–220.
16. Erbacher P, Zou S, Bettinger T, Steffan A-M, Remy J-S. Chitosan-based vector/DNA complexes for gene delivery: biophysical characteristics and transfection ability. Pharm Res. 1998;15:1332–1339.
17. Nicolazzo JA, Reed BL, Finnin BC. Buccal penetration enhancers—how do they really work? J Control Release. 2005;105:1–15. doi:10.1016/j.jconrel.2005.01.024
18. Chae SY, Son S, Lee M, Jang M-K, Nah J-W. Deoxycholic acid-conjugated chitosan oligosaccharide nanoparticles for efficient gene carrier. J Control Release. 2005;109:330–344. doi:10.1016/j.jconrel.2005.09.040
19. Romeo V, Gries W, Xia W, Sileno A, Pimplaskar H, Behl C. Optimization of systemic nasal drug delivery with pharmaceutical excipients. Adv Drug Deliv Rev. 1998;29:117–133.
20. Fan W, Yan W, Xu Z, Ni H. Formation mechanism of monodisperse, low molecular weight chitosan nanoparticles by ionic gelation technique. Coll Surf B. 2012;90:21–27. doi:10.1016/j.colsurfb.2011.09.042
21. Koukaras EN, Papadimitriou SA, Bikiaris DN, Froudakis GE. Insight on the formation of chitosan nanoparticles through ionotropic gelation with tripolyphosphate. Mol Pharm. 2012;9(10):2856–2862. doi:10.1021/mp300162j
22. Galipeau J, Li H, Paquin A, Sicilia F, Karpati G, Nalbantoglu J. Vesicular stomatitis virus G pseudotyped retrovector mediates effective in vivo suicide gene delivery in experimental brain cancer. Cancer Res. 1999;59:2384–2394.
23. Lee M, Nah J-W, Kwon Y, Koh JJ, Ko KS, Kim SW. Water-soluble and low molecular weight chitosan-based plasmid DNA delivery. Pharm Res. 2001;18:427–431.
24. Zhang H, Neau SH. In vitro degradation of chitosan by a commercial enzyme preparation: effect of molecular weight and degree of deacetylation. Biomaterials. 2001;22:1653–1658.
25. Fisher DE. Apoptosis in cancer therapy: crossing the threshold. Cell. 1994;78(4):539–542.
26. Loughery J, Cox M, Smith LM, Meek DW. Critical role for p53-serine 15 phosphorylation in stimulating transactivation at p53-responsive promoters. Nucleic Acids Res. 2014;42:7666–7680. doi:10.1093/nar/gku501
27. Cadete A, Figueiredo L, Lopes R, Calado C, Almeida A, Gonçalves L. Development and characterization of a new plasmid delivery system based on chitosan–sodium deoxycholate nanoparticles. Eur J Pharm Sci. 2012;45:451–458. doi:10.1016/j.ejps.2011.09.018
28. Ammar HO, El-Nahhas S, Ghorab M, Salama A. Chitosan/cyclodextrin nanoparticles as drug delivery system. J Incl Phenom Macrocycl Chem. 2012;72:127–136. doi:10.1007/s10847-011-9950-5
29. Barbas C, Burton D, Scott J, Silverman G. Quantitation of DNA and RNA. Cold Spring Harb Protoc. 2007;11:pdb–ip47.
30. Lotfipour F, Hallaj-Nezhadi S, Valizadeh H, et al. Preparation of chitosan-plasmid DNA nanoparticles encoding interleukin-12 and their expression in CT-26 colon carcinoma cells. J Pharm Pharm Sci. 2011;14:181–195.
31. Mansouri S, Cuie Y, Winnik F, et al. Characterization of folate-chitosan-DNA nanoparticles for gene therapy. Biomaterials. 2006;27:2060–2065. doi:10.1016/j.biomaterials.2005.09.020
32. Bozkir A, Saka OM. Chitosan nanoparticles for plasmid DNA delivery: effect of chitosan molecular structure on formulation and release characteristics. Drug Deliv. 2004;11:107–112. doi:10.1080/10717540490280705
33. Repetto G, Del Peso A, Zurita JL. Neutral red uptake assay for the estimation of cell viability/cytotoxicity. Nat Protoc. 2008;3(7):1125–1131. doi:10.1038/nprot.2008.75
34. Aral C, Akbuga J. Preparation and in vitro transfection efficiency of chitosan microspheres containing plasmid DNA: poly (L-lysine) complexes. J Pharm Pharm Sci. 2003;6:321–326.
35. Livak KJ, Schmittgen TD. Analysis of relative gene expression data using real-time quantitative PCR and the 2−ΔΔCT method. Methods. 2001;25:402–408. doi:10.1006/meth.2001.1262
36. Bordelon H, Biris AS, Sabliov CM, Monroe WT. Characterization of plasmid DNA location within chitosan/PLGA/pDNA nanoparticle complexes designed for gene delivery. J Nanomater. 2011;2011:8. doi:10.1155/2011/952060
37. Deng QY, Zhou CR, Luo BH. Preparation and characterization of chitosan nanoparticles containing lysozyme. Pharm Biol. 2006;44:336–342. doi:10.1080/13880200600746246
38. Nesalin JAJ, Smith AA. Preparation and evaluation of chitosan nanoparticles containing zidovudine. Asian J Pharm Sci. 2012;7:80–84.
39. Amidi M, Romeijn SG, Borchard G, Junginger HE, Hennink WE, Jiskoot W. Preparation and characterization of protein-loaded N-trimethyl chitosan nanoparticles as nasal delivery system. J Control Release. 2006;111:107–116. doi:10.1016/j.jconrel.2005.11.014
40. Mohammadpour Dounighi N, Eskandari R, Avadi MR, Zolfagharian H, Mir Mohammad Sadeghi A, Rezayat M. Preparation and in vitro characterization of chitosan nanoparticles containing Mesobuthus eupeus scorpion venom as an antigen delivery system. J Venom Anim Toxins Incl Trop Dis. 2012;18:44–52.
41. Yuan Y, Tan J, Wang Y, Qian C, Zhang M. Chitosan nanoparticles as non-viral gene delivery vehicles based on atomic force microscopy study. Acta Biochim Biophys Sin. 2009;41:515–526.
 © 2019 The Author(s). This work is published and licensed by Dove Medical Press Limited. The full terms of this license are available at https://www.dovepress.com/terms.php and incorporate the Creative Commons Attribution - Non Commercial (unported, v3.0) License.
By accessing the work you hereby accept the Terms. Non-commercial uses of the work are permitted without any further permission from Dove Medical Press Limited, provided the work is properly attributed. For permission for commercial use of this work, please see paragraphs 4.2 and 5 of our Terms.
© 2019 The Author(s). This work is published and licensed by Dove Medical Press Limited. The full terms of this license are available at https://www.dovepress.com/terms.php and incorporate the Creative Commons Attribution - Non Commercial (unported, v3.0) License.
By accessing the work you hereby accept the Terms. Non-commercial uses of the work are permitted without any further permission from Dove Medical Press Limited, provided the work is properly attributed. For permission for commercial use of this work, please see paragraphs 4.2 and 5 of our Terms.