")
Back to Journals » International Journal of Nanomedicine » Volume 16
In vitro and in vivo Evaluation of a Novel Estrogen-Targeted PEGylated Oxaliplatin Liposome for Gastric Cancer
Authors Sun Y, Xie Y, Tang H, Ren Z , Luan X, Zhang Y, Zhu M, Lv Z, Bao H, Li Y, Liu R, Shen Y, Zheng Y, Pei J
Received 24 September 2021
Accepted for publication 7 December 2021
Published 23 December 2021 Volume 2021:16 Pages 8279—8303
DOI https://doi.org/10.2147/IJN.S340180
Checked for plagiarism Yes
Review by Single anonymous peer review
Peer reviewer comments 5
Editor who approved publication: Professor Lei Yang
Yuxin Sun,* Yizhuo Xie,* Huan Tang, Zhihui Ren, Xue Luan, Yan Zhang, Ming Zhu, Zhe Lv, Han Bao, Yan Li, Rui Liu, Yujia Shen, Yucui Zheng, Jin Pei
Department of Biopharmacy, School of Pharmaceutical Sciences, Jilin University, ChangChun, People’s Republic of China
*These authors contributed equally to this work
Correspondence: Jin Pei
School of Pharmaceutical Sciences, Jilin University, 1163 Xinmin Street, ChangChun, 130021, Jilin Province, People’s Republic of China
Tel +86 431 85619725
Email [email protected]
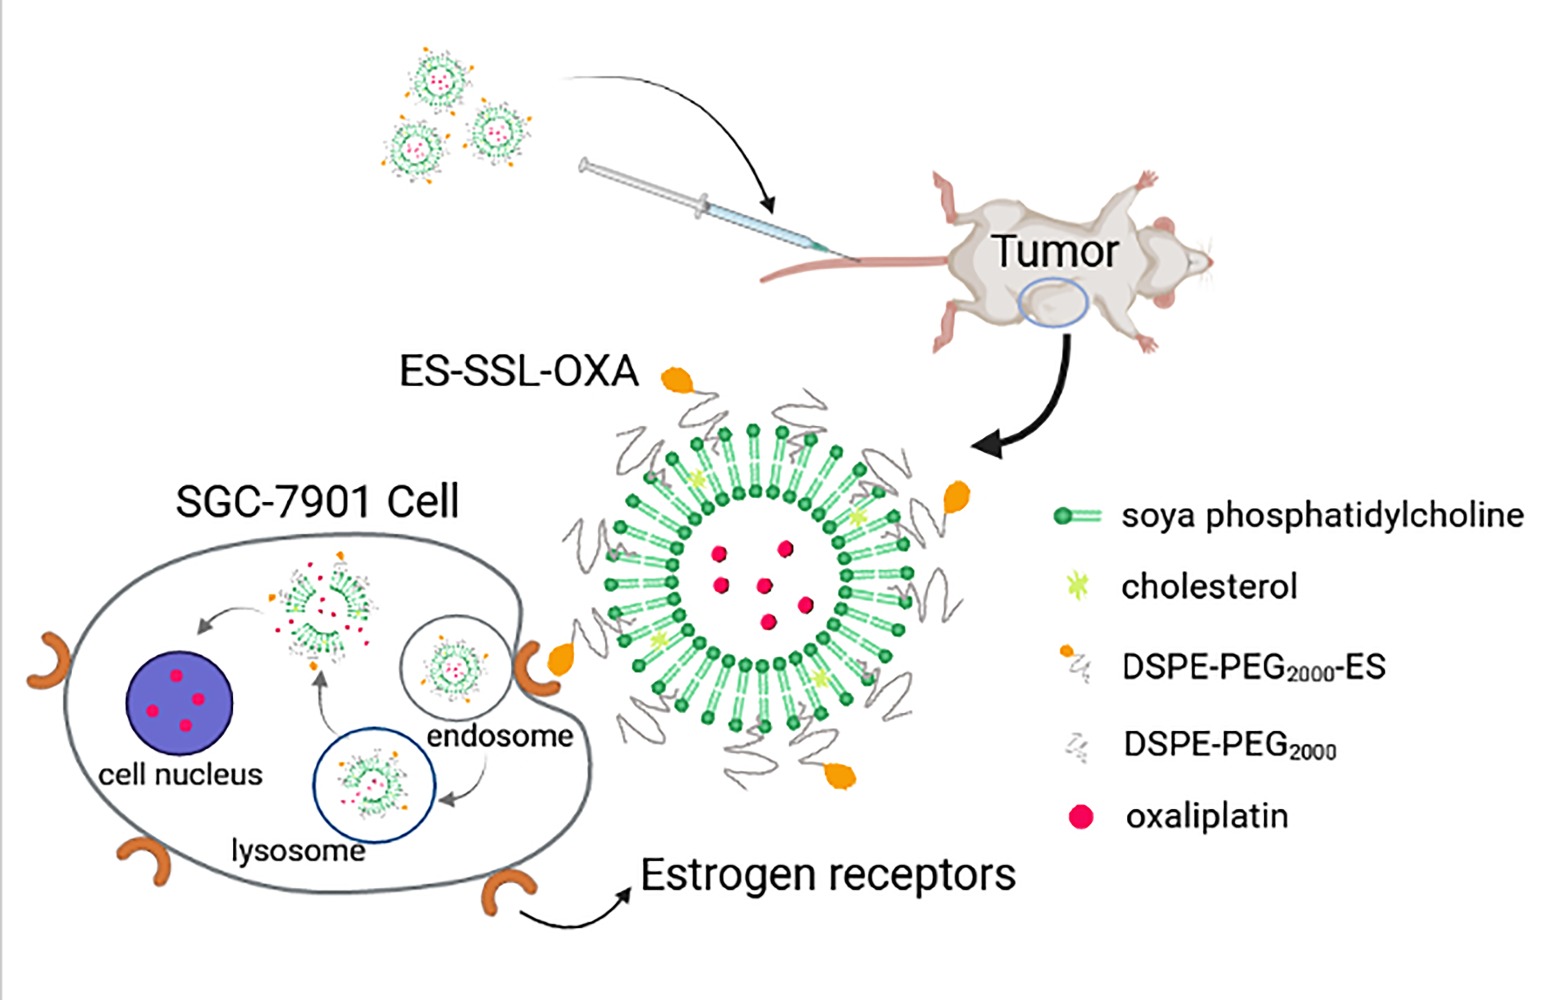
Background: Chemotherapy is still the main first-line treatment for advanced metastatic gastric cancer, but it has the limitations of serious side effects and drug resistance. Conventional liposome has been substantially used as drug carriers, but they lack targeting character with lower drug bioavailability in tumor tissues. Based on the above problems, a novel estrogen-targeted PEGylated liposome loaded with oxaliplatin (ES-SSL-OXA) was prepared to further improve the metabolic behavior, the safety profile, and the anti-tumor efficacy of oxaliplatin.
Methods: Four kinds of oxaliplatin (OXA) liposomes were prepared by film hydration method. The obtained formulations were characterized in terms of entrapment efficiency (EE), particle size, and so on by HPLC and DLS (dynamic light scanning). The morphology of ES-SSL-OXA was detected by transmission electron microscope (TEM). The in vitro and in vivo targeting effect of ES-SSL-OXA was verified by fluorescence microscopy and in vivo imaging system in gastric cancer cells (SGC-7901) and tumor-bearing athymic mice. The in vitro and in vivo antitumor efficacies of ES-SSL-OXA were investigated on SGC-7901 cells and athymic tumor-bearing mice. Pharmacokinetic, biodistribution, and acute toxicity tests of ES-SSL-OXA were performed on ICR mice.
Results: The ES-SSL-OXA exhibited an average particle size of about 153.37 nm with an encapsulation efficiency of 46.20% and low leakage rates at 4°C and 25°C. In vivo and in vitro targeting study confirmed that ES-SSL-OXA could effectively target the tumor site. The antitumor activity demonstrated the strongest inhibition in tumor growth of ES-SSL-OXA. Pharmacokinetics and acute toxicity study showed that ES-SSL-OXA could significantly improve the metabolic behavior and toxicity profile of oxaliplatin.
Conclusion: In this study, a novel estrogen-targeted long-acting liposomal formulation of OXA was successfully prepared. ES fragment effectively targeted the delivery system to tumor tissues which highly express estrogen receptor, providing a promising therapeutic method for gastric cancer in clinic.
Keywords: estrogen receptors, chemotherapy, long-acting liposomes, targeted drug delivery, pharmacokinetics, antitumor activity
Graphical Abstract:
Introduction
Gastric cancer (GC) is the fifth most common cancer in the world.1 It is the third leading cause of cancer-related deaths worldwide with the highest mortality rate in eastern Asia.2 The diagnosis of GC in most patients is commonly in the advanced stage, and the prognosis of GC treatment remains poor. Despite the advances that have been made in GC therapy such as chemotherapy, the 5-year overall survival (OS) rate of metastatic gastric adenocarcinoma is estimated to be only around 5–20%.3 At present, chemotherapy is still the main first-line treatment for advanced metastatic gastric cancer.4
Oxaliplatin (OXA), (1R-trans)-(1,2-cyclohexanediamine-N,N’)[oxalic acid (2-)-O,O’] platinum, is third-generation platinum compound with significant activity against advanced or metastatic digestive tumors5 through the cross-linking of platinum atoms with DNA strands that blocks the replication and transcription of DNA.6,7 Oxaliplatin is considered a standard of GC treatment by National Comprehensive Cancer Network Guidelines for gastric cancer.8 However, oxaliplatin, like other chemo-drug, has serious side effects, not only gastrointestinal toxicity including nausea, vomiting, diarrhea, and mucosal inflammation, but also serious neurological toxicity and system toxicity.9–11 Unlike other platinum-based drugs, the main side effect of OXA is polyneuropathy, which is ascribed to its pharmacokinetics properties, such as highly irreversible binding to plasmatic proteins and tissue proteins.5,12 In addition, because traditional chemotherapy has no targeting property to maintain high drug concentration in the tumor, the antitumor effect does not achieve the optimization and meanwhile the drug in normal tissues causes numerous adverse effects. In order to solve these problems, the encapsulation of chemo-drugs in liposome represents a strategy to overcome these limitations.13,14
Liposomes have been widely used as drug carriers due to their biocompatible and biodegradable characteristics.15 However, liposomes have low stability in physiological media and mainly accumulate in reticuloendothelial system (RES) like liver and kidney.16 Since PEGylation can significantly reduce recognition by RES, liposomes have been modified with polyethylene glycol (PEG) to improve biological stability and bioavailability.17–19 Therefore, chemo-drugs loaded in PEGylated liposome could be delivered to cancer cells more efficiently and stably.
Even though conventional and PEGylated liposomes have been widely used as a drug delivery system, the deficiency of the carrier is that it has no targeting property in tumor tissues. Recently, researchers have focused on tumor-targeted liposomal delivery system. Lactoferrin,20 galactose21 and glycyrrhetinic acid,22,23 and so on were used to modify liposomes to target drugs into the tumor tissue more effectively. Estrogen receptors belong to the nuclear receptor protein family24 involved in various physiological processes such as cell growth, reproduction, development, and differentiation.25,26 However, their over-expression has been reported in various malignant tumors, such as breast,27 ovarian,28 cervical, lung, and gastric cancer.29 Studies have shown that 40–50% of gastric cancer tissues expressed estrogen receptor.30–32 Estrogen receptors have been isolated in many gastric adenocarcinomas.33 Based on the above reports, we believe that estrogen receptor could be an effective target spot for the treatment of gastric cancer.
In our previous study, we had successfully synthesized DSPE-PEG2000-ES fragment as a targeting ligand for tumor cells which highly express estrogen receptor.34 The in vitro and in vivo results indicated that ES can effectively target the delivery system to tumor tissues which highly express estrogen receptor. In this study, a novel ES-targeted PEGylated liposome (termed as ES-SSL) loaded with OXA (ES-SSL-OXA) was prepared for gastric cancer which highly express estrogen receptor. The morphology and physical and chemical properties of ES-SSL-OXA were determined. The drug release behavior and stability of ES-SSL-OXA were studied. The in vitro and in vivo targeting efficiency of ES-SSL-OXA were detected. The uptake mechanism of SGC-7901 for ES-SSL-OXA was investigated. The ability of the ES-SSL-OXA against the cancer cell proliferation was studied in SGC-7901 cells. The in vivo antitumor efficacy of ES-SSL-OXA was evaluated in SGC-7901 tumor-bearing athymic mice. Moreover, pharmacokinetics, biodistribution, and acute toxicity tests were determined in ICR mice.
Materials and Methods
Materials
Oxaliplatin (OXA) was purchased from Yuanye Biotechnology Co., Ltd. (Shanghai, China). Soya phosphatidylcholine was purchased from Guangfu Fine Chemical Research Institute (Tianjin, China). Cholesterol was bought from Huishi Biochemical Reagent Co., Ltd. (Shanghai, China). 1,2-distearoyl-sn-glycero-3-phosphoethanolamine-N-[amino (polyethylene glycol)-2000] (DSPE-PEG2000-NH2) was purchased from Nanocs Inc. (New York, USA). Estrone was purchased from TCI Development Co., Ltd. (Shanghai, China). 1,2-distearoyl-sn-glycero-3-phosphoethanolamine-N-[methoxy (polyethylene glycol) 2000] (DSPE-mPEG2000) was obtained from Seebio Biotech Co., Ltd. (Shanghai, China). 3-(4, 5-Dimethylthiazol-2-yl)-2,5-diphenyltetrazoliumbromide (MTT) is the product of MYM Biochemical Reagent Co., Ltd. (Beijing, China). Rhodamine B (RhB) was purchased from Tianjin Guangfu Fine Chemical Research Institute. DiR was purchased from Meilun Biotechnology (Dalian, China). All the reagents were of analytical or HPLC grade.
Cells
Human gastric cancer cell (SGC-7901) was purchased from Procell Life Science & Technology Co., Ltd. (Wuhan, China) and authenticated by Short Tandem Repeat (STR) profiling. Cells were cultured in RPMI-1640 medium,35 supplemented with 10% fetal bovine serum (FBS), 1% penicillin, and 1% streptomycin at 37°C in an environment containing 5% CO2.
Animals
5–6 weeks old (20.0 ± 2.0 g) BALB/c nude mice were purchased from Vital River Laboratory Animal Technology Co., Ltd. (Beijing, China) and the animal license number is SCXK Beijing 2012-0001. ICR mice of specific pathogen free (SPF) were purchased from the Experimental Animal Center of the Basic Medical College of Jilin University (Changchun, China). The animals were fed a standard diet and allowed water ad libitum. All animal procedures complied with the China National Institute’s Guidelines on the Care and Use of Laboratory and approved by the Ethics Committee of the School of Pharmaceutical Sciences, Jilin University (Approval No. 20150012, Approval No. 20170019). All experimental procedures were performed in accordance with the ethics and regulations of general animal experiments at Jilin University.
Preparation of Liposomes
For the optimal conditions for the preparation of the final product, the liposomes in our study were composed of phospholipids and cholesterol, which formed the shell-core structure with hydrophilic core and the phospholipid bilayer. For the phospholipid selection, the effects of soybean lecithin and egg yolk lecithin on the encapsulation efficiency were investigated, and the results showed that soybean lecithin has a better encapsulation efficiency on OXA. For the ratio of phospholipid to cholesterol, the effect of different ratios of phospholipid to cholesterol on the encapsulation efficiency was explored through preliminary experiments. The results showed that the encapsulation efficiency of OXA was the highest when the mass ratio of phospholipid to cholesterol was 5:1. Besides that, several key preparation conditions, such as ratio of OXA to phospholipid, hydration volume, hydration time, and hydration temperature, were studied through preliminary experiments. Thereby, a preparation method with higher encapsulation efficiency and drug loading was obtained.
Based on the above studies, the final product of the ES-targeted PEGylated OXA liposomes (ES-SSL-OXA) was prepared employing the film hydration method.12 Briefly, 40.0 mg of soya phosphatidylcholine (SPC), 8.0 mg of cholesterol (CHO), and 2.7 mg of DSPE-mPEG2000 were dissolved in 8.0 mL of chloroform in a round-bottomed flask. The organic solvent was removed to form the thin film by evaporation in a rotary evaporator (Rotary Evaporator R201D; Yukang Science and Equipment Co., Ltd, Shanghai, China) at 37°C for 1 h. Then, the lipid film was hydrated with 4.0 mL of 5.0% dextrose solution36 containing 4.0 mg of oxaliplatin at 37°C for 2 h, followed by sonication for 5 min at 100 W with an ultrasound probe at 4°C to form the PEGylated OXA liposomes (SSL-OXA). Finally, 0.5 mg of DSPE-PEG2000-ES (DSPE-PEG2000-ES, produced as described previously34) was added to form the ES-targeted PEGylated OXA liposome (ES-SSL-OXA). The formulations were then sequentially extruded through 450 nm and 220 nm polycarbonate membrane three times. In addition, the ES-targeted non-PEGylated liposome (ES-L-OXA) was prepared without DSPE-mPEG2000, the non-targeted PEGylated liposome (SSL-OXA) was prepared without DSPE-PEG2000-ES, and the non-targeted and non-PEGylated liposome (L-OXA) was prepared without DSPE-mPEG2000 and DSPE-PEG2000-ES. The formulation composition of OXA liposomes is shown in Table 1.
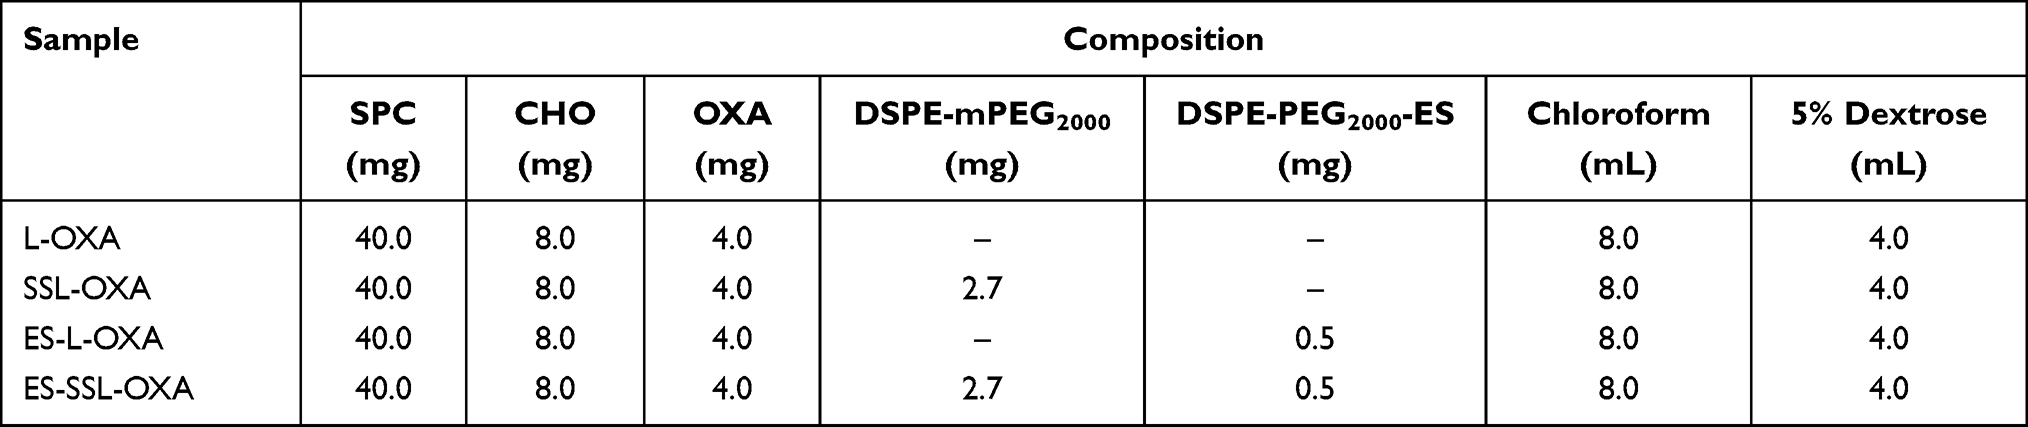 |
Table 1 The Formulation Composition of OXA Liposomes |
The rhodamine B liposome (L-RhB) (SPC: CHO = 11:9, molar ratio), the PEGylated rhodamine B liposome (SSL-RhB) (SPC: CHO: DSPE-mPEG2000 = 11:9:1, molar ratio), the ES-targeted rhodamine B liposome (ES-L-RhB) (SPC: CHO: DSPE-PEG2000-ES = 11:9:0.1, molar ratio), and the ES-targeted PEGylated rhodamine B liposome (ES-SSL-RhB) (SPC: CHO: DSPE-mPEG2000: DSPE-PEG2000-ES = 11:9:1:0.1, molar ratio) were prepared by the film hydration method. The molar ratio of rhodamine B to lipids was 1:30. The SPC, CHO, and DSPE-mPEG2000 were dissolved in chloroform in a round-bottomed flask. The film was formed by rotary evaporation at 37°C for 1 h. Then, the lipid film was hydrated with PBS containing RhB at room temperature for 2 h, followed by sonication for 10 min. The formulations were then dialyzed in a dialysis bag (MWCO = 8–10 kDa) for 4 h in 1.0 L PBS to remove the un-encapsulated rhodamine B.
The PEGylated DiR liposome (SSL-DiR) (SPC: CHO: DSPE-mPEG2000 = 11:9:1, molar ratio) and the ES-targeted PEGylated DiR liposome (ES-SSL-DiR) (SPC: CHO: DSPE-mPEG2000: DSPE-PEG2000-ES = 11:9:1:0.1, molar ratio) were prepared by the film hydration method. The molar ratio of DiR to lipids was 1:1000. The SPC, CHO, DSPE-mPEG2000, and DiR were dissolved in chloroform in a round-bottomed flask to form a lipid film, and then the lipid film was hydrated with PBS. The liposome suspension preparation was performed as described in section of preparation of the rhodamine B liposomes.
Encapsulation Efficiency and Drug Loading
The encapsulation efficiency (EE) and drug loading (DL) of OXA in different formulations were quantified by the high-performance liquid chromatography (HPLC, Shimadzu, Japan). 0.1 mL of oxaliplatin liposome solution without dialysis was taken and demulsified with 0.9 mL sodium dodecyl sulfate (SDS) solution. The total content of oxaliplatin was determined by HPLC, which was recorded as W0. Un-encapsulated free OXA was removed by dialysis in 500 mL, 5.0% dextrose solution for 3 h, and then 0.1 mL of liposomal solution was added with 0.9 mL SDS solution for sonicating 10 min to break liposomes. DETC was added into demulsified liposome solution at a molar ratio of 5:1 to OXA. The samples were incubated at 37°C for 30 min. Then isopyknic chloroform was added into the sample following vortexing for 1 min. The chloroform layer that contains OXA was collected by 10,000 rpm centrifugation for 10 min at 4°C. The content of oxaliplatin was determined by HPLC at 254 nm, which was recorded as W.
The EE and DL of OXA were calculated using the following formulas:


WL is the total mass of OXA liposomes, which is the sum of phospholipid, cholesterol, DSPE-mPEG2000, DSPE-PEG2000-ES, and OXA.
The HPLC method37,38 was established as follows: Column: Shimadzu C18 reverse phase column (150.0 mm × 4.6 mm, 5.0 μm), column temperature: 25°C, mobile phase: methanol-water (78:22, v/v), detection wavelength: 254 nm, flow rate: 1.0 mL/min, injection volume: 20.0 μL. The chromatographic method was validated according to the requirement of Chinese Pharmacopoeia, including limit of detection, limit of quantitation, intra- and inter-day precision, and so on. The standard curve formula of OXA was y=13355x-4406, R2=0.9999. All those above indicated that establishment of HPLC method for determination of encapsulation efficiency and drug loading was feasible and repeatable.
The Morphology of Liposomes
The morphology of liposomes was analyzed by transmission electron microscopy (TEM) (JEM-2100F; JEOL Ltd., Tokyo, Japan). For TEM sample preparation, ES-SSL-OXA was dropped onto a pure carbon film copper mesh and stained with 2.0% phosphotungstic acid.39
The Particle Size, PDI, and Zeta Potential
The particle size, polydispersity index (PDI), and zeta potential of different liposomes containing OXA (L-OXA, ES-L-OXA, SSL-OXA, and ES-SSL-OXA) were measured using the dynamic light scanning (DLS) (Zetasizer Nano ZS90; Malvern Instruments, Worcestershire, UK). Formulations were diluted 1:100 (v/v) in deionized water and measured at 25°C.
Drug Release Study
The release behaviors of OXA from different liposomes (L-OXA, SSL-OXA, ES-L-OXA, and ES-SSL-OXA) were analyzed by dialysis method. Briefly, the dialysis bag (MWCO = 8–10 kDa) containing 2.0 mL of liposomal solution was transferred to a beaker containing 100.0 mL of release medium (0.01 M PBS, pH 7.4)6,40 by maintaining the temperature at 37°C, with continuous stirring at 100 rpm for 48 h. At different time points of 1, 2, 4, 8, 12, 24, and 48 h, 1.0 mL of release medium was withdrawn and replaced with an equal volume of fresh medium. The amount of OXA released into the collected media was analyzed by HPLC method as described above.
Stability Study
Stability studies of the liposomes were carried out at 25°C ± 2°C and 4°C ± 1°C in 5.0% dextrose solution.41,42 At different time points of 0, 1, 2, 4, 8, 24, and 48 h, the free OXA was removed as mentioned above. The concentrations of OXA inside the liposomes (L-OXA, SSL-OXA, ES-L-OXA, and ES-SSL-OXA) were determined by HPLC method and recorded as Cn (n = 0, 1, 2, 4, 8, 24 or 48 h). The drug leakage rate was calculated using the following formula:

In vitro Targeting Evaluation
Fluorescence microscopy (Olympus IX71, Japan) was used to observe targeting capacity of rhodamine B liposomes into ER-positive SGC-7901 cells. The SGC-7901 cells were seeded into 24-well plates with a density of 1.0 × 10⁵ cells/well and incubated in a humidified atmosphere of 5% CO2 at 37°C. After 12 h incubation, media containing L-RhB, ES-L-RhB, SSL-RhB, or ES-SSL-RhB were separately added to the cells. The cells were incubated continuously for 1, 2, 3, and 4 h. Then, the medium was aspirated and the cells were washed 3 times with cold PBS. Hoechst 33342 solution as a nuclear dye was added to each well for 30 min at a temperature of 37°C. Fluorescence intensity of different rhodamine B formulations was observed under an inverted fluorescence microscope.
Endocytosis Mechanisms
Endocytosis can be inhibited with 10.0 μg/mL sucrose, 150.0 μM genistein, or 50.0 μM 5-(N-ethyl-N-isopropyl) amiloride, which are inhibitors of clathrin-mediated endocytosis, caveolae-mediated endocytosis43 or macropinocytosis,44 respectively. Besides, estrogen was used as a competitive inhibitor to block the estrogen receptors on the surface of SGC-7901 cells.45,46 Briefly, SGC-7901 cells were seeded in 24-well plates at a density of 1.0×10⁵ cells/well. The cells were cultured with 1.0 mL/well of RPMI 1640 complete medium containing 10% FBS. After cells grew to confluency, estrogen or the three endocytosis inhibitors including sucrose, genistein, and amiloride were added to the cells, respectively, for an incubation time of 30 min. Then, ES-SSL-RhB medium solution was added to each well for an incubation time of 2 h. After incubation, the medium was removed, and the cells were washed 3 times with cold PBS.41 The fluorescence intensity of the cells was observed under an Olympus IX71 fluorescence microscope.
In vivo Targeting Study
BALB/c nude mice weighing 20.0 ± 2.0 g were inoculated subcutaneously on the back of mouse with 1.0×10⁷ cells/0.2 mL of SGC-7901. When the tumor volume reached about 200 mm3, the mice were randomly divided into two groups, including SSL-DiR group and ES-SSL-DiR group. Each group received a single dose of 500.0 ng DiR/mouse by tail vein injection.47 At the time point of 1, 2, 6, 12, and 24 h (n=3 for each time point) after injection, mice were anesthetized with 10% chloral hydrate. The tissue biodistribution of the drug in anesthetized mice was photographed using a live imaging system (IVIS SPECTRUM, USA). Then euthanasia was performed on animals, and the tumor, heart, liver, spleen, lungs, and kidneys of the mice were collected for detection of fluorescence intensity.
Cytotoxicity Assay
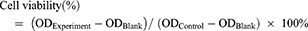
The cytotoxicity of different OXA formulations on SGC-7901 cells was determined using MTT assay.48 Briefly, SGC-7901 cells in the logarithmic growth phase were seeded triplicated into 96-well culture plates at a density of 1.0×10⁴ cells/well overnight in a humidified atmosphere of 5% CO2 at 37°C. Then, cells were incubated with OXA, blank liposome (Blank-L), L-OXA, ES-L-OXA, SSL-OXA, and ES-SSL-OXA for 24, 48 and 72 h, respectively, in which the OXA concentration was 1.0–100.0 µg/mL. Subsequently, each well was incubated with 5.0 mg/mL, 20.0 μL MTT for 4 h. The medium was carefully removed, and 150.0 μL DMSO was added to each well. The optical density (OD) value of each well was measured at 490 nm with a microplate reader. The cell viability was calculated by the following equation, and the 50% inhibitory concentration (IC50) was calculated according to the cell viability:
In vivo Antitumor Activity
SGC-7901 tumor-bearing BALB/c nude mice models were used to evaluate the therapeutic efficacy of ES-SSL-OXA. When the tumor volume reached about 100 mm3, the mice were randomly divided into five groups, with each group of 6 mice treated with normal saline, blank liposome (Blank-L), free OXA, SSL-OXA, and ES-SSL-OXA. Each preparation was administered via the tail vein at a dose of 2.5 mg OXA/kg body weight every 2 days. Tumor volume and body weight were measured twice a week. When the diameter of the tumor in the Normal Saline group reached 17.0 mm, animals were sacrificed and dissected. By the end of the experiment, all animals were sacrificed and dissected. Tumors, heart, liver, spleen, lungs, and kidneys were collected and weighed. The tumor volumes were calculated to assess the anti-tumor efficacy. The tumor weight was measured to calculate the tumor inhibition rate. Tumor volumes, tumor inhibition rate, and organ coefficient were calculated by the following equations:

“a” is the major axis length, and “b” is the minor axis length.49
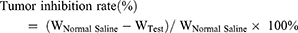
“WNormal Saline” is the tumor weight of Normal Saline group, and “WTest” is the tumor weight of Blank-L, Free OXA, SSL-OXA, or ES-SSL-OXA group.

Pharmacokinetics and Biodistribution Determination
One hundred and seventeen ICR mice were randomly divided into three groups of OXA, L-OXA, and ES-SSL-OXA. Each group of 39 mice was administered with a single dose of 10.0 mg/kg of free OXA, L-OXA, or ES-SSL-OXA via tail vein injection, respectively. At different time points (n=3)50,51 of 5, 10, 15, and 30 min, 1, 2, 4, 6, 8, 12, 24, 36, and 48 h after IV injection, 0.5 mL of blood sample of each mouse was collected into heparinized tubes. The animals were sacrificed and dissected to collect main organs of heart, liver, spleen, lungs, and kidneys. The collected blood was immediately processed for plasma by centrifugation at 3000 rpm for 10 min. Plasma samples were frozen at −20°C until analysis. The collected organs were washed with a normal saline solution to be stored at −20°C until analysis.
The concentration of OXA in plasma and organs was determined by a Shimadzu chromatograph (Shimadzu, Japan) using the Shimadzu C18 reverse phase column (150.0 mm × 4.6 mm, 5.0 μm) at room temperature. The mobile phase consisted of ultra-pure grade water and methanol (22:78 v/v). The flow rate was 1.0 mL/min. The effluent was monitored at 254 nm. Experimental scheme of pharmacokinetics was validated according to Technical Guidelines for Non-clinical Pharmacokinetic Research of Drugs by Center for Drug Evaluation of NMPA (National Medical Products Administration) in China, including specificity, limit of detection, limit of quantitation, intra- and inter-day precision, recovery rate, stability, and so on. All the R2 values were >0.9990 in the standard curves for the detection of plasma, heart, liver, spleen, lungs, and kidneys. Briefly, 200.0 μL plasma or tissue homogenate was mixed with 400.0 μL acetonitrile, following the centrifugation at 10,000 rpm to obtain the supernatant. The supernatant was dried with nitrogen and added with 200.0 μL of 5.0% dextrose solution. The sample was extracted with 50.0 μL DETC (dissolved in NH3-NH4Cl buffer solution, pH 9.0) in water bath at 37°C for 30 min. Finally, 200.0 μL of chloroform was added to extract OXA, and the chloroform layer which contains OXA was collected by 10,000 rpm centrifugation for 10 min. The injection volume was 20.0 μL. Pharmacokinetic parameters were calculated using Drug and Statistics 2.0 (DAS 2.0) software.52–54
Acute Toxicity Studies
One hundred and eighty healthy ICR mice, male and female, were assigned randomly into four groups, including the Normal Saline group, Free OXA group, L-OXA group, ES-SSL-OXA group. Administration dosages were designed based on a preliminary study. Each dose assigned 10 mice. OXA group received a dose of 10.0, 12.0, 14.0, 16.0, 18.0, or 20.0 mg/kg. L-OXA group received a dose of 10.0, 13.0, 16.0, 19.0, or 22.0 mg/kg. ES-SSL-OXA group received a dose of 10.0, 13.0, 16.0, 19.0, 22.0, or 25.0 mg/kg. The mice were administered a single dose via tail vein injection after 12 h of fasting. All animals were monitored daily to be recorded with their body sign, body weight, and mortality till 14 days. At the end of experiment, blood was taken from the eye socket of the remaining surviving mice after removing eyeball for a blood test by a hematology analyzer. Part of the blood was centrifuged at 3000 rpm for 10 min for creatinine and urea nitrogen determination by a blood biochemical analyzer. The mice were sacrificed for collection of heart, liver, spleen, lungs, and kidneys. The organs were weighed for calculating the organ coefficients.55 The calculation formula of organ coefficients is consistent with the method of in vivo antitumor activity.
Statistical Analysis
Statistical analysis was performed using GraphPad Prism 5.0 software. One-way analysis of variance (ANOVA) was performed using the mean ± standard deviation (mean ± SD). The comparison of mortality was carried out by chi-square test using IBM SPSS Statistics 22. p < 0.05 was considered as significant different.
Results and Discussion
Encapsulation Efficiency and Drug Loading
The four formulations of liposomes named L-OXA, ES-L-OXA, SSL-OXA, and ES-SSL-OXA were prepared using the film hydration method. The encapsulation efficiency and drug loading were determined by dialysis and HPLC method. As shown in Table 2, the encapsulation efficiency of the four liposomes formulations was 45.40–49.90%, and the drug loading was 2.98–3.84%. There is no significant difference in encapsulation efficiency and drug loading efficacy among the four preparations, which indicated that the addition of DSPE-PEG2000-ES molecule had little influence on the encapsulation efficiency and drug loading of oxaliplatin. This was mainly because the targeting fragment of DSPE-PEG2000-ES was used at a very low concentration of 0.125 mg/mL in formulations, and the ES molecule was located on the surface of the liposome particle, while DSPE-mPEG2000 molecule was a commonly used lipid composition in the liposome delivery system. It is worth noting that the encapsulation efficiency of the four liposome formulations was higher than that of the previous reports.9,12
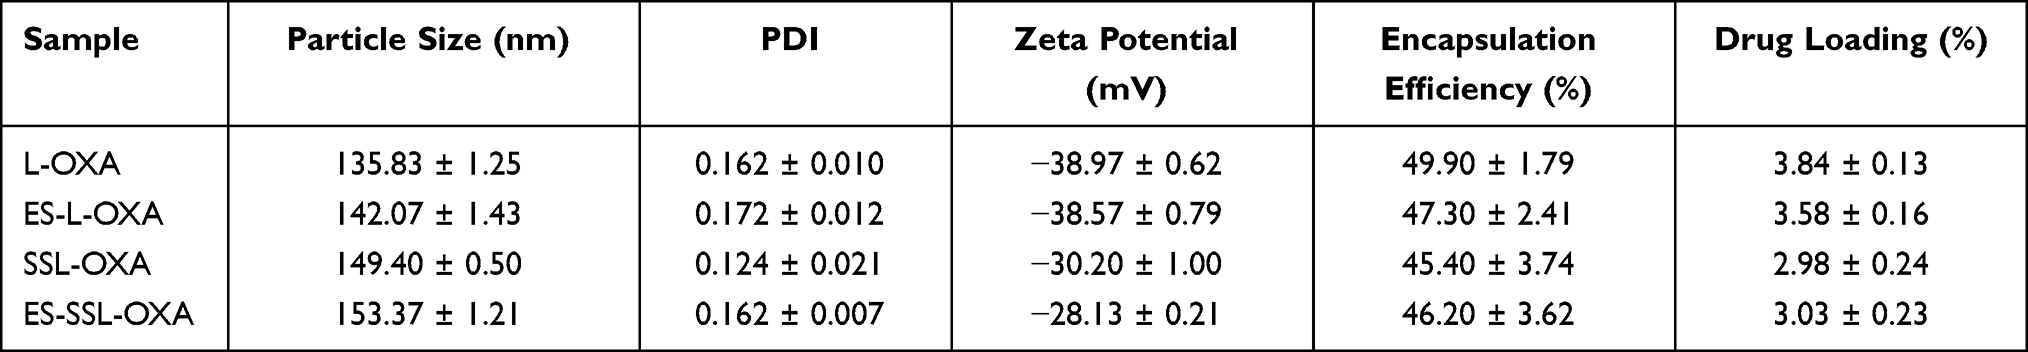 |
Table 2 The Characterization Properties of OXA Liposomes (n=3) |
The Morphology of ES-SSL-OXA
The morphology of the ES-SSL-OXA was observed by TEM. As shown in Figure 1, most liposomes present spherical shapes in a uniform distribution without aggregation.
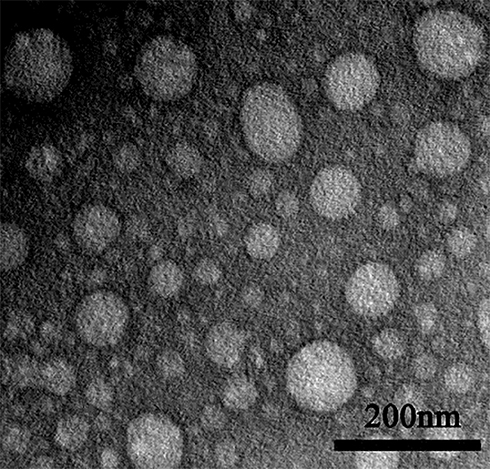 |
Figure 1 Transmission electron microscope photographs of ES-targeted PEGylated liposome loaded with OXA (n=3). The nanoparticles were stained with 2.0% phosphotungstic acid. |
The Particle Size, PDI, and Zeta Potential
As the results determined by dynamic light scattering (DLS) analysis shown in Table 2 and Figure 2, the particle sizes of the four preparations of L-OXA, ES-L-OXA, SSL-OXA, ES-SSL-OXA uniformly distributed and showed a normal distribution curve, in which 60% of the nanoparticles were between 130 and 140 nm. Compared to L-OXA, the particle size of ES-SSL-OXA (153.37 ± 1.21 nm) was slightly increased due to the introduction of PEG ligand and ES targeting ligand. The PDI of the four liposomes ranged from 0.12 to 0.18, indicating that the particle size distribution of the OXA liposomes was uniformly dispersed. The four liposomes were shown to be negatively charged, wherein L-OXA zeta potential was −38.97 ± 0.62 mV, and ES-L-OXA was −38.57 ± 0.79 mV. The zeta potential of SSL-OXA and ES-SSL-OXA was −30.20 ± 1.00 mV and −28.13 ± 0.21 mV, respectively, which was higher than that of L-OXA and ES-L-OXA, most likely due to the introduced PEG molecule. In addition, it was found that the targeting fragment DSPE-PEG2000-ES did not have a significant effect on the zeta potential. Like the references reported,56,57 when the absolute value of zeta potential exceeded 30 mV, the liposomes were regarded as highly stable because the relatively high charge could prevent the particles from flocculating to make the liposomes become more stable, indicating that the ES-SSL-OXA prepared was with a good stability.
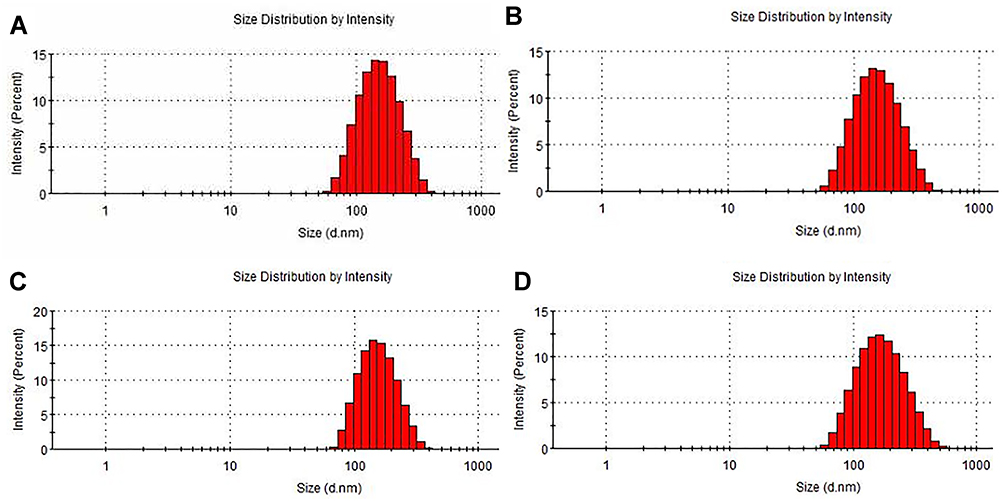 |
Figure 2 Particle size distribution of OXA liposomes. Liposomes particle sizes of (A) L-OXA, (B) ES-L-OXA, (C) SSL-OXA and (D) ES-SSL-OXA were measured using dynamic light scattering (DLS) analysis by Malvern Nano-ZS90 particle size analyzer. |
Drug Release Study
The drug release behavior was determined by dialysis and HPLC method. The cumulative release curve (Figure 3) shows that the four OXA liposomal formulations had sustained and slow-release behavior in PBS buffer solution (pH 7.4) at 37°C. The cumulative release rates of L-OXA, ES-L-OXA, SSL-OXA, and ES-SSL-OXA were 90.15%, 91.34%, 84.22%, and 85.29% at 24 h, and 94.63%, 95.03%, 88.10%, and 87.96% at 48 h, respectively. The release rates of liposomal formulations with the PEG groups (SSL-OXA and ES-SSL-OXA) were significantly lower than that of liposomal formulations without the PEG groups (L-OXA and ES-L-OXA), suggesting that the introduction of PEG in SSL-OXA and ES-SSL-OXA may slow down the drug release. This might be due to the shielding and protection of the liposomal membrane by the sterically hindered PEG molecules.58 The slow-release characteristics of the PEGylation liposomal formulations may be beneficial to the liposomal delivery system that could deliver the majority of encapsulated drugs to the target site without releasing the drugs during systemic circulation because of the escape from recognition by the reticuloendothelial system’s phagocytosis.58,59
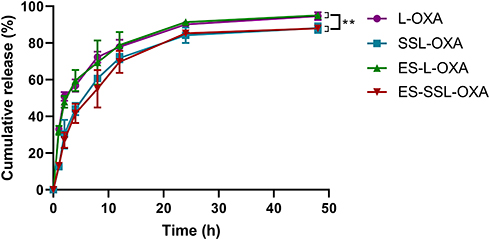 |
Figure 3 The release profiles of OXA liposomal formulations. The drug release study was taken in 100.0 mL of release medium (0.01 M PBS, pH 7.4) at 37°C by dialysis method. At different time points of 1, 2, 4, 8, 12, 24 and 48 h, the amount of OXA released into the release medium was analyzed by HPLC method. Data are expressed as the mean ± SD, n = 3. **p < 0.01 compared with non-PEGylated liposome, including L-OXA and ES-L-OXA. |
Stability Study
The stability of ES-SSL-OXA was determined by dialysis and HPLC methods to preliminarily determine the longest storage time of freshly prepared liposomal formulations. As shown in Figure 4B, the leakage rates of the four OXA liposomes stored at room temperature for 48 h were all less than 20%, suggesting that the liposome preparations were relatively stable. The leakage rate of ES-SSL-OXA and SSL-OXA was lower than that of ES-OXA and L-OXA mainly due to its higher membrane stability by the introduction of PEG molecules. The PEG molecule could form a molecular barrier on the surface of liposomes, which could improve the stability of the liposomes.60–62 The leakage rate of ES-SSL-OXA at 48 h was the lowest, which was only about 13% of its original encapsulation efficiency. When the OXA liposomes were stored at 4°C (Figure 4A) for 24 h and 48 h, the leakage rate of the four liposomal formulations was less than 10%, indicating the liposome preparations were more stable at 4°C. The 24 h and 48 h leakage rate of ES-SSL-OXA were the lowest of 5% and 6%, indicating that 4°C was the better storage condition for ES-SSL-OXA formulation.
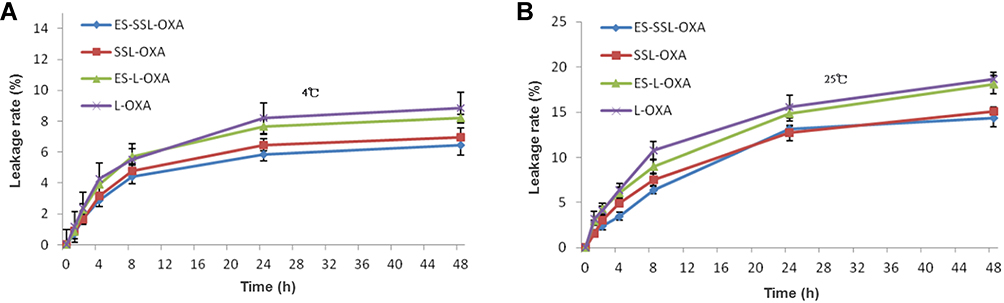 |
Figure 4 In vitro leakage rates of OXA liposomal formulations. Liposomes were stored for 48 h at 4°C (A) and at 25°C (B) in 5% dextrose solution. At different time points of 0, 1, 2, 4, 8, 24 and 48 h, the free OXA was removed by dialysis and OXA encapsulated in the liposomes were quantified by HPLC. Data are expressed as the mean ± SD, n = 3. |
In vitro Targeting Efficiency
The cellular uptake of ES-SSL-RhB representative ES-SSL-OXA at different time points was evaluated in SGC-7901 gastric tumor cells, which highly express estrogen receptor, by fluorescence microscope. As RhB can be visualized as red fluorescence, and the fluorescence intensity of RhB inside the cells was used to indicate the cellular uptake of ES-SSL-RhB in this study. As shown in Figure 5A and B, at the 1 h time point after incubation, the four different preparations of L-RhB, ES-L-RhB, SSL-RhB, and ES-SSL-RhB began to aggregate inside the SGC-7901 cells. The red fluorescence intensity of the ES-SSL-RhB in SGC-7901 cells was a little higher than that of the ES-L-RhB. After incubation for 2 h, the amount of fluorescence aggregation reached the maximum intensity. The uptake of ES-L-RhB and ES-SSL-RhB was significantly higher than that of the L-RhB and SSL-RhB (p < 0.05), indicating that ES fragments could specifically recognize and bind to estrogen receptors on the surface of SGC-7901 cells, so that more liposomes were endocytosed inside cells. At the 3 h time point after incubation, it could be observed that the fluorescence intensity of L-RhB and SSL-RhB began to decrease, while the ES-L-RhB and ES-SSL-RhB remained at a higher level of fluorescence intensity. When SGC-7901 cells were incubated with different liposomal formulation for 4 h, most fluorescence intensities of L-RhB and SSL-RhB had been vanished in the SGC-7901 cells, whereas the fluorescence intensity of ES-SSL-RhB still retained in SGC-7901 cells and significantly higher than that of L-RhB (p < 0.05) as shown in Figure 5B. The results showed that ES-SSL-RhB could bind to the ES receptor highly expressed on the surface of SGC-7901 cells, resulting in a high accumulation of OXA inside the tumor cell. The cellular uptake of ES-SSL-RhB was slightly higher than that of ES-L-RhB mainly due to the introduction of PEG molecules, which presented a lower leakage rate62 as compared with that of ES-L-RhB so as to deliver more RhB into the cells.63 In addition, due to the slow-release characteristics,58,59 the PEGylation liposomal could deliver the majority of encapsulated drugs to tumor cells, which increased the accumulation of OXA inside cells.
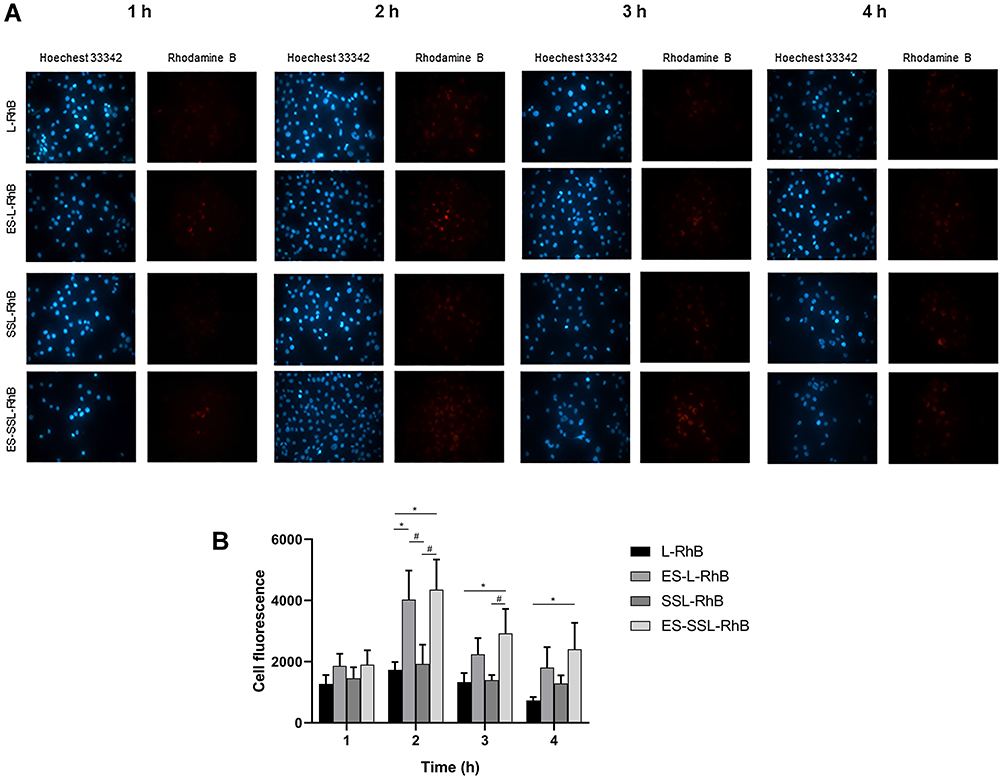 |
Figure 5 The uptake of different liposomal formulations in SGC-7901 cells. Cells were incubated with L-RhB, ES-L-RhB, SSL-RhB and ES-SSL-RhB for 1 h, 2 h, 3 h and 4 h. Fluorescence intensity was observed under an Olympus IX71 fluorescence microscope. (A) Fluorescent images (100 ×). (B) The cell fluorescence of (A). *p < 0.05 compared with L-RhB; #p < 0.05 compared with SSL-RhB. |
Mechanisms of ES-SSL-OXA Internalization into SGC-7901 Cells
In this experiment, three inhibitors were used to study the internalization mechanism of ES-SSL-RhB for SGC-7901 cells, including sucrose solution, genistein solution, and amiloride hydrochloride solution. As shown in Figure 6A and B, the fluorescence intensity was significantly reduced after the addition of sucrose (p < 0.001) and amiloride hydrochloride (p < 0.001) in SGC-7901 cells. These results demonstrated that ES-SSL-RhB internalization into SGC-7901 cells was mainly via clathrin-dependent endocytosis and macropinocytosis. Meanwhile, the fluorescence intensity was also reduced after adding genistein (p < 0.01), indicating that the uptake of ES-SSL-RhB by SGC-7901 cells was via caveolin-dependent endocytosis too. However, compared with sucrose and amiloride hydrochloride, the genistein inhibition was weaker, indicating that clathrin-dependent endocytosis and macropinocytosis were the major pathways for ES-SSL-RhB entering into the SGC-7901 cells.
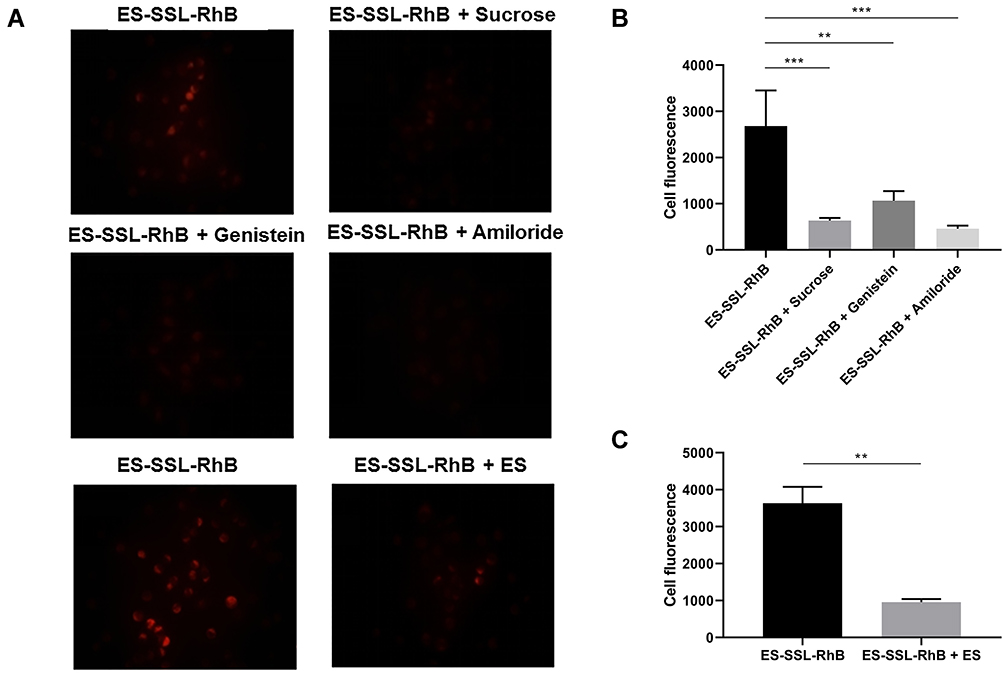 |
Figure 6 Inhibition of ES-SSL-RhB uptake. SGC-7901 cells were treated with PBS buffer, sucrose, genistein, amiloride, or ES for 0.5 h. Then, ES-SSL-RhB was added and cells were incubated for an additional 2 h. The fluorescence intensity was observed under an Olympus IX71 fluorescence microscope. (A) Fluorescent images (100 ×). (B) The cell fluorescence of ES-SSL-RhB, ES-SSL-RhB + Sucrose, ES-SSL-RhB + Genistein and ES-SSL-RhB + Amiloride. (C) The cell fluorescence of ES-SSL-RhB and ES-SSL-RhB + ES. **p < 0.01, ***p < 0.001 compared with ES-SSL-RhB. |
In addition, free ES molecule was added as a competitive inhibitor of ES-SSL-RhB into the SGC-7901 cells. As shown in Figure 6A and C, when the ES was co-incubated with ES-SSL-RhB in SGC-7901 cells, the fluorescence intensity in the cells significantly reduced (p < 0.01), indicating that ES ligand could specifically block the ES receptors on the surface of SGC-7901 cells so as to inhibit the binding of ES-SSL-RhB to the estrogen receptors. The results above demonstrated that ES-SSL-RhB enters into SGC-7901 cells mainly via estrogen receptor that was highly expressed on the surface of SGC-7901 tumor cells.
In vivo Targeting Study
The in vivo metabolic distribution of ES-SSL-OXA was evaluated in SGC7901 tumor-bearing nude mice by in vivo imaging system (IVIS SPECTRUM, USA). Fluorescent probe DiR was loaded into different liposomal formulations, including SSL-DiR and ES-SSL-DiR. After administration for 1, 2, 6, 12, 24 h, the distribution of DiR-liposomes in mice was observed. As shown in Figure 7A, ES-SSL-DiR began to accumulate into the tumor at 6 h and persisted within 12 h. It is worth mentioning that the fluorescence intensity of tumors in ES-SSL-DiR group was higher than that in SSL-DiR group at the time point of 6 h and 12 h due to the addition of ES fragments. At a time of 12 h after administration, ES-SSL-DiR presented the strongest fluorescence intensity in tumor, and gradually weakened till 24 h due to metabolism of the ES-SSL-DiR in nude mice. These results confirmed that OXA targeted liposome could achieve a better tumor-targeting effect.
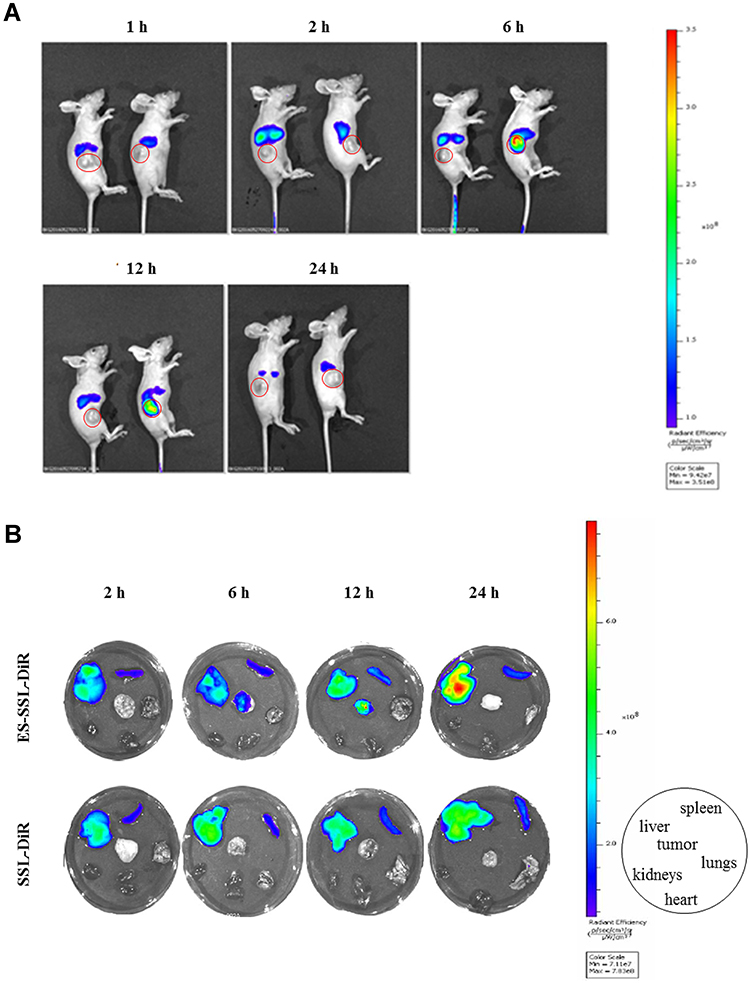 |
Figure 7 In vivo targeting effects of ES-SSL-DiR. SSL-DiR and ES-SSL-DiR at a dose of 500 ng DiR/mouse were administered to mice via tail vein injection. At the time point of 1, 2, 6, 12 and 24 h after injection, the biodistribution of the drug in anesthetized mice was photographed using a live imaging system (IVIS SPECTRUM, USA). Then mice were sacrificed to detect the fluorescence intensity of tumor, heart, liver, spleen, lungs, and kidneys in ex vivo. (A) Distribution of ES-SSL-DiR (right) and SSL-DiR (left) in xenografts-bearing nude mice. (B) Distribution of ES-SSL-DiR and SSL-DiR in tumor, heart, liver, spleen, lungs and kidneys. |
After detecting the fluorescence intensity distribution in SGC-7901 tumor-bearing mice in vivo, the tumors, heart, liver, spleen, lungs, and kidneys were dissected. The ex vivo fluorescence intensity of different tissues was determined by the fluorescence imaging system. Figure 7B shows the fluorescence imaging results in ex vivo of the nude mice, which more clearly illustrated the metabolic distribution of liposomes in various organs and tumors. SSL-DiR and ES-SSL-DiR were notably concentrated in the spleen and liver of the reticuloendothelial system (RES) due to the metabolic characteristics of liposomes. The accumulation of ES-SSL-DiR at the tumor site was higher than that of SSL-DiR, which confirms the imaging results in vivo of the nude mice.
Cytotoxicity Assay
The cytotoxicity of different OXA formulations in SGC-7901 cells was assessed using the MTT assay. The cytotoxic effect on SGC-7901 cells of free OXA, L-OXA, ES-L-OXA, SSL-OXA, and ES-SSL-OXA was determined after incubating for 24, 48, or 72 h, respectively. As shown in Figure 8, the blank liposome group (Blank-L) was not cytotoxic to SGC-7901 cells, and other five OXA formulations, including free OXA, L-OXA, ES-L-OXA, SSL-OXA, and ES-SSL-OXA had concentration- and time-dependent inhibitory effects on SGC-7901 cells. It should be noted that ES-SSL-OXA had the strongest cytotoxicity compared to that of other OXA formulations at all the time points of 24 h, 48 h, and 72 h.
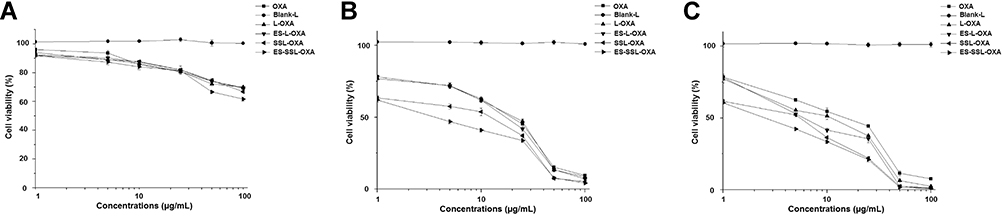 |
Figure 8 The cell viability of SGC-7901 (n=3). SGC-7901 cells were incubated with different OXA preparations of Blank-L, OXA, L-OXA, ES-L-OXA, SSL-OXA and ES-SSL-OXA for 24 h (A), 48 h (B) and 72 h (C). The cell viability of SGC-7901 was measured by MTT assay. |
In addition, the IC50 values of L-OXA, ES-L-OXA, SSL-OXA, and ES-SSL-OXA were significantly lower than that of free OXA, indicating that the encapsulation of OXA exhibited an improvement in the cytotoxicity of the drug (Table 3). Furthermore, ES-SSL-OXA showed stronger cytotoxicity than that of L-OXA, ES-L-OXA, and SSL-OXA at 48 and 72 h (p < 0.001). After incubation for 48 h, the IC50 value of ES-SSL-OXA was the lowest with the value of 4.90 ± 0.05 µg/mL as compared with the other liposomal groups of L-OXA, ES-L-OXA, and SSL-OXA with the value of 14.65 ± 0.49 µg/mL, 13.59 ± 1.57 µg/mL, and 10.34 ± 0.95 µg/mL, respectively. With the incubation time extending, the IC50 value of ES-SSL-OXA further reduced to 3.59 ± 0.07 µg/mL after incubation for 72 h. This was 3.30 times lower than the IC50 value of L-OXA, 2.38 times lower than that of ES-L-OXA, and 2.08 times lower than that of SSL-OXA. The cytotoxicity of SSL-OXA was higher than ES-L-OXA mainly because PEG could improve the liposome stability and reduce the drug leakage.62 In addition, due to the introduction of PEG fragments, SSL-OXA had a sustained and slow-release behavior,62,64 which increased the accumulation of OXA inside the tumor cells. These results demonstrated that ES-SSL-OXA could specifically target the estrogen receptor on the surface of SGC-7901 cells to enhance the antitumor effect.
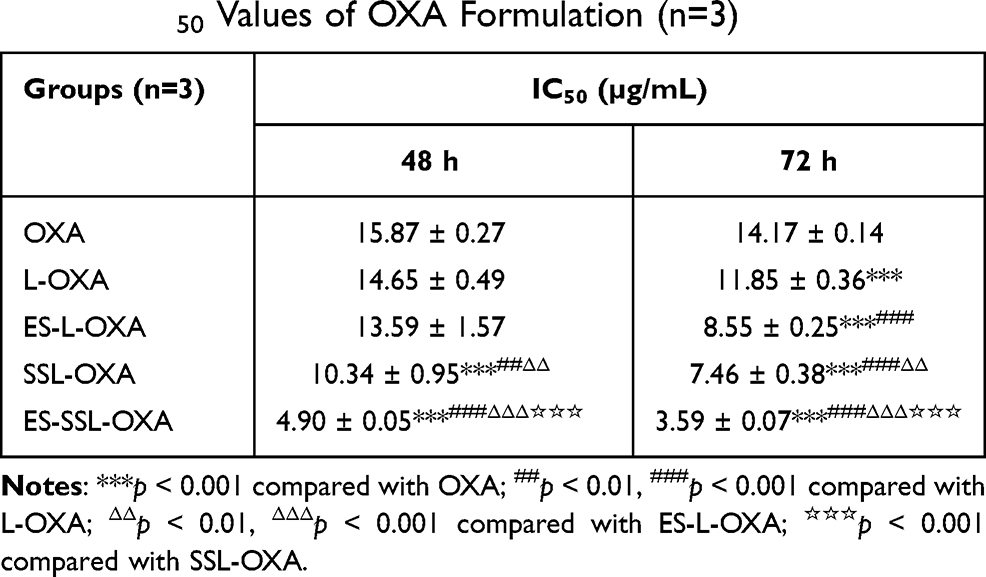 |
Table 3 IC50 Values of OXA Formulation (n=3) |
In vivo Antitumor Activity
After verifying the cytotoxicity of ES-SSL-OXA in vitro, we sequentially determined whether ES-SSL-OXA could act as an effective antitumor therapeutic against SGC-7901 tumor growth in vivo. The therapeutic efficacy of Blank-L, free OXA, SSL-OXA, and ES-SSL-OXA was determined in BALB/c nude mice bearing SGC-7901 tumor. The mice received different formulations at a dose of 2.5 mg/kg via tail vein injection. As shown in Figure 9A, tumor volumes in the Normal Saline group and the Blank-L group increased more rapidly than other groups, indicating Blank-L had no therapeutic effect on tumors. Compared with Blank-L group, all groups administered with OXA formulations showed tumor growth inhibition. In particular, ES-SSL-OXA suppressed tumor growth more efficiently than free OXA and SSL-OXA (p < 0.001), indicating the strongest anti-tumor effect of ES-SSL-OXA was mainly due to the introduction of ES targeting ligand. As shown in Figure 9B, the tumor inhibition rate of ES-SSL-OXA group was significantly higher than that of SSL-OXA group (p < 0.001) and OXA group (p < 0.001), which confirmed the results of tumor growth curve.
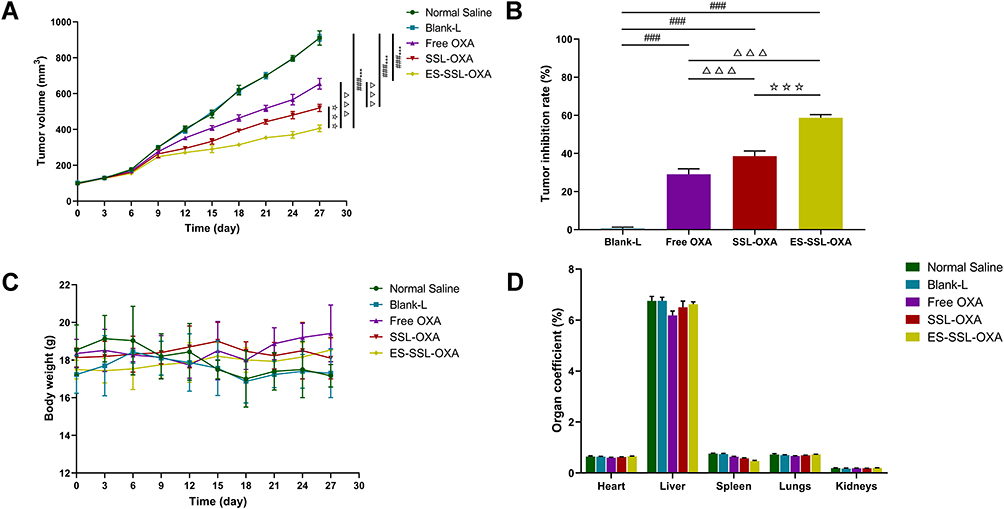 |
Figure 9 In vivo antitumor efficacies of different OXA formulations in BALB/c nude mice bearing SGC-7901 tumor. Mice were randomly divided into 5 groups (n=6): (1) normal saline group (Normal Saline), (2) blank liposome group (Blank-L), (3) free OXA group (Free OXA), (4) PEGylated OXA liposome group (SSL-OXA), (5) ES-targeted PEGylated OXA liposome group (ES-SSL-OXA). Mice were administered via the tail vein at dose of 2.5 mg OXA/kg body weight every 2 days. (A) Tumor volume changes. (B) Tumor inhibition rate. (C) Body weight changes. (D) Organ coefficient. (Mean ± SD, n = 6, ***p < 0.001 compared with the Normal Saline group; ###p < 0.001 compared with the Blank-L group; ΔΔΔp < 0.001 compared with the Free OXA group; ☆☆☆p < 0.001 compared with SSL-OXA group). |
At the same time, animal body weight was recorded to evaluate the systemic side effects of different formulations. In Figure 9C, the body weight of mice in the Normal Saline group and Blank-L group decreased significantly during the treatment of 12–18 days after administration, while the body weight of SSL-OXA and ES-SSL-OXA showed little change, suggesting that ES-SSL-OXA had the strongest antitumor effect with no obvious side effect. As shown in Figure 9D, no significant differences were found in the organ coefficients among the Normal Saline group, the Blank-L group, the Free OXA group, the SSL-OXA group, and the ES-SSL-OXA group, indicating there were no obvious side effects on the main organs of heart, liver, spleen, lungs, and kidneys.
Pharmacokinetic Study
In order to investigate the metabolic behavior of ES-SSL-OXA in the body circulation system, pharmacokinetics and biodistribution were performed in healthy ICR mice. The concentration of OXA was determined by HPLC method, which was validated in accordance with the requirement of Technical Guidelines for Non-clinical Pharmacokinetic Research of Drugs by Center for Drug Evaluation of NMPA (National Medical Products Administration) in China. Plasma concentration–time curves of different OXA formulations after intravenous administration are shown in Figure 10, and the corresponding parameters are exhibited in Table 4.
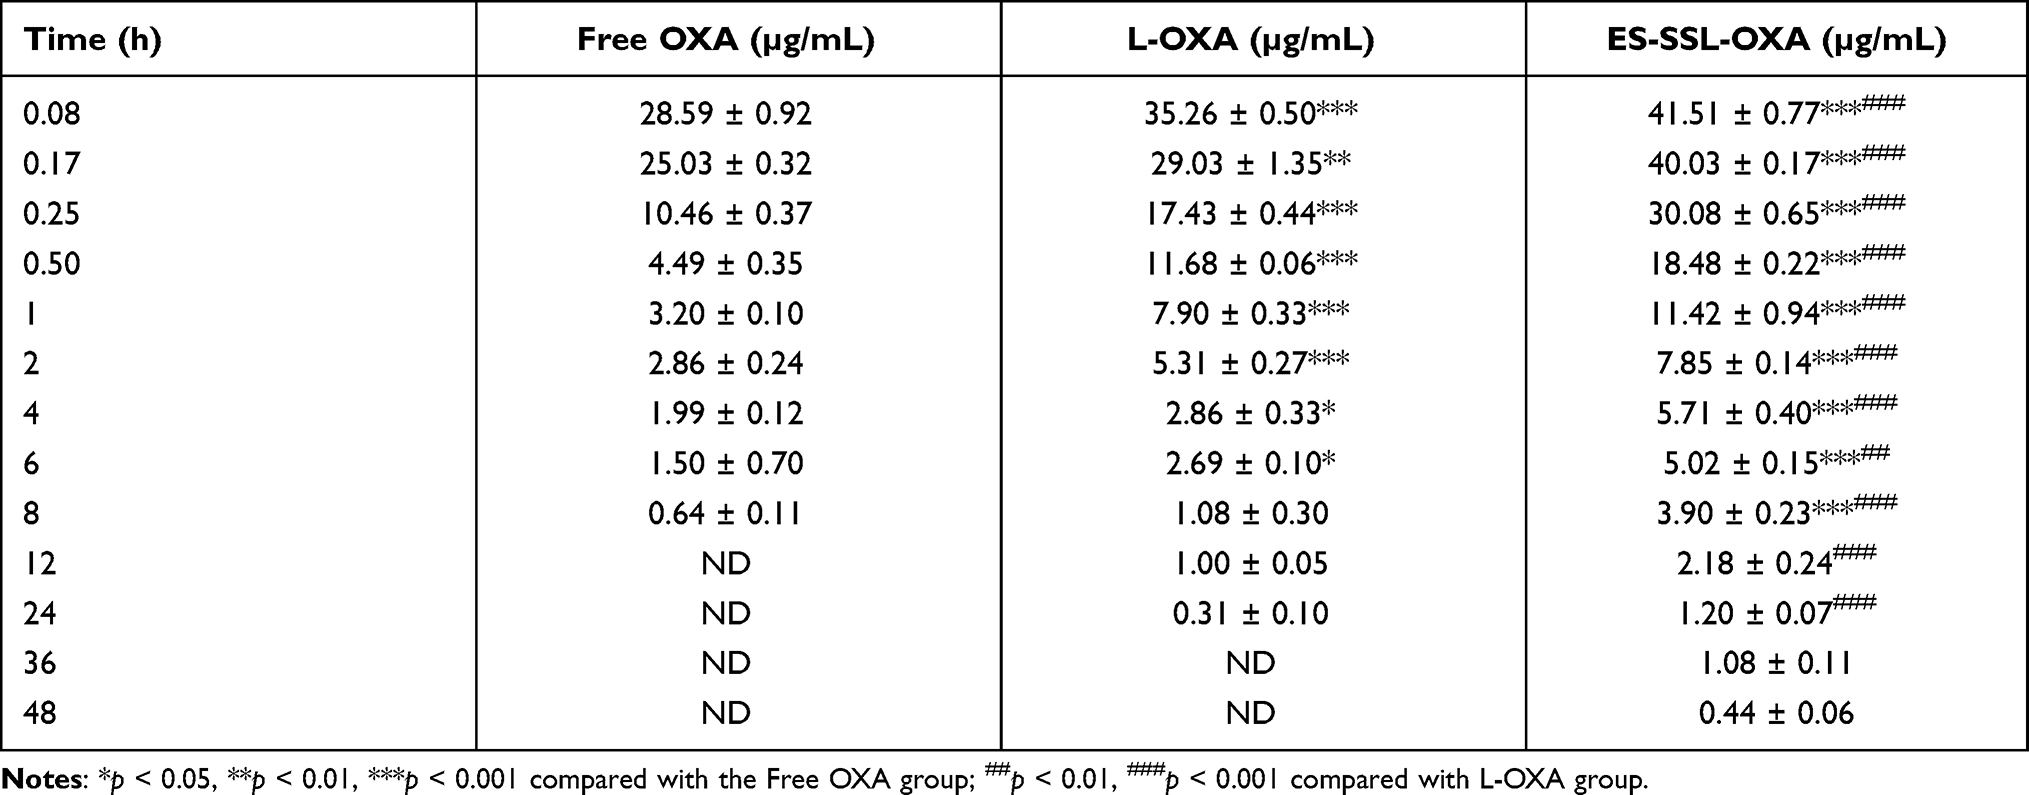 |
Table 4 Plasma Concentration-Time Data (n=3) |
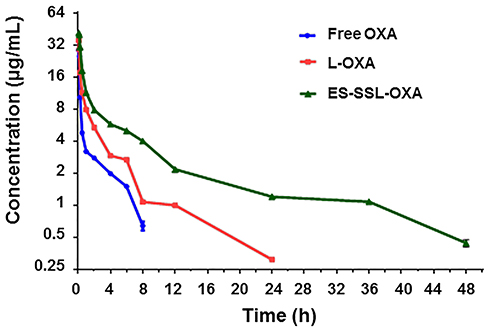 |
Figure 10 Plasma concentration–time curves of different OXA formulations (n=3). ICR mice were received a single dose of 10.0 mg/kg of free OXA, OXA liposome (L-OXA) or ES-targeted PEGylated OXA liposome (ES-SSL-OXA) via tail vein injection, respectively. Blood was collected at different time points of 5, 10, 15, 30 min and 1, 2, 4, 6, 8, 12, 24, 36, 48 h. The concentration of OXA in plasma was determined by HPLC method (n = 3, mean ± SD). |
As shown in Table 4 and Figure 10, the free OXA was rapidly cleared from circulation, and was undetectable in plasma after 8 h. Compared with free OXA, different OXA liposome formulations extended the circulation time of drugs at different levels. The OXA in L-OXA group was undetectable after 24 h, while the ES-SSL-OXA significantly extended the circulation time of OXA, in which OXA could be detected till the time of 48 h after the administration. The OXA plasma concentration of ES-SSL-OXA group was much higher than that of L-OXA group and Free OXA group at each detection time point. The OXA plasma concentration of L-OXA group was higher than that of Free OXA group. The above experimental results preliminarily indicated that ES-SSL-OXA could reduce the binding rate of plasma protein with OXA so as to prolong the OXA circulation time.
The pharmacokinetic parameters of free OXA, L-OXA, and ES-SSL-OXA were calculated and shown in Table 5. The elimination half-lives (t1/2β) of free OXA, L-OXA, and ES-SSL-OXA were 3.214 ± 0.42, 3.849 ± 0.46 and 6.246 ± 0.952 h, respectively. The t1/2β of ES-SSL-OXA group was 1.62 and 1.94 times longer than that of L-OXA and Free OXA groups, respectively. Meanwhile, the clearance rate (CL) of the ES-SSL-OXA group was significantly reduced compared to that in Free OXA group (p < 0.01), which was 4.05 times and 2.24 times slower than that of Free group and L-OXA group. The mean residence time (MRT(0-∞)) of the ES-SSL-OXA group was significantly prolonged, which was 4.25 times more than that of the Free OXA group and 2.53 times more than that of the L-OXA group. As for the area under the curve (AUC0-∞), the ES-SSL-OXA group was 4.05 folds higher than that of the Free OXA group, and 2.25 folds higher than that of the L-OXA group. The above data indicated that ES-SSL-OXA could significantly escape from the recognition of reticuloendothelial system because of the insertion of PEG chains, which decreased the binding rate of OXA with plasma proteins. The pharmacokinetic studies demonstrated that the ES-SSL-OXA could significantly promote the bioavailability of OXA so as to increase the ability of antitumor efficacy.
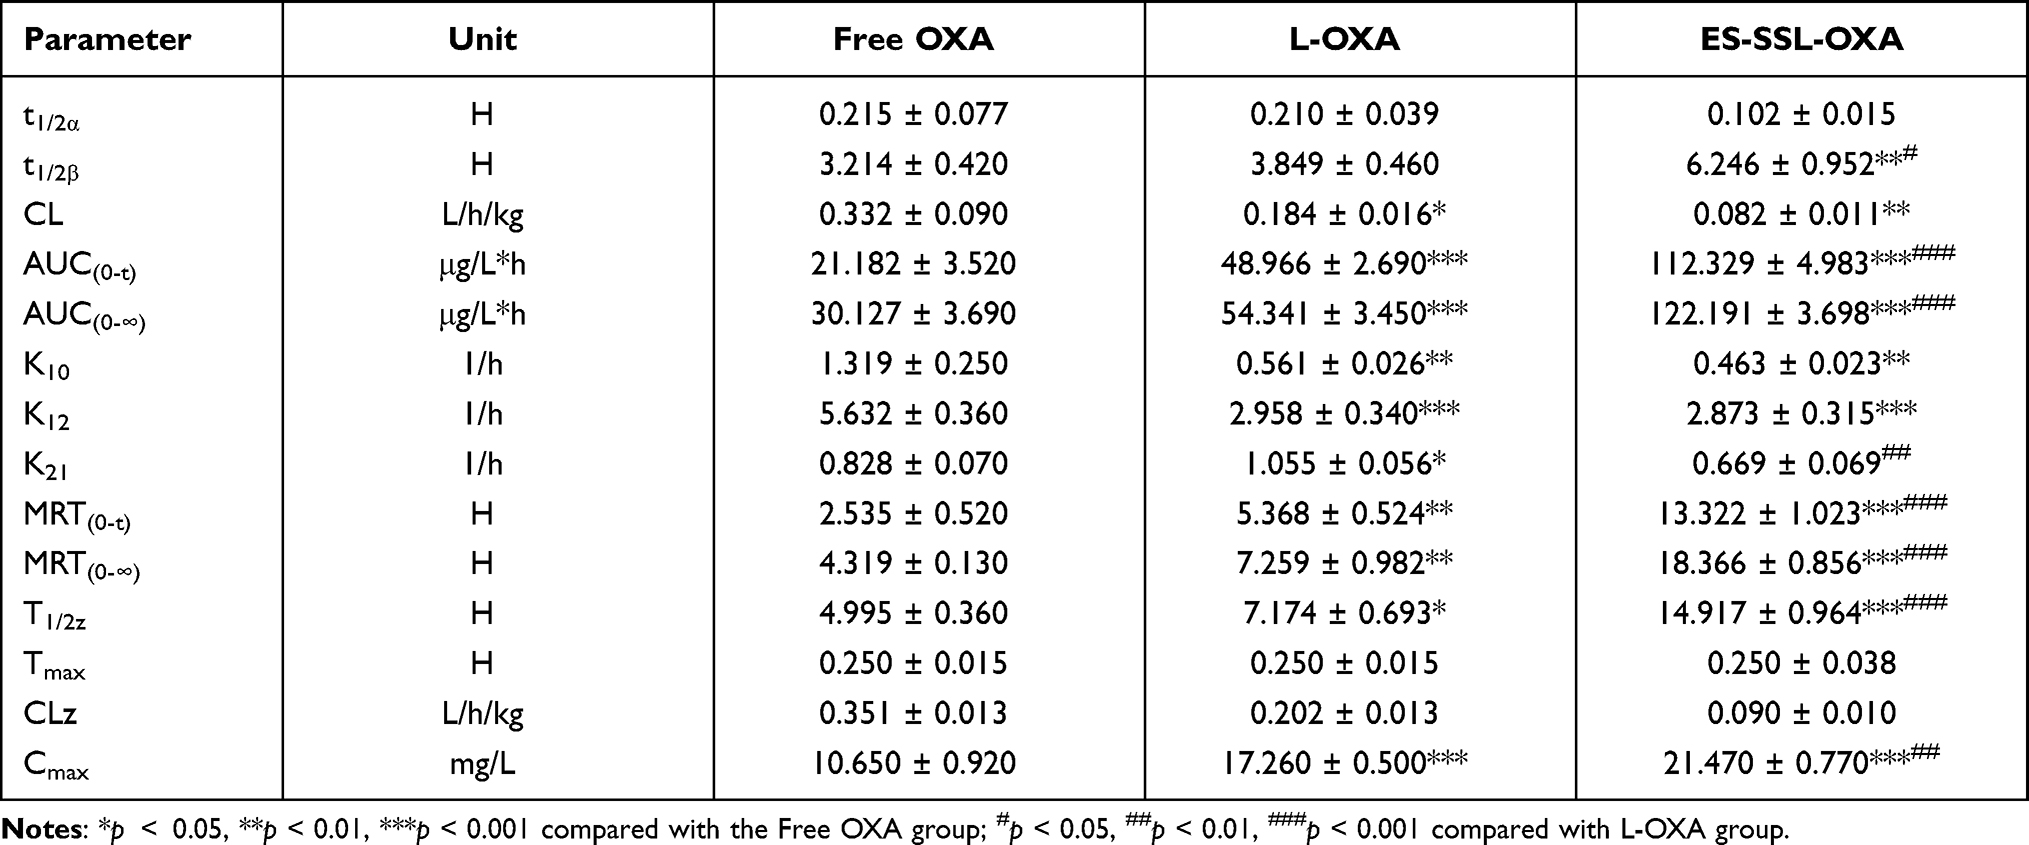 |
Table 5 Pharmacokinetic Parameters of OXA Formulations (n=3) |
The biodistribution of free OXA, L-OXA, and ES-SSL-OXA was further studied in major organs, including the heart, liver, spleen, lungs, and kidneys. The concentration of OXA in organs was determined by HPLC method, which was validated in accordance with the requirement of Technical Guidelines for Non-clinical Pharmacokinetic Research of Drugs by Center for Drug Evaluation of NMPA (National Medical Products Administration) in China. As shown in Table 6 and Figure 11, L-OXA and ES-SSL-OXA group had higher concentration in liver and spleen compared to that of Free OXA group, demonstrating the metabolic feature of the liposomal formulations. The area under the curve (AUC0-∞) of major organs in ES-SSL-OXA group was significantly higher than that of Free OXA and L-OXA groups (Table 7), mainly because the amount of ES-SSL-OXA entering the systemic circulation was significantly higher than that of free OXA and L-OXA. The high concentration of ES-SSL-OXA in the kidney was mainly because the drug metabolized primarily via the kidneys.
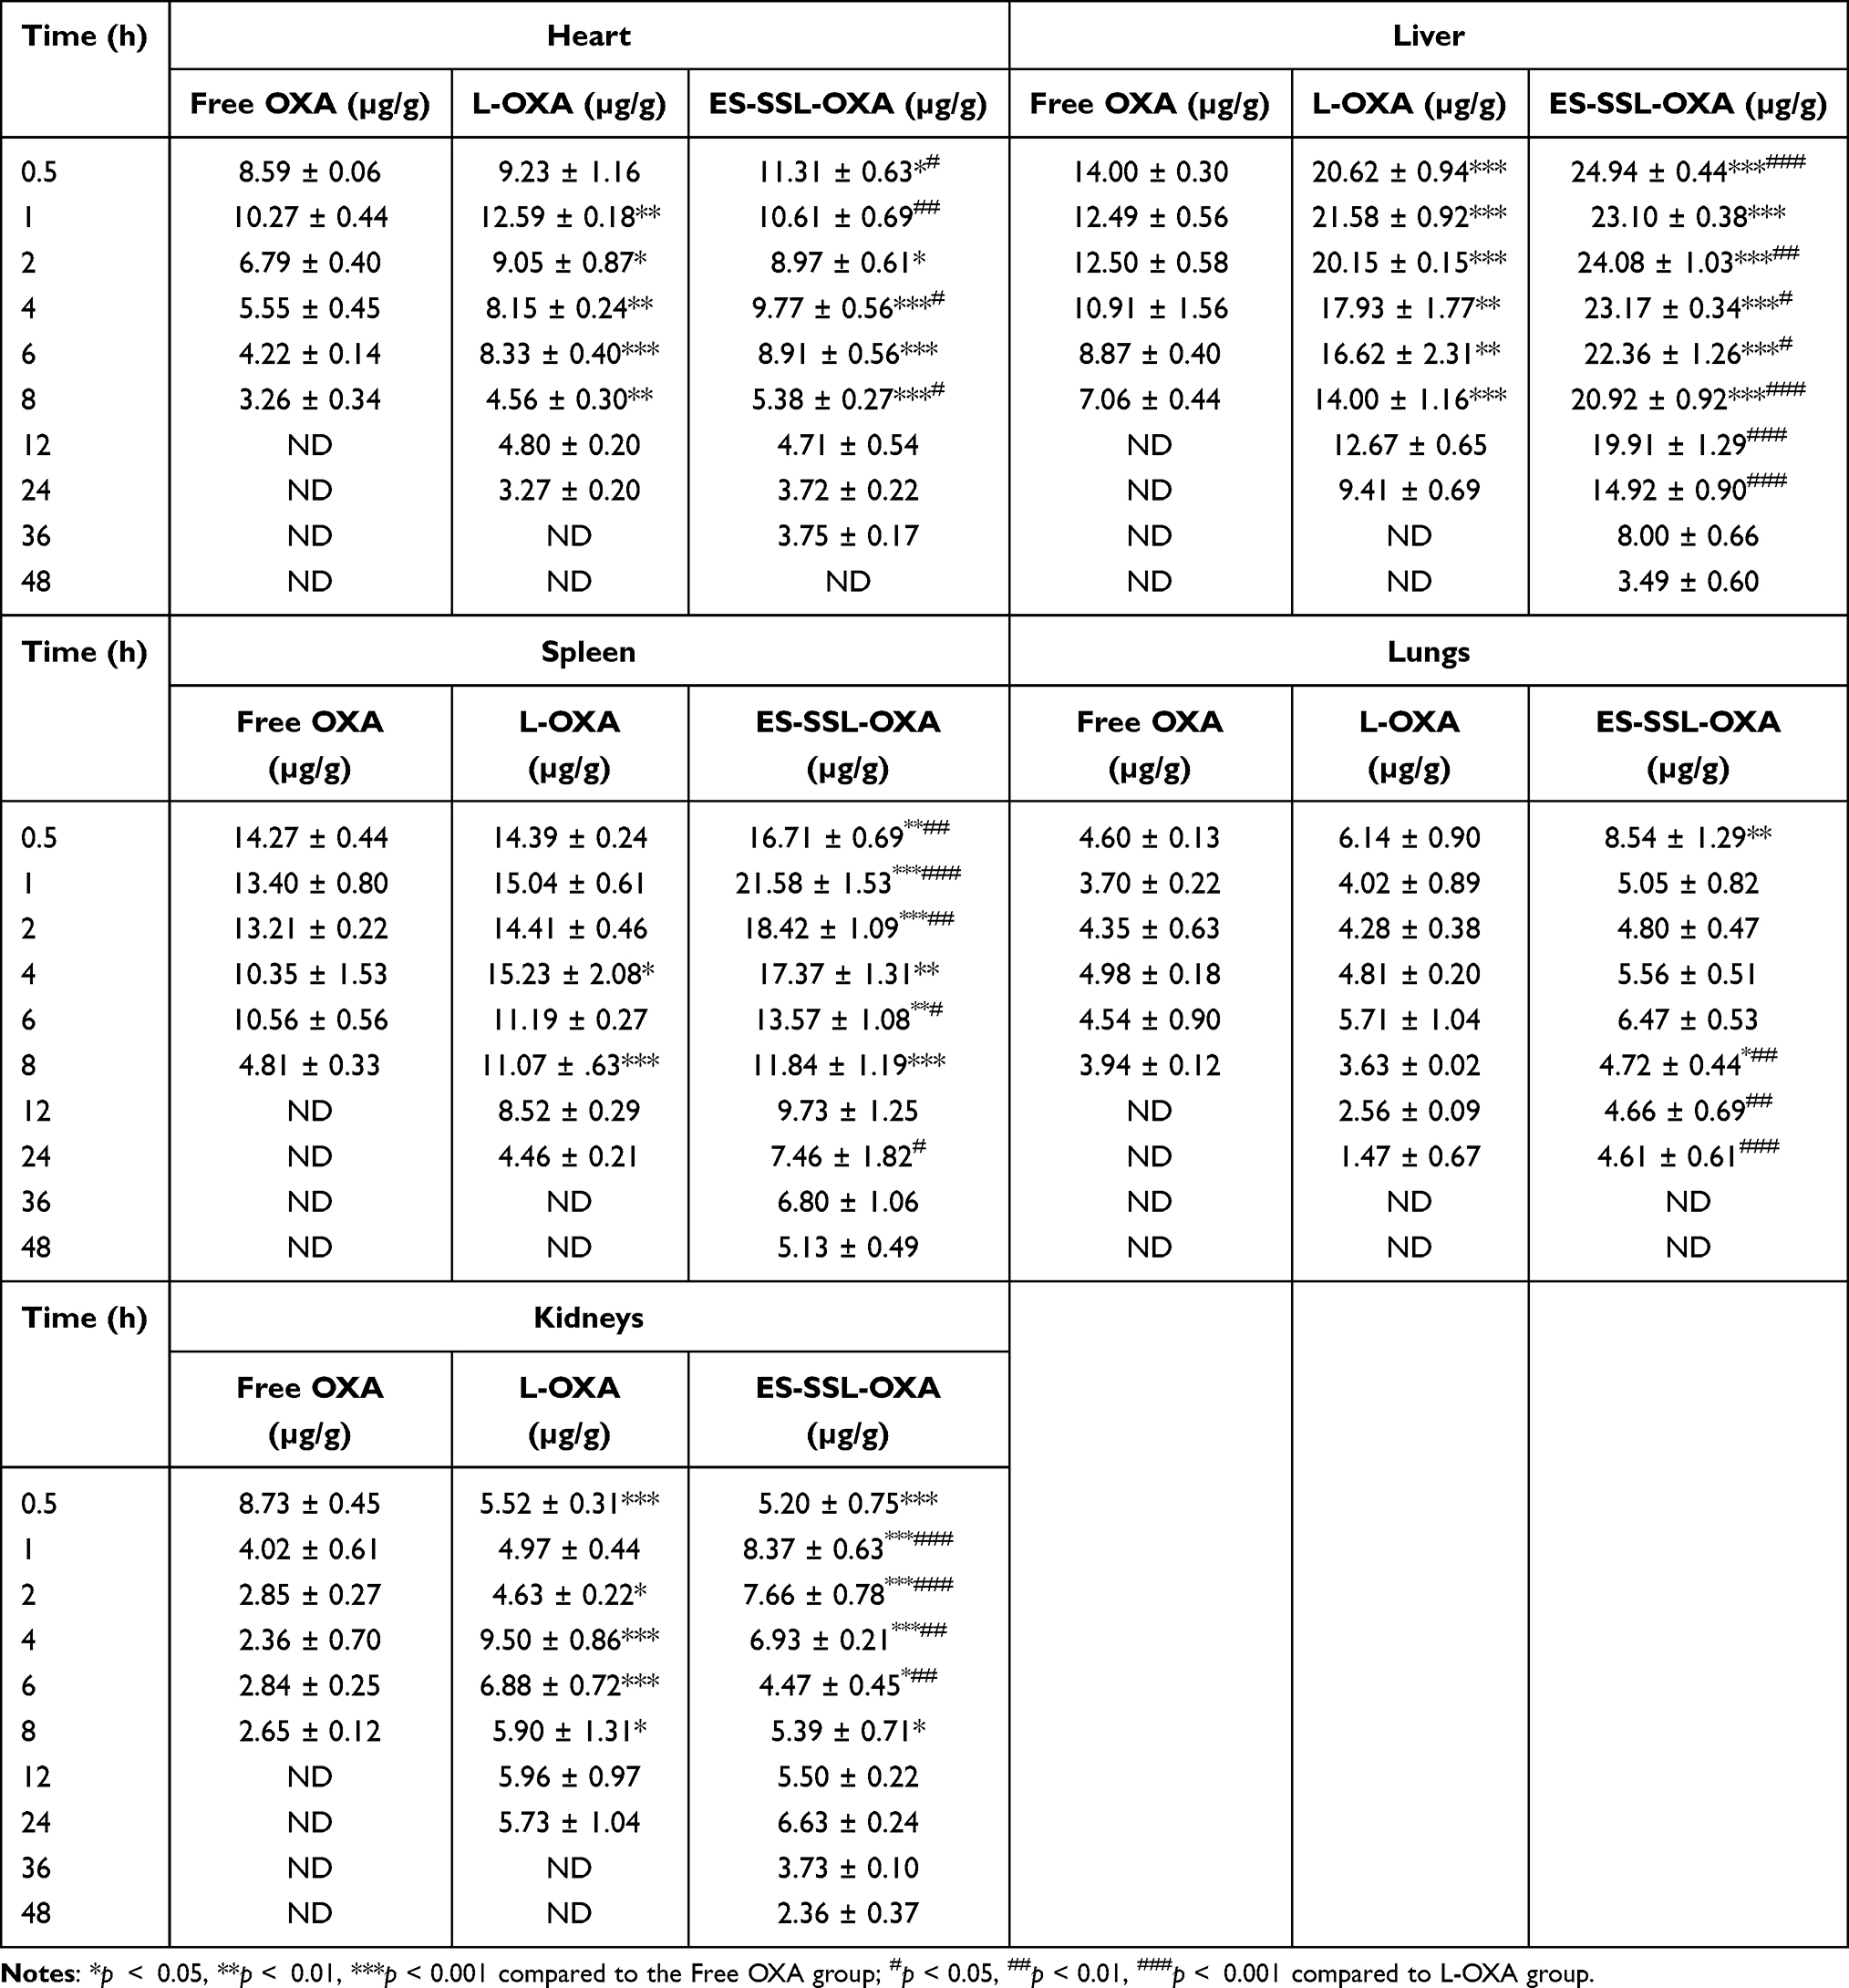 |
Table 6 Biodistribution of OXA in Major Organs (n=3) |
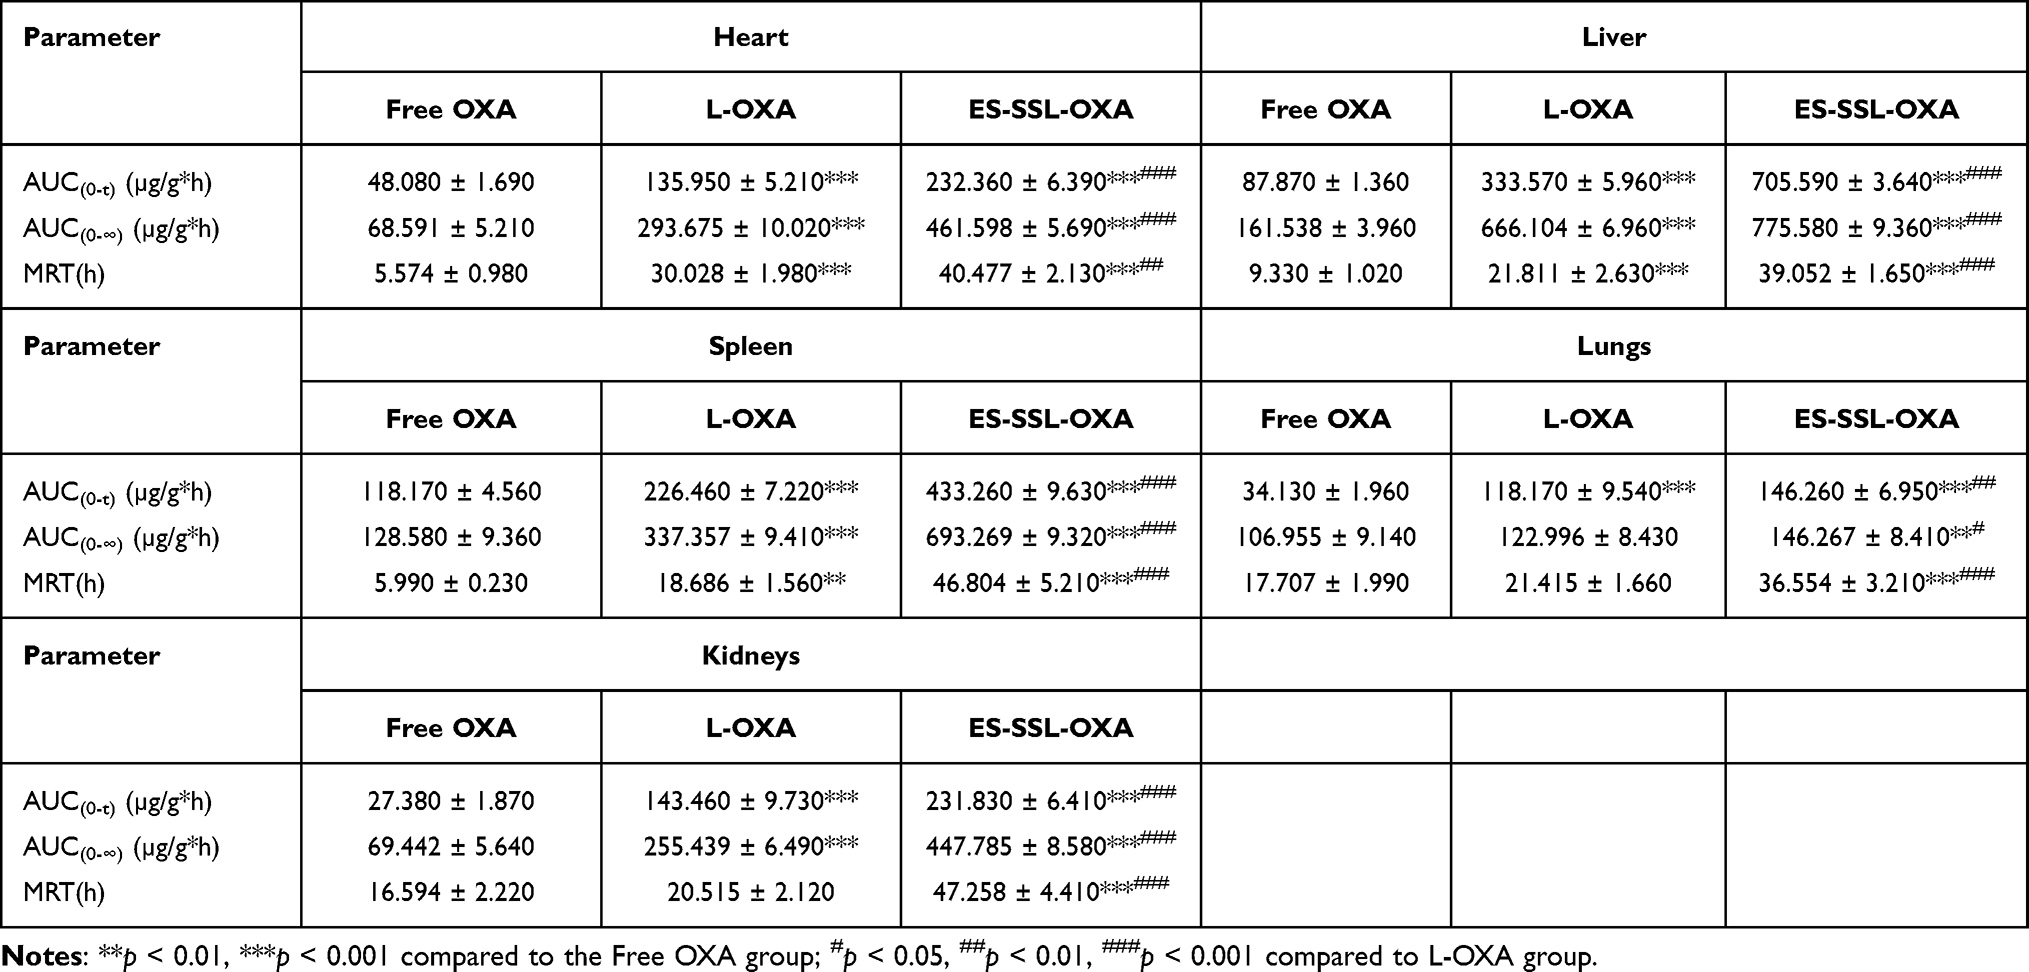 |
Table 7 Pharmacokinetic Parameters of OXA Formulations in Major Organs (n=3) |
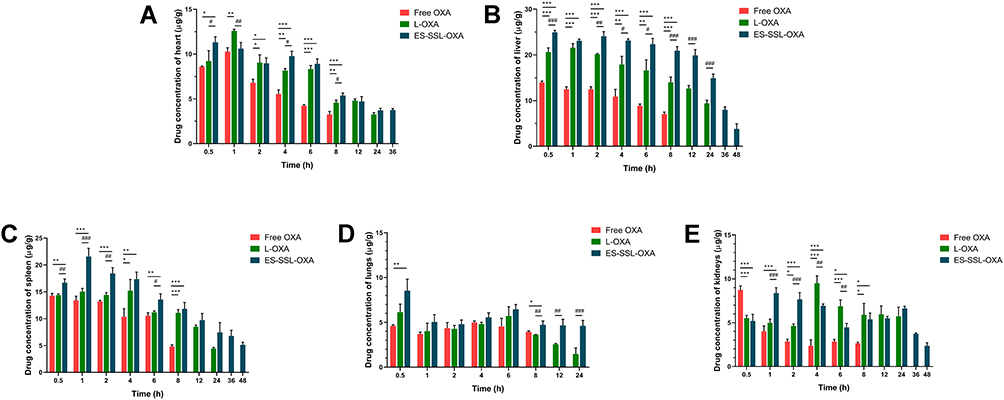 |
Figure 11 The biodistribution of OXA in major organs, including the heart, liver, spleen, lungs, and kidneys. The healthy ICR mice were administered with a single 10.0 mg/kg dose of Free OXA, L-OXA, ES-SSL-OXA. At the time point of 0.5, 1, 2, 4, 6, 8, 12, 24, 36, 48 h, mice were sacrificed and dissected for collecting main organs. The concentration of OXA in hearts (A), liver (B), spleen (C), lungs (D) and kidneys (E) was determined by HPLC method (n = 3, mean ± SD). *p < 0.05, **p < 0.01, ***p < 0.001 compared to the Free OXA group; #p < 0.05, ##p < 0.01, ###p < 0.001 compared to L-OXA group. |
Acute Toxicity Study
Survival Curves and Median Lethal Dose (LD50), Body Weight, Hematological Analysis, and Organ Coefficients
In order to evaluate the preliminary safety of ES-SSL-OXA, acute toxicity experiment was performed in 180 healthy ICR mice, which received a single dose of different OXA formulations. After fourteen days’ observation, mortality, body weight, and organ coefficients were measured and recorded. The median lethal dose (LD50) was calculated according to mortality. Meanwhile, the blood test and blood biochemistry of the surviving mice were detected to evaluate the toxicity of OXA.
As shown in Table 8, Figures 12 and 13, at the same dose of 16.0 mg/kg, the mortality of ES-SSL-OXA group was 30%, which significantly lower than that of Free OXA (70%) and L-OXA group (50%). The LD50 value of ES-SSL-OXA was 19.10 mg/kg, which was 1.29 folds higher than that of the Free OXA group (14.78 mg/kg), and 1.17 folds higher than that of the L-OXA group (16.31 mg/kg). These results indicated that ES-targeted PEGylated liposome can significantly improve the safety of OXA.
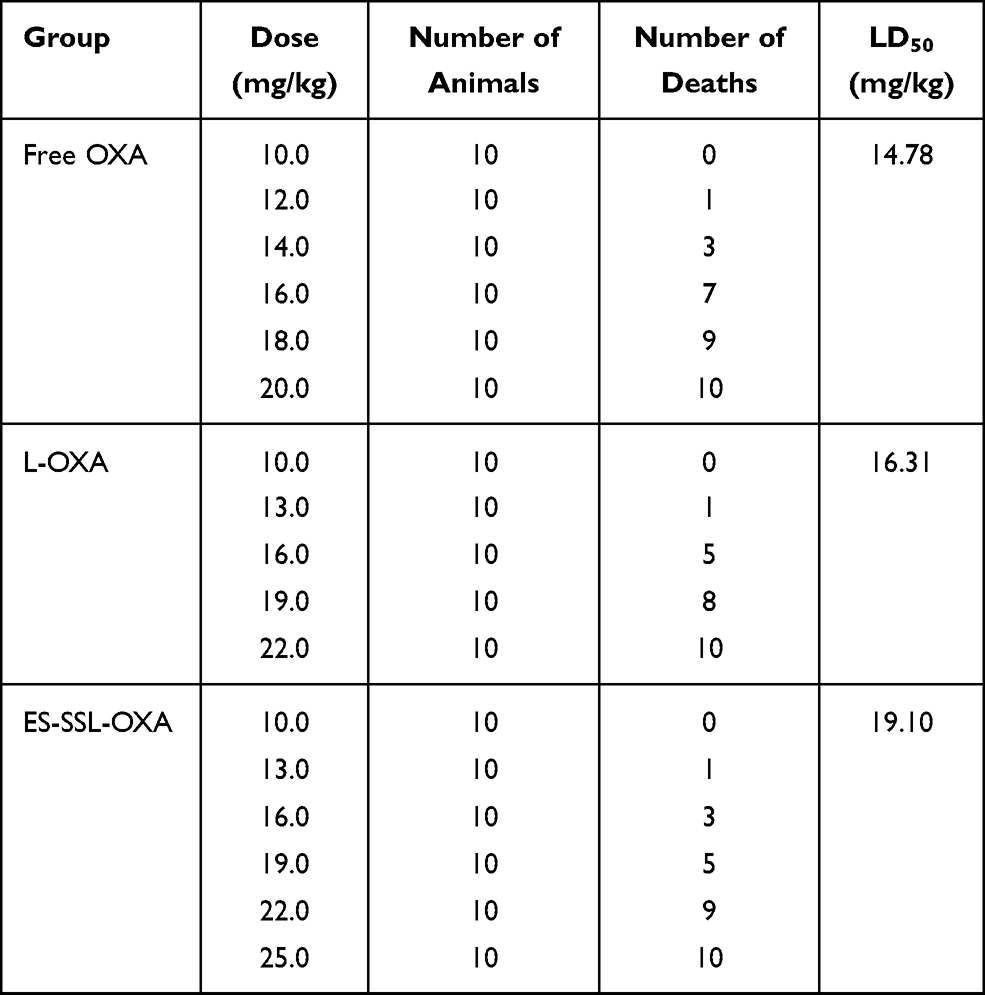 |
Table 8 Acute Toxicity of Free OXA, L-OXA, and ES-SSL-OXA (n=10) |
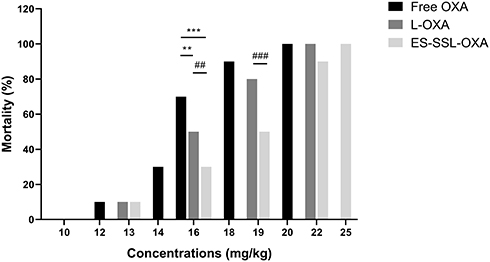 |
Figure 12 The mortality of acute toxicity (n=10). The healthy ICR mice were assigned randomly into three groups, including (A) Free OXA group, (B) L-OXA group and (C) ES-SSL-OXA group. OXA group received a dose of 10.0, 12.0, 14.0, 16.0, 18.0 or 20.0 mg/kg. L-OXA group received a dose of 10.0, 13.0, 16.0, 19.0 or 22.0 mg/kg. ES-SSL-OXA group received a dose of 10.0, 13.0, 16.0, 19.0, 22.0 or 25.0 mg/kg. The mortality was measured till 14 days. **p < 0.01, ***p < 0.001 compared with the Free OXA group; ##p < 0.01, ###p < 0.001 compared with L-OXA group. |
 |
Figure 13 The survival curves of acute toxicity (n=10). The healthy ICR mice were assigned randomly into three groups, including (A) Free OXA group, (B) L-OXA group and (C) ES-SSL-OXA group. OXA group received a dose of 10.0, 12.0, 14.0, 16.0, 18.0 or 20.0 mg/kg. L-OXA group received a dose of 10.0, 13.0, 16.0, 19.0 or 22.0 mg/kg. ES-SSL-OXA group received a dose of 10.0, 13.0, 16.0, 19.0, 22.0 or 25.0 mg/kg. The mortality was recorded till 14 days. |
In the 14-day’s experiment, the body weight of mice administered with different doses of OXA formulations was observed. As shown in Figure 14A–C, the body weight changes of mice treated with the dose lower than 16.0 mg/kg of OXA formulations presented an escalation from day 1 to day 14. As shown in Figure 14A, when the dose of OXA formulations were above 16.0 mg/kg, the body weight decreased continuously in Free OXA group. By the end of the experiment, at a dose of 16.0 mg/kg, the final weight in Free OXA group recovered slightly, but it was still less than the original weight. When the dose was increased to 18.0 mg/kg in Free OXA group, the body weight decreased by 18.9% on the fourth day after administration. As shown in Figure 14B, at the dose of 16.0 mg/kg in L-OXA group, the body weight decreased slightly on the second day, and the average loss rate of body weight was less than 10%. When the dose was at 19.0 mg/kg in L-OXA group, the body weight began to decline the next day, and the loss rate of body weight was about 17.5% in the sixth day. After the sixth day, the body weight of the surviving animals increased. As shown in Figure 14C, compared to Free OXA and L-OXA group, the body weight of ES-SSL-OXA group fluctuated at the beginning, and then continued to rise from the fourth day at the dose of 16.0 mg/kg and 19.0 mg/kg till the end of 14 days. Those results showed that the acute toxicity of ES-SSL-OXA was significantly lower than that of Free OXA and L-OXA group.
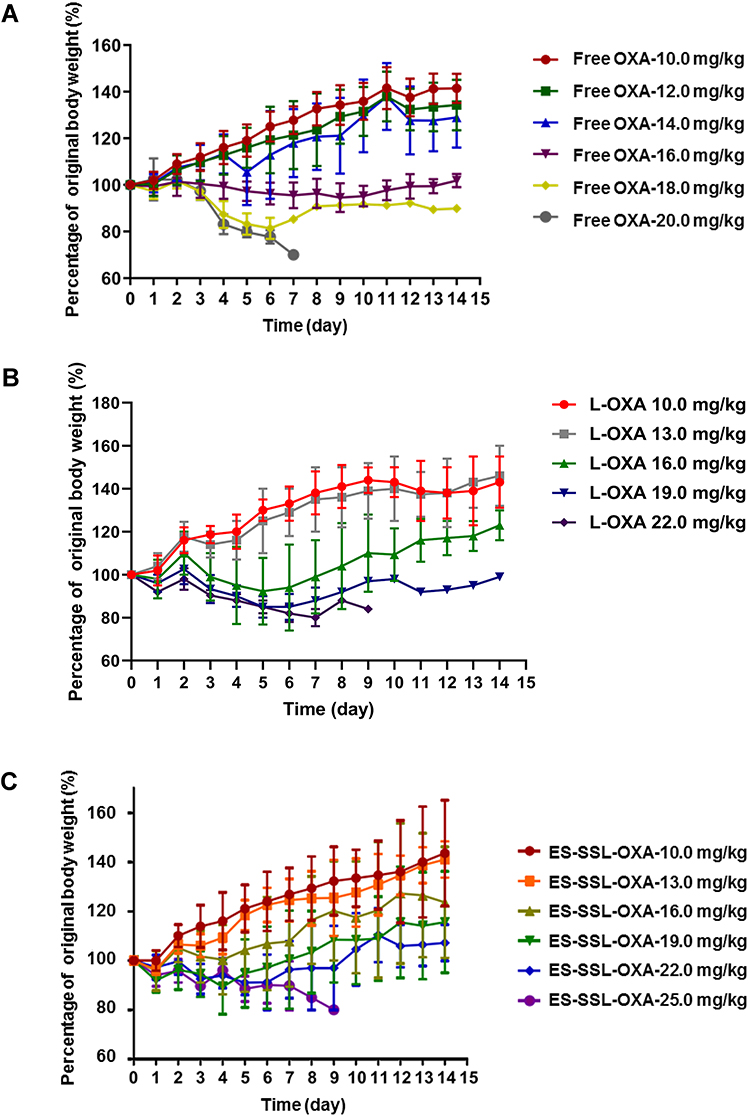 |
Figure 14 Mice body weight variation of acute toxicity (n=10). The healthy ICR mice were assigned randomly into three groups, including (A) Free OXA group, (B) L-OXA group and (C) ES-SSL-OXA group. Free OXA group received a dose of 10.0, 12.0, 14.0, 16.0, 18.0 or 20.0 mg/kg. L-OXA group received a dose of 10.0, 13.0, 16.0, 19.0 or 22.0 mg/kg. ES-SSL-OXA group received a dose of 10.0, 13.0, 16.0, 19.0, 22.0 or 25.0 mg/kg. The body weight of mice was measured till 14 days. |
By the end of experiment for 14 days, the blood from the surviving mice, which were received a single injection of OXA, L-OXA, and ES-SSL-OXA at a dose of 16.0 mg/kg, was collected for hematological analysis. As shown in Table 9, the blood test of cell counting of total white blood cell (WBC), neutrophils (NEUT), and lymphocytes (LYM) in Free OXA group were significantly lower than that in untreated Normal Saline group with the value of 3.67 ± 0.51 (p < 0.01), 0.87 ± 0.06 (p < 0.05) and 2.50 ± 0.60 (p < 0.05), respectively, demonstrating that the free OXA did have the adverse reaction of myelosuppression. The cell counting of white blood cell, neutrophils, and lymphocytes in ES-SSL-OXA group were with the value of 7.43 ± 1.17, 1.67 ± 0.21, and 4.70 ± 1.14, respectively, which were higher than that in L-OXA group and Free OXA group (p < 0.05), indicating ES-SSL-OXA could reduce the toxicity in leukocyte system. It should be noted that platelet count of mice treated with ES-SSL-OXA was markedly increased compared to Free OXA group (p < 0.05). In addition, all hematologic indexes including total white blood cell, total red blood cell, neutrophils, lymphocytes, platelet count, and hemoglobin in mice treated with ES-SSL-OXA had no differences compared to those of untreated Normal Saline group. These results suggested that the toxicity of myelosuppression could be reduced by encapsulating OXA in ES-targeted PEGylated liposomes.
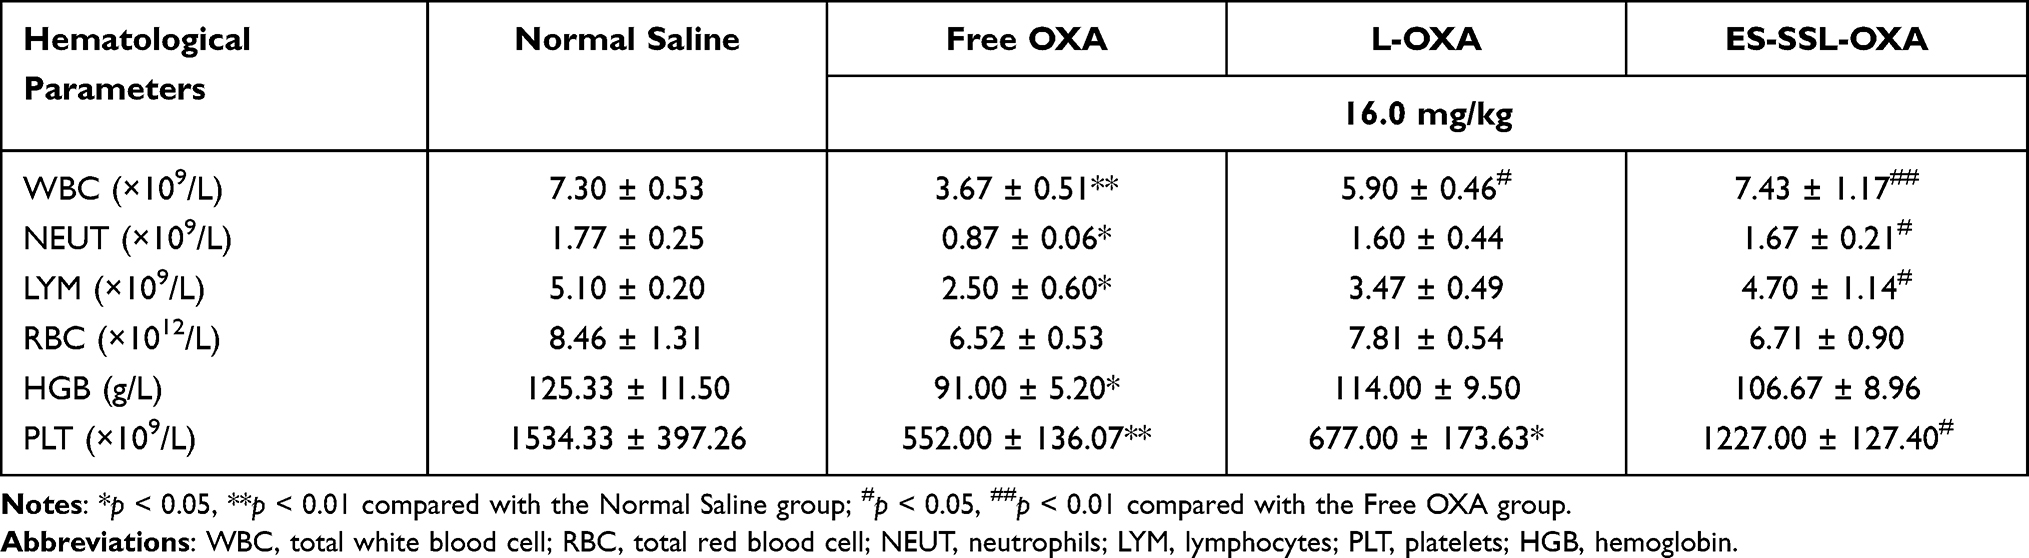 |
Table 9 Hematological Parameters of Mice Treated with a Single Dose of OXA for 14-Days (n=3) |
From the results of blood biochemistry, we observed that the concentrations of urea nitrogen in the ES-SSL-OXA group presented the lower value of 7.65 ± 0.57 mmol/L compared to the Free OXA group with the value of 8.86 ± 0.54 mmol/L (Figure 15A). The concentration of creatinine in the ES-SSL-OXA group decreased significantly as compared with that in Free OXA group (Figure 15B), indicating that ES-SSL-OXA significantly reduced the nephrotoxicity of OXA. In summary, ES-targeted PEGylated liposome can significantly improve the myelosuppressive and nephrotoxicity of OXA.
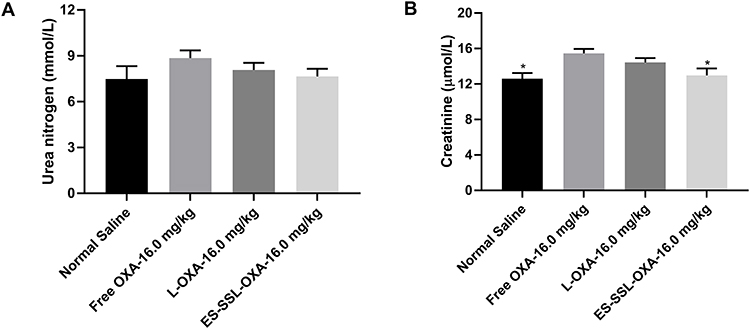 |
Figure 15 The blood biochemistry of mice (n=3). The mice were treated with normal saline, free OXA, L-OXA and ES-SSL-OXA at a single dose of 16.0 mg OXA/kg body weight for 14-days. The blood was collected and centrifuged at 3000 rpm for 10 min for urea nitrogen (A) and creatinine (B) determination by blood biochemical analyzer. *p < 0.05 compared to the Free OXA group. |
At the end of 14-day’s experiment, mice treated with free OXA, L-OXA, and ES-SSL-OXA at a dose of 16.0 mg/kg were sacrificed to obtain major organs of heart, liver, spleen, lungs, and kidneys. The organ coefficients of heart, liver, spleen, lungs, and kidneys are presented in Table 10 and Figure 16. Compared with the Normal Saline group, the variation of organ coefficients of heart, liver, lungs, and kidneys in Free OXA group changed most obviously, followed by the L-OXA group. Compared to L-OXA, the organ coefficient of ES-SSL-OXA group was closer to that of Normal Saline group, indicating that ES-targeted PEGylated liposome had almost no damage to the main organs as compared to that of the conventional OXA liposome and free OXA.
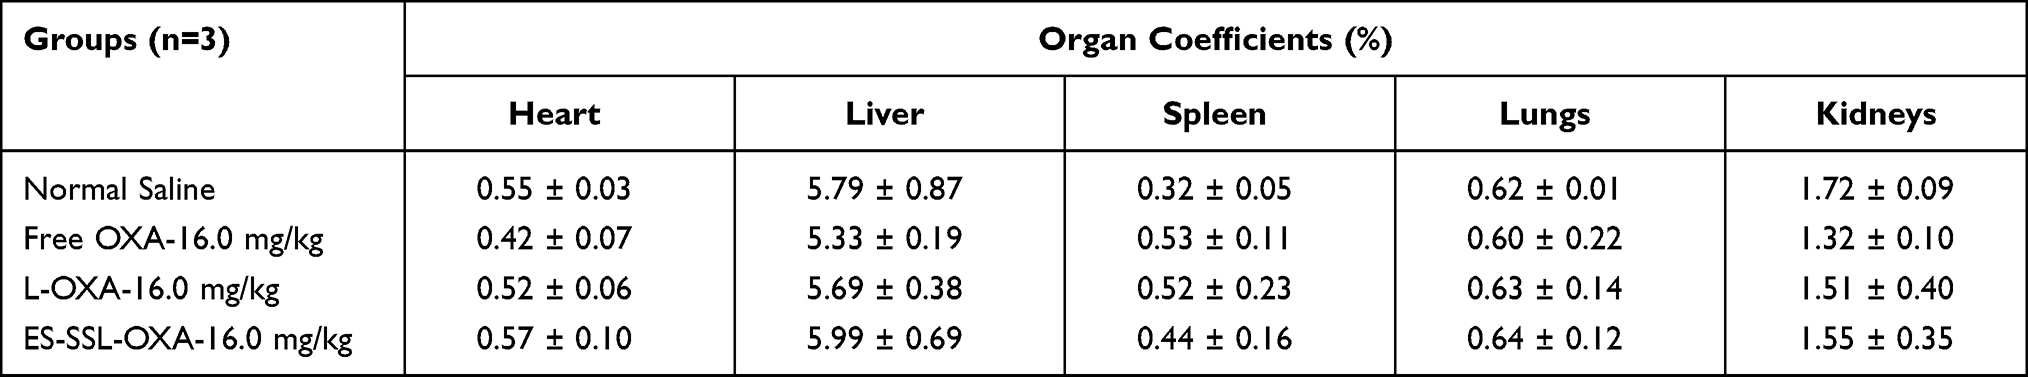 |
Table 10 Organ Coefficients of Mice Treated with Different OXA Preparations (n=3) |
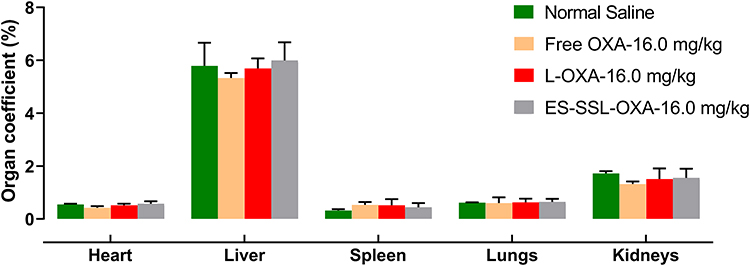 |
Figure 16 The organ coefficients of heart, liver, spleen, lungs and kidneys (n=3). Mice were administered with normal saline, free OXA, L-OXA and ES-SSL-OXA at same dose of 16.0 mg OXA/kg body weight. After 14-days’ experiment, the animals were sacrificed and dissected to obtain main organs. |
Conclusion
In this study, we have developed a novel ES-targeted PEGylated liposome for delivery of oxaliplatin to be used to treat estrogen receptor positive gastric cancer. From the preparation and characterization studies, the results showed that the ES-SSL-OXA exhibited homogeneous particle size with a good encapsulation efficiency, release behavior and stability. In vivo and in vitro targeting studies showed that ES-SSL-OXA selectively targeted gastric cancer cells to increase drug accumulation in tumor sites. Furthermore, the ES-SSL-OXA demonstrated higher cytotoxicity in SGC-7901 cells and superior in vivo antitumor activity compared with that of L-OXA and Free OXA group. The ES-targeted PEGylated liposome significantly increased the drug metabolic time in blood circulation system, exhibiting a high concentration level of OXA as compared with that of free OXA and L-OXA. The acute toxicity study had showed ES-SSL-OXA could reduce mortality by decreasing the drug’s toxicity. Therefore, ES-targeted PEGylated oxaliplatin liposomes could be a promising and efficient novel formulation for gastric cancer therapy in future clinical application.
Abbreviations
OXA, oxaliplatin; GC, gastric cancer; PEG, polyethylene glycol; ES, estrone; RES, reticuloendothelial system; EE, encapsulation efficiency; DL, drug-loading capacity; PDI, polydispersity index; TEM, transmission electron microscope; HPLC, high performance liquid chromatography; DLS, dynamic light scattering; L-OXA, common liposome loaded with OXA; ES-L-OXA, ES-targeted liposome loaded with OXA; SSL-OXA, PEGylated liposome loaded with OXA; ES-SSL-OXA, ES-targeted PEGylated liposome loaded with OXA; PBS, phosphate-buffered saline; MWCO, molecular weight cut off; MTT, 3-(4, 5-dimethylthiazol-2-yl)-2, 5-diphenyltetrazoliumbromide; DiR, 1,1′-dioctadecyl-3,3,3′,3′-tetramethylindotricarbo-cyanine iodide; DETC, silver diethyldithiocarbamate; IC50, 50% inhibitory concentration; LD50, median lethal dose.
Acknowledgments
This work was funded by Science and Technology Development Project from Jilin Science and Technology Department (20180311072YY), Jilin Province Development and Reform Commission (2014N149), and Key Laboratory of Pathological Biology, Ministry of Education, Jilin University.
Disclosure
The authors report no competing interests in this work.
References
1. Fock KM. Review article: the epidemiology and prevention of gastric cancer. Aliment Pharm Ther. 2014;40(3):250–260. doi:10.1111/apt.12814
2. Costantino CL, Mullen JT. Minimally invasive gastric cancer surgery. Surg Oncol Clin N Am. 2018;28(2):201–213. doi:10.1016/j.soc.2018.11.007
3. Wagner AD, Syn NL, Moehler M, et al. Chemotherapy for advanced gastric cancer. Cochrane Database Syst Rev. 2017;8:Cd004064. doi:10.1002/14651858.CD004064.pub4
4. Zaanan A, Bouché O, Benhaim L, et al. Gastric cancer: French intergroup clinical practice guidelines for diagnosis, treatments and follow-up (SNFGE, FFCD, GERCOR, UNICANCER, SFCD, SFED, SFRO). Dig Liver Dis. 2018;50(8):768–779. doi:10.1016/j.dld.2018.04.025
5. Zedan AH, Hansen TF, Fex Svenningsen A, Vilholm OJ. Oxaliplatin-induced neuropathy in colorectal cancer: many questions with few answers. Clin Colorectal Cancer. 2014;13(2):73–80. doi:10.1016/j.clcc.2013.11.004
6. Zhang B, Wang TQ, Yang SM, et al. Development and evaluation of oxaliplatin and irinotecan co-loaded liposomes for enhanced colorectal cancer therapy. J Control Release. 2016;238:10–21. doi:10.1016/j.jconrel.2016.07.022
7. Wang YW, Ma JJ, Qiu T, Tang MX, Zhang XQ, Dong WG. In vitro and in vivo combinatorial anticancer effects of oxaliplatin- and resveratrol-loaded N,O-carboxymethyl chitosan nanoparticles against colorectal cancer. Eur J Pharm Sci. 2021;163:105864. doi:10.1016/j.ejps.2021.105864
8. He J, Wen F, Yin X, et al. Cost analysis of S1 and XELOX as adjuvant therapy for gastric cancer. Anticancer Drugs. 2013;24(7):754–758. doi:10.1097/CAD.0b013e328361bef2
9. Li YN, Xu PC, He DS, Xu BH, Tu JS, Shen Y. Long-circulating thermosensitive liposomes for the targeted drug delivery of oxaliplatin. Int J Nanomed. 2020;15:6721–6734. doi:10.2147/ijn.S250773
10. Hashemzadeh A, Amerizadeh F, Asgharzadeh F, et al. Delivery of oxaliplatin to colorectal cancer cells by folate-targeted UiO-66-NH2. Toxicol Appl Pharmacol. 2021;423:115573. doi:10.1016/j.taap.2021.115573
11. Ye H, Chu XY, Cao ZS, et al. A novel targeted therapy system for cervical cancer: co-delivery system of antisense LncRNA of MDC1 and oxaliplatin magnetic thermosensitive cationic liposome drug carrier. Int J Nanomed. 2021;16:1051–1066. doi:10.2147/ijn.S258316
12. Zalba S, Navarro I, Troconiz IF, Tros de Ilarduya C, Garrido MJ. Application of different methods to formulate PEG-liposomes of oxaliplatin: evaluation in vitro and in vivo. Eur J Pharm Biopharm. 2012;81(2):273–280. doi:10.1016/j.ejpb.2012.02.007
13. Lindgaard SC, Brinch CM, Jensen BK, et al. Hepatic arterial therapy with oxaliplatin and systemic capecitabine for patients with liver metastases from breast cancer. Breast. 2019;43:113–119. doi:10.1016/j.breast.2018.12.002
14. Ren YT, Li XL, Han B, et al. Improved anti-colorectal carcinomatosis effect of tannic acid co-loaded with oxaliplatin in nanoparticles encapsulated in thermosensitive hydrogel. Eur J Pharm Sci. 2019;128:279–289. doi:10.1016/j.ejps.2018.12.007
15. Deshantri AK, Kooijmans SAA, Kuijpers SA, et al. Liposomal prednisolone inhibits tumor growth in a spontaneous mouse mammary carcinoma model. J Control Release. 2016;243:243–249. doi:10.1016/j.jconrel.2016.10.016
16. Molineux G. Pegylation: engineering improved pharmaceuticals for enhanced therapy. Cancer Treat Rev. 2002;28:13–16. doi:10.1016/s0305-7372(02)80004-4
17. Klibanov AL, Maruyama K, Torchilin VP, Huang L. Amphipathic polyethyleneglycols effectively prolong the circulation time of liposomes. FEBS Lett. 1990;268(1):235–237. doi:10.1016/0014-5793(90)81016-h
18. Papahadjopoulos D, Allen TM, Gabizon A, et al. Sterically stabilized liposomes: improvements in pharmacokinetics and antitumor therapeutic efficacy. Proc Natl Acad Sci U S A. 1991;88(24):11460–11464. doi:10.1073/pnas.88.24.11460
19. Patil Y, Amitay Y, Ohana P, Shmeeda H, Gabizon A. Targeting of pegylated liposomal mitomycin-C prodrug to the folate receptor of cancer cells: intracellular activation and enhanced cytotoxicity. J Control Release. 2016;225:87–95. doi:10.1016/j.jconrel.2016.01.039
20. Zhang J, Hu XX, Zheng GH, Yao H, Liang HL. In vitro and in vivo antitumor effects of lupeol-loaded galactosylated liposomes. Drug Deliv. 2021;28(1):709–718. doi:10.1080/10717544.2021.1905749
21. Qi CP, Wang D, Gong X, et al. Co-delivery of curcumin and capsaicin by dual-targeting liposomes for inhibition of aHSC-induced drug resistance and metastasis. ACS Appl Mater Interfaces. 2021;13(14):16019–16035. doi:10.1021/acsami.0c23137
22. Zhu J, Zhang W, Wang DD, Li SZ, Wu W. Preparation and characterization of norcantharidin liposomes modified with stearyl glycyrrhetinate. Exp Ther Med. 2018;16(3):1639–1646. doi:10.3892/etm.2018.6416
23. Zhou T, Tang X, Zhang W, Feng JF, Wu W. Preparation and in vitro and in vivo evaluations of 10-hydroxycamptothecin liposomes modified with stearyl glycyrrhetinate. Drug Deliv. 2019;26(1):673–679. doi:10.1080/10717544.2019.1636422
24. Najim O, Huizing M, Papadimitriou K, et al. The prevalence of estrogen receptor-1 mutation in advanced breast cancer: the estrogen receptor one study (EROS1). Cancer Treat Res Commun. 2019;19:100123. doi:10.1016/j.ctarc.2019.100123
25. Sritana N, Suriyo T, Kanitwithayanun J, Songvasin BH, Thiantanawat A, Satayavivad J. Glyphosate induces growth of estrogen receptor alpha positive cholangiocarcinoma cells via non-genomic estrogen receptor/ERK1/2 signaling pathway. Food Chem Toxicol. 2018;118:595–607. doi:10.1016/j.fct.2018.06.014
26. Rago V, Romeo F, Giordano F, et al. Expression of oestrogen receptors (GPER, ESR1, ESR2) in human ductuli efferentes and proximal epididymis. Andrology. 2018;6(1):192–198. doi:10.1111/andr.12443
27. Osborne CK. Steroid hormone receptors in breast cancer management. Breast Cancer Res Treat. 1998;51(3):227–238. doi:10.1023/a:1006132427948
28. Issa RM, Lebeau A, Grob T, et al. Estrogen receptor gene amplification occurs rarely in ovarian cancer. Mod Pathol. 2009;22(2):191–196. doi:10.1038/modpathol.2008.130
29. Ataei N, Aghaei M, Panjehpour M. Evidences for involvement of estrogen receptor induced ERK1/2 activation in ovarian cancer cell proliferation by Cadmium Chloride. Toxicol In Vitro. 2019;56:184–193. doi:10.1016/j.tiv.2019.01.015
30. Xu CY, Guo JL, Jiang ZN, et al. Prognostic role of estrogen receptor a and estrogen receptor beta in gastric cancer. Ann Surg Oncol. 2010;17(9):2503–2509. doi:10.1245/s10434-010-1031-2
31. Ryu WS, Kim JH, Jang YJ, et al. Expression of estrogen receptors in gastric cancer and their clinical significance. J Surg Oncol. 2012;106(4):456–461. doi:10.1002/jso.23097
32. Tang WB, Liu RJ, Yan Y, et al. Expression of estrogen receptors and androgen receptor and their clinical significance in gastric cancer. Oncotarget. 2017;8(25):40765–40777. doi:10.18632/oncotarget.16582
33. Zhou F, Xu Y, Shi J, et al. Expression profile of E-cadherin, estrogen receptors, and P53 in early-onset gastric cancers. Cancer Med. 2016;5(12):3403–3411. doi:10.1002/cam4.931
34. Hao Q, Xu GX, Yang Y, et al. Oestrone-targeted liposomes for mitoxantrone delivery via oestrogen receptor - synthesis, physicochemical characterization and in-vitro evaluation. J Pharm Pharmacol. 2017;69(8):991–1001. doi:10.1111/jphp.12736
35. Wu J-G, Peng W, Yi J, et al. Chemical composition, antimicrobial activity against Staphylococcus aureus and a pro-apoptotic effect in SGC-7901 of the essential oil from Toona sinensis (A. Juss.) Roem. leaves. J Ethnopharmacol. 2014;154(1):198–205. doi:10.1016/j.jep.2014.04.002
36. Mehta AM, Van den Hoven JM, Rosing H, et al. Stability of oxaliplatin in chloride-containing carrier solutions used in hyperthermic intraperitoneal chemotherapy. Int J Pharm. 2015;479(1):23–27. doi:10.1016/j.ijpharm.2014.12.025
37. Liu XP, Geng DQ, Xu HX, Sui XH. The tissue distribution in mice and pharmacokinetics in rabbits of oxaliplatin liposome. J Liposome Res. 2009;19(4):278–286. doi:10.3109/08982100902824211
38. Ullah K, Khan SA, Sohail M, Mannan A, Murtaza G. Pharmacokinetic profile of oxaliplatin-loaded pH-responsive hydrogels in rabbits. Curr Pharm Des. 2020;26(44):5755–5763. doi:10.2174/1381612826666200813125159
39. Chen J, Jiang H, Wu Y, Li Y, Gao Y. A novel glycyrrhetinic acid-modified oxaliplatin liposome for liver-targeting and in vitro/vivo evaluation. Drug Des Devel Ther. 2015;9:2265–2275. doi:10.2147/DDDT.S81722
40. Tu B, He Y, Chen B, et al. Deformable liposomal codelivery of vorinostat and simvastatin promotes antitumor responses through remodeling tumor microenvironment. Biomater Sci. 2020;8(24):7166–7176. doi:10.1039/d0bm01516d
41. Abu-Lila A, Suzuki T, Doi Y, Ishida T, Kiwada H. Oxaliplatin targeting to angiogenic vessels by PEGylated cationic liposomes suppresses the angiogenesis in a dorsal air sac mouse model. J Control Release. 2009;134(1):18–25. doi:10.1016/j.jconrel.2008.10.018
42. Tai KD, Rappolt M, Mao LK, Gao YX, Yuan F. Stability and release performance of curcumin-loaded liposomes with varying content of hydrogenated phospholipids. Food Chem. 2020;326:126973. doi:10.1016/j.foodchem.2020.126973
43. Zhang F, Guo H, Zhang J, Chen Q, Fang Q. Identification of the caveolae/raft-mediated endocytosis as the primary entry pathway for aquareovirus. Virology. 2018;513:195–207. doi:10.1016/j.virol.2017.09.019
44. Doherty GJ, McMahon HT. Mechanisms of endocytosis. Annu Rev Biochem. 2009;78:857–902. doi:10.1146/annurev.biochem.78.081307.110540
45. Miaczynska M, Stenmark H. Mechanisms and functions of endocytosis. J Cell Biol. 2008;180(1):7–11. doi:10.1083/jcb.200711073
46. Saito A, Sato H, Iino N, Takeda T. Molecular mechanisms of receptor-mediated endocytosis in the renal proximal tubular epithelium. J Biomed Biotechnol. 2010;2010:1–7. doi:10.1155/2010/403272
47. Wang J, Guo F, Yu M, et al. Rapamycin/DiR loaded lipid-polyaniline nanoparticles for dual-modal imaging guided enhanced photothermal and antiangiogenic combination therapy. J Control Release. 2016;237:23–34. doi:10.1016/j.jconrel.2016.07.005
48. Elbayoumi TA, Torchilin VP. Enhanced cytotoxicity of monoclonal anticancer antibody 2C5-modified doxorubicin-loaded PEGylated liposomes against various tumor cell lines. Eur J Pharm Sci. 2007;32(3):159–168. doi:10.1016/j.ejps.2007.05.113
49. Jain AS, Goel PN, Shah SM, et al. Tamoxifen guided liposomes for targeting encapsulated anticancer agent to estrogen receptor positive breast cancer cells: in vitro and in vivo evaluation. Biomed Pharmacother. 2014;68(4):429–438. doi:10.1016/j.biopha.2014.03.004
50. AlRabiah H, Attia SM, Al-Shakliah NS, Mostafa GAE. Development and validation of an HPLC-UV detection assay for the determination of clonidine in mouse plasma and its application to a pharmacokinetic study. Molecules. 2020;25(18):4109. doi:10.3390/molecules25184109
51. Meirinho S, Rodrigues M, Fortuna A, Falcão A, Alves G. Novel bioanalytical method for the quantification of rufinamide in mouse plasma and tissues using HPLC-UV: a tool to support pharmacokinetic studies. J Chromatogr B Analyt Technol Biomed Life Sci. 2019;1124:340–348. doi:10.1016/j.jchromb.2019.06.021
52. Li K, Wang SJ. Preparation, pharmacokinetic profile, and tissue distribution studies of a liposome-based formulation of SN-38 using an UPLC-MS/MS method. Aaps Pharmscitech. 2016;17(6):1450–1456. doi:10.1208/s12249-016-0484-4
53. Yan N, Tang Z, Xu YQ, Li XM, Wang Q. Pharmacokinetic study of ferulic acid following transdermal or intragastric administration in rats. Aaps Pharmscitech. 2020;21(5). doi:10.1208/s12249-020-01709-w
54. Shen X, Chen F, Wang F, Huang P, Luo W. The effect of grapefruit juice on the pharmacokinetics of tadalafil in rats. Biomed Res Int. 2020;2020:1631735. doi:10.1155/2020/1631735
55. Abdalla YOA, Nyamathulla S, Shamsuddin N, et al. Acute and 28-day sub-acute intravenous toxicity studies of 1ʹ-S-1ʹ-acetoxychavicol acetate in rats. Toxicol Appl Pharmacol. 2018;356:204–213. doi:10.1016/j.taap.2018.08.014
56. Cui H, Yuan L, Li W, Lin L. Antioxidant property of SiO2-eugenol liposome loaded nanofibrous membranes on beef. Food Packag Shelf Life. 2017;11:49–57. doi:10.1016/j.fpsl.2017.01.001
57. Zhang WY, Du F, He M, et al. Studies of anticancer activity in vitro and in vivo of iridium(III) polypyridyl complexes-loaded liposomes as drug delivery system. Eur J Med Chem. 2019;178:390–400. doi:10.1016/j.ejmech.2019.06.009
58. Mo LX, Song JG, Lee H, et al. PEGylated hyaluronic acid-coated liposome for enhanced in vivo efficacy of sorafenib via active tumor cell targeting and prolonged systemic exposure. Nanomed Nanotechnol Biol Med. 2018;14(2):557–567. doi:10.1016/j.nano.2017.12.003
59. Chen TJ, Gong T, Zhao T, Fu Y, Zhang ZR, Gong T. A comparison study between lycobetaine-loaded nanoemulsion and liposome using nRGD as therapeutic adjuvant for lung cancer therapy. Eur J Pharm Sci. 2018;111:293–302. doi:10.1016/j.ejps.2017.09.041
60. Li M, Wang S, Xu J, Xu S, Liu H. pH/Redox-controlled interaction between lipid membranes and peptide derivatives with a “Helmet”. J Phys Chem B. 2019;123(31):6784–6791. doi:10.1021/acs.jpcb.9b05367
61. Farooq MA, Huang X, Jabeen A, et al. Enhanced cellular uptake and cytotoxicity of vorinostat through encapsulation in TPGS-modified liposomes. Colloids Surf B Biointerfaces. 2021;199:111523. doi:10.1016/j.colsurfb.2020.111523
62. Yi S, Zhang C, Hu J, et al. Preparation, characterization, and in vitro pharmacodynamics and pharmacokinetics evaluation of PEGylated urolithin A liposomes. Aaps Pharmscitech. 2021;22(1). doi:10.1208/s12249-020-01890-y
63. Zahednezhad F, Shahbazi Mojarrad J, Zakeri-Milani P, et al. Surface modification with cholesteryl acetyl carnitine, a novel cationic agent, elevates cancer cell uptake of the PEGylated liposomes. Int J Pharm. 2021;609:121148. doi:10.1016/j.ijpharm.2021.121148
64. Ghaferi M, Asadollahzadeh MJ, Akbarzadeh A, Shahmabadi HE, Alavi SE. Enhanced efficacy of PEGylated liposomal cisplatin: in vitro and in vivo evaluation. Int J Mol Sci. 2020;21(2):559. doi:10.3390/ijms21020559
 © 2021 The Author(s). This work is published and licensed by Dove Medical Press Limited. The full terms of this license are available at https://www.dovepress.com/terms.php and incorporate the Creative Commons Attribution - Non Commercial (unported, v3.0) License.
By accessing the work you hereby accept the Terms. Non-commercial uses of the work are permitted without any further permission from Dove Medical Press Limited, provided the work is properly attributed. For permission for commercial use of this work, please see paragraphs 4.2 and 5 of our Terms.
© 2021 The Author(s). This work is published and licensed by Dove Medical Press Limited. The full terms of this license are available at https://www.dovepress.com/terms.php and incorporate the Creative Commons Attribution - Non Commercial (unported, v3.0) License.
By accessing the work you hereby accept the Terms. Non-commercial uses of the work are permitted without any further permission from Dove Medical Press Limited, provided the work is properly attributed. For permission for commercial use of this work, please see paragraphs 4.2 and 5 of our Terms.