")
Back to Journals » Infection and Drug Resistance » Volume 14
In vitro and in vivo Antibacterial Activity of Linezolid Plus Fosfomycin Against Staphylococcus aureus with Resistance to One Drug
Authors Xie N, Jiang L, Chen M, Zhang G, Liu Y , Li J, Huang X
Received 4 November 2020
Accepted for publication 14 January 2021
Published 24 February 2021 Volume 2021:14 Pages 639—649
DOI https://doi.org/10.2147/IDR.S290332
Checked for plagiarism Yes
Review by Single anonymous peer review
Peer reviewer comments 3
Editor who approved publication: Professor Suresh Antony
Na Xie,1 Lifang Jiang,1 Mingtao Chen,1 Guijun Zhang,1 Yanyan Liu,2 Jiabin Li,2 Xiaohui Huang1
1Department of Basic and Clinical Pharmacology, School of Pharmacy, Anhui Medical University, Hefei, Anhui, People’s Republic of China; 2Department of Infectious Diseases, The First Affiliated Hospital of Anhui Medical University, Hefei, Anhui, People’s Republic of China
Correspondence: Xiaohui Huang
Department of Basic and Clinical Pharmacology, School of Pharmacy, Anhui Medical University, 81 Meishan Road, Hefei, Anhui Province, 230032, People’s Republic of China
Tel +86 138 5518 3138
Email [email protected]
Jiabin Li
Department of Infectious Diseases, The First Affiliated Hospital of Anhui Medical University, Jixi Road, 218#, Hefei, Anhui Province, 230032, People’s Republic of China
Fax +86 551 62922713
Email [email protected]
Objective: The purpose of this study is to assess the in vitro/vivo activities of linezolid plus fosfomycin against Staphylococcus aureus (S. aureus) isolates with varying susceptibility to the study drugs.
Methods: The increasing concentration stepwise method was used to induce S. aureus resistant strains. The in vitro antibacterial activity of linezolid combined with fosfomycin against S. aureus in vitro was studied by time-kill curve and PAE. The transmission electron microscopy (TEM) was employed to observe the cell morphology of bacteria treated with drug, and the changes of cell wall thickness were recorded. The Galleria mellonella infection model was established to demonstrate the in vivo efficacy of linezolid and fosfomycin against S. aureus with varying susceptibility.
Results: The antibiotic combination showed excellent synergistic or additive effects on the original and the linezolid-resistant strain, but showed indifferent effect for fosfomycin-resistant strain. TEM images showed that fosfomycin alone and in combined could reduce the cell wall thickness of the strains resistant to linezolid and cell lysis, while linezolid increases the cell wall thickness of the strains resistant to fosfomycin. In the Galleria mellonella infection model, the survival rate of the antibiotic combined was improved compared with that of the single drug. There was a good correlation between in vivo efficacy and in vitro susceptibility.
Conclusion: The type of interaction expressed in the test combination was highly dependent on fosfomycin resistance.
Keywords: linezolid, fosfomycin, interaction, resistant, Staphylococcus aureus, Galleria mellonella
Introduction
Staphylococcus aureus (S. aureus) is one of the common pathogen-causing pneumonia, bacteremia and other serious diseases.1,2 Increased resistance to antibiotics in S. aureus is now threatening the successful use of available antibiotics such as linezolid.3,4 Because of S. aureus ability to develop drug resistance during therapy, empirical treatment for serious systemic infections usually involves two-drug combination regimens.5 One such potentially favorable combination is linezolid combined with fosfomycin. For instance, Chai D found that fosfomycin combined with linezolid was most effective in MRSA induced biofilm infection compared to levofloxacin and rifampicin.6 Lan L used the Galleria mellonella infection model to show that linezolid combined with fosfomycin have excellent synergistic effect on Staphylococcus aureus in vivo.7
At present, the research on the combination of the two drugs mainly focuses on strains that are sensitive to both drugs or resistant to third parties, such as methicillin-resistant S. aureus (MRSA).8,9 However, fosfomycin has been in clinic for more than 50 years. Related studies show that S. aureus has a resistance rate of nearly 30% to fosfomycin in recent years. While single drug therapy is very prone to develop drug resistance.10–12 Linezolid was found to be resistant to S. aureus in the first year of clinical practice, and then drug-resistant strain was found all over the world.13,14 Therefore, in practical application, the combination of the two drugs may include some strains that are already resistant to linezolid or fosfomycin.15–17 In order to have a comprehensive understanding of the antibacterial activities of linezolid and fosfomycin against Staphylococcus aureus, and in order to prepare a reasonable clinical regimen.
In this study, linezolid and fosfomycin, alone and combined, were used to test against a standard strain of S.aureus ATCC 29213, before and after induction of resistance to each of the two antibiotics. The in vitro antibacterial activity of the two drugs combined against the resistant strains was studied by time-kill curve and post-antibiotic effect (PAE). The effect of antibiotics on the morphology of bacteria was observed by transmission electron microscope (TEM). On the other hand, the efficacy of antibiotic combination in vivo was evaluated using the Galleria mellonella infection model. One key study objective was to generate some baseline data in a systematic manner that would help stimulate further discussions.
Materials and Methods
Materials and Strains
S. aureus ATCC 29213 was obtained from The First Affiliated Hospital of Anhui Medical University, China. Linezolid and fosfomycin were purchased from the National Institute for Food and Drug Control of China (Beijing, China). Mueller-Hinton agar (MHA, Oxoid, England) was used for performing agar dilution method, culturing bacteria and quantifying colony counts. Cation-adjusted Mueller-Hinton broth (CAMHB, Oxoid, England) containing Ca2+ of 25 mg/L and Mg2+ of 12.5 mg/L was used for all in vitro susceptibility analyses. In addition, 25mg/L glucose-6-phosphate (G6P) was supplemented when the sensitivity of fosfomycin was detected.
MIC Testing
MIC values of linezolid and fosfomycin were determined with the agar dilution method according to Clinical and Laboratory Standards Institute standard methods (CLSI) guidelines.18 In brief, a 0.1mL antibiotic made with fresh broth and a 0.1mL final bacterial inoculum of 5×10⁵ CFU/mL were placed in each well. The antibiotic concentrations were diluted by doubling dilution method and final concentrations ranged from 0.25 mg/L - 512 mg/L for fosfomycin and 0.25–64 mg/L for linezolid. The plates were incubated at 37°C for 18–24 h. According to the CLSI in 2019, resistance (R) was defined as MIC of ≥8 mg/L linezolid. According to the EUCAST in 2019, resistance (R) was defined as MIC of >32 mg/L fosfomycin. MIC determinations were performed in triplicate for each strain.
In vitro Induction of Resistance
Induction of resistance against the two study antibiotics was performed on the original S. aureus ATCC 29213 strain and used the increasing concentration stepwise manner.19 Briefly, a 0.5 McFarland standard of each strain was inoculated into 10mL of MHB broth containing antibiotic. The fosfomycin or linezolid concentrations used for induction rang from 1× to 4× the MIC for the parent strain or sub-parent mutant strain resulting from the prior induction step. These cultures were incubated at 37°C for 24h. The cultures were inoculated on agar plates containing different concentrations of antibiotics and isolates with the highest MIC were subjected to further induction. This was repeated when a higher exposure concentration was used for the next step of the induction cycle until mutants with significantly high MICs were selected. The stability of the selected resistant mutants was confirmed by antibacterial agent-free medium for 20 serial passages. The mic determination of the last passed strain was performed using linezolid and fosfomycin.
Molecular Typing of the Isolates
Pulsed-field gel electrophoresis (PFGE): all strains were processed following the protocol proposed by Cazares Dominguez et al.20 The agarose blocks containing the chromosomal DNA were cleaved with the SmaI enzyme. The samples were electrophoresed on 1% agarose gel in 0.5% TBE buffer. The agarose gels containing the DNA fragments were stained with ethidium bromide solution. Pulsotypes were considered to be different if the coefficient of similarity was less than 80%.
Multilocus Sequence Typing (MLST): The chromosomal DNA as used to amplify the seven housekeeping genes with MLST according to the Oxford scheme, which included arcC, aroE, glpF, gmk, pta, tpi, and yqi. The purified PCR fragment was sequenced by General biology (Anhui) Co., Ltd. The sequence results were compared with the MLST databases (https://pubmlst.org) to determine the molecular typing.
Time-Kill Assays
The type of action was examined using time-kill curves with each antibiotic alone and in combination at an initial inoculum of roughly 1.5×10⁵ CFU/mL over 24h, basing on a previously described methodology.21 Selecting the appropriate combination of antibiotics according to their different susceptibility modes to antibiotics. The details are as follows: (i) 1, 2, 4mg/L linezolid and 0.5, 1, 2mg/L fosfomycin alone or in combination for the original strains; (ii) 2mg/L linezolid and 0.5, 1, 2mg/L alone or in combination fosfomycin for the linezolid-resistant strains; (iii)1mg/L fosfomycin and 1, 2 and 4mg/L linezolid alone or in combination for fosfomycin resistant strains. Bacterial counts were obtained at 0, 2, 4, 6, 8, 12 and 24 h. All tests were performed in duplicate. Sensitivity changes in all strains regenerated after 24 hours were measured. Synergistic effect was defined as more than 2 log10 CFU/mL decrease at 24 hours compared with that for the most active single agent.
PAE Assessments
PAE was measured by the method of Gudmundsson and Craig.22 Selecting 2–3 colonies and inoculate them in Mueller-Hinton broth for 2–3 hours to achieve the logarithmic phase. Bacterial suspensions at the log-phase were diluted to the inoculum of approximately 1.0×10⁶ CFU/mL. The organisms were exposed to 4mg/L linezolid and 2mg/L fosfomycin alone or in combination for 1 h. At the end of the 1 h exposure, the antibiotic(s) was removed by 3 washing using Mueller-Hinton broth and centrifugation at 1400 g for 5 min. Bacterial counts were determined at 0,1,2,4,6,8 and 10h after dilution. The cultures were kept at 37°C using a water bath throughout the experiments. PAE is the time required for the viable count to increase by one log unit after the removal of antibiotics in the test culture minus the time difference for the same procedure in the antibiotic-free culture.
TEM
Using the middle-level resistant strain as the representative strain, we used transmission electron microscope (TEM) to observe the effect of drug alone and in combination on the structural of bacteria. Meanwhile, we used antibiotic concentrations and types that were consistent with the post-antibiotic effects studies. The linezolid or fosfomycin alone and in combinations were added to the tubes containing a final inoculum of 1.5 ×10⁵ CFU/mL of each strain in Mueller-Hinton broth at 37°C with shaking for 4h. The samples were centrifuged at 3000 rpm for 10min to remove the Mueller-Hinton broth, and then washed three times with PBS. The precipitate was fixed with 2.5% glutaraldehyde overnight at 4°C. After removal of 2.5% glutaraldehyde, bacterial particles were post-fixed in 1% osmium tetroxide for 1 hours and stained with 2% uranium acetate. Later the bacterial particles were dehydrated in 70%,80%, 90% ethyl alcohol. Finally, the cells were embedded, polymerized and sectioned. The prepared samples were observed under TEM (Talos L120C, Thermo Scientific, USA) at Anhui Medical University, China. The three cells with nearly equatorial cut surfaces, their cell wall thickness were measured for each strains and results were expressed as means ± standard deviations.
In vivo Galleria mellonella Survival Assay
The G. mellonella infection model for S. aureus isolates was established as previously reported.23 The Galleria larvae (Kaide Ruixin Co., Tianjin, People’sRepublic of China) weighing 250–350 mg and without grey marks were selected for experimental study. . In order to determine the optimal lethal dose of each strains, 40 insects were injected with 10μL of log-phase bacterial suspensions (10 larvae for105, 106, 107and 108 CFU/mL, respectively) and 10 larvae were injected with normal saline (NS) as controls. Bacterial suspensions were injected into the body through the last left proleg using a 25 μL Hamilton syringe (Hamilton, Shanghai and People’s Republic of China). Larvae were incubated at 37°C. The number of bacterial deaths was recorded every 24 hours over 96 hours.
Antibiotics were administered 10 mL injections either alone or in combination, into a different proleg within 2 h after infection. The following doses were based on human doses: (i) linezolid alone (10 mg/kg), (ii) fosfomycin alone (200 mg/kg), (iii) linezolid (10 mg/kg) and fosfomycin (200 mg/kg) in combination, (iv) linezolid (2.5mg/kg) and fosfomycin (50mg/kg) in combination or (v) no treatment. Treatment was given only once. The larvae were observed for survival every 24 h for 96h.
Statistical Analysis
Statistical analysis was performed with SPSS 21.0. One-way ANOVA was performed to assess the change of each antibiotic concentration, alone or in combination. In the results, P<0.05 was considered to be significant.
Results
MIC
The MICs of linezolid and fosfomycin against the S. aureus ATCC 29213 were 2 and 1 mg/L, respectively. After continuous induction of the original strain on a drug-containing medium, subpopulations of S. aureus ATCC 29213 resistant to 8, 16 and 32mg/L of linezolid (L8, L16, L32, respectively) and 64, 128 and 256 mg/L of fosfomycin (F64, F128, F256, respectively) were obtained. At the same time, mic of fosfomycin for three linezolid-resistant bacteria are 1 mg/L and mic of linezolid for three fosfomycin-resistant bacteria are 2 mg/L. The sensitivity of the resistant strain did not change when it was passed for 20 times on the blank plate, indicating good stability of the bacteria.
Genetic Diversity and Molecular Typing
The macrorestriction pattern obtained using PFGE showed that the strain-induced resistance in vitro had the same pulsotypes as the original strain with a correlation coefficient of 90–100% (Figure 1). Multilocus sequence typing was performed to obtain the ST of S. aureus strains. It was found that the genotypes of the strains before and after induction in vitro were ST5939 by comparing the sequences with MLST database.
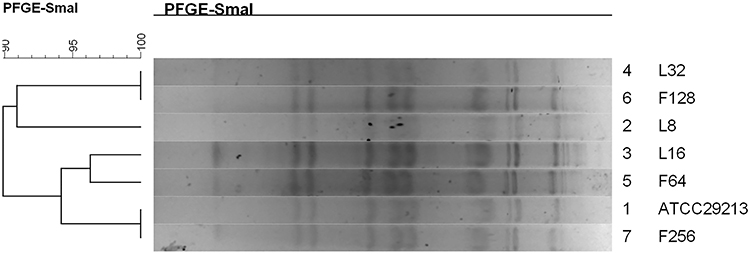 |
Figure 1 Dendrogram of the PFGE pulsotypes for the original strain and in vitro induced resistance S. aureus. |
Time-Kill Assays
The complete time-kill data for all strains and concentrations (monotherapy and combination therapy) are presented in Figure 2. Log changes in 24h viable bacterial counts with antibiotic therapy are shown in Table 1.
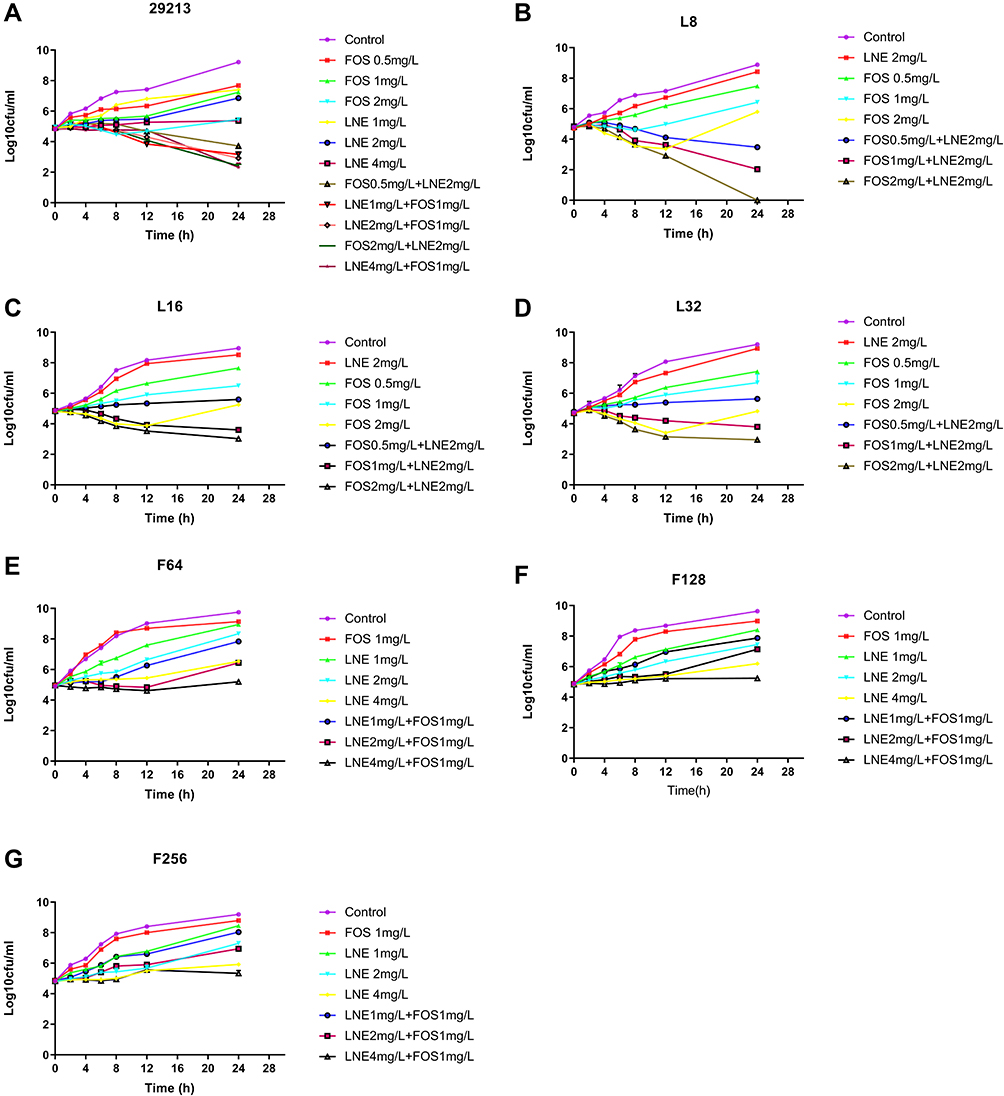 |
Figure 2 Time-kill curves with various concentrations of linezolid and fosfomycin alone and in combination against S. aureus. (A) S. aureus ATCC 29213; (B) S. aureus resistant to 8 mg/L of linezolid; (C) S. aureus resistant to 16 mg/L of linezolid; (D) S. aureus resistant to 32 mg/L of linezolid; (E) S. aureus resistant to 64 mg/L of fosfomycin; (F) S. aureus resistant to 128 mg/L of fosfomycin; (G) S. aureus resistant to 256 mg/L of fosfomycin. Abbreviations: CFU, colony-forming units; FOS, fosfomycin; LNE, linezolid. |
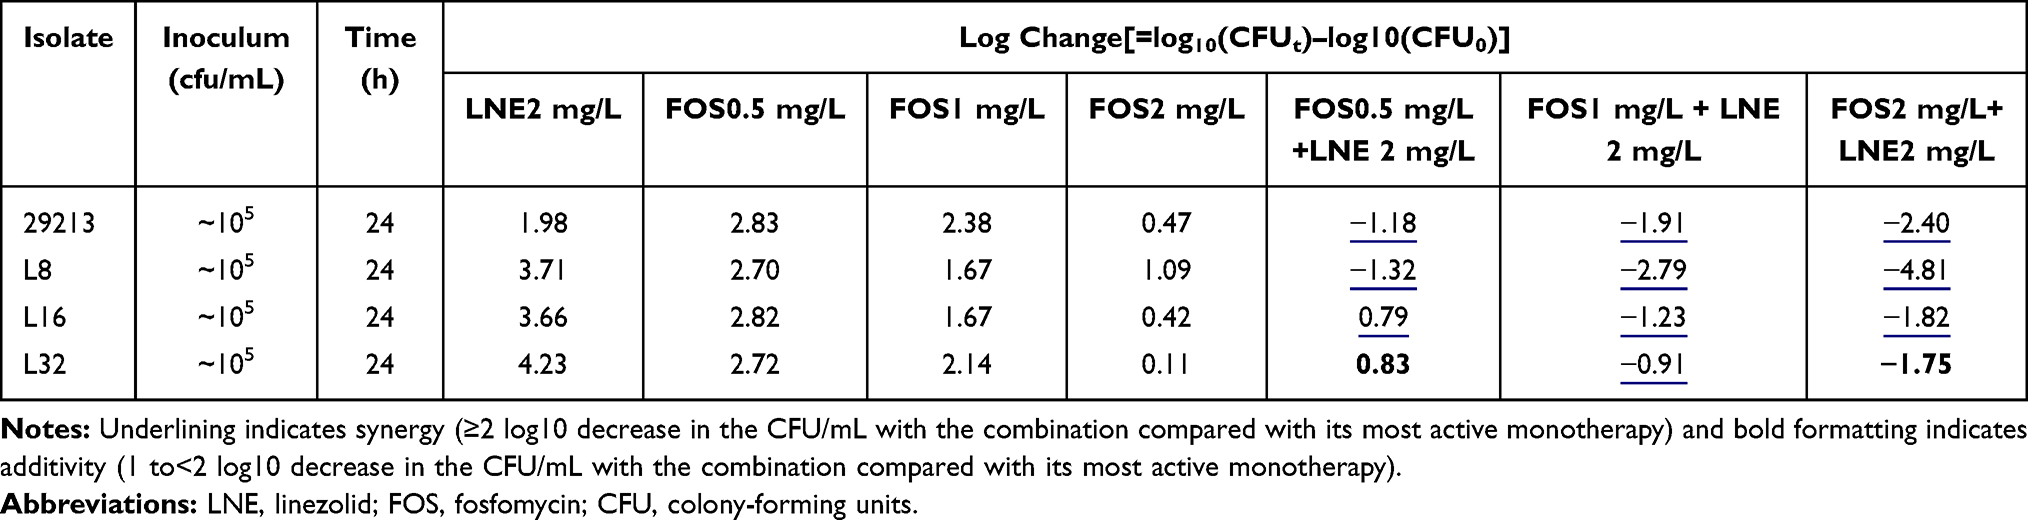 |
Table 1 Log Changes at 24 Hours with Various Concentrations of Linezolid and/or Fosfomycin Against the Strain Resistant to Linezolid |
For the S. aureus ATCC 29213, cell counts in all combination groups decreased by 1–3 Log at 24h compared with the single group, showing excellent synergistic or additive effects (Table 1). For linezolid-resistant strain, the antibacterial activity was significantly enhanced with the increase of fosfomycin concentration, but it is slight effect by 2mg/L linezolid (Figure 2B–D). The LNE/FOS combination at all concentrations produced more rapid and extensive killing than with either antibiotic alone. In particular, when linezolid of 2mg/L with fosfomycin of 2mg/L, 4.8 Log10CFU/mL additional killing was observed in low-level resistant strain at 24 hours (Table 1). It is worth noting that when fosfomycin was 1mg/L or 2mg/L, monotherapy and combination group showed similar antimicrobial activity at 0–8h, but significant regrowth occurred at 8–12h in monotherapy (Figure 2B).
For fosfomycin resistant strain, the antibacterial activity did not increase significantly with the increase of linezolid concentration (Table 2). For F128 and F256, all containing drug groups grew in parallel with the control group, and the type of interaction of all combinations were indifferent (Figure 2E–G). MICs of fosfomycin for all isolates obtained from the final timepoint of the time-kill assay were >256 ug/mL, representing at least an one-fold MIC elevation.
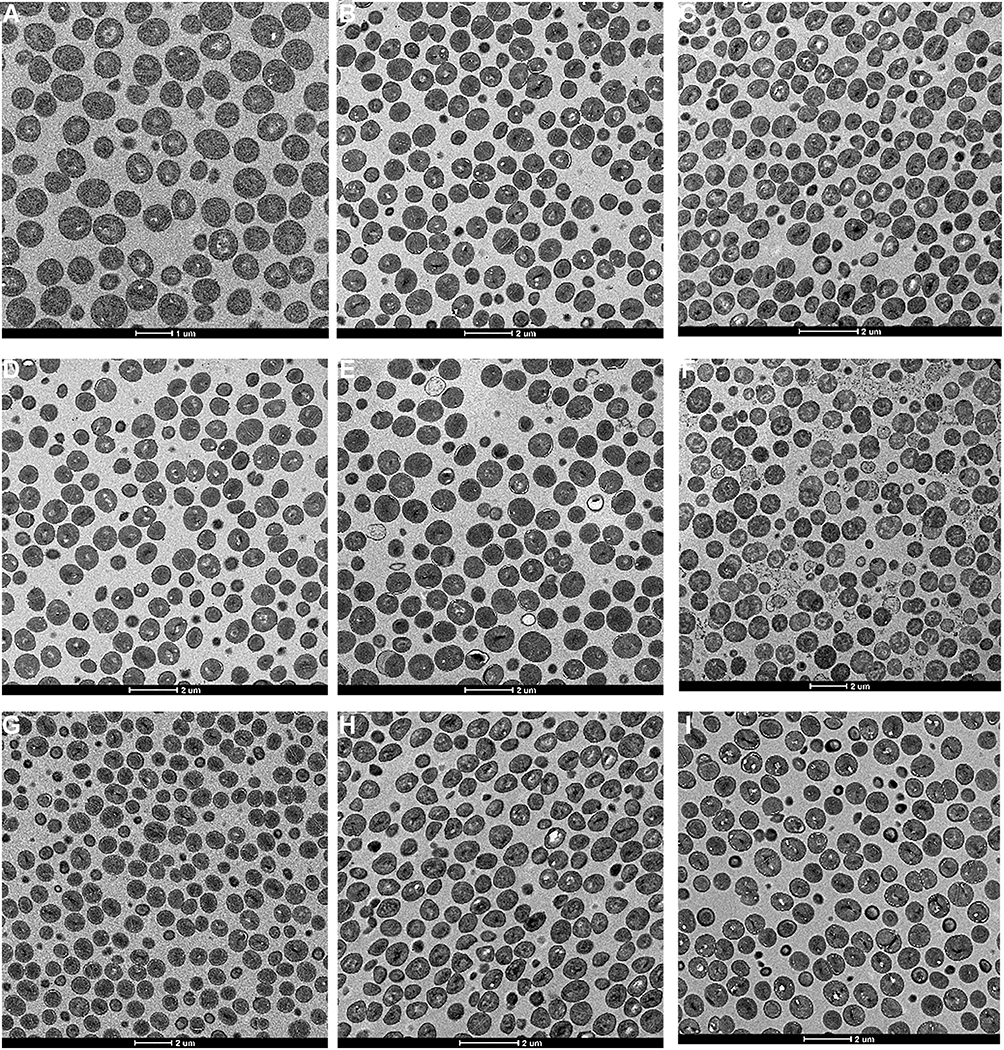 |
Figure 3 Effect of Linezolid and/or fosfomycin on the cell morphology of S. aureus; (A–C) respectively represents the untreated S.aureus ATCC 29213, L16, and F128; (D–F) respectively represents S.aureus L16 treated with linezolid, fosfomycin and in combination; (G–I) respectively represents S.aureus F128 treated with linezolid, fosfomycin and in combination. |
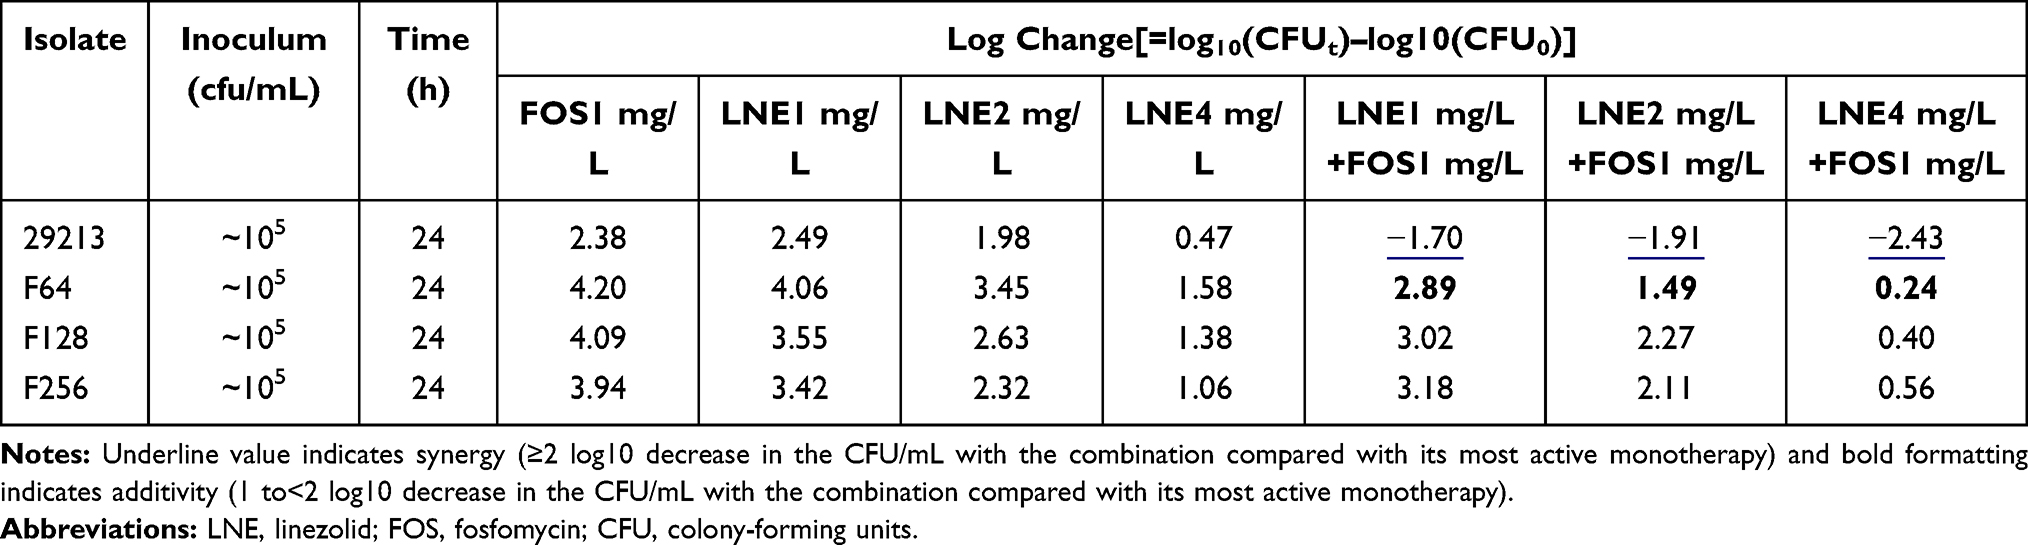 |
Table 2 Log Changes at 24 Hours with Various Concentrations of Linezolid and/or Fosfomycin Against the Strain Resistant to Fosfomycin |
PAE
Following 1 h of exposure, the PAE assessed for the S. aureus ATCC 29213 were 1.06h for linezolid and 1.67 h for fosfomycin and 2.96 h for the combination (Table 3). The PAE produced by the combination was longer than the sum of those produced by the individual antibiotics alone, the combination was synergistic.
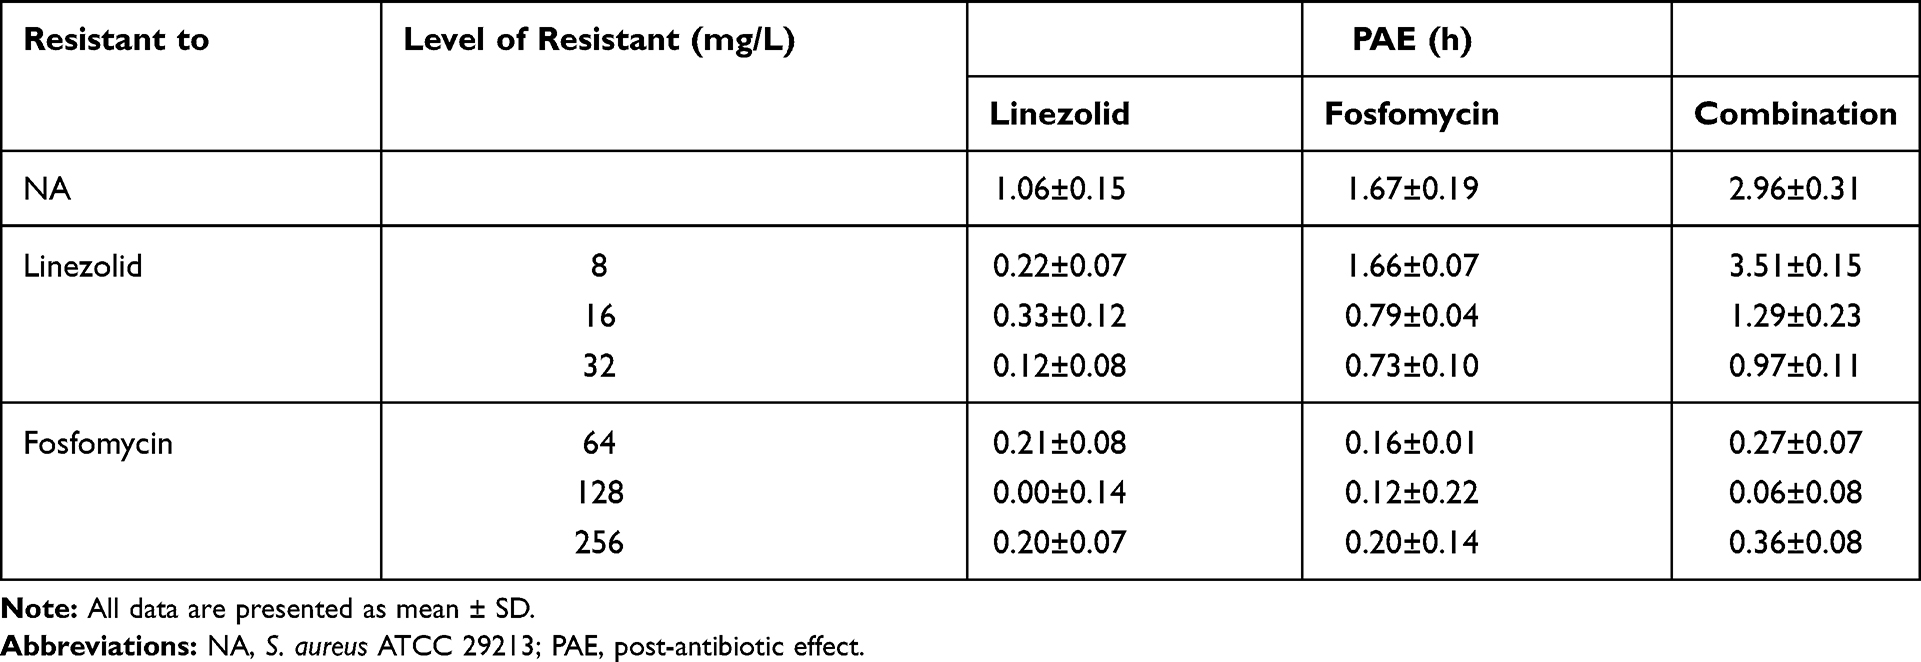 |
Table 3 PAEs Expressed by S. aureus with Different Levels of Susceptibility to Linezolid and Fosfomycin After 1h of Exposure to Linezolid (4 mg/L) and Fosfomycin (2mg/L), Alone and in Combination |
When the linezolid-resistant strains were tested, a PAE was recorded following the exposure to fosfomycin from 1.67 h for the original strain to 1.66, 0.79 and 0.73 h, as the resistance level was increased from 8, 16 to 32 mg/L (Table 3), respectively. With the gradual increase of drug resistance, the PAE produced in the combined group changed from 2.9 h to 0.9–3.5 h in the control group. Interestingly, fosfomycin alone and combined on strain L8 produced PAE longer than the original strain. In addition, the combination of linezolid and fosfomycin showed a synergistic effect for all the linezolid-resistant strains. However, the PAE produced by linezolid alone dropped from an initial 1.6h to about 0.2h. For the original strain and linezolid resistant strain, there were significant statistical differences between single drug and combination groups (P< 0.05)
When the fosfomycin-resistant strains were tested, linezolid produced a negative PAE, ie, 0.00–0.21h as compared with 1.06h for the original strain (Table 3). A similar situation was observed in the fosfomycin alone and in combination. For each fosfomycin-resistant strain, there was no significant difference in the expression of PAE between the single drug and the combined group (P >0.05).
TEM
Figure 3A–C) untreated cell were observed with elliptical shapes, dense content and vigorous division. The cell walls of all the normal group were smooth and uniform thickness, and further observation showed that the cell wall thickness of the S. aureus ATCC 29213 was approximately 35nm similar to F128, and the L16 increase to 52 nm (Table 4).
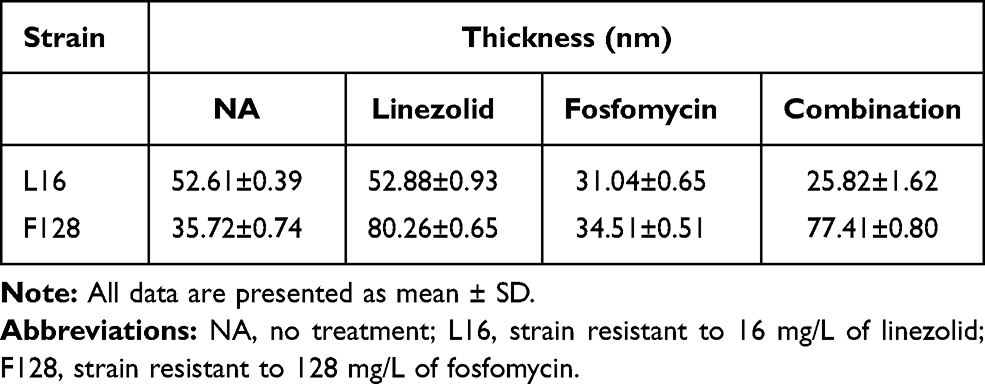 |
Table 4 Changes in Cell Wall Thickness After 4 h of Linezolid and Fosfomycin Alone or in Combination |
Figure 3D–F respectively shows TEM results of L16 following therapy with 4mg/L linezolid, 2mg/L fosfomycin or in combination. When L16 cells were exposed to linezolid for 4 h, the cell morphological integrity, and the cell wall thickness was similar to that of the normal (Figure 3D). However, when L16 was exposed to fosfomycin monotherapy and in combination, cell walls were reduced to 31.04±0.65 nm and 25.82 ± 1.62 nm, respectively (Figure 3E and F). At the same time, the cytoplasmic cavity is enlarged, cell membrane damage and cytoplasmic leakage were observed. Almost no intact cells were seen in the combination group. For L16, there were significant statistical differences between fosfomycin (alone and in combination) and linezolid groups (P<0.05). Different from L16, antibiotics alone and combined had no significant effect on the bacterial morphology of F128 (Figure 3G–I). However, linezolid monotherapy and its combination on F128 significantly thickened the bacterial cell wall (P <0.05). This may be related to the mechanism of bacterial resistance.
In vivo Galleria mellonella Survival Assay
The survival rate of the Galleria mellonella decreased with the increase of bacterial concentration. The 80% fatality rate of linezolid or fosfomycin-resistant strains was approximately 1.5×10⁷ CFU/mL and of the original strain was 1.5×10⁸ CFU/mL (Figure 4).
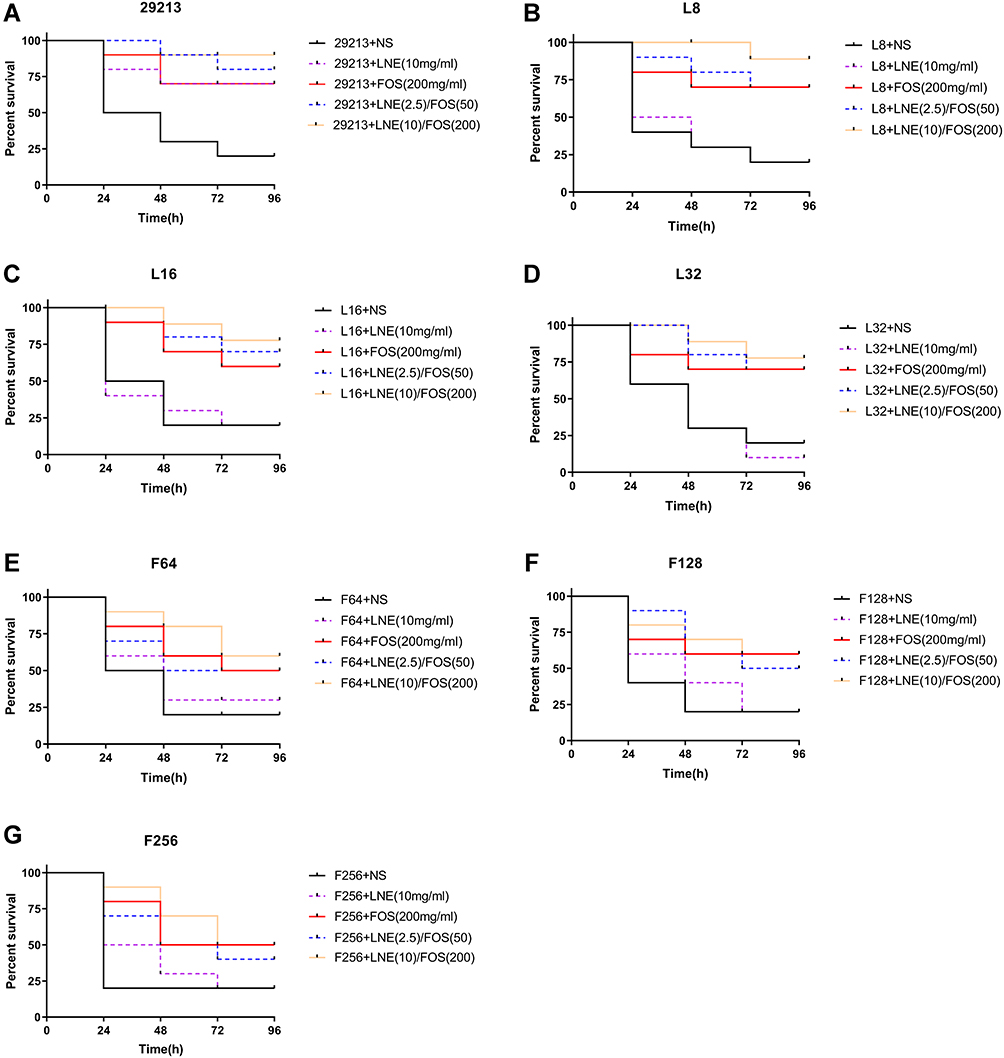 |
Figure 4 Survival curves of S.aureus infected Galleria mellonella larvae treated with linezolid and fosfomycin at different concentrations alone or in combination (A) S. aureus ATCC 29213; (B–D) respectively represents S.aureus resistant to 8, 16, 32 mg/L of linezolid; (E–G) respectively represents S.aureus resistant to 64, 128, 256 mg/L of fosfomycin. Abbreviations: LNE, linezolid; FOS, fosfomycin; NS, 0.9% NaCl. |
For the original strain, the survival rate of the high concentration combined group was significantly higher than that of the monotherapy group (P≤0.05), and there is a little difference between the monotherapy groups. For the linezolid-resistant strain, fosfomycin monotherapy and low-dose combination group was similar survival rate but performed poorly compared with the high-dose linezolid/fosfomycin combination. Meanwhile, the mortality of the linezolid monotherapy group was similar to that of the control group (P≥0.05). For fosfomycin-resistant strain, the fosfomycin monotherapy and the combined were superior to the linezolid monotherapy but no significance was observed (P≥0.05). Therefore, we may consider that there is a correlation between the antibacterial efficacy in vivo and the sensitivity in vitro.
Discussion
PAE is an important pharmacodynamic parameter for clinical design of administration interval. At present, the research on PAE mainly focuses on single antibiotic and pays little attention to the antibiotic combinations.24–26 In view of the rapid development of resistance and the increasing use of combined antibiotic, antibacterial activities in vivo and in vitro, including the PAE, cannot be ignored.
The results of this study in vitro showed that the combination of the two drugs had excellent synergistic bactericidal effect on ATCC 29213. This is the same as most previous studies.8,27 When the linezolid-resistant subpopulations were tested, fosfomycin alone and combined both show great antibacterial activity. Especially at low levels of resistance, the maximum number of bacteria dropped by 4 Log in 24 hours and PAE was produced for 3.5 hours, which was higher than the antibacterial effect of original bacteria. The antibacterial activity of fosfomycin monotherapy and its combination decreased slightly in the face of medium and high-level resistant strains. But there was no significant statistical difference between medium and high drug resistant strains. This may be due to the different types of mutations in low and medium or high levels of drug-resistant strains, resulting in different levels of antibiotics entering the body.28 However, this does not prevent the combination of the two drugs from having better antibacterial activity against linezolid-resistant strain. For the fosfomycin-resistant organism, the time-kill curve showed that there was no significant difference between the treatment group and the control group, and PAE decreased from a maximum of 2.9h to 0.2h. This result is in sharp contrast to the original strain and the linezolid-resistant subpopulations. On the one hand, defining an interaction without considering the organism’s resistance profile can be misleading. Similar phenomenon, Fish, D. N. the experimental results showed that cephalosporins combined with fluoroquinolones showed synergistic effect on Pseudomonas aeruginosa resistant to single or double drugs, but not when the strains were sensitive to both drugs.29 On the other hand, this study proved for the first time that the negative impact on antibacterial activity caused by resistance development against the fosfomycin component was more dominant, fosfomycin resistance should be weighed more heavily when judgment is to be made on selecting antibiotic combinations for use. In order to achieve the best therapeutic effect with the least side effects, the treatment methods should be adjusted appropriately.
TEM showed that the cell wall of linezolid-resistant strains was about 20 nm thicker than that of sensitive bacteria, and the cell wall became thinner after fosfomycin alone or in combination. Interestingly, there was no thickening of cell wall in fosfomycin-resistant strain. But the cell wall of fosfomycin-resistant strains thickened to about 75nm when treated with linezolid alone or in combination. We suspect that this may be related to the mechanism of drug resistance of bacteria. As it is scientifically known that, fosfomycin is a bactericidal antibiotic that interferes with cell wall synthesis in bacteria by inhibiting the initial step involving phosphoenolpyruvate synthetase.30,31 Linezolid exerts antibacterial activity by inhibiting the synthesis of bacterial proteins.13,32 In addition, relevant studies have shown that the strain can produce drug resistance by producing excess wall material and reducing the autolysis rate.33–35 Combining the result of the time killing curve and PAE, we speculated that fosfomycin may play a good antibacterial role by destroying the cell wall and accelerating the entry of linezolid into the cell body. After bacteria become resistant to fosfomycin, it may change the position or type of some proteins on the cell wall, resulting in linezolid can not play a role in the bacteria. At the same time, long-term contact with linezolid may aggravate the production of bacterial lipopolysaccharide and lead to further drug resistance. The mechanism of drug resistance of bacteria is complex and changeable, and the specific ways still need to be explored.
The Galleria mellonella larva infection model has been used in the study of various infections and related virulence. The larvae can be easily and inexpensively obtained in large numbers.36,37 Although insects lack an adaptive immune response, their innate immune response shows remarkable similarities with the immune response in vertebrates.38,39 Interestingly, fosfomycin alone and combined showed more effective bactericidal activity than in vitro for fosfomycin-resistant strain. It is speculated that this phenomenon may be due to the immunomodulatory effect of fosfomycin by changing the function of lymphocytes, monocytes and neutrophils, so that fosfomycin has immunomodulatory effect on the greater Cerobod.40,41 At the same time, as a rapid fungicide, high concentration administration of fosfomycin may be one of the reasons for improving survival rate.42 The Galleria mellonella larva infection model results were partly in accord with the results of in vitro and might preliminarily predict clinical outcomes.
In conclusion, linezolid combined with fosfomycin remains a potentially beneficial combination for the treatment of S. aureus infection. However, the experimental results showed that compared with linezolid, the sensitivity of the strains to fosfomycin had a powerful impact on the therapeutic effect of the combination. Therefore, more attention should be paid to the sensitivity of fosfomycin in the combination of antibiotics to improve the therapeutic effect and reduce toxicity.
Acknowledgments
This study was supported by the National Natural Science Fund of China (0601021203); the Fund of Excellent Talents in Colleges and Universities of Anhui Province, China (gxbjZD06); and the Fund of Academic Leaders of Anhui Province, China (2015D068); Center for Scientific Research of Anhui Medical University
Disclosure
The authors report no conflicts of interest in this work.
References
1. Welte T, Kantecki M, Stone GG, Hammond J. Ceftaroline fosamil as a potential treatment option for Staphylococcus aureus community-acquired pneumonia in adults. Int J Antimicrob Agents. 2019;54(4):410–422. doi:10.1016/j.ijantimicag.2019.08.012
2. van Hal SJ, Jensen SO, Vaska VL, Espedido BA, Paterson DL, Gosbell IB. Predictors of mortality in Staphylococcus aureus bacteremia. Clin Microbiol Rev. 2012;25(2):362–386.
3. Azhar A, Rasool S, Haque A, et al. Detection of high levels of resistance to linezolid and vancomycin in Staphylococcus aureus. J Med Microbiol. 2017;66(9):1328–1331. doi:10.1099/jmm.0.000566
4. Khurana S, Mathur P, Malhotra R. Staphylococcus aureus at an Indian tertiary hospital: antimicrobial susceptibility and minimum inhibitory concentration (MIC) creep of antimicrobial agents. J Glob Antimicrob Resist. 2019;17:98–102. doi:10.1016/j.jgar.2018.10.021
5. Tong S, Hal S, Davis J. Combination antibiotic treatment of serious methicillin-resistant Staphylococcus aureus infections. Semin Respir Crit Care Med. 2015;36(01):003–016. doi:10.1055/s-0034-1396906
6. Chai D, Liu X, Wang R, Bai Y, Cai Y. Efficacy of linezolid and fosfomycin in catheter-related biofilm infection caused by methicillin-resistant Staphylococcus aureus. Biomed Res Int. 2016;2016:1–7. doi:10.1155/2016/6413982
7. Li L, Chen H, Liu Y, et al. Synergistic effect of linezolid with fosfomycin against Staphylococcus aureus in vitro and in an experimental Galleria mellonella model. J Microbiol Immunol Infect. 2020;53(5):731–738.
8. Chen H, Li L, Liu Y, et al. In vitro activity and post-antibiotic effects of linezolid in combination with fosfomycin against clinical isolates of Staphylococcus aureus. Infect Drug Resist. 2018;11:2107–2115. doi:10.2147/IDR.S175978
9. Zheng JX, Sun X, Lin ZW, et al. In vitro activities of daptomycin combined with fosfomycin or rifampin on planktonic and adherent linezolid-resistant isolates of Enterococcus faecalis. J Med Microbiol. 2019;68(3):493–502. doi:10.1099/jmm.0.000945
10. Falagas MERN, Gkegkes ID, Rafailidis PI, Karageorgopoulos DE. Fosfomycin for the treatment of infections caused by Gram-positive cocci with advanced antimicrobial drug resistance: a review of microbiological, animal and clinical studies. Expert Opin Investig Drugs. 2009;18(7):921–944. doi:10.1517/13543780902967624
11. Falagas MEVE, Samonis G, Vardakas KZ. Fosfomycin. Clin Microbiol Rev. 2016;29(2):321–347. doi:10.1128/CMR.00068-15
12. Sastry S, Doi Y. Fosfomycin: resurgence of an old companion. J Infect Chemother. 2016;22(5):273–280. doi:10.1016/j.jiac.2016.01.010
13. Zahedi Bialvaei A, Rahbar M, Yousefi M, Asgharzadeh M, Samadi Kafil H. Linezolid: a promising option in the treatment of Gram-positives. J Antimicrob Chemother. 2017;72(2):354–364. doi:10.1093/jac/dkw450
14. Stefani S, Bongiorno D, Mongelli G, Campanile F. Linezolid resistance in Staphylococci. Pharmaceuticals. 2010;3(7):1988–2006. doi:10.3390/ph3071988
15. Wu D, Chen Y, Sun L, Qu T, Wang H, Yu Y. Prevalence of fosfomycin resistance in methicillin-resistant Staphylococcus aureus isolated from patients in a university hospital in china from 2013 to 2015. Jpn J Infect Dis. 2018;71(4):312–314. doi:10.7883/yoken.JJID.2018.013
16. Yoo IY, Kang O-K, Shim HJ, Huh HJ, Lee NY. Linezolid resistance in methicillin-resistant Staphylococcus aureus in Korea: high rate of false resistance to linezolid by the VITEK 2 system. Ann Lab Med. 2020;40(1):57–62. doi:10.3343/alm.2020.40.1.57
17. Becker K, Fu Z, Liu Y, et al. Characterization of fosfomycin resistance gene, fosB, in methicillin-resistant Staphylococcus aureus isolates. PLoS One. 2016;11(5).
18. Institute. CaLS. Performance Standards for Antimicrobial Susceptibility Testing.
19. Billal DSFD, Fedorko DP, Yan SS, et al. In vitro induction and selection of fluoroquinolone-resistant mutants of Streptococcus pyogenes strains with multiple emm types. J Antimicrob Chemother. 2006;59(1):28–34. doi:10.1093/jac/dkl428
20. Cazares-Dominguez V, Ochoa SA, Cruz-Cordova A, et al. Vancomycin modifies the expression of the agr system in multidrug-resistant Staphylococcus aureus clinical isolates. Front Microbiol. 2015;6:369. doi:10.3389/fmicb.2015.00369
21. Chin JN, Jones RN, Sader HS, Savage PB, Rybak MJ. Potential synergy activity of the novel ceragenin, CSA-13, against clinical isolates of Pseudomonas aeruginosa, including multidrug-resistant P. aeruginosa. J Antimicrob Chemother. 2007;61(2):365–370. doi:10.1093/jac/dkm457
22. W C, S. G. The postantibiotic effect. In: Lorian V, editor. Antibiotics in Laboratory Medicine. 1996:296–329.
23. Luther MK, Arvanitis M, Mylonakis E, LaPlante KL. Activity of daptomycin or linezolid in combination with rifampin or gentamicin against biofilm-forming enterococcus faecalis or E. faecium in an in vitropharmacodynamic model using simulated endocardial vegetations and an in vivo survival assay using Galleria mellonella larvae. Antimicrob Agents Chemother. 2014;58(8):4612–4620. doi:10.1128/AAC.02790-13
24. Craig W. Pharmacokinetic/pharmacodynamic parameters: rationale for antibacterial dosing of mice and men. Clin Infect Dis. 1998;26(1):1–10. doi:10.1086/516284
25. Saravolatz LD, Pawlak J, Martin H, et al. Postantibiotic effect and postantibiotic sub-MIC effect of LTX-109 and mupirocin on Staphylococcus aureus blood isolates. Lett Appl Microbiol. 2017;65(5):410–413. doi:10.1111/lam.12792
26. Odenholt I, Lowdin E, Cars O. Postantibiotic, postantibiotic sub-MIC, and subinhibitory effects of PGE-9509924, ciprofloxacin, and levofloxacin. Antimicrob Agents Chemother. 2003;47(10):3352–3356. doi:10.1128/AAC.47.10.3352-3356.2003
27. Colombo Gainza E, Gil Brusola A, Ortiz Estévez R, Cantón E, Gobernado M. In vitro activity of linezolid in combination with doxycycline, fosfomycin, levofloxacin, rifampicin and vancomycin against methicillin-susceptible Staphylococcus aureus. Rev Esp Quimioter. 2006;19(3):252–257.
28. Srimani JK, Huang S, Lopatkin AJ, You L. Drug detoxification dynamics explain the postantibiotic effect. Mol Syst Biol. 2017;13(10):948. doi:10.15252/msb.20177723
29. Fish DN. Synergic activity of cephalosporins plus fluoroquinolones against Pseudomonas aeruginosa with resistance to one or both drugs. J Antimicrob Chemother. 2002;50(6):1045–1049. doi:10.1093/jac/dkf211
30. Falagas ME, Athanasaki F, Voulgaris GL, Triarides NA, Vardakas KZ. Resistance to fosfomycin: mechanisms, frequency and clinical consequences. Int J Antimicrob Agents. 2019;53(1):22–28. doi:10.1016/j.ijantimicag.2018.09.013
31. Candel FJ, David MM, López JB. New perspectives for reassessing fosfomycin: applicability in current clinical practice. Rev Esp Quimioter. 2019;32 Suppl 1(Suppl1):1–7.
32. Hashemian SM, Farhadi T, Ganjparvar M. Linezolid: a review of its properties, function, and use in critical care. Drug Des Devel Ther. 2018;12:1759–1767. doi:10.2147/DDDT.S164515
33. Planet PJ, Cázares-Domínguez V, Cruz-Córdova A, et al. Vancomycin tolerant, methicillin-resistant Staphylococcus aureus reveals the effects of vancomycin on cell wall thickening. PLoS One. 2015;10(3):e0118791.
34. Ledala N, Wilkinson B, Jayaswal R. Effects of oxacillin and tetracycline on autolysis, autolysin processing and atl transcription in Staphylococcus aureus. Int J Antimicrob Agents. 2006;27(6):518–524. doi:10.1016/j.ijantimicag.2006.03.008
35. García AB, Viñuela Prieto JM, Lopez González L, Candel FJ. Correlation between resistance mechanisms in Staphylococcus aureus and cell wall and septum thickening. Infect Drug Resist. 2017;10:353–356. doi:10.2147/IDR.S146748
36. Tsai CJY, Loh JMS, Proft T. Galleria mellonella infection models for the study of bacterial diseases and for antimicrobial drug testing. Virulence. 2016;7(3):214–229. doi:10.1080/21505594.2015.1135289
37. Cook SM, McArthur JD. Developing Galleria mellonella as a model host for human pathogens. Virulence. 2013;4(5):350–353. doi:10.4161/viru.25240
38. Wojda I. Immunity of the greater wax moth Galleria mellonella. Insect Sci. 2017;24(3):342–357. doi:10.1111/1744-7917.12325
39. Kavanagh K, Sheehan G. The use of galleria mellonella larvae to identify novel antimicrobial agents against fungal species of medical interest. J Fungi. 2018;4(3):113. doi:10.3390/jof4030113
40. Sauermann R, Marsik C, Steiner I, et al. Immunomodulatory effects of fosfomycin in experimental human endotoxemia. Antimicrob Agents Chemother. 2007;51(5):1879–1881. doi:10.1128/AAC.00914-06
41. Kupferschmidt K. Resistance fighters. Science. 2016;352(6287):758–761. doi:10.1126/science.352.6287.758
42. Raz R. Fosfomycin: an old–new antibiotic. Clin Microbiol Infect. 2012;18(1):4–7. doi:10.1111/j.1469-0691.2011.03636.x
 © 2021 The Author(s). This work is published and licensed by Dove Medical Press Limited. The full terms of this license are available at https://www.dovepress.com/terms.php and incorporate the Creative Commons Attribution - Non Commercial (unported, v3.0) License.
By accessing the work you hereby accept the Terms. Non-commercial uses of the work are permitted without any further permission from Dove Medical Press Limited, provided the work is properly attributed. For permission for commercial use of this work, please see paragraphs 4.2 and 5 of our Terms.
© 2021 The Author(s). This work is published and licensed by Dove Medical Press Limited. The full terms of this license are available at https://www.dovepress.com/terms.php and incorporate the Creative Commons Attribution - Non Commercial (unported, v3.0) License.
By accessing the work you hereby accept the Terms. Non-commercial uses of the work are permitted without any further permission from Dove Medical Press Limited, provided the work is properly attributed. For permission for commercial use of this work, please see paragraphs 4.2 and 5 of our Terms.