")
Back to Journals » Infection and Drug Resistance » Volume 11
In vitro activity and post-antibiotic effects of linezolid in combination with fosfomycin against clinical isolates of Staphylococcus aureus
Authors Chen H, Li L, Liu Y, Wu M, Xu S, Zhang G, Qi C, Du Y, Wang M, Li J, Huang X
Received 2 June 2018
Accepted for publication 24 August 2018
Published 1 November 2018 Volume 2018:11 Pages 2107—2115
DOI https://doi.org/10.2147/IDR.S175978
Checked for plagiarism Yes
Review by Single anonymous peer review
Peer reviewer comments 3
Editor who approved publication: Dr Sahil Khanna
Hao Chen,1–3,* Lan Li,2,3,* Yanyan Liu,4 Maomao Wu,2,3 Shuangli Xu,2,3 Guijun Zhang,2,3 Caifen Qi,2,3 Yan Du,2,3 Mingli Wang,5 Jiabin Li,4 Xiaohui Huang2,3
1Department of Pharmacy, The First Affiliated Hospital of Anhui Medical University, Hefei, Anhui, China; 2Department of Basic and Clinical Pharmacology, School of Pharmacy, Anhui Medical University, Hefei, Anhui, China; 3Anhui Institute of Innovative Drugs, School of Pharmacy, Anhui Medical University, Hefei, Anhui, China; 4Department of Infectious Diseases, The First Affiliated Hospital of Anhui Medical University, Hefei, Anhui, China; 5Department of Microbiology, Anhui Medical University, Hefei, Anhui, China
*These authors contributed equally to this work
Objectives: Linezolid combination therapy is recommended for the treatment of Staphylococcus aureus (S. aureus) infections. However, the optimal regimen of the combination therapy for S. aureus is unknown. The objective of this study was to investigate the antibacterial activity, post-antibiotic effect (PAE), and post-antibiotic subminimum inhibitory concentration (MIC) effect (PA-SME) of linezolid alone and in combination with fosfomycin against eleven clinical isolates of S. aureus.
Methods: The synergistic effects and antibacterial activity of linezolid and fosfomycin were assessed by checkerboard and time-kill assays. To determine the PAE and PA-SME, S. aureus strains in the logarithmic phase of growth were exposed for 1, 2, and 3 hours to the antibiotics, alone and in combination. Recovery periods of test strains were evaluated using viable counting after dilution.
Results: Synergistic effects were observed for eight strains and no antagonism was found with any combination. Moreover, linezolid combined with fosfomycin at 4x MIC showed the best synergistic antibacterial effect, and this effect was retained after 24 hours. In addition, both the antibiotics alone and in combination showed increased PAE and PA-SME values in a concentration- and time-dependent manner.
Conclusion: Linezolid combined with fosfomycin exerted a good antibacterial effect against S. aureus, and the combinations have significant PAE and PA-SME.
Keywords: linezolid, fosfomycin, PAE, PA-SME, combination
Introduction
Staphylococcus aureus (S. aureus) represents a predominant pathogen associated with serious infections, including pneumonia, bacteremia, skin and soft tissue infection, etc. However, the treatment options available against infectious diseases are becoming increasingly limited due to a rising incidence of antibiotic resistance.1 Therefore, new treatment regimens have become an urgent priority.
Linezolid has been widely used in the treatment of staphylococcal skin and soft tissue infections, pneumonia, etc in recent years.2,3 However, some limitations of linezolid monotherapy have been reported. For example, several studies reported that critically ill patients who receive linezolid alone still show treatment failure even though these strains are sensitive to linezolid.4,5 In addition, because of relatively high dose used in difficult-to-treat infections, which might lead to linezolid-associated adverse drug reactions and the development of resistance during linezolid therapy,6 the use of a combination strategy may be a good approach. Several previous studies have evaluated the potential for synergy between linezolid and fosfomycin in vitro and in vivo.7–9 However, further investigation is necessary to support the use of this combination because of very limited number of trials. In addition, the optimal regimen of the combination therapy has also been rarely studied.
Post-antibiotic effect (PAE) is defined as the persistent suppression of bacterial growth after short antimicrobial agent exposure.10 Moreover, during the PAE period, bacterial growth would be further suppressed when subinhibitory concentrations of drug was added, which is defined as post-antibiotic subminimum inhibitory concentration (MIC) effect (PA-SME).11 The clinical significance of these investigations is that drug alone or combinations that produce a long PAE and PA-SME may be important pharmacodynamic parameters for designing longer dosing intervals, reducing adverse effects, and lowering costs.12,13 Moreover, better knowledge of antimicrobial interactions, PAE, PA-SME, and whether commonly used antimicrobial agents exert concentration- or time-dependent effects would also provide a more rational basis for optimizing dosage regimens.
Thus far, most studies have focused on the PAE of fluoroquinolones and aminoglycosides,14–16 and few data are available on the PAE and PA-SME of linezolid combination therapy. Therefore, the objective of the present study was to investigate in vitro activities, PAE, and PA-SME of linezolid alone and in combination with fosfomycin against S. aureus, and thus provide important basis for developing new regimens to treat patients with S. aureus infections.
Materials and methods
Strains and agents
Clinical strains of S. aureus isolated from blood, sputum, and throat secretion specimens between January and June 2017 were obtained from the First Affiliated Hospital of Anhui Medical University. The test strains included five methicillin-resistant S. aureus (MRSA; No. 64, 36, 24, 54, and 78) and five methicillin-susceptible S. aureus (MSSA; No. 8, 27, 14, 35, and 55). All strains were identified by the automated VITEK-2 system (BioMerieux, Marcy l’Etoile, France). S. aureus ATCC 25923 was used as the quality control strain. In addition, these strains were not specifically isolated for this research but were part of the routine hospital laboratory procedure. Linezolid and fosfomycin were purchased from the National Institute for Food and Drug Control of China (Beijing, China).
Determination of MIC and minimum bactericidal concentration (MBC)
For each strain, MIC and MBC were determined by the broth microdilution method according to the Clinical and Laboratory Standards Institute standard methods.17 Twofold dilutions of antibiotics and a final bacterial inoculum of 5×10⁵ colony-forming units (CFU)/mL were placed in each well. The range of concentrations was 128–0.125 mg/L for both antibiotics. All MIC and MBC determinations were performed in triplicate for each strain. MIC was defined as the minimum antibiotic concentration with no bacterial growth after 24 hours of incubation at 37°C. MBC was determined after the MIC assay. Briefly, 0.1 mL of bacterial suspension from the 96-well plates with no visible growth was cultured on Mueller–Hinton agar (MHA) in order to determine MBC. The plates were incubated at 37°C for 24 hours. MBC was defined as the lowest concentration of antibiotic that reduces the viable counts by 99.9%.
Checkerboard assays
Synergy of antibiotics was evaluated using the checkerboard assays.9 In brief, 96-well plates were set up with increasing concentrations of linezolid in the horizontal wells and fosfomycin in the vertical wells. Each well was inoculated with 5×10⁵ CFU/mL bacterial suspension. The plates were incubated at 37°C for 24 hours and visually inspected for turbidity to determine the growth. All experiments were performed in triplicate. The synergy interactions were assessed by fractional inhibitory concentration index (FICI), calculated as follows: FICI = (MIC of drug A combination/MIC of drug A alone) + (MIC of drug B combination/MIC of drug B alone). FICI was defined as follows: FICI ≤0.5, synergy; 0.5< FICI ≤4.0, indifference; FICI >4.0, antagonism.18
Time-kill assays
Time-kill experiments were performed on S. aureus ATCC 25923, No. 36, and No. 8 strains according to the synergy results of the checkerboard method. An inoculum of approximately 1.5×10⁵ CFU/mL was used for each strain. The concentrations of antibiotics were selected according to the MICs and the achievable levels in human serum. In brief, the concentrations of linezolid and fosfomycin were adjusted to 1/2x, 1x, 2x, and 4x MIC. Each concentration was tested in combination for time-kill curve assays. Bacterial counts were done at 0, 2, 4, 8, 12, and 24 hours by spreading tenfold serial dilutions onto MHA plates. All experiments described above were repeated three times. Synergistic effect was defined as more than 2 log10 CFU/mL decrease at 24 hours for the antimicrobial combination compared with that for the most active single agent.
Determination of PAE and PA-SME
PAE was determined by the method of Craig and Gudmundsson.19 The testing strains were cultured in MHA at 37°C to the log phase of growth to produce a final inoculum of 1.5×10⁶ CFU/mL. The organisms were exposed to concentrations of linezolid and fosfomycin equal to 1x or 4x MIC, alone and in combination. Growth controls were simultaneously inoculated without antibiotics. Tubes were placed in a 37°C shaker for 1, 2, and 3 hours. At the end of the exposure period, the antibiotics were removed by diluting 1:103 with sterile broth. Controls were handled similarly. After dilution of the antibiotics, the tube contents were incubated at 37°C until turbidity developed (6–12 hours). Bacterial counts were determined at 0, 1, 2, 4, 6, 8, and 12 hours after dilution. PAE was calculated as follows: PAE = T–C, where T is the time required for the viable counts in the test culture to increase 1 log10 above the count observed immediately after dilution and C is the corresponding time for the antibiotic unexposed controls. All experiments were performed in triplicate.
To induce PA-SME, the logarithmic phase organisms (approximately 1.5×10⁶ CFU/mL) were exposed to concentration of linezolid and fosfomycin equal to 4x MIC, alone and in combination. After incubation at 37°C for 2 hours, the drugs were removed, and 0.1x, 0.2x, and 0.4x MIC of drugs were added into each of the culture tubes. Viable bacteria were determined as described in the Determination of PAE and PA-SME section on PAE experiment. PA-SME was defined as follows: PA-SME= TPA–C, where TPA is the time for the cultures previously exposed to the linezolid alone and in combination, which thereafter had been exposed to different sub-MICs, to increase by 1 log10 unit above the counts observed immediately after dilution and C is the corresponding time for the unexposed controls, which thereafter had been exposed to different sub-MICs.
Statistical analysis
Statistical analysis was performed with SPSS 16.0. One-way ANOVA was performed to assess the change of each antibiotic concentration, alone or in combination. In the results, P<0.05 was considered to be significant.
Results
MICs, MBCs, and synergy studies
The MICs, MBCs, and FICI of the tested antimicrobial agents are summarized in Table 1. The MICs of linezolid against S. aureus ATCC 25923 and ten clinical strains were from 1 to 4 mg/L, while that of fosfomycin were 2 mg/L. The MBCs of linezolid were almost the same or lower than that of fosfomycin. In addition, the results of MBC/MIC ratios indicated that these strains were not resistant to linezolid and fosfomycin.
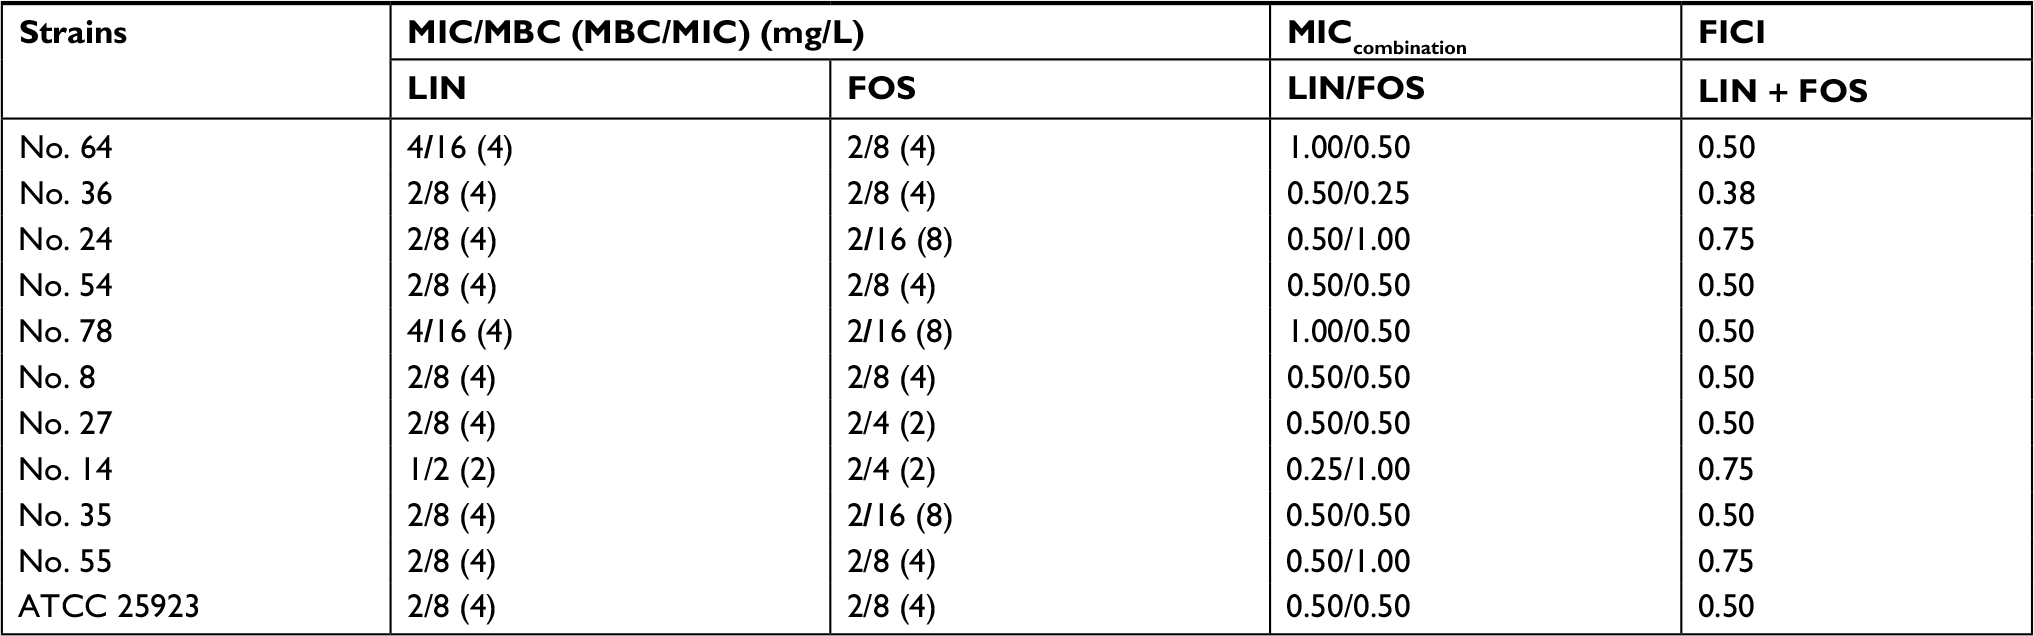 | Table 1 MIC and MBC of antimicrobial agents against eleven strains of S. aureus Note: FICI was defined as follows: FICI ≤0.5, synergy; 0.5< FICI ≤4.0, indifference; FICI >4.0, antagonism. Abbreviations: FICI, Fractional Inhibitory Concentration Index; FOS, fosfomycin; LIN, linezolid; MBC, minimum bactericidal concentration; MIC, minimum inhibitory concentration; S. aureus, Staphylococcus aureus. |
Synergy testing was first assessed using the checkerboard method. The results indicated synergism between linezolid and fosfomycin for all tested strains, except for No. 24, 14, and 55 strains. To further confirm the synergistic activity and better knowledge of antimicrobial interactions, time-kill experiments were performed. As shown in Figures 1 and S1, all the combination groups had significantly reduced bacterial counts at 24-hour time point compared to either linezolid or fosfomycin alone (P<0.05). In addition, all the combination groups exhibited synergistic effect, achieving a 2–3 log10 CFU/mL decrease compared with that of the most active single drug.
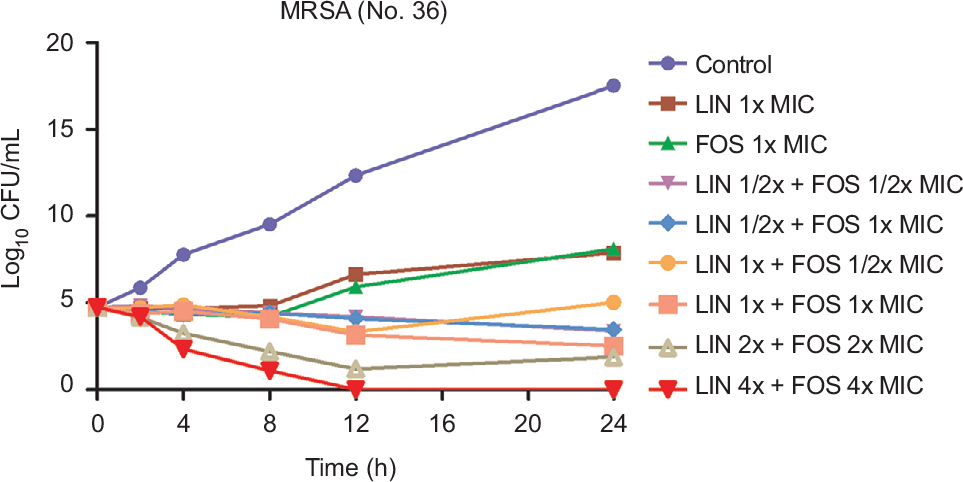 | Figure 1 Time-kill curves of linezolid plus fosfomycin against MRSA (No.36). Abbreviations: CFU, colony-forming units; FOS, fosfomycin; LIN, linezolid; MRSA, methicillin-resistant Staphylococcus aureus; MIC, minimum inhibitory concentration. |
Determination of PAE and PA-SME
The mean values and regrowth curves of PAE (±SD) in hours for the three strains are displayed in Tables 2–4 and Figures 2 and S2, respectively. Both the antibiotics alone and in combination showed increased PAE values in a concentration-dependent manner. On the other hand, although no statistically significant difference was found, the PAE of linezolid alone and in combination with fosfomycin was increased with the increase in the time of exposure (P>0.05). The PAE values are shown in Tables 2–4. The results (Table 5) revealed that the values of PA-SME were also proportional to the concentrations of antibiotics. Moreover, PA-SME was longer than PAE. The bacterial counts changes including PA-SME, PAE, and time-kill experiments are shown in Table 6.
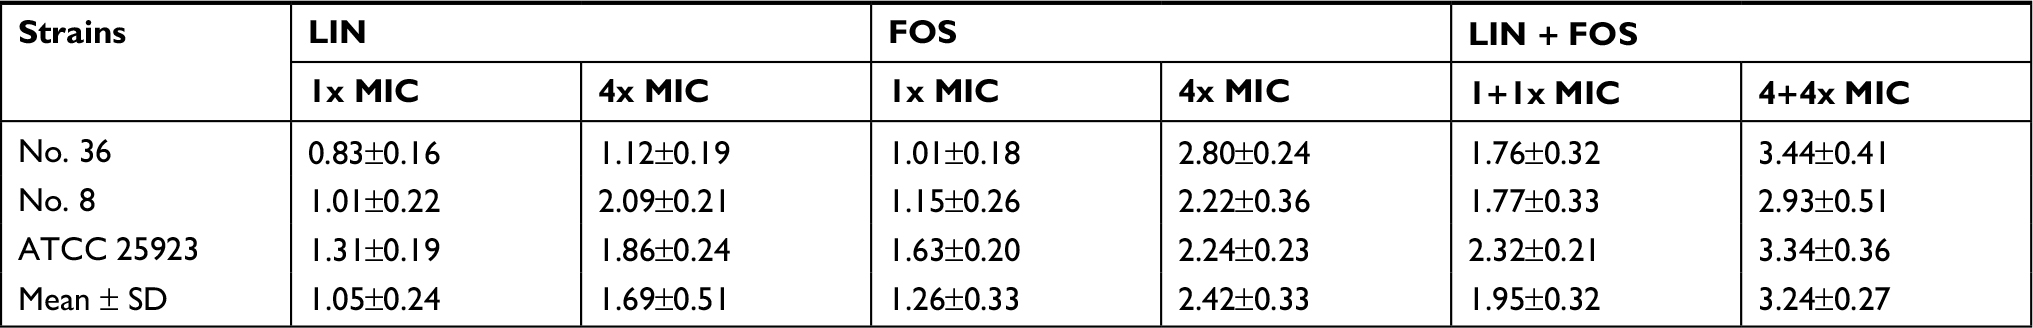 | Table 2 PAE (h) of linezolid plus fosfomycin exposure for 1 hour against three S. aureus strains Note: Mean ± SD represents the mean PAE and SDs of three S. aureus strains at each drug concentration. Abbreviations: FOS, fosfomycin; LIN, linezolid; MIC, minimum inhibitory concentration; PAE, post-antibiotic effect; S. aureus, Staphylococcus aureus. |
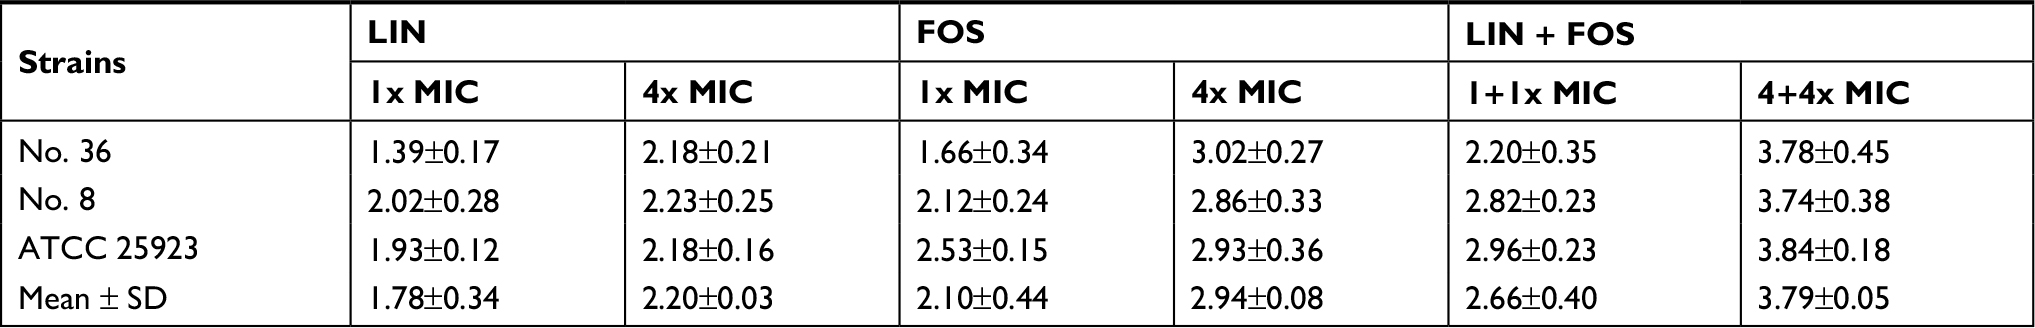 | Table 3 PAE (h) of linezolid plus fosfomycin exposure for 2 hours against three S. aureus strains Abbreviations: FOS, fosfomycin; LIN, linezolid; MIC, minimum inhibitory concentration; PAE, post-antibiotic effect; S. aureus, Staphylococcus aureus. |
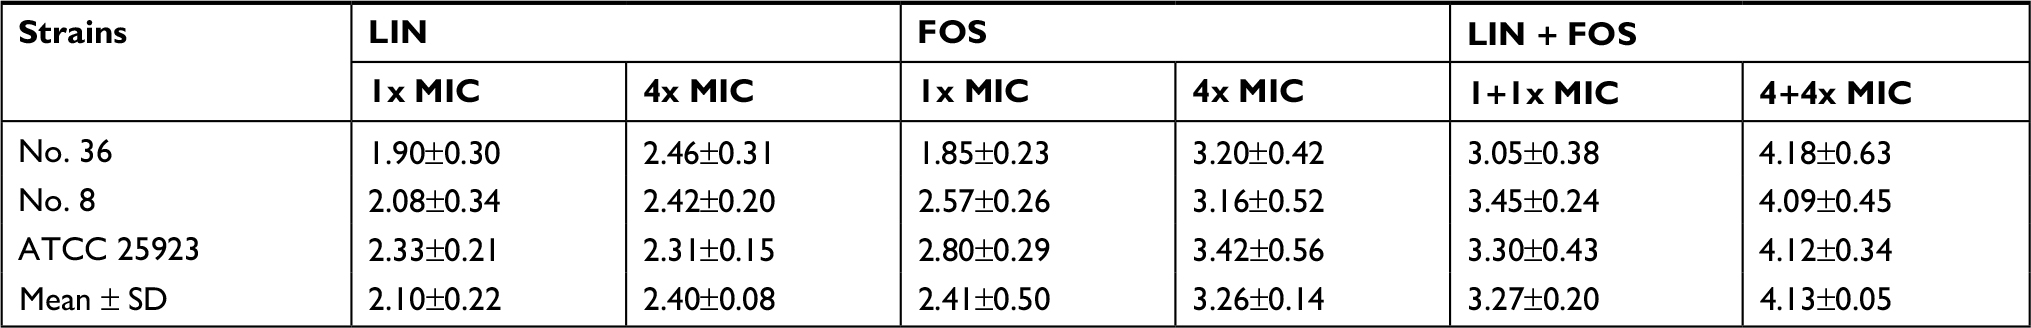 | Table 4 PAE (h) of linezolid plus fosfomycin exposure for 3 hours against three S. aureus strains Abbreviations: FOS, fosfomycin; LIN, linezolid; MIC, minimum inhibitory concentration; PAE, post-antibiotic effect; S. aureus, Staphylococcus aureus. |
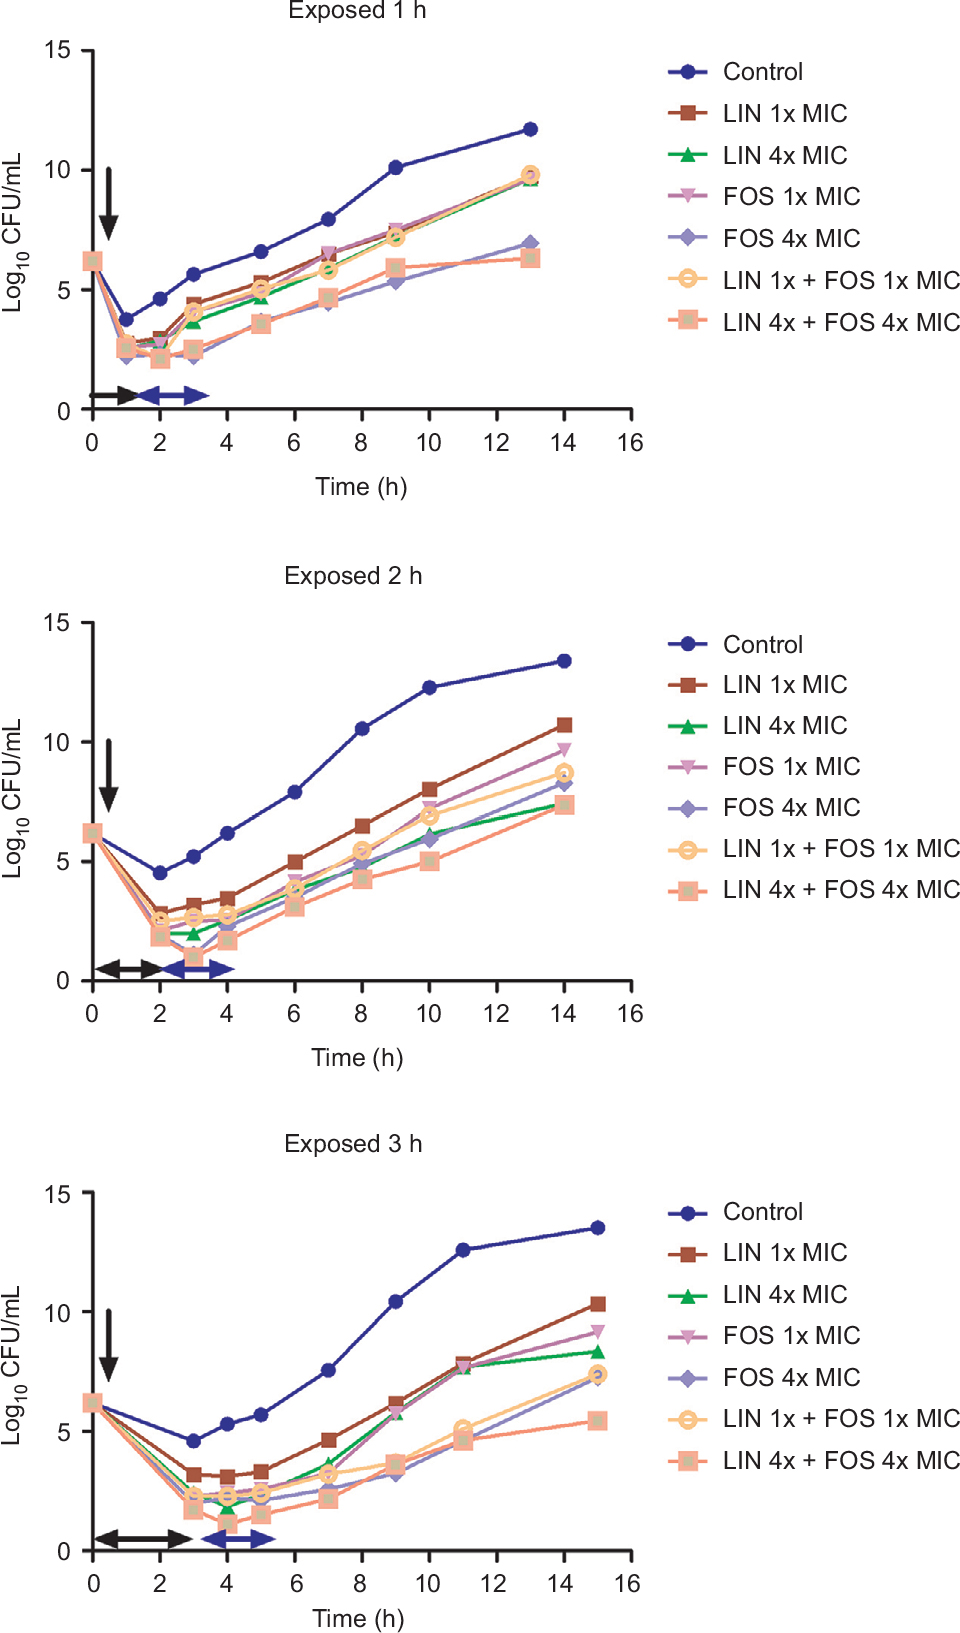 | Figure 2 Regrowth curves of MRSA (No.36) strains exposed to linezolid plus fosfomycin for 1, 2, and 3 hours. Notes: Timings of antibiotics addition, removal, and the duration of exposure are indicated by a vertical black arrow, a horizontal blue arrow, and a horizontal black arrow, respectively. Abbreviations: CFU, colony-forming units; FOS, fosfomycin; LIN, linezolid; MRSA, methicillin-resistant Staphylococcus aureus; MIC, minimum inhibitory concentration. |
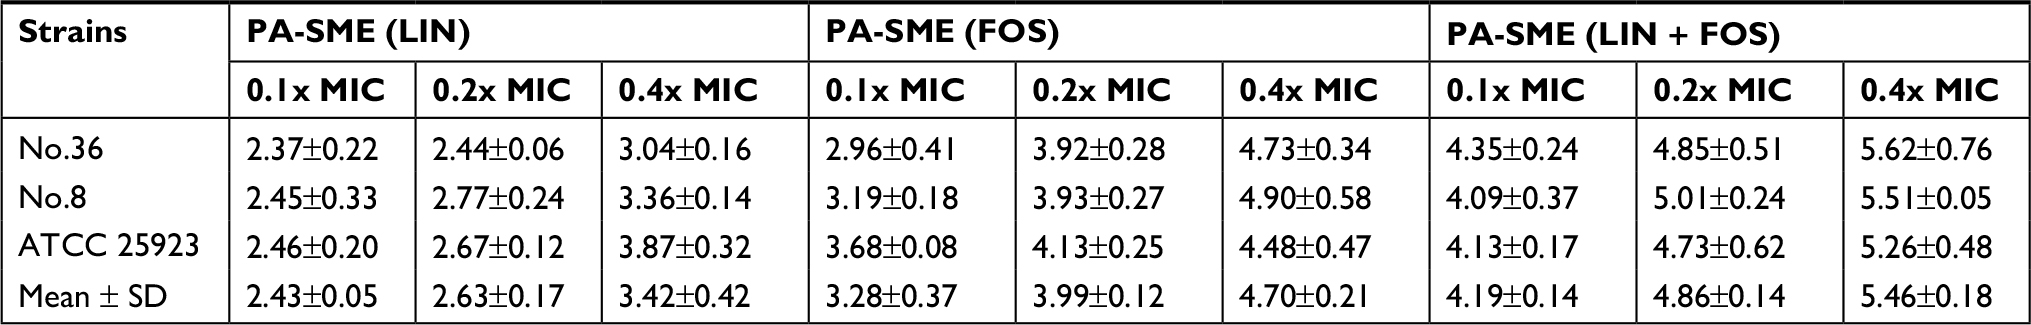 | Table 5 PA-SME (h) of linezolid plus fosfomycin at 4x MIC exposure for 2 hours against three S. aureus strains Notes: Mean ± SD represents the mean PAE and SDs of three S. aureus strains at each drug concentration. Abbreviations: FOS, fosfomycin; LIN, linezolid; MIC, minimum inhibitory concentration; PA-SME, post-antibiotic sub-MIC effect; S. aureus, Staphylococcus aureus. |
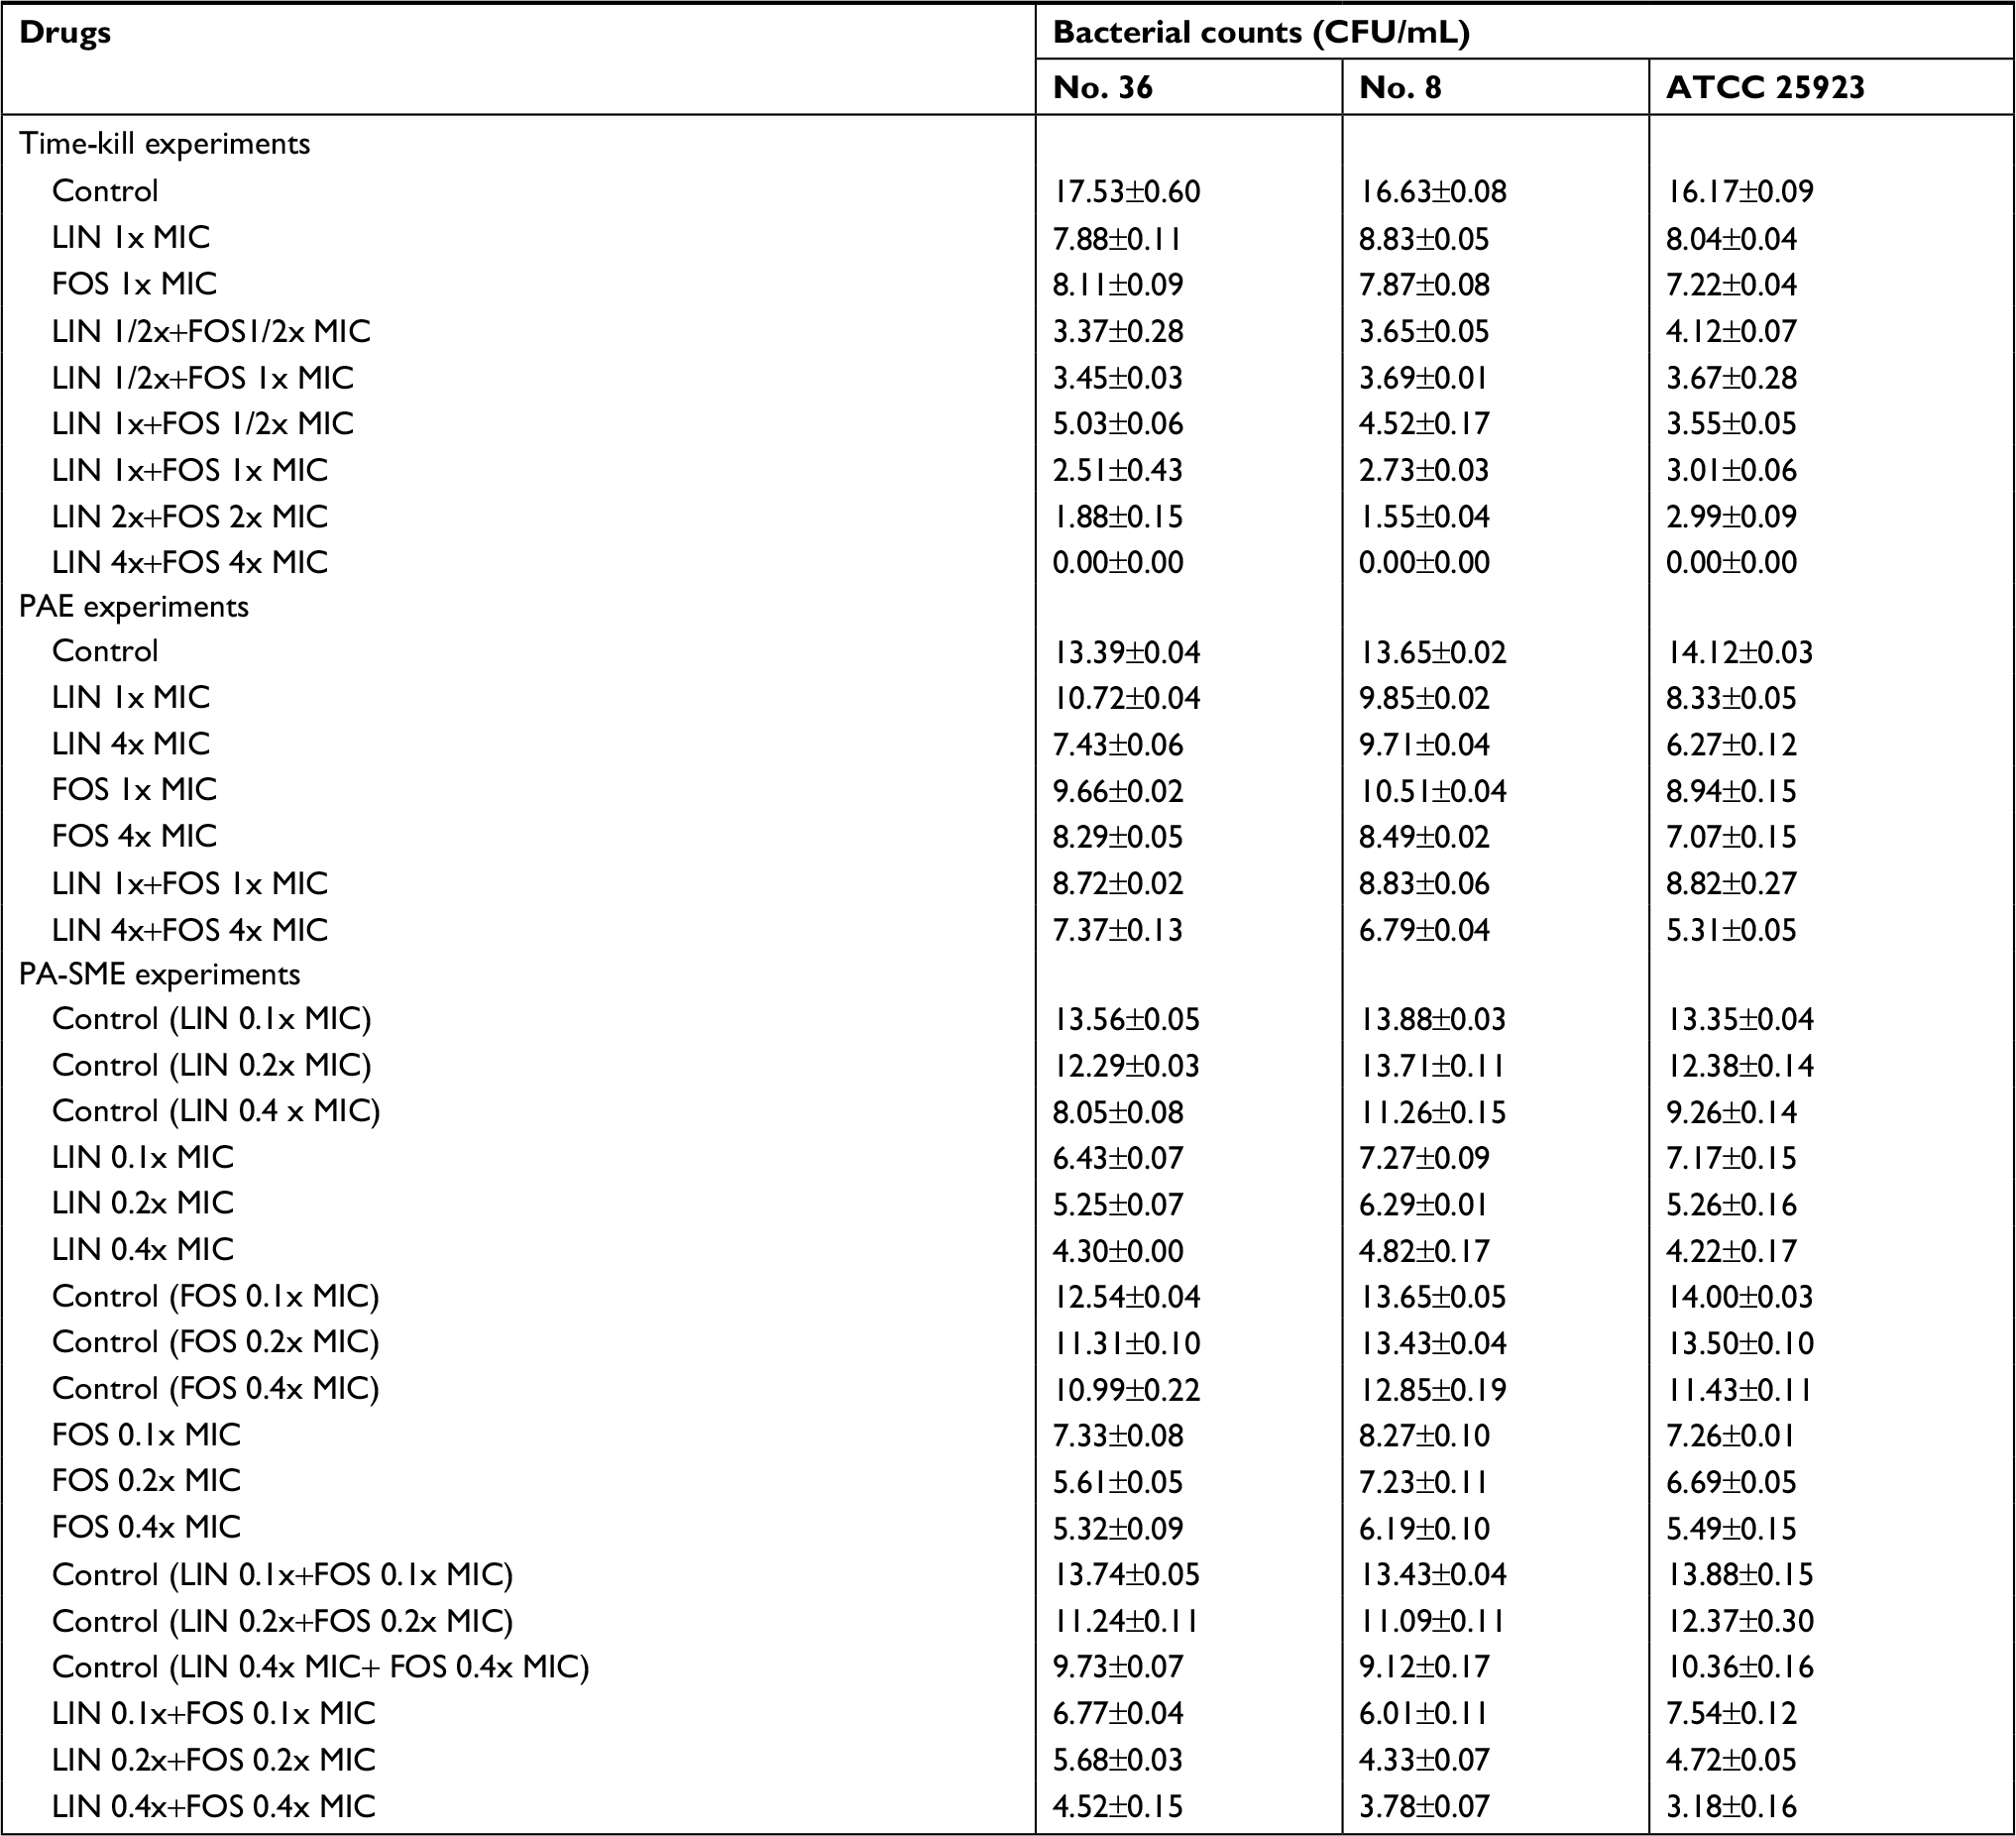 | Table 6 Bacterial count changes of the three strains after 24 hours (time-kill experiments) and 12 hours (PAE and PA-SME experiments) of exposure to linezolid alone or combination fosfomycin compared to the viable bacterial counts with control Note: All data are presented as mean ± SD. Abbreviations: CFU, colony-forming units; FOS, fosfomycin; LIN, linezolid; MIC, minimum inhibitory concentration; PAE, post-antibiotic effect; PA-SME, post-antibiotic sub-MIC effect. |
Discussion
In this study, the results of the chequerboard analysis indicated synergism between linezolid and fosfomycin in eight of eleven strains and no antagonism was found with any combination. Sahuquillo Arce et al reported FICI values ranging from 0.375 to 0.75 for linezolid-fosfomycin combination displayed synergistic effect against 80% tested strains,20 while Chai et al obtained FICI values of 0.375–0.5 with the same combination for S. aureus.7 In our study, synergistic results were observed for all strains except No.24, 14, and 55 strains with FICI values ranging from 0.375 to 0.75. We hypothesized that the no synergistic strains (No.24, 14, and 55) may be attributable to difference among bacterial species and strains. In the time-kill experiment, we tested different concentrations of combinations of drugs and found that linezolid and fosfomycin alone at 1x MIC have a poor antibacterial effect on S. aureus. Notably, fosfomycin at 1x MIC was more effective than linezolid against both MSSA and MRSA strains. It is possible that fosfomycin is a broad-spectrum bactericidal drug, while linezolid showed bacteriostatic activity at lower concentrations, as previously reported.20–22 However, rapid bacterial regrowth occurred after 12 hours of exposure to fosfomycin alone in the time-kill curves, possibly due to the selection of spontaneous mutants.20 Therefore, we recommend that fosfomycin should not be used alone due to the frequent development of resistance. On the other hand, we also found no significant increased effect of increasing antibiotic concentrations except for linezolid plus fosfomycin at 4x MIC. This may be attributable to the finding that the MBC of two drugs was 4x MIC; thus, the combination of the two drugs at 4x MIC showed the best synergistic antibacterial effect. The combination of both drugs showed a synergistic antibacterial effect. The following potential mechanism is proposed to explain why the combination of linezolid and fosfomycin can inhibit S. aureus growth. It is reported that fosfomycin can destroy the outer layer of bacterial cells and thus inhibit the first step of cell wall synthesis. As a result, linezolid can easily enter the bacterial cell and act synergistically with fosfomycin.23 A particularly interesting finding in our study is that the antibacterial effect of drugs in combination at low concentrations such as 1/2x MIC was significantly better than the effect when they were used alone at 1x MIC. This may reduce adverse reactions caused by using high concentrations of drugs in clinical practice. Therefore, clinicians should consider the use of combination of drugs at low concentrations instead of drugs alone at high concentration in some cases.
On the other hand, our study also showed that the values of PAE of linezolid and fosfomycin were significantly increased in a concentration- and time-dependent manner. This will contribute to design dosing regimens in clinical practice. In addition, we have initially demonstrated that PAE increased in a concentration- and time-dependent manner. Therefore, the PA-SME was investigated by exposure to 4x MIC of linezolid alone and in combination for 2 hours. The results indicated that PA-SME was also prolonged in a concentration-dependent manner. In comparison with the contribution of PAE, PA-SME possibly reveals more useful clinical information as a period of subinhibitory concentrations would always exist in vivo, while the drug concentrations in plasma would be less than the MIC because of the process of elimination.24
The PAE of linezolid alone and in combination has been reported. For example, an in vitro study found that PAE was greater at 4x MIC (0.5–2.4 hours) than at 1x MIC for linezolid against S. aureus and Enterococcus faecalis strains.25 In another study on mice, the PAE of linezolid was determined to be 3.6–3.8 hours for MSSA strains.26 Notably, an in vitro study reported that for linezolid in combination with gatifloxacin and capreomycin at high concentrations against Mycobacterium tuberculosis, PAE was prolonged to 38.4 hours.27 Our results are very similar to those of previous studies and demonstrated that PA-SME was even more impressive considering this parameter may simulate in vivo drug exposure more accurately than PAE. In contrast, there are currently no data on the PAE and PA-SME of linezolid in combination with fosfomycin against S. aureus. Our results showed that the combination of antibiotics produces longer PAE than each antibiotic alone. Notably, the PAE values of drug alone at 4x MIC were very similar to those when drugs were used in combination at 1x MIC (P>0.05). However, when both antibiotics were used in combination at 4x MIC, PAE values were prolonged to the highest value. The results suggested that the PAE values change in a concentration-dependent manner of linezolid and fosfomycin not only when they were used alone but also when used in combination. From the clinical point of view, the prolongation of PAE with antibiotic combinations could provide important basis for optimizing dosage regimen and reducing adverse effects. Furthermore, combined therapy could prevent the development of resistance,28,29 which often occurs during fosfomycin monotherapy. On the basis of these potent advantages, the standard treatment regimen of linezolid is 600 mg/12 hours,30 whether the combination could be considered as a once-daily dosing regimen for S. aureus infections.31 However, a large number of clinical trials are required.
Although PAE is an important pharmacodynamic parameter and may provide useful clinical information for a dosage regimen, the mechanism is still uncertain. Several studies have reported that PAE can affect the growth kinetics, morphology, and physiological function of bacteria.32,33 Moreover, in vivo, leucocytes would also exert more bactericidal activity against the organism. This may partly explain why PAE of most antibiotics in vivo were longer than those in vitro.34,35 This study demonstrates the existence of PAE and PA-SME for linezolid plus fosfomycin against MSSA and MRSA strains, two of the most frequently used drug in clinical practice in China,36,37 thereby extending the pharmacodynamic advantages of these antibiotics against these infections.
Conclusion
Considering the potent and prolonged PAE activity of linezolid in combination with fosfomycin, this synergistic effect appears to offer important implications for developing new regimens and optimizing dosing interval in the treatment of S. aureus infections. Further pharmacokinetic and pharmacodynamic studies are necessary to confirm our results and to better predict the in vivo efficacy of the synergistic combinations.
Acknowledgments
This study was supported by the National Natural Science Fund of China (81173133); the Fund of Excellent Talents in Colleges and Universities of Anhui Province, China (gxbjZD06); and the Fund of Academic Leaders of Anhui Province, China (2015D068).
Disclosure
The authors report no conflicts of interest in this work.
References
Ventola CL. The antibiotic resistance crisis: part 1: causes and threats. P T. 2015;40(4):277–283. | ||
Li J, Zhao QH, Huang KC, et al. Linezolid vs. vancomycin in treatment of methicillin-resistant staphylococcus aureus infections: a meta-analysis. Eur Rev Med Pharmacol Sci. 2017;21(17):3974–3979. | ||
Álvarez-Lerma F, Muñoz-Bermúdez R, Samper-Sánchez MA, Gracia Arnilla MP, Grau S, Luque S. Successful treatment of Panton-Valentine leukocidin-positive methicillin-resistant Staphylococcus aureus pneumonia with high doses of linezolid administered in continuous infusion. Med Intensiva. 2017;41(1):56–59. Spanish. | ||
Rayner CR, Forrest A, Meagher AK, Birmingham MC, Schentag JJ. Clinical pharmacodynamics of linezolid in seriously ill patients treated in a compassionate use programme. Clin Pharmacokinet. 2003;42(15):1411–1423. | ||
Smith PF, Birmingham MC, Noskin GA, et al. Safety, efficacy and pharmacokinetics of linezolid for treatment of resistant Gram-positive infections in cancer patients with neutropenia. Ann Oncol. 2003;14(5):795–801. | ||
Natsumoto B, Yokota K, Omata F, Furukawa K. Risk factors for linezolid-associated thrombocytopenia in adult patients. Infection. 2014;42(6):1007–1012. | ||
Chai D, Liu X, Wang R, Bai Y, Cai Y. Efficacy of Linezolid and Fosfomycin in Catheter-Related Biofilm Infection Caused by Methicillin-Resistant Staphylococcus aureus. Biomed Res Int. 2016;2016:6413982. | ||
Pachón-Ibáñez ME, Ribes S, Domínguez MA, et al. Efficacy of fosfomycin and its combination with linezolid, vancomycin and imipenem in an experimental peritonitis model caused by a Staphylococcus aureus strain with reduced susceptibility to vancomycin. Eur J Clin Microbiol Infect Dis. 2011;30(1):89–95. | ||
Xu-Hong Y, Falagas ME, Dong W, Karageorgopoulos DE, de-Feng L, Rui W. In vitro activity of fosfomycin in combination with linezolid against clinical isolates of methicillin-resistant Staphylococcus aureus. J Antibiot (Tokyo). 2014;67(5):369–371. | ||
Bundtzen RW, Gerber AU, Cohn DL, Craig WA. Postantibiotic suppression of bacterial growth. Rev Infect Dis. 1981;3(1):28–37. | ||
Cars O, Odenholt-Tornqvist I. The post-antibiotic sub-MIC effect in vitro and in vivo. J Antimicrob Chemother. 1993;31(Suppl D):159–166. | ||
Craig WA. Pharmacokinetic/pharmacodynamic parameters: rationale for antibacterial dosing of mice and men. Clin Infect Dis. 1998;26(1):1–10. | ||
Prins JM, Büller HR, Kuijper EJ, Tange RA, Speelman P. Once versus thrice daily gentamicin in patients with serious infections. Lancet. 1993;341(8841):335–339. | ||
Ozbek B, Otuk G. Post-antibiotic effect of levofloxacin and tobramycin alone or in combination with cefepime against Pseudomonas aeruginosa. Chemotherapy. 2009;55(6):446–450. | ||
Odenholt I, Löwdin E, Cars O. Postantibiotic, postantibiotic sub-MIC, and subinhibitory effects of PGE-9509924, ciprofloxacin, and levofloxacin. Antimicrob Agents Chemother. 2003;47(10):3352–3356. | ||
Caron JP, Bolin CA, Hauptman JG, Johnston KA. Minimum inhibitory concentration and postantibiotic effect of amikacin for equine isolates of methicillin-resistant Staphylococcus aureus in vitro. Vet Surg. 2009;38(5):664–669. | ||
Patel JB. Performance standards for antimicrobial susceptibility testing. Wayne, PA: Clinical and Laboratory Standards Institute; 2017. Available from: https://clsi.org/media/1930/m100ed28_sample.pdf. Accessed October 16, 2018. | ||
Odds FC. Synergy, antagonism, and what the chequerboard puts between them. J Antimicrob Chemother. 2003;52(1):1. | ||
Craig W, Gudmundsson S. The postantibiotic effect. In: Lorian V, editor. Antibiotics in Laboratory Medicine. Baltimore, MD: Williams and Wilkins; 1996:296–329. | ||
Sahuquillo Arce JM, Colombo Gainza E, Gil Brusola A, Ortiz Estévez R, Cantón E, Gobernado M. In vitro activity of linezolid in combination with doxycycline, fosfomycin, levofloxacin, rifampicin and vancomycin against methicillin-susceptible Staphylococcus aureus. Rev Esp Quimioter. 2006;19(3):252–257. | ||
Gobernado M. [Fosfomycin]. Rev Esp Quimioter. 2003;16(1):15–40. Spanish. | ||
Taneja N, Kaur H. Insights into Newer Antimicrobial Agents Against Gram-negative Bacteria. Microbiol Insights. 2016;9:9–19. | ||
Cai Y, Fan Y, Wang R, An MM, Liang BB. Synergistic effects of aminoglycosides and fosfomycin on Pseudomonas aeruginosa in vitro and biofilm infections in a rat model. J Antimicrob Chemother. 2009;64(3):563–566. | ||
Zhao DH, Yu Y, Zhou YF, Shi W, Deng H, Liu YH. Postantibiotic effect and postantibiotic sub-minimum inhibitory concentration effect of valnemulin against Staphylococcus aureus isolates from swine and chickens. Lett Appl Microbiol. 2014;58(2):150–155. | ||
Hosgor-Limoncu M, Ermertcan S, Tasli H, Aydemir S. The post-antibiotic effects of linezolid against Gram-positive pathogens. Saudi Med J. 2007;28(4):551–554. | ||
Andes D, van Ogtrop ML, Peng J, Craig WA. In vivo pharmacodynamics of a new oxazolidinone (linezolid). Antimicrob Agents Chemother. 2002;46(11):3484–3489. | ||
Hui M, Au-Yeang C, Wong KT, Chan CY, Yew WW, Leung CC. Post-antibiotic effects of linezolid and other agents against Mycobacterium tuberculosis. Int J Antimicrob Agents. 2008;31(4):395–396. | ||
Zinner SH, Gilbert D, Lubenko IY, Greer K, Firsov AA. Selection of linezolid-resistant Enterococcus faecium in an in vitro dynamic model: protective effect of doxycycline. J Antimicrob Chemother. 2008;61(3):629–635. | ||
Yim J, Smith JR, Rybak MJ. Role of Combination Antimicrobial Therapy for Vancomycin-Resistant Enterococcus faecium Infections: Review of the Current Evidence. Pharmacotherapy. 2017;37(5):579–592. | ||
Ager S, Gould K. Clinical update on linezolid in the treatment of Gram-positive bacterial infections. Infect Drug Resist. 2012;5:87–102. | ||
Gilbert DN. Once-daily aminoglycoside therapy. Antimicrob Agents Chemother. 1991;35(3):399–405. | ||
Gerber AU, Craig WA. Growth kinetics of respiratory pathogens after short exposures to ampicillin and erythromycin in vitro. J Antimicrob Chemother. 1981; 8(Suppl C):81–91. | ||
Lorian V, Ernst J, Amaral L. The post-antibiotic effect defined by bacterial morphology. J Antimicrob Chemother. 1989;23(4):485–491. | ||
Minguez Minguez F, Izquierdo Izquierdo J, Caminero MM, Fuentes Martinez F, Prieto Prieto J. In vivo postantibiotic effect of isepamicin and other aminoglycosides in a thigh infection model in neutropenic mice. Chemotherapy. 1992;38(3):179–184. | ||
Meng X, Pei Y, Nightingale CH, Quintiliani R. Determination of the in vivo post-antibiotic effects of ciprofloxacin and rifampicin. J Antimicrob Chemother. 1995;36(6):987–996. | ||
Lesher B, Gao X, Chen Y, Liu Z. Methicillin-resistant Staphylococcus aureus nosocomial pneumonia: role of linezolid in the People’s Republic of China. Clinicoecon Outcomes Res. 2016;8:63–72. | ||
Yuan Z, He C, Yan S, Ke Y, Tang W. Randomized controlled clinical trial on the efficacy of fosfomycin trometamol for uncomplicated gonococcal urethritis in men. Clin Microbiol Infect. 2016;22(6):507–512. |
Supplementary materials
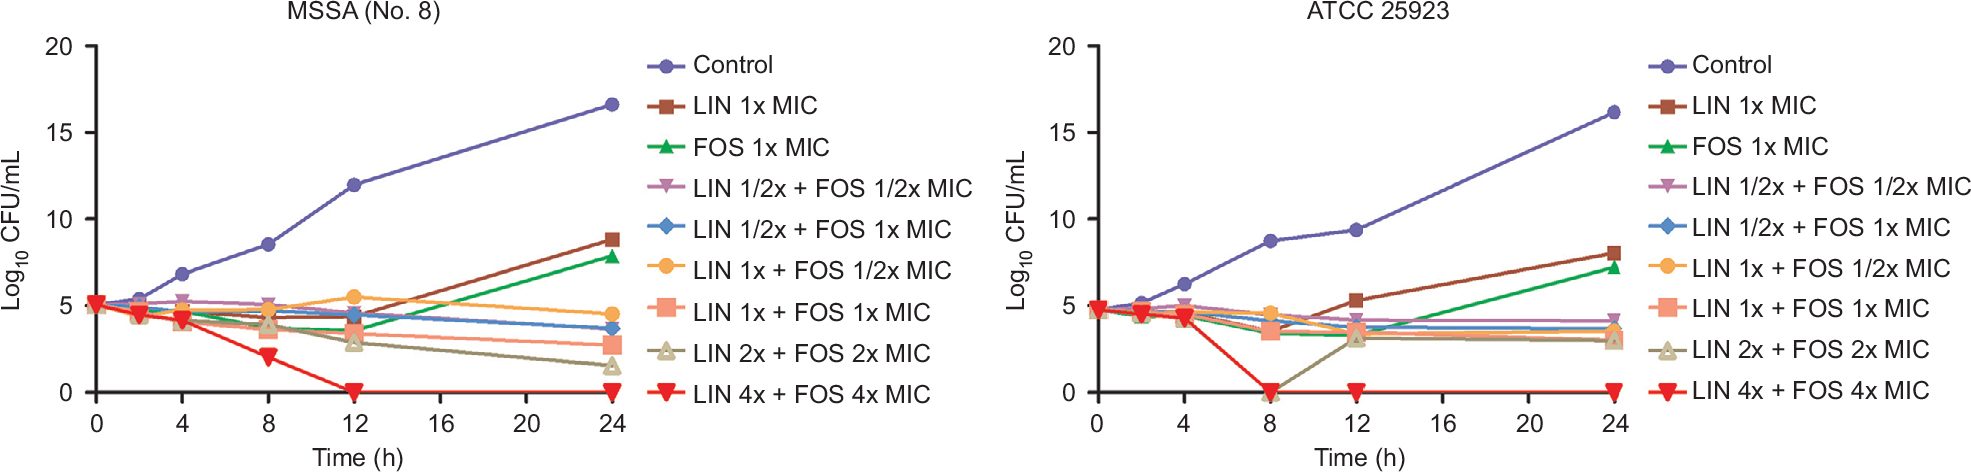 | Figure S1 Time-kill curves of linezolid plus fosfomycin against MSSA (No.8) and ATCC 25923. Abbreviations: CFU, colony-forming units; FOS, fosfomycin; LIN, linezolid; MSSA, methicillin-resistant Staphylococcus aureus; MIC, minimum inhibitory concentration. |
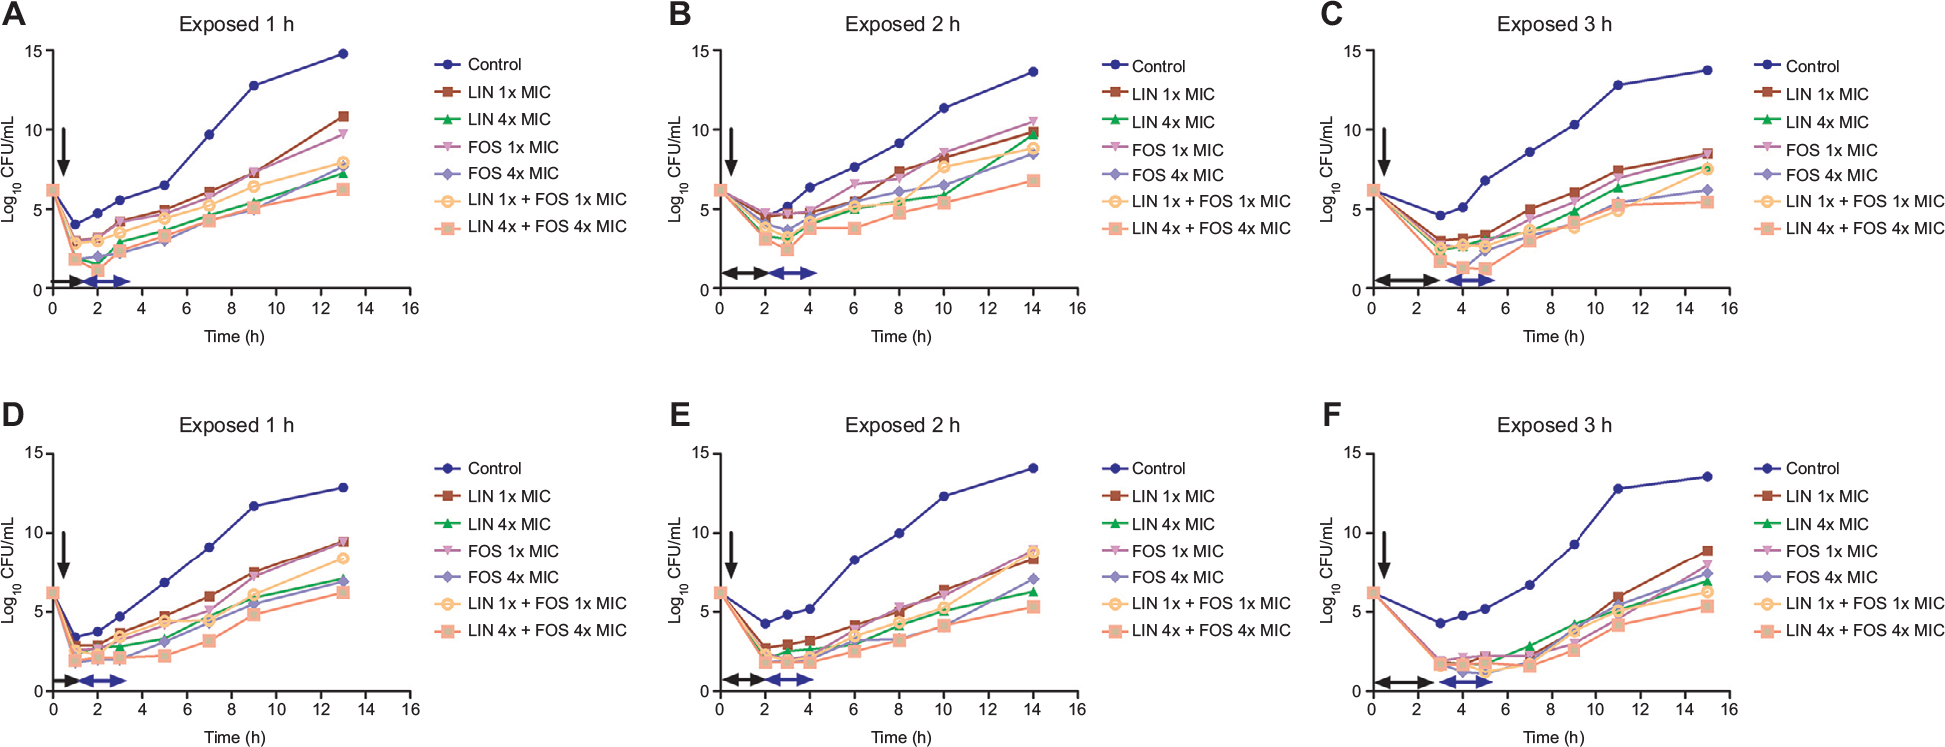 | Figure S2 Regrowth curves of MSSA (No.8) (A–C) and ATCC 25923 (D–F) exposed to linezolid plus fosfomycin for 1, 2, and 3 hours. Note: Timings of antibiotic addition, removal, and the duration of exposure are indicated by a vertical black arrow, a horizontal blue arrow, and a horizontal black arrow, respectively. Abbreviations: CFU, colony-forming units; FOS, fosfomycin; LIN, linezolid; MSSA, methicillin-susceptible Staphylococcus aureus; MIC, minimum inhibitory concentration |
 © 2018 The Author(s). This work is published and licensed by Dove Medical Press Limited. The full terms of this license are available at https://www.dovepress.com/terms.php and incorporate the Creative Commons Attribution - Non Commercial (unported, v3.0) License.
By accessing the work you hereby accept the Terms. Non-commercial uses of the work are permitted without any further permission from Dove Medical Press Limited, provided the work is properly attributed. For permission for commercial use of this work, please see paragraphs 4.2 and 5 of our Terms.
© 2018 The Author(s). This work is published and licensed by Dove Medical Press Limited. The full terms of this license are available at https://www.dovepress.com/terms.php and incorporate the Creative Commons Attribution - Non Commercial (unported, v3.0) License.
By accessing the work you hereby accept the Terms. Non-commercial uses of the work are permitted without any further permission from Dove Medical Press Limited, provided the work is properly attributed. For permission for commercial use of this work, please see paragraphs 4.2 and 5 of our Terms.