")
Back to Journals » International Journal of Nanomedicine » Volume 13
In situ exploration of characteristics of macropinocytosis and size range of internalized substances in cells by 3D-structured illumination microscopy
Authors Jin J, Shen Y, Zhang B, Deng R, Huang D, Lu T, Sun F, Xu S , Liang C
Received 23 April 2018
Accepted for publication 16 July 2018
Published 12 September 2018 Volume 2018:13 Pages 5321—5333
DOI https://doi.org/10.2147/IJN.S171973
Checked for plagiarism Yes
Review by Single anonymous peer review
Peer reviewer comments 2
Editor who approved publication: Professor Lei Yang
Video abstract presented by Jin et al.
Views: 249
Jing Jin,1 Yanting Shen,2 Biao Zhang,1 Rong Deng,3 Dianshuai Huang,1 Tianqi Lu,1 Fei Sun,1,* Shuping Xu,2,* Chongyang Liang1,*
1Institute of Frontier Medical Science, Jilin University, Changchun 130021, Jilin, People’s Republic of China; 2State Key Lab of Supramolecular Structure and Materials, Jilin University, Changchun 130021, Jilin, People’s Republic of China; 3International Joint Research Laboratory of Nano-Micro Architecture Chemistry (NMAC), Jilin University, Changchun 130021, Jilin, People’s Republic of China
*These authors contributed equally to this work
Background: Macropinocytosis can occur in various types of cells and displays multiple functions. However, real-time observation and characterization of the structures of macropinocytosis on the surface of the cell membrane is not yet possible.
Materials and methods: Here, we establish a real-time live cell surface imaging method using three-dimensional-structured illumination microscopy. Based on this, observation of the dynamic macropinocytosis process and morphological data of internalized structures on the surface of pancreatic cancer cells were achieved during macropinocytosis. Next, different-sized silica nanoparticles (SiO2 NPs) were used as the scale for identifying the size range of internalized substances of macropinocytosis in pancreatic cancer cells.
Results and conclusion: Our study not only provides a practical method and more structural data for further investigation of macropinocytosis, but also makes deeper understanding of the cell response toward nanomaterials as well as nanodrugs possible.
Keywords: nanomaterials, macropinocytosis, 3D-SIM, internalization
Introduction
Macropinocytosis has been studied extensively as a critical mode of endocytosis in eukaryotic cells since its discovery in 1931 by Lewis.1 Macropinocytosis can occur in cells such as macrophages, dendritic cells, endothelial cells, and tumor cells. It was originally considered to play a major role in the initiation of innate response and specific immune response, as well as in pathogens entering the host cells.2–5 Recently, Commisso et al found that pancreatic cancer cells absorbed extracellular proteins through macropinocytosis for intracellular amino acid metabolism, which suggested that macropinocytosis is used as a mode of nutrition uptake by tumor cells.6
Therefore, it is essential to reveal the differences in macropinocytosis between tumor and other cells. The large size of macropinosome vesicle is the main characteristic differentiating it from clathrin-mediated endocytosis (85–110 nm) and caveolin-mediated endocytosis (55–75 nm).7 Some studies have even found that the size of macropinosomes in macrophages could reach ~5 μm.8 Swanson and Watts identified the whole process of macropinocytosis, from ruffle formation, ruffle closure, cup closure to the formation of macropinosome vesicle.9 Commisso et al established a method to observe and quantify the internalized macropinosome vesicles in pancreatic cancer cells.10 Owing to the diffraction limitation of visible light, exploring cells with a spatial resolution higher than for the subcellular level is still powerless for the traditional confocal microscopy. Structured illumination microscopy (SIM) that achieves higher imaging speed and requires a relatively simple setup has been widely applied in the field of life sciences.11–13 However, the real-time observation of macropinocytosis on the surface of the cell membrane to characterize the strength, duration, and structural features is not yet possible.
Due to the complexity of biomolecules, nanoparticles have become an ideal model for studying cell internalization, with the characteristics of controlled and uniform size. Also, as potential drug carriers, it is also significant to reveal about internalization of nanoparticles in tumor cells. The physicochemical properties of nanoparticles could influence the capacity for internalization, including the size, the constituting material, surface chemistry, and so on.14–16 Currently, diverse tools such as flow cytometry, mass spectroscopy, capillary electrophoresis, and Raman spectroscopy are used for analysis.17–20 However, they still have some limitations and a visual method which could show the internalization of nanoparticles directly is urgently required.
In the present study, by means of the three-dimensional-SIM (3D-SIM) technique, we characterized in situ the dynamic endocytic structures and identified the size of internalized substances on the surface of pancreatic cancer cells with Ras mutation. We established a method for real-time observation of the occurrence of macropinocytosis on the surface of cells for the first time. This method was employed for assessing different-sized silica nanoparticles (SiO2 NPs) as the scale ruler of the internalized substances of macropinocytosis in tumor cells.
Materials and methods
Brief general description
First of all, using DNA-single-walled carbon nanotubes (SWCNTs), we observed the differences in modes of macropinocytosis between multiple types of cells; next, based on 3D-SIM, we explored the structural characteristics of macropinocytosis; and finally, applying different sizes of SiO2 NPs, the size range of internalized substances in K-rasG12C MIA PaCa-2 cells was detected.
Cell culture
The pancreatic adenocarcinoma-derived human KrasG12C MIA PaCa-2 cells (ATCC® CRM-CRL-1420™), Kraswt MIA PaCa-2 cells (ATCC® CRL-1420™), human umbilical vein endothelial cells (HUVECs; ATCC® PCS-100-013™), and mouse macrophage Raw 264.7 cells (ATCC® TIB-71™) were purchased from the American Type Culture Collection (Manassas, VA, USA) and maintained in DMEM (Thermo Fisher Scientific, Waltham, MA, USA), supplemented with 10% heat-inactivated fetal bovine serum (Thermo Fisher Scientific), 100 μg/mL streptomycin, and 100 U/mL penicillin (Sigma-Aldrich, St Louis, MO, USA) on 10 cm plates at 37°C in the presence of 5% CO2.
Reagents and chemicals
WGA Alexa Fluor 488 Conjugate, Lipofectamine 2000, Opti-MEM, Dextran Alexa Fluor 568, and ActinGreen 488 ReadyProbes Reagent were obtained from Thermo Fisher Scientific (Mariani et al, 2004).19 TPA, Hoechst 33342, chlorpromazine, genistein, and AG1478 were purchased from Sigma-Aldrich. 5-(N-ethyl-N-isopropyl)-amiloride was from Santa Cruz Biotechnology (Dallas, TX, USA).30
Plasmids and transfection
The plasmid pmApple-lifeact-N1 was kindly provided by Prof Pingyong Xu (Beijing, China). Transfection was carried out using Lipofectamine 2000 according to the manufacturer’s instructions. Usually, cells were analyzed within 18–24 hours following transfection.31,32
Super-resolution 3D-SIM imaging and analysis
Cells grown on glass coverslips or dishes were serum starved for 18 hours, with the normal group non-starving. Then, bovine serum albumin (BSA), TPA, and other reagents were added at various times. Imaging of live cells was performed in 20 mm dishes. For actin staining, cells were fixed with 4% paraformaldehyde in PBS for 20 minutes and permeabilized with 0.1% Triton for 10 minutes at room temperature, followed by incubation with two drops of ActinGreen 488 ReadyProbes Reagent per milliliter of medium for 30 minutes at room temperature. Then cells were washed by PBS/serum (three times, 5 minutes each).33,34
Cells were imaged using a DeltaVision OMX Imaging System with the 3D-SIM model (No OM06051; GE Healthcare, Pittsburgh, PA, USA). Channel, mode, exposure, excitation, and luminousness were set for optimum imaging. SoftWoRx (GE Healthcare) was used to reconstruct image data from OMX. Volume rendering of reconstructive image was also obtained by using softWoRx.35
Imaging rendering and analysis was carried out using the Imaris software from Bitplane (Zurich, Switzerland). Surface and spots module were used for different imaging channels. Region of interest imaging could offer information with surface position; slice view could measure and analyze the relativity or other data between imaging structures.36
Synthesis of monodispersed SiO2 NPs
The SiO2 NPs with a size of about 69 nm were prepared by the reverse microemulsion method. Briefly, 1.77 mL Triton X-100 and 1.8 mL n-hexanol were added to 7.5 mL cyclohexane. Then, 345 μL water (in which was dissolved 15 mM tris(2,2′-bipyridine) ruthenium dichloride) was added to the mixture and stirred for 20 minutes. After that, 50 μL tetraethyl orthosilicate (TEOS) was added to the above solution and stirred for 20 minutes. Next, 60 μL ammonia (29%) was added and allowed to react for 24 hours. Finally, 50 μL TEOS and 50 μL N-(trimethoxysilylpropyl) ethylenediaminetriacetate, trisodium salt 35% in water was added to the above solution and allowed to react for another 24 hours to obtain dye-labeled SiO2 NPs modified with carboxyl.
The SiO2 NPs with larger sizes were obtained by the Stöber approach. Briefly, 540 μL water (in which was dissolved 15 mM tris(2,2′-bipyridine) ruthenium dichloride), 500 μL TEOS, and 0.5 mL (or 1 mL) 29% ammonia were added to 12.8 mL ethanol and stirred for 24 hours to obtain dye-labeled SiO2 NPs with a diameter of about 180 nm (the same method with 420 nm SiO2 NPs obtaining). All of the silica particles were separated by centrifugation and washed by ethanol at least three times. Then, the silica NPs were resuspended in 20 mL water for use.
Characterization of SiO2 NPs by transmission electron microscopy
The morphology of the produced silica NPs was investigated using a JEM-2100F field emission transmission electron microscope (JEOL, Tokyo, Japan). Also, the size of the prepared SiO2 NPs was about 69, 180, and 420 nm.
Statistical analysis
All assays were performed for at least three biological replicates. All statistical analyses were completed with GraphPad Prism 6 (GraphPad Software). Data are presented as mean ± standard error of the mean, and all data do not refer to multiple comparisons.
Results
K-rasG12C MIA PaCa-2 cells could not internalize the SWCNTs (>2 μm)
Reportedly, SWCNTs can enter into HUVECs through macropinocytosis.21 We observed the endocytosis of dextran, the marker of macropinocytosis, and the SWCNTs, with the average length of about 2 μm, linked covalently to DNA in HUVECs. Figure 1A shows that red dextran and green SWCNTs can enter into HUVECs, thereby indicating an obvious colocalization, which was in agreement with the report by Bhattacharya et al.21
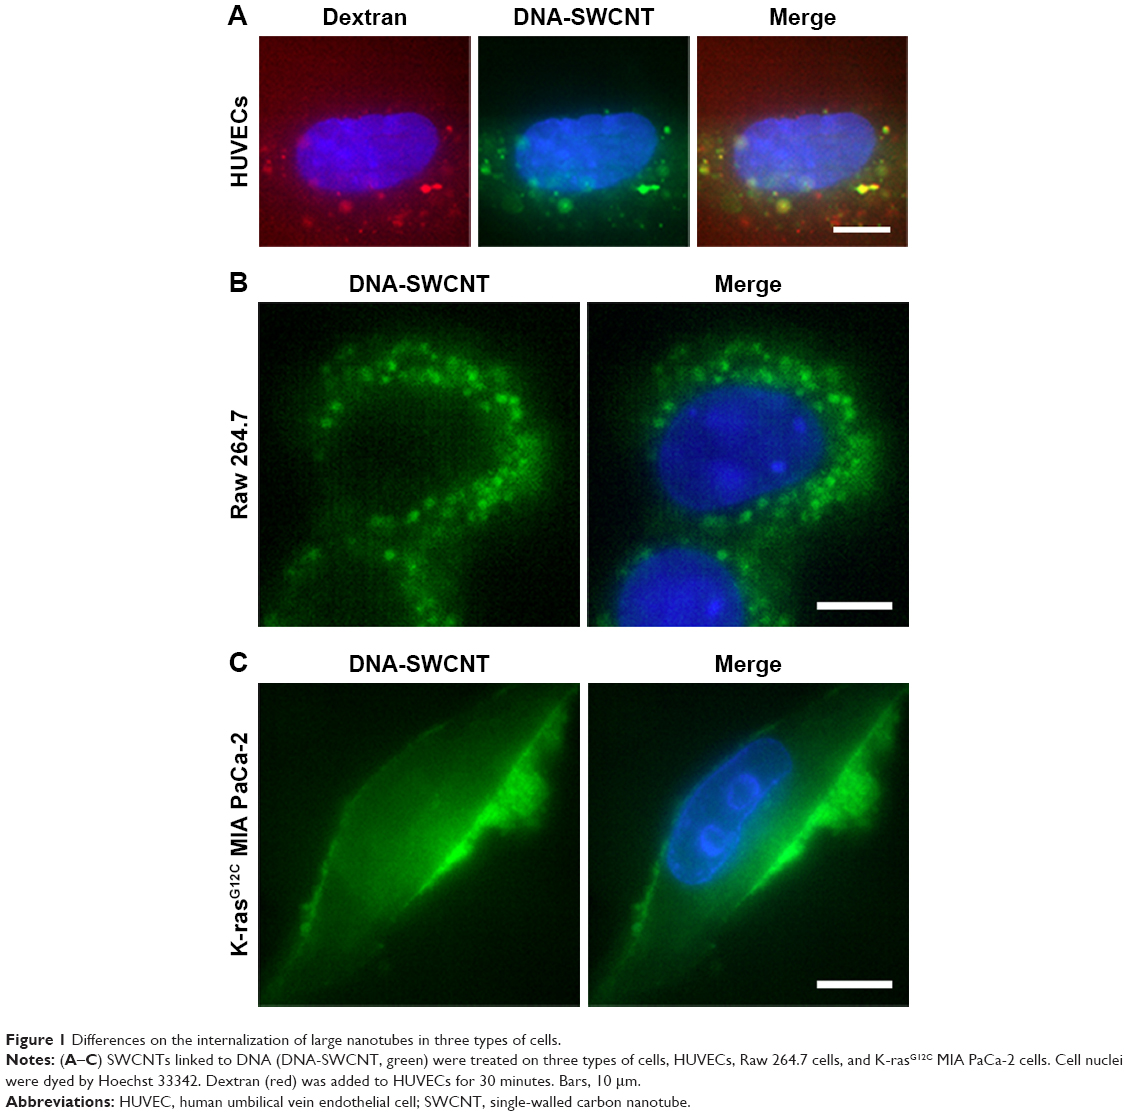 | Figure 1 Differences on the internalization of large nanotubes in three types of cells. |
Commisso et al found that macropinocytosis is a critical mode of nutrient uptake in pancreatic cancer cells with K-ras mutation.6 But whether the cells will absorb SWCNTs in extracellular fluid through macropinocytosis under the same conditions is yet to be elucidated. Interestingly, as Figure 1B shows, green fluorescence was mainly accumulated outside the cell membrane in K-rasG12C MIA PaCa-2 cells incubated with SWCNTs, and no significant internalization was observed. The same materials were used in macrophages, and the SWCNTs were found to enter into the macrophages by endocytosis (Figure 1C). Thus, we speculated differences in the modes of macropinocytosis between macrophages and HUVECs as well as pancreatic cancer cells with K-ras mutation, K-rasG12C MIA PaCa-2 cells. Therefore, the structural characterization of the modes of macropinocytosis in tumor cells will be conducted in detail.
Real-time dynamic observation of macropinocytosis on the cell surface with super-resolution structured illumination imaging
Uptake of extracellular proteins by tumor cells through macropinocytosis has been under intensive research with respect to cell biology in recent years. However, the microscopic imaging method to observe the physiological process of macropinocytosis developed slowly; it mainly observed the vertical structure after membrane ruffle using transmission electron microscopy,22,23 or the macropinosome vesicle that had entered the cells after the occurrence of macropinocytosis by confocal microscopy.6 Presently, there is no microscopic imaging technique that can observe the occurrence of macropinocytosis on the cell surface in real time and dynamically. Only a few research groups have attempted to investigate the process of macropinocytosis of macrophages, which completely differed from the macropinocytosis in tumor cells. The macropinocytotic structure formed by the latter was far smaller than the relevant structures in macrophages, and the difference was more than 10-fold. We used these methods in the study of macropinocytosis in tumor cells and found that the resolution and speed of photography could not fulfill the criteria of the present study.
To solve this, a method that can observe the cup-like structure of the surface of the live cell membrane in real time during the occurrence of macropinocytosis was designed based on the super-resolution 3D-SIM imaging. As shown in Figure 2A, TPA, a known activator of macropinocytosis, was used to treat the K-rasG12C MIA PaCa-2 cells; these cells showed a large number of cup-like structures on the surfaces of the cell membranes.24 However, after pretreatment with 5-(N-ethyl-N-isopropyl)-amiloride, a specific inhibitor of macropinocytosis, these cup-like structures on the surface of cell membrane were not observed after the addition of TPA. Furthermore, other endocytic inhibitors, chlorpromazine, genistein, and AG147, could not inhibit the occurrence of TPA-induced cup-like structures. Commisso et al reported that tumor cells with Ras mutation could absorb and degrade the extracellular BSA through macropinocytosis.6 We treated the K-rasG12C MIA PaCa-2 cells with dextran and BSA separately, and the cup-like structures were demonstrated on the cell surfaces. Moreover, these structures colocalized with BSA and dextran (Figure 2B and C), and thus, the cup-like structures on the cell surface could be related to macropinocytosis.
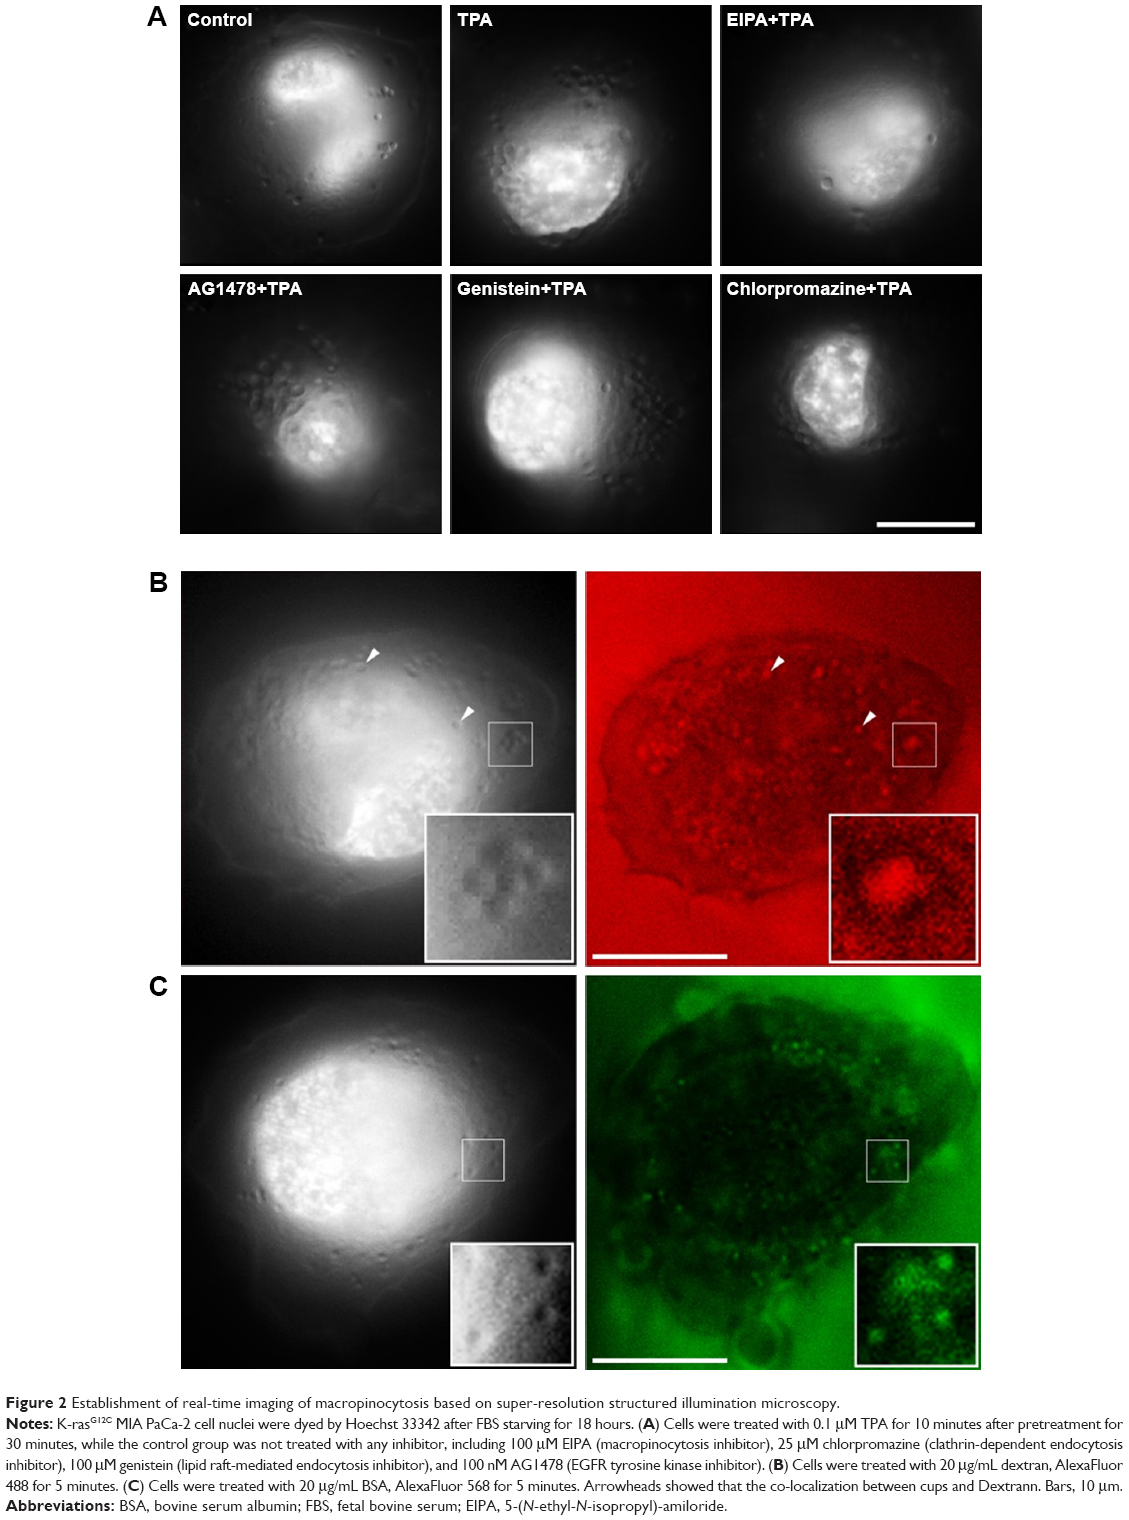 | Figure 2 Establishment of real-time imaging of macropinocytosis based on super-resolution structured illumination microscopy. |
Imaging and analysis of the internalized structure of macropinocytosis in tumor cells
The cup-like structures were characterized and analyzed further. The 3D-SIM imaging system was used to image the real-time dynamic changes in the macropinocytic cup for the first time (Figure 3A). After BSA treatment for the starved K-rasG12C MIA PaCa-2 cells, a large number of cups immediately occurred on the cell membrane. Intuitively, each cup exhibited a specific depth and their morphologies were similar. Compared to normal macropinocytosis under non-starvation state, a large number of cups occurred on the abdomen of the starved cells; thus, more cups appeared on the non-adherent edge.
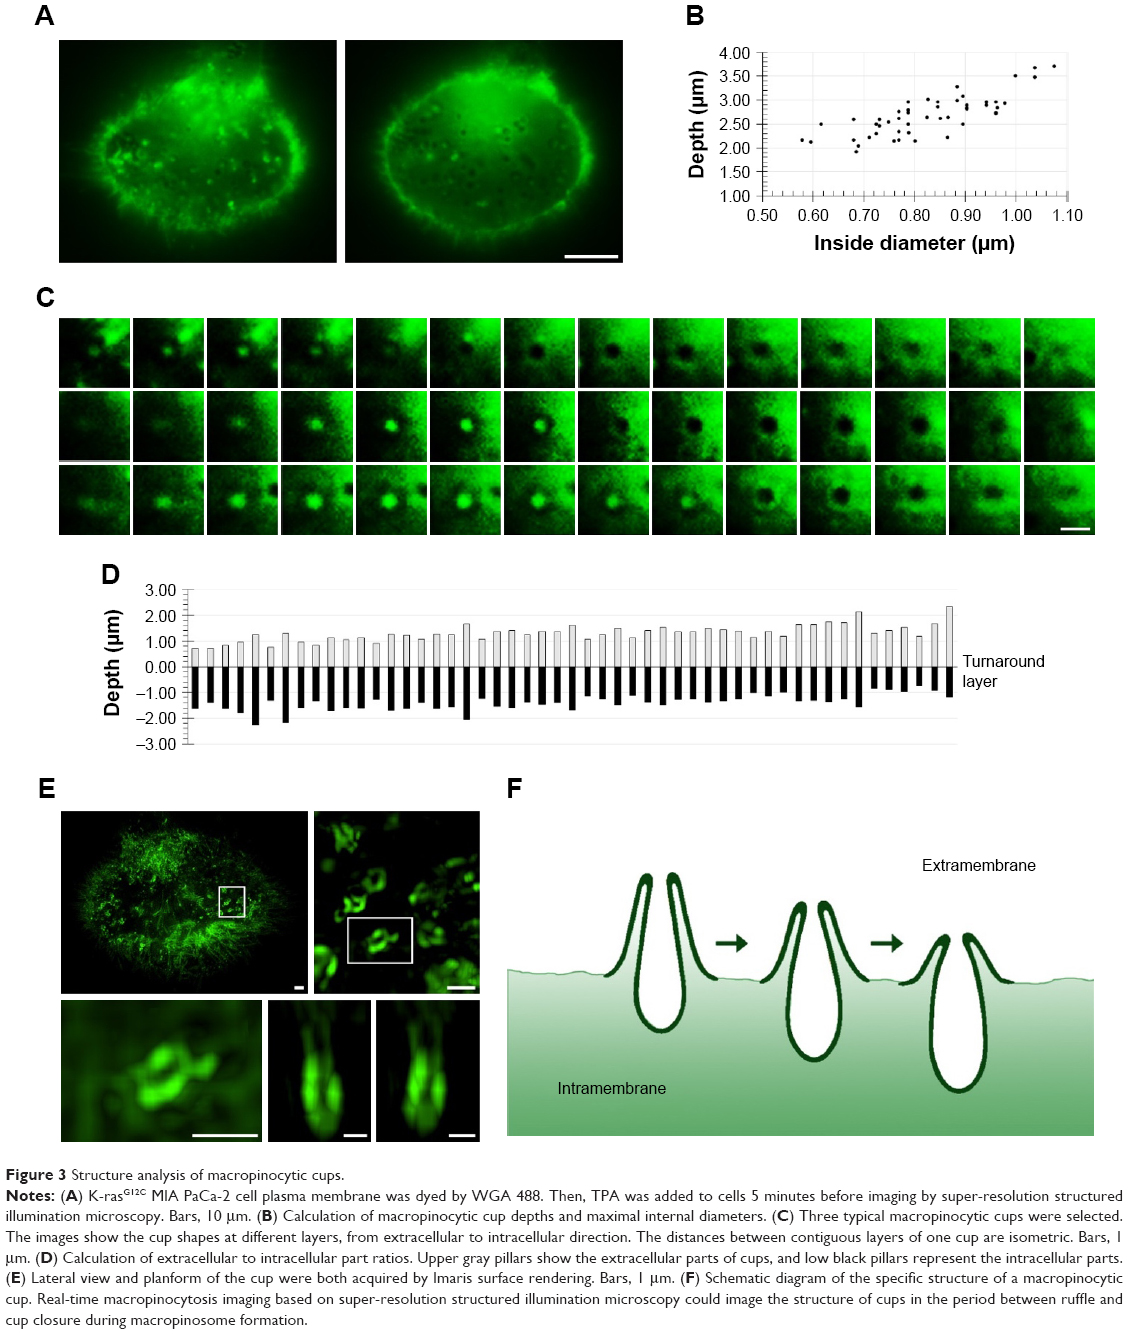 | Figure 3 Structure analysis of macropinocytic cups. |
The 3D-SIM is a non-tomographic scanning method, and all information can be collected for the cell from top to bottom. Figure 3A shows the depth of the cup, with a single imaging of 0.015 seconds for a total time of 5.4 seconds from the top of the ruffle to the cup bottom. Yoshida et al reported that forming of macropinosome requires duration of ~200 seconds.25 So, we infer that the macropinocytic cup imaged here is a full form in the process of macropinosome formation. Minimal displacement of the imaging focus was 0.02347 μm; according to imaging frequency, the depth and the internal diameter of the cup were calculated by Imaris software. The depth of the cup was 2–3 μm, with a maximal diameter of 0.7–0.9 μm (Figure 3B). By analyzing each layer of the cup, from the plasma membrane adhering to the glass coverslip to another side of the cytoplasm, it can be found that the initial layer gradually turned into gray, and a marked turnaround layer could be set and identified (Figure 3C). Since the cell membrane was stained in green, when the imaging focus is in front of the plasma membrane, protrusion occurring on the membrane will brighten the cup center. Conversely, when the focus is below the membrane, the protrusion will not be observed. If the bottom of the cup does not internalize, we cannot trace the cup location. Therefore, a dark area indicates an invagination of the cup. Therefore, the bright and dark transition region can be regarded as a boundary between the cup and the membrane. Similarly, a large number of cups were analyzed, and the difference in the proportions of invagination and protrusion in various cups is plotted in Figure 3D. Fluorescence data of the cup were 3D rebuilt and characterized by Imaris, and the stereo structures could be observed (Figure 3E). Based on the above analysis and calculation, the morphological evolution of macropinocytosis from the cup formation to closure in tumor cells was deduced, as shown in Figure 3F.
Dynamic changes of F-actin
Figure 4A shows the SIM images of the cell membranes and microfilament of tumor cells during taking up the extracellular proteins. Through 3D reconstruction using Imaris, multiple F-actin molecules were found to cross the ventral side of MIA PaCa-2 cells (K-rasG12C). F-actin was enveloped in the cell membranes (Figure 4B), which is similar to the lamellipodia observed during macropinocytosis under an electron microscope. However, these lamellipodia near the cells are mostly longer than 10 μm, with even the shortest above 5 μm, which are much larger than the lamellipodia lengths and macropinosome diameters reported in previous literature. We also observed slender lamellipodia near the ventral side, and the top of the lamellipodia merged to form a structure similar to a macropinosome (Figure 4C). There are almost no reports to identify where macropinocytosis occurs in the 3D structure of cancer cells. It was suggested that macropinocytosis could appear where F-actin is enriched – around the site of cell adhesion. However, we did not observe lamellipodia in a large quantity and appropriate length in this region. In contrast, a large number of lamellipodia and cups appeared at the locations where cells adhered to the wall. In Figure 4C, many cups can be seen in the ventral side during macropinocytosis, with the cell membrane elevated by only about 1–2 μm due to the degraded F-actin. However, the 3D reconstruction of the ventral side indicates (Figure 4D) that a high concentration of circular dorsal ruffles (green) occurs on the cell membrane. Such structures (green) can also be observed inside the cells, probably resulting from the invagination of circular dorsal ruffles. Finding whether the circular dorsal ruffles are the macropinocytotic cups reported in macropinocytosis and the nature of their structural features will be the focus of SIM imaging in the future. They are also the key aspects of real-time observation of macropinocytosis in tumor cells. Another important feature of macropinocytosis is that F-actin running through the cells reorganizes into fragments,26 helping the cell membrane to form ruffles.26
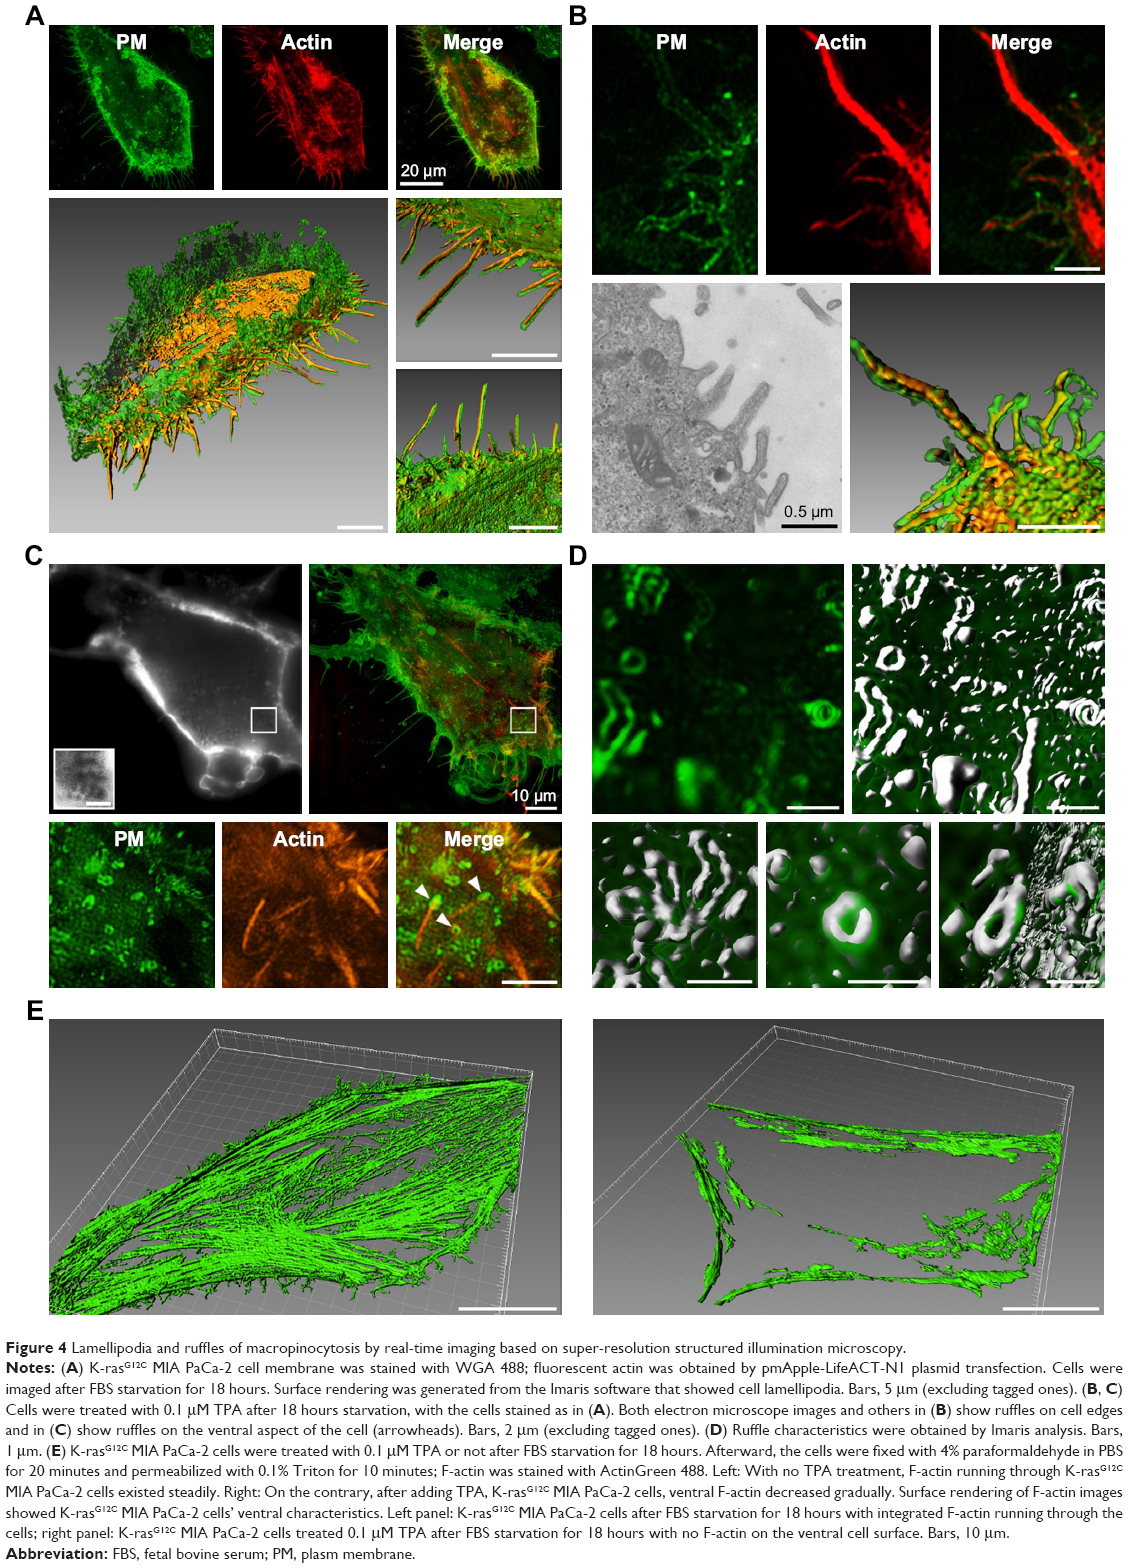 | Figure 4 Lamellipodia and ruffles of macropinocytosis by real-time imaging based on super-resolution structured illumination microscopy. |
In this study, it was found that when macropinocytosis is completed, F-actin molecules will be recovered, especially in the ventral cell surface position. Therefore, when simultaneously observing cup invagination, live cell imaging was performed to display the dynamic changes of actin cytofilaments in MIA PaCa-2 cells (K-raswt) treated with TPA. At the beginning of 20 minutes, nearly no F-actin running through MIA PaCa-2 cells (K-rasG12C) could be observed in the ventral cell surface position. This is consistent with the data obtained by Imaris shown in Figure 4E. F-actin was reorganized after TPA addition for 20 minutes, which serves as a solid evidence for the absence of significant macropinocytosis. To confirm whether macropinocytic uptake of the extracellular proteins took place in pancreatic adenocarcinoma-derived human MIA PaCa-2 cells in the absence of extracellular proteins, the dynamic changes of actin were recorded as an evidence.
Kamphorst et al reported that MIA PaCa-2 cells with oncogenic mutant K-rasG12C had a higher level of macropinocytosis compared with K-raswt cell strain MIA PaCa-2.27 This was based on the evidence that when TMR-dextran was used as the marker of macropinosomes, over ten labeled macropinosomes were seen in the serum-starved MIA PaCa-2 cells, while they were hardly observed in MIA PaCa-2 cells. Also, Egami and Araki reported that Raw 264.7 cells could internalize BSA by macropinocytosis.28 Based on above considerations, the models of BSA entering into K-rasG12C/K-raswt MIA PaCa-2 cells or Raw 264.7 cells were used to explore the differences during the macropinocytosis of tumor cells and macrophages.
We visualized the macropinocytic uptake of protein by establishing an imaging technique based on super-resolution SIM. Referring to existing studies, K-raswt MIA PaCa-2 cells, K-rasG12C MIA PaCa-2 cells, and Raw 264.7 cells were used. As shown in Figure 5A, focusing one or two cells, with the K-rasWT cells previously serum starved and with sufficient essential amino acids, only four “cups” were found on the cell surface after adding BSA into the culture medium for 0–30 minutes. While, in K-rasG12C MIA PaCa-2 cells under the same environment, dozens of “cups” appeared after adding BSA for 5 minutes. The number of macropinocytic cups on the cell membrane increased again at 10 and 20 minutes, decreased at 30 minutes, and recovered to initial stage. F-actin on the ventral position of the adherent side reorganized and recovered successively at the same time points (Figure 5B). The above results indicate that macropinocytic uptake of protein in tumor cells lasted about 30 minutes. By comparison, BSA could enter into Raw 264.7 cells by macropinocytosis, but the F-actin on the ventral sides did not change as K-rasG12C MIA PaCa-2 cells during macropinocytosis (Figure 5C). These results suggest that the dynamic changes of F-actin were different during macropinocytosis in tumor cells and macrophages.
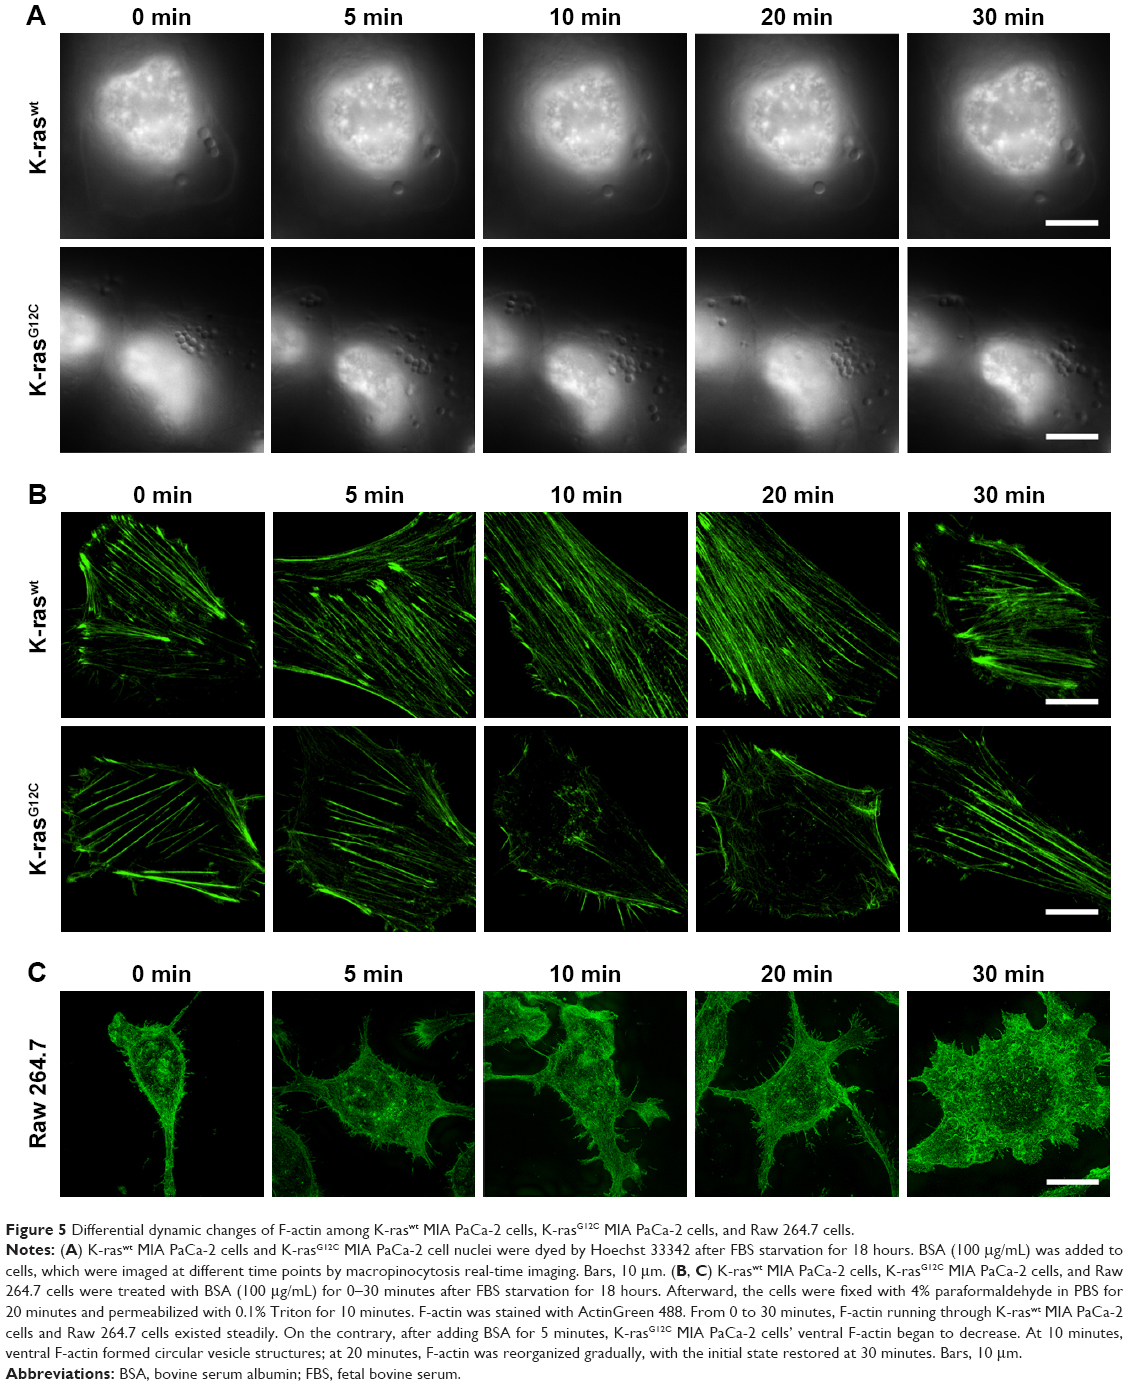 | Figure 5 Differential dynamic changes of F-actin among K-raswt MIA PaCa-2 cells, K-rasG12C MIA PaCa-2 cells, and Raw 264.7 cells. |
Measurement of the size range of internalized substances in macropinocytosis using different sizes of SiO2 NPs
Figure 1 demonstrates that single-walled 2 μm length carbon nanotubes could not be internalized into the MIA PaCa-2 cells by K-rasG12C mutation, while Figure 3 confirms that the width and depth of the macropinocytotic cup structure of K-rasG12C MIA PaCa-2 cells were 0.7–0.9 and 2–3 μm, respectively. Theoretically, 2 μm SWCNT can be endocytosed into cells; thus, the size range of the internalized substances of macropinocytosis in tumor cells was not the maximum value of the theoretical volume of the cup structures.
Therefore, selecting a controllable internalized substance with a stable size in order to elucidate the size range of these substances of macropinocytosis in tumor cells is highly essential. In view of the characteristics of SiO2 NPs, such as flexible size, robust physical stability, as well as entering the tumor cells through clathrin-mediated endocytosis and macropinocytic internalization, three different sizes of SiO2 NPs (69, 180, and 420 nm) were selected based on the range of clathrin-mediated endocytosis to be utilized as the verification tool for determining the structure of macropinocytic internalization. The different sizes of SiO2 NPs were verified by electron microscopy (Figure 6A).
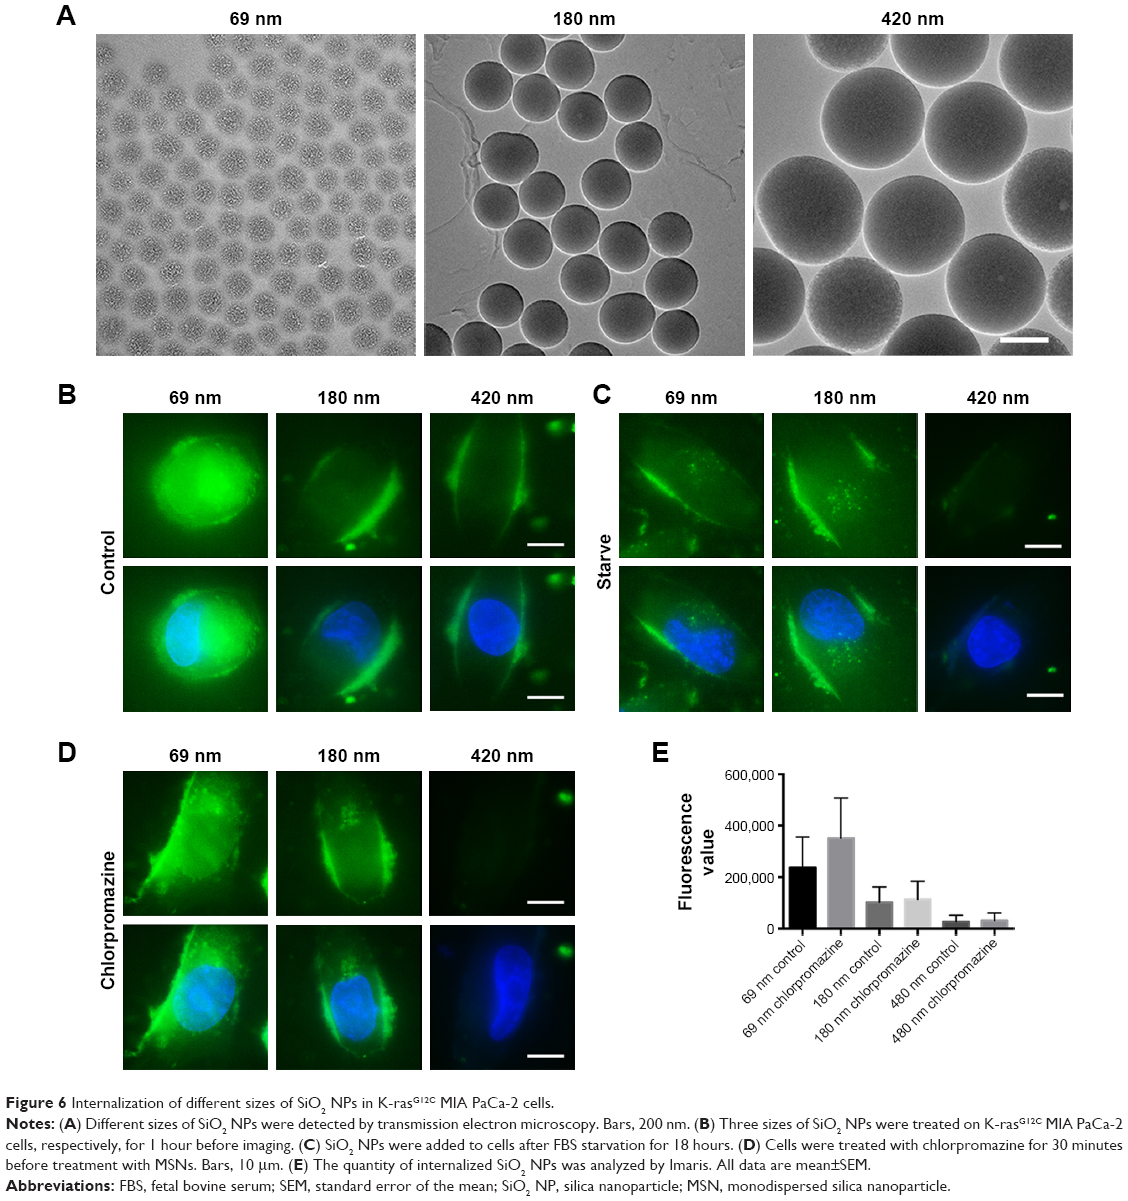 | Figure 6 Internalization of different sizes of SiO2 NPs in K-rasG12C MIA PaCa-2 cells. |
Kamphorst et al have verified that serum starvation is not performed for K-rasG12C MIA PaCa-2 cells, which indicates that cells rarely absorb the extracellular substances actively through macropinocytosis when the amino acid content is normal in the extracellular environment.27 Only a few 69 nm SiO2 NPs entered the cells in the absence of starvation culture, while no internalization in 180 and 420 nm SiO2 NPs was observed (Figure 6B). In the event of starvation, the cells had the ability to absorb extracellular substances through macropinocytosis; although internalization occurred in 69 and 180 nm SiO2 NPs, the 420 nm SiO2 NPs did not enter into the cells. These preliminary results demonstrate that 69 nm NPs could be internalized into cells through clathrin and 180 nm NPs could be internalized into the cells through macropinocytosis; however, the 420 nm NPs cannot be internalized through macropinocytosis.
In order to further confirm the modes of internalization of SiO2 NPs with various sizes, the cells were treated with clathrin-mediated endocytosis inhibitor, chlorpromazine (Figure 6C–E). After treatment with chlorpromazine, 69 nm SiO2 NPs continued to enter into the cells; however, the volume decreased significantly, suggesting that SiO2 NPs of this size entered into the cells through both clathrin-mediated endocytosis and macropinocytic internalization. The internalization of 180 nm NPs was not affected by the inhibitor, indicating that NPs of this size entered into the cells only through micropinocytosis. There was no internalization of 420 nm NPs, suggesting that SiO2 NPs of this size could not enter into the tumor cells.
Discussion
The in-depth study of macropinocytosis revealed that this process also played a crucial role in other types of cells, despite its inherent behavior in macrophages and dendritic cells. Commisso et al found that macropinocytosis is vital in pancreatic cancer cells with K-ras mutation, which is also the major pathway of nutrition uptake.6 To date, this type of endocytosis occurs in all types of cells, which is collectively known as “macropinocytosis”, without any definite classification and differentiation. Nevertheless, the macropinocytosis occurring in various types of cells is greatly different. The present study shows that SWCNTs can enter into the macrophages and HUVECs through macropinocytosis, but cannot enter into the tumor cells. This difference was reflected mostly in the internalized structure and the size of the internalized substances.
Moreover, no microscopic imaging technique is available that can perform the real-time dynamic observation of macropinocytosis on the cell surface, especially macropinocytosis in tumor cells with relatively small macropinocytosis structure, which largely limited further studying and understanding the process. This study developed a method based on 3D-SIM super-resolution imaging technique that can perform such real-time dynamic observation of the structure and status of macropinocytosis on the surface of live cell membrane. Moreover, through a detailed analysis of the “cup” structure of macropinocytosis, this study concluded that the depth of the structure was 2–3 μm and the maximum internal diameter was 0.7–0.9 μm. In addition, the whole process of disappearance and gradual recovery of cell-ventral-side microfilament in the process of macropinocytosis was observed in real time and dynamically; the real morphology of macropinocytosis on the cell surface was also displayed. The establishment of this method complemented the deficiency of the previous studies that could only perform qualitative and quantitative characterization of the macropinosome vesicle. Furthermore, this approach gave complete morphological and structural data of the surface of cell membrane during macropinocytosis for the first time, therefore providing a feasible and efficient method for further investigation of macropinocytosis. Although this method had been performed in several types of cells, more imaging studies could be used to identify its limitations and potential. With the continuous development of super-resolution imaging technique, this approach may be used in studies of other endocytosis types on the cell surface, such as clathrin-dependent endocytosis or caveolin-dependent endocytosis.
According to the cup structure data of macropinocytosis in tumor cells, theoretically, 2 μm long SWCNTs can enter into the cells through macropinocytosis; however, the opposite was true, suggesting that the size range of the internalized substances of macropinocytosis in tumor cells is not the maximum value of the theoretical volume of cup structure. This feature might be attributed to the complex bending and folding of cell membranes that rendered difficulty in containing the maximum internalized substances theoretically. More correlative studies on the mechanism and characteristic of macropinocytosis will provide better understanding.
In order to investigate the size range of the internalized substances of macropinocytosis in tumor cells, MSN was used as a scale. The SiO2 NPs had the characteristics of high flexibility, uniform and controllable size, strong physical stability, as well as the ability to enter into the tumor cells through macropinocytosis.29 The present study found that 69 nm SiO2 NPs can enter K-rasG12C MIA PaCa-2 cells via clathrin-mediated endocytosis and macropinocytosis. The 180 nm SiO2 NPs can enter into the cells only through macropinocytosis, while the 420 nm NPs cannot enter into the cells, these results about the sizes of internalized substances were widely different from the previously known internalized size (0.5–2 μm) of macropinocytosis. The findings of this study further illuminated the process of macropinocytosis in tumor cells and provided a preliminary idea and evidence for the refinement and classification of macropinocytosis. Also, as a potential nanodrug carrier for tumor cells, the internalization ability of MSNs was essential for the drug design. In addition, the size of MSNs could give a reference for the macropinocytosis of viral vectors. Thus, this study provided a preliminary size range for designing the nanodrug carriers and viral vectors. Considering the high cytotoxicity of the small-sized nanomaterials, 100–300 nm may be an appropriate range.
Conclusion
This study established a method based on 3D-SIM super-resolution imaging technique for the first time that can perform real-time dynamic observation of the structure and status of macropinocytosis on the surface of live cell membrane, and this approach provided complete morphological and structural data of the surface of cell membrane during macropinocytosis.
This study used different-sized SiO2 NPs as the scale ruler to investigate the size range of the internalized substances of macropinocytosis in tumor cells. It was found that 69 nm SiO2 NPs can enter K-rasG12C MIA PaCa-2 cells via clathrin-mediated endocytosis and macropinocytosis, the 180 nm SiO2 NPs can enter into the cells only through macropinocytosis, while the 420 nm NPs cannot enter into the cells, these results about the sizes of internalized substances were widely different from the previously known internalized size (0.5–2 μm) of macropinocytosis. This study provided a preliminary size range for designing the nanodrug carriers and viral vectors.
To sum up, this study found that in the actual structure of macropinocytosis in tumor cells exists huge differences with the past viewpoints, and we hope that this finding could provide an experimental reference and example for the study of metabolism and endocytosis in tumor cells.
Acknowledgments
We thank Pingyong Xu (Institute of Biophysics, Chinese Academy of Sciences, Beijing, China) for Plasmid pmApple-lifeact-N1. This work was supported by the National Natural Science Foundation of China (Grant No 81202446, 31271478).
Disclosure
The authors report no conflicts of interest in this work.
References
Lewis WH. Pinocytosis. Johns Hopkins Hosp Bull. 1931;49:17–27. | ||
Haigler HT, Mckanna JA, Cohen S. Rapid stimulation of pinocytosis in human carcinoma cells A-431 by epidermal growth factor. J Cell Biol. 1979;83(1):82–90. | ||
Racoosin EL, Swanson JA. Macrophage colony-stimulating factor (rM-CSF) stimulates pinocytosis in bone marrow-derived macrophages. J Exp Med. 1989;170(5):1635–1648. | ||
Sallusto F, Cella M, Danieli C, Lanzavecchia A. Dendritic cells use macropinocytosis and the mannose receptor to concentrate macromolecules in the major histocompatibility complex class II compartment: downregulation by cytokines and bacterial products. J Exp Med. 1995;182(2):389–400. | ||
Norbury CC, Chambers BJ, Prescott AR, Ljunggren HG, Watts C. Constitutive macropinocytosis allows TAP-dependent major histocompatibility complex class I presentation of exogenous soluble antigen by bone marrow-derived dendritic cells. Eur J Immunol. 1997;27(1):280–288. | ||
Commisso C, Davidson SM, Soydaner-Azeloglu RG, et al. Macropinocytosis of protein is an amino acid supply route in Ras-transformed cells. Nature. 2013;497(7451):633–637. | ||
Conner SD, Schmid SL. Regulated portals of entry into the cell. Nature. 2003;422(6927):37–44. | ||
Swanson JA, Watts C. Macropinocytosis. Trends Cell Biol. 1995;5(11):424–428. | ||
Swanson JA. Shaping cups into phagosomes and macropinosomes. Nat Rev Mol Cell Biol. 2008;9(8):639–649. | ||
Commisso C, Flinn RJ, Bar-Sagi D. Determining the macropinocytic index of cells through a quantitative image-based assay. Nat Protoc. 2014;9(1):182–192. | ||
Hell SW, Wichmann J. Breaking the diffraction resolution limit by stimulated emission: stimulated-emission-depletion fluorescence microscopy. Opt Lett. 1994;19(11):780–782. | ||
Gustafsson MGL. Surpassing the lateral resolution limit by a factor of two using structured illumination microscopy. Short communication. J Microsc. 2000;198(2):82–87. | ||
Kam Z, Hanser B, Gustafsson MG, Agard DA, Sedat JW. Computational adaptive optics for live three-dimensional biological imaging. Proc Natl Acad Sci U S A. 2001;98(7):3790–3795. | ||
Maeda H, Wu J, Sawa T, Matsumura Y, Hori K. Tumor vascular permeability and the EPR effect in macromolecular therapeutics: a review. J Control Release. 2000;65(1–2):271–284. | ||
des Rieux A, Ragnarsson EG, Gullberg E, Préat V, Schneider YJ, Artursson P. Transport of nanoparticles across an in vitro model of the human intestinal follicle associated epithelium. Eur J Pharm Sci. 2005;25(4–5):455–465. | ||
Albanese A, Tang PS, Chan WC. The effect of nanoparticle size, shape, and surface chemistry on biological systems. Annu Rev Biomed Eng. 2012;14(1):1–16. | ||
Tsioris K, Torres AJ, Douce TB, Love JC. A new toolbox for assessing single cells. Annu Rev Chem Biomol Eng. 2014;5(1):455–477. | ||
Sun L, Zhu G, Yan X, Dovichi NJ. High sensitivity capillary zone electrophoresis-electrospray ionization-tandem mass spectrometry for the rapid analysis of complex proteomes. Curr Opin Chem Biol. 2013;17(5):795–800. | ||
Mariani MM, Lampen P, Popp J, Wood BR, Deckert V. Impact of fixation on in vitro cell culture lines monitored with Raman spectroscopy. Analyst. 2009;134(6):1154–1161. | ||
Draux F, Gobinet C, Sulé-Suso J, et al. Raman spectral imaging of single cancer cells: probing the impact of sample fixation methods. Anal Bioanal Chem. 2010;397(7):2727–2737. | ||
Bhattacharya S, Roxbury D, Gong X, Mukhopadhyay D, Jagota A. DNA conjugated SWCNTs enter endothelial cells via Rac1 mediated macropinocytosis. Nano Lett. 2012;12(4):1826–1830. | ||
Orth JD, Krueger EW, Weller SG, et al. A novel endocytic mechanism of epidermal growth factor receptor sequestration and internalization. Cancer Res. 2006;66(7):3603–3610. | ||
Ellerbroek SM, Wennerberg K, Arthur WT, et al. SGEF, a RhoG guanine nucleotide exchange factor that stimulates macropinocytosis. Mol Biol Cell. 2004;15(7):3309–3319. | ||
Grimmer S, van Deurs B, Sandvig K, Stine G, Vd B, Kirsten S. Membrane ruffling and macropinocytosis in A431 cells require cholesterol. J Cell Sci. 2002;115(Pt 14):2953–2962. | ||
Yoshida S, Hoppe AD, Araki N, Swanson JA. Sequential signaling in plasma-membrane domains during macropinosome formation in macrophages. J Cell Sci. 2009;122(18):3250–3261. | ||
Gu Z, Noss EH, Hsu VW, Brenner MB. Integrins traffic rapidly via circular dorsal ruffles and macropinocytosis during stimulated cell migration. J Cell Biol. 2011;193(1):61–70. | ||
Kamphorst JJ, Nofal M, Commisso C, et al. Human pancreatic cancer tumors are nutrient poor and tumor cells actively scavenge extracellular protein. Cancer Res. 2015;75(3):544–553. | ||
Egami Y, Araki N. Dynamic changes in the spatiotemporal localization of Rab21 in live RAW264 cells during macropinocytosis. PLoS One. 2009;4(8):e6689. | ||
Tang F, Li L, Chen D. Mesoporous silica nanoparticles: synthesis, biocompatibility and drug delivery. Adv Mater. 2012;24(12):1504–1534. | ||
Heikkilä O, Susi P, Tevaluoto T, et al. Internalization of coxsackievirus A9 is mediated by β2-microglobulin, dynamin, and Arf6 but not by caveolin-1 or clathrin. J Virol. 2010;84(7):3666–3681. | ||
Li D, Shao L, Chen BC, et al. ADVANCED IMAGING. Extended-resolution structured illumination imaging of endocytic and cytoskeletal dynamics. Science. 2015;349(6251):aab3500. | ||
Zhao N, Zhang AS, Worthen C, Knutson MD, Enns CA. An iron-regulated and glycosylation-dependent proteasomal degradation pathway for the plasma membrane metal transporter ZIP14. Proc Natl Acad Sci U S A. 2014;111(25):9175–9180. | ||
Hasegawa J, Tokuda E, Tenno T, et al. SH3YL1 regulates dorsal ruffle formation by a novel phosphoinositide-binding domain. J Cell Biol. 2011;193(5):901–916. | ||
Zhang X, Chen X, Zeng Z, et al. Development of a reversibly switchable fluorescent protein for super-resolution optical fluctuation imaging (SOFI). ACS Nano. 2015;9(3):2659–2667. | ||
Yoshida S, Hoppe AD, Araki N, Swanson JA. Sequential signaling in plasma-membrane domains during macropinosome formation in macrophages. J Cell Sci. 2009;122(Pt 18):3250–3261. | ||
Ewald AJ, Huebner RJ, Palsdottir H, et al. Mammary collective cell migration involves transient loss of epithelial features and individual cell migration within the epithelium. J Cell Sci. 2012;125(Pt 11):2638–2654. |
 © 2018 The Author(s). This work is published and licensed by Dove Medical Press Limited. The full terms of this license are available at https://www.dovepress.com/terms.php and incorporate the Creative Commons Attribution - Non Commercial (unported, v3.0) License.
By accessing the work you hereby accept the Terms. Non-commercial uses of the work are permitted without any further permission from Dove Medical Press Limited, provided the work is properly attributed. For permission for commercial use of this work, please see paragraphs 4.2 and 5 of our Terms.
© 2018 The Author(s). This work is published and licensed by Dove Medical Press Limited. The full terms of this license are available at https://www.dovepress.com/terms.php and incorporate the Creative Commons Attribution - Non Commercial (unported, v3.0) License.
By accessing the work you hereby accept the Terms. Non-commercial uses of the work are permitted without any further permission from Dove Medical Press Limited, provided the work is properly attributed. For permission for commercial use of this work, please see paragraphs 4.2 and 5 of our Terms.