")
Back to Journals » Cancer Management and Research » Volume 14
In situ Detecting Lipids as Potential Biomarkers for the Diagnosis and Prognosis of Intrahepatic Cholangiocarcinoma
Authors Li J , Chen Q , Guo L, Li J, Jin B, Wu X, Shi Y, Xu H, Zheng Y, Wang Y, Du S , Li Z, Lu X, Sang X , Mao Y
Received 20 January 2022
Accepted for publication 20 August 2022
Published 26 September 2022 Volume 2022:14 Pages 2903—2912
DOI https://doi.org/10.2147/CMAR.S357000
Checked for plagiarism Yes
Review by Single anonymous peer review
Peer reviewer comments 4
Editor who approved publication: Dr Kenan Onel
Jiayi Li,1,2,* Qiao Chen,1,3,* Lei Guo,4,* Ji Li,5 Bao Jin,1 Xiangan Wu,1 Yue Shi,1 Haifeng Xu,1 Yongchang Zheng,1 Yingyi Wang,6 Shunda Du,1 Zhili Li,4 Xin Lu,1 Xinting Sang,1 Yilei Mao1
1Department of Liver Surgery, Peking Union Medical College Hospital, Chinese Academy of Medical Sciences and Peking Union Medical College, Beijing, 100730, People’s Republic of China; 2Department of Nuclear Medicine, Peking Union Medical College Hospital, Chinese Academy of Medical Sciences and Peking Union Medical College, Beijing, 100730, People’s Republic of China; 3Department of Plastic Surgery, Peking Union Medical College Hospital, Chinese Academy of Medical Sciences and Peking Union Medical College, Beijing, 100730, People’s Republic of China; 4Department of Biophysics and Structural Biology, Institute of Basic Medical Sciences, Chinese Academy of Medical Sciences and Peking Union Medical College, Beijing, 100005, People’s Republic of China; 5Department of Pathology, Peking Union Medical College Hospital, Chinese Academy of Medical Sciences and Peking Union Medical College, Beijing, 100730, People’s Republic of China; 6Department of Oncology, Peking Union Medical College Hospital, Chinese Academy of Medical Sciences and Peking Union Medical College, Beijing, 100730, People’s Republic of China
*These authors contributed equally to this work
Correspondence: Shunda Du; Zhili Li, Email [email protected]; [email protected]
Purpose: To quantitatively analyze lipid molecules in tumors and adjacent tissues of intrahepatic cholangiocarcinoma (ICC), to establish diagnostic model and to examine lipid changes with clinical classification.
Patients and Methods: We measured the quantity of 202 lipid molecules in 100 tumor observation points and 100 adjacent observation points of patients who were diagnosed with ICC. Principal component analysis (PCA) and orthogonal partial least squares-discriminant analysis (OPLS-DA) were handles, along with Student’s t-test to identify specific metabolites. Prediction accuracy was validated in the validation set. Another logistic regression model was also established on the training set and validated on the validation set.
Results: Distinct separation was obtained from PCA and OPLS-DA model. Ten differentiating metabolites were identified using PCA, OPLA-DA and Lasso regression: [m/z 722.5130], [m/z 863.5655], [m/z 436.2834], [m/z 474.2626], [m/z 661.4813], [m/z 750.5443], [m/z 571.2889], [m/z 836.5420], [m/z 772.5862] and [m/z 478.2939]. Using logical regression, a diagnostic equation: y = 3.4*[m/z 436.2834] - 3.773*[m/z 474.2626] + 3.82*[m/z 661.4813] - 4.394*[m/z 863.5655] + 10.165 based on four metabolites successfully differentiated cancerous areas from adjacent normal areas. The AUROC of the model reached 0.993 (95% CI: 0.985– 0.999) in the validation group. Compared with the adjacent non-tumor area, three characteristic metabolites FA (22:4), PA (P-18:0/0:0) and Glucosylceramide (d18:1/12:0) showed an increasing trend from stage I to stage II, while seven other metabolites LPA(16:0), PE(34:2), PE(36:4), PE(38:3), PE(40:6), PE(40:5) and LPE(16:0) showed a decreasing trend from stage I to stage II.
Conclusion: We successfully identified lipid molecules in differentiating tumor tissue and adjacent tissue of ICC, established a discrimination logistic model which could be used as a classifier to classify tumor and non-tumor regions based on analysis in tumor margins and provided information for biomarker changes in ICC, and proposed to related lipid changes with clinical classification.
Keywords: intrahepatic cholangiocarcinoma, in situ lipids profiles, metabolomics, mass spectrometry, classification and diagnostic model
Introduction
Intrahepatic cholangiocarcinoma (ICC) is a malignant tumor with poor prognosis. The 5-year overall survival rate after surgical resection was 11–40%.1,2 Since 2000, the average annual incidence has been 1.6 per 100,000/year.3 A study shows that the incidence of cholangiocarcinoma in the United States has increased significantly in the past 40 years.4 The incidence of cholangiocarcinoma in China is much higher than that in the United States and Europe.5 The overall limited survival has led to notable efforts toward the identification of novel targets and agents that could modify the natural history of these aggressive hepatobiliary malignancies. The use of next-generation sequencing (NGS) has led to the identification of previously unknown molecular features of ICC, including fibroblast growth factor receptor (FGFR)2 gene fusions and rearrangements, isocitrate dehydrogenase-1 (IDH-1) mutations, and BRAF mutations.6,7 The development of some treatments targeting these molecular mutations has received accelerated approval by the US Food and Drug Administration (FDA).8 Based on these premises, the identification of some novel targets has a promising future.
Mass spectrometry (MS) is an analytical technique that can ionize chemicals and classify ions according to their mass-charge ratios. The development of MS makes it possible to collect molecular information from tissue samples.9 The obtained mass spectra can be displayed as intensity maps showing the distribution of individual m/z values of interest. Based on the different methods of sample preparation, the current research mainly focuses on the analysis of proteins,10 lipids,11 small molecules12 or polysaccharides.13 Metabolic and micro-environmental differences between tumor tissues and adjacent tissues can be revealed.14 Because of the accuracy of mass spectrometry, researchers can obtain hundreds of observation points in a small number of samples. Enough data can effectively improve the persuasion of the results.
In particular, different from blood samples, if a fresh sample of solid tumor is obtained, researchers can obtain the mass spectrometry information at multiple detection points on the sample, so as to draw the distribution map of tumor metabolites, which is what we call in situ detection, which will be conducive to the study of tumor heterogeneity and the pathological judgment of tumor margin. It can achieve better follow-up and treatment management for patients who have undergone surgical resection.15
In the field of cholangiocarcinoma, researchers have carried out many different studies on protein difference in samples including peripheral blood,16 tissues,17 and even bile.18 However, in previous studies, there were few studies on lipid molecular MS between cancer tissues and adjacent tissues of ICC. Also, few study explored relationship between clinical subtype classification and ICC. In addition, there might exist racial difference on lipid molecules in ICC and few studies have been managed in Chinese population. Our study aims to quantitatively in situ analyze lipid molecules in tumor tissues and adjacent tissues of Chinese ICC patients, to establish diagnostic model and to examine lipid changes with clinical classification.
Materials and Methods
Sample Information
We prospectively collected 10 patients who were diagnosed with ICC and underwent surgery in Peking Union Medical College Hospital (PUMCH) from Dec, 2018 to Dec, 2020. The diagnoses were confirmed by pathology and patients with mixed pathological carcinoma or distal metastasis were excluded. One hundred tumor observation points and 100 adjacent observation points were selected in these samples. The samples were divided into training group and validation group equally and randomly. Written informed consent was obtained from all research subjects. Tissue samples with cancerous area and adjacent area were remaining tissues after clinical pathological examinations. The study was approved by the Ethics Committee of Peking Union Medical College Hospital (S-K205, September, 2018). Informed consents were written by all individual participants included in the study. Our study complies with the Declaration of Helsinki.
Sample Preparation and Matrix Deposition
Specimens with a volume of 1cm3 were snap-frozen in liquid nitrogen immediately after collection and stored at −80°C refrigerator until use. Tissue samples were then cut into 12μm thin tissue sections and one 4μm section. The 4μm one was used for hematoxylin and eosin (H&E) staining. The 12μm ones were thaw-mounted onto indium-tin-oxide (ITO) coated glass slides in a freezing microtome. Solution composition, matrix concentration and coating volume were optimized for matrix deposition conditions. Then, a homebuilt sublimation apparatus was used to coat a uniform matrix. The matrix used in the present study was GO matrix (Nanjing Ji Chang nano company, purity >99.0%), and the matrix spraying concentration of 10.5mg/mL. Recrystallization was then performed to enhance signal intensity.
MSI or Mass Spectrometry Profiling
MSI or mass spectrometry profiling was performed on tissue sections using a 9.4 T Apex-ultraTM hybrid Qh-FTICR MS equipped with a 355 nm and 200 Hz Nd:YAG Smartbeam laser (Bruker Daltonics, Billerica, MA, USA). MSI data were acquired on two adjacent tissue sections at the spatial resolution of 150 μm in the negative ion modes. A full scan mass spectrum was acquired at 80 laser shots each over a mass range of 100–1000 Da in negative ion mode with the resolutions of 66,000 at m/z 400. External calibration was performed using a mixture of FA(16:0) (m/z 255.23295), FA(18:1) (m/z 281.24860), FA(20:4) (m/z 297.27990), LPE(18:0) (m/z 480.30956), PA(18:0/18:0) (m/z 703.52833), PE(18:0/18:0) (m/z 746.57053), PI(18:0/20:4) (m/z 885.54985) (Avanti Polar Lipids Inc., Alabaster, AL, USA).
The profiling data were acquired at the same experimental parameters as those of the MSI data acquisition. To confirm data reliability and to assess the heterogeneity of tissues, ten mass spectra at different positions of the cancerous area and the adjacent area were acquired randomly.
Structure Identification of Differentially Expressed Lipids of Interest
Lipid species identification was performed based on the Human Metabolome Database (HMDB) and Lipidmaps, with a mass error of 5 ppm. Structure identification was based on the measured accurate molecular masses, reliable isotope distributions.
Data Handing and Statistical Analysis
The FlexImaging software (version 2.1, Bruker Daltonics) with the absolute intensity was used for molecular images with a mass error of 1 ppm. Peaks with signal-to-noise ratio of >3, relative intensity of >0.1%, and absolute intensity thresholds of 100,000 were selected as reliable variables. Internal mass calibration and reliable isotope distributions were carried out using DataAnalysis 4.0 software (Bruker Daltonics), after which the metabolites among different samples and different pixels were combined as one metabolite within a narrow mass tolerance window (0.001 Da), orthogonal partial least squares-discriminant analysis (OPLS-DA) was used to discriminate the metabolic patterns between cancerous and adjacent area after mean centering and unit variance scaling. The default 7-fold cross-validation was performed to guard against model over-fitting.
Principal component analysis (PCA) is an unsupervised statistical analysis used to describe associations and patterns among a set of variables. R2X and Q2 are two measures of PCA model quality. R2X is the goodness of fit, which is the sum of squares of the entries of X explained by all extracted components. Q2 is the predictive power of the model, which is the fraction of the total variation of the entries of X that can be predicted by all extracted components, as estimated by cross validation.
Lasso regression is a method suitable for high-dimensional data, where the number of variables is larger than the number of samples, and the variables are strongly correlated with each other.19
In addition, the Student’s t-test was applied to all metabolites. To adjust the p-value, a classical one stage method of false discovery rate (FDR) was performed. Those variables with the variable importance in the projection (VIP) score >1.0, Lasso regression = 100 and p < 0.05 (Student’s t-test) were selected.
Further, to establish a model with simple equation, the logistic regression was used for each metabolite selected by VIP score >1.0, Lasso score = 100 and p < 0.05 (Student’s t-test). After univariate analysis, variables with P < 0.05 were selected for multiple logistic regression and forward method was used to select variables with significance, and an equation was established with these variables.
To further investigate the relationship between metabolite concentration and the pathological stages, the samples in the training group and validation group were pooled together. Patients with early stages and advanced stages were compared using the Student’s t-test. The difference between the metabolite concentrations of patients at different stages were visualized by histograms.
Results
PCA and OPLS-DA Model Establishment and Differentiating Metabolites Identification
PCA and OPLS-DA model were performed on the training set. A total of 86 metabolites out of 202 metabolites passed the filtering procedure and were used for the final refinement of model. An unsupervised PCA model was first established and the tumor and adjacent areas were clearly separated with a R2X of 0.950 and a Q2 of 0.915 (Figure 1). Then, a supervised OPLS-DA was obtained with a R2X of 0.594, a R2Y of 0.947 and a Q2 of 0.932. A clear separation was also observed with all the tumor plots on the right half and all the adjacent plots on the left half (Figure 1). Further, a 999-time permutation test was performed to validate the model, with the R2 and Q2 values lower than the original ones. In addition, the Q2 intercept was below zero (Figure 1).
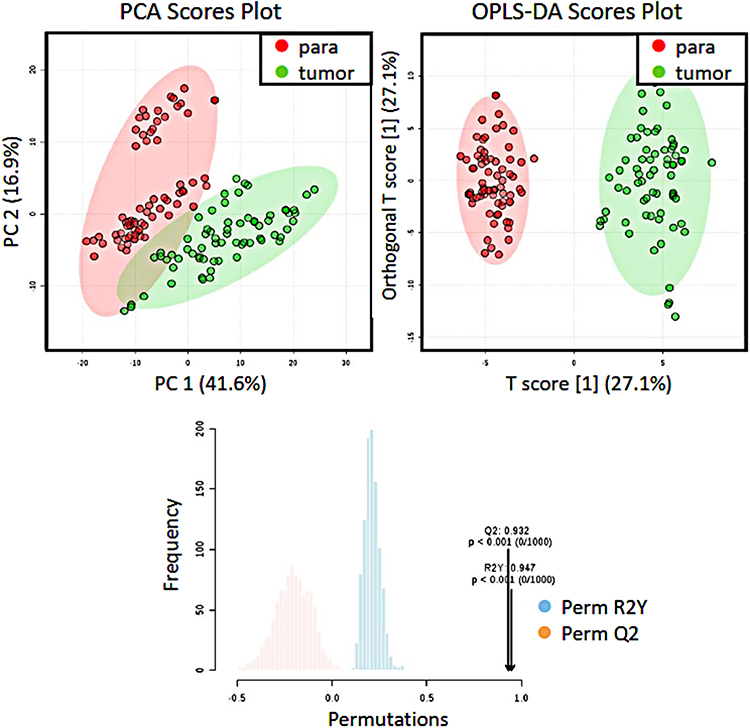 |
Figure 1 PCA, OPLS-DA models and permutation test. PCA and OPLS-DA score plots of metabolites from the tumor area (green dots) and the adjacent area (red dots) were shown in above and permutation test for OPLS-DA was shown in bottom. |
Then, an unadjusted Student’s t-test and an adjusted false discovery rate (FDR) test were performed on the metabolites derived from MS. 18 metabolites were selected with the criteria of: p-value <0.05 in Student’s t-test, q-value <0.05 in FDR test, and VIP value >1 based on the OPLS-DA evaluation (Table 1). LASSO regression further selected 10 metabolites: [m/z 722.5130], [m/z 863.5655], [m/z 436.2834], [m/z 474.2626], [m/z 661.4813], [m/z 750.5443], [m/z 571.2889], [m/z 836.5420], [m/z 772.5862] and [m/z 478.2939] with a LASSO score of 100, which independently distinct tumor and adjacent areas.
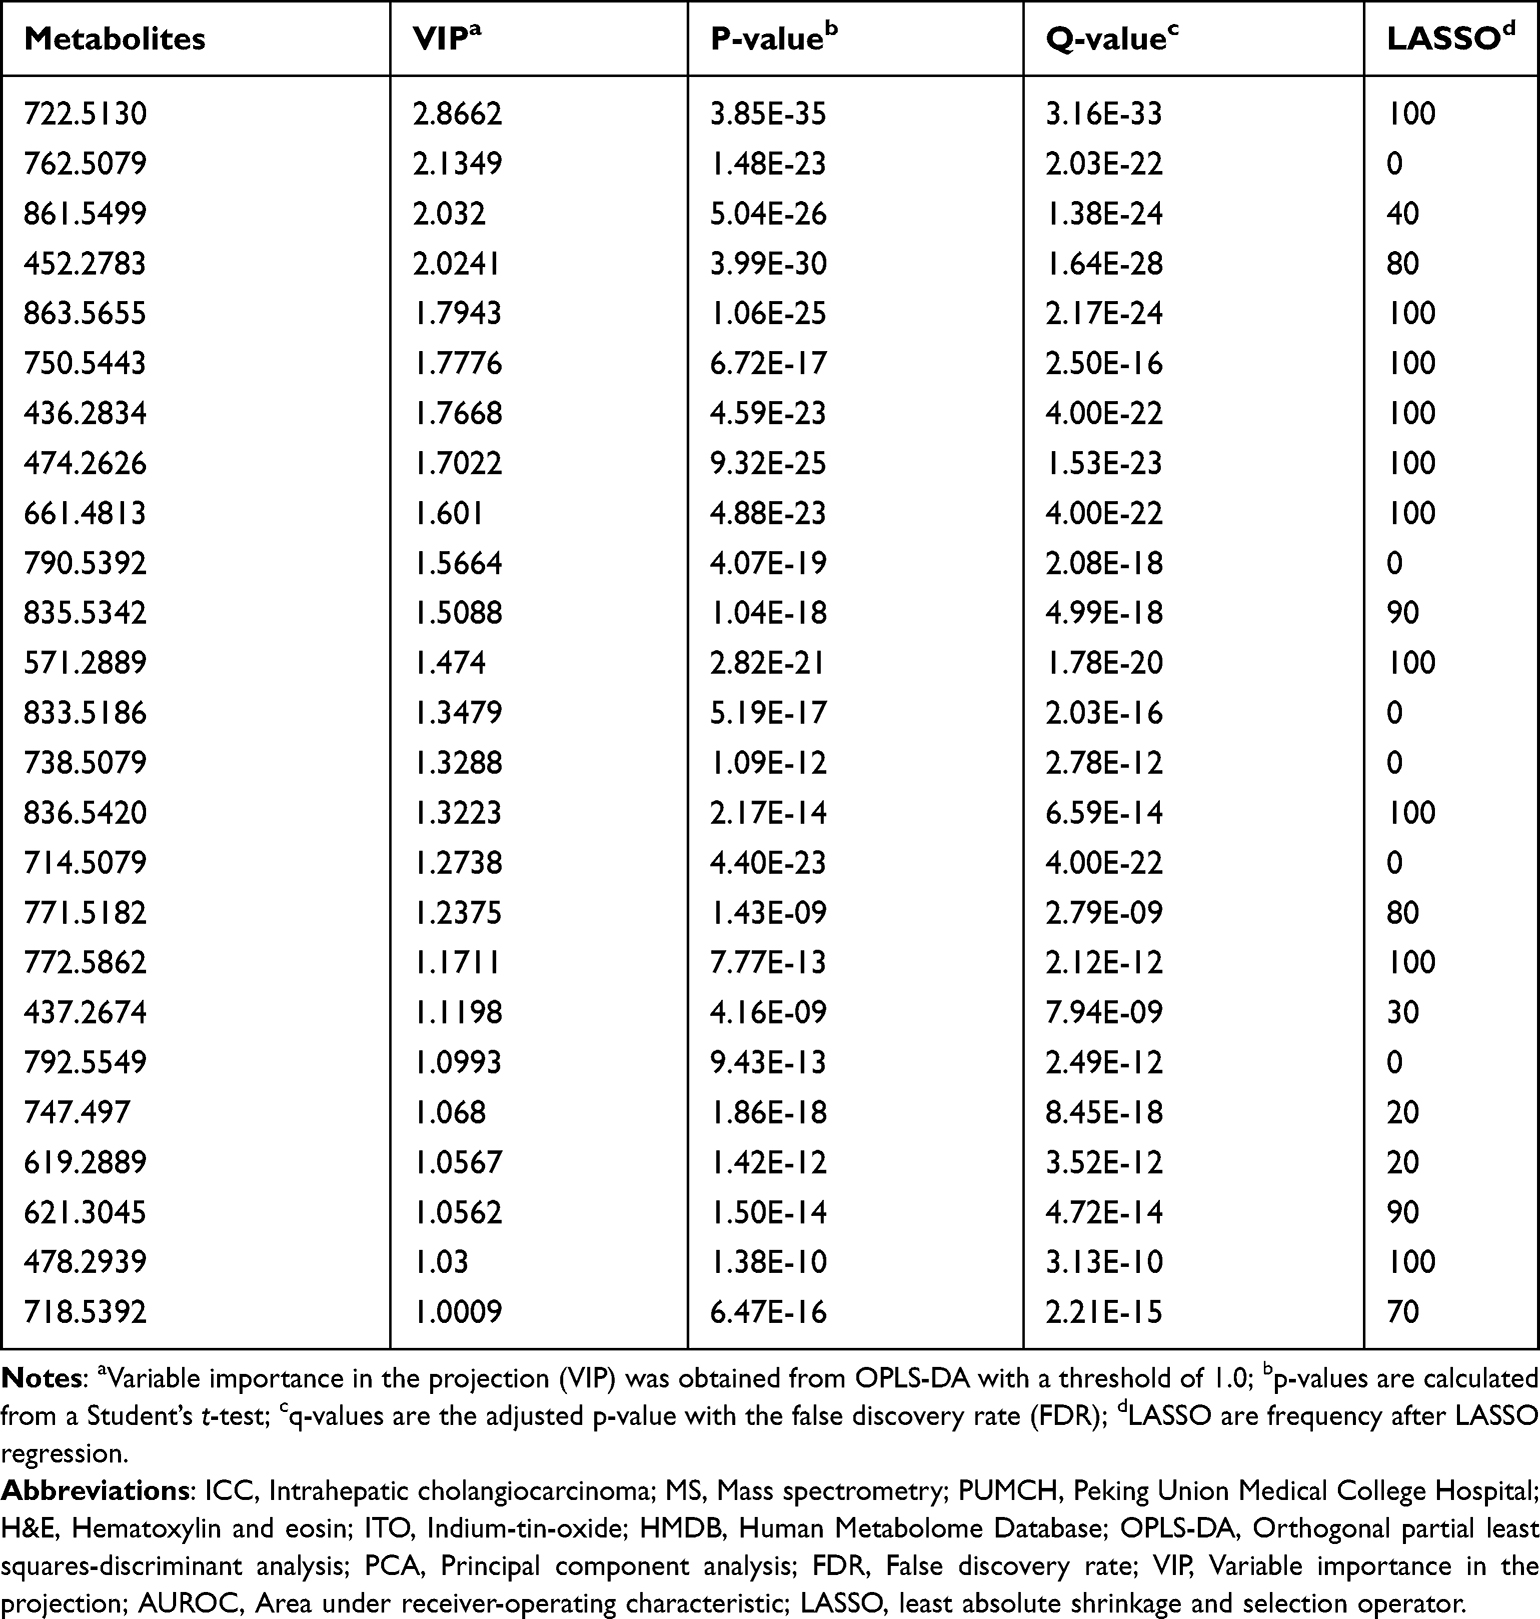 |
Table 1 Differentiating Metabolites Between Cancer Areas and Adjacent Areas Identified from the Learning Dataset |
Representative ion images of the 10 metabolites selected finally for discriminating tumor and non-tumor areas in the negative ion modes, with the corresponding H&E staining. In the H&E staining, the cancerous area circled with red line. In situ ion images of lipid metabolites are shown in right panel (Figure 2).
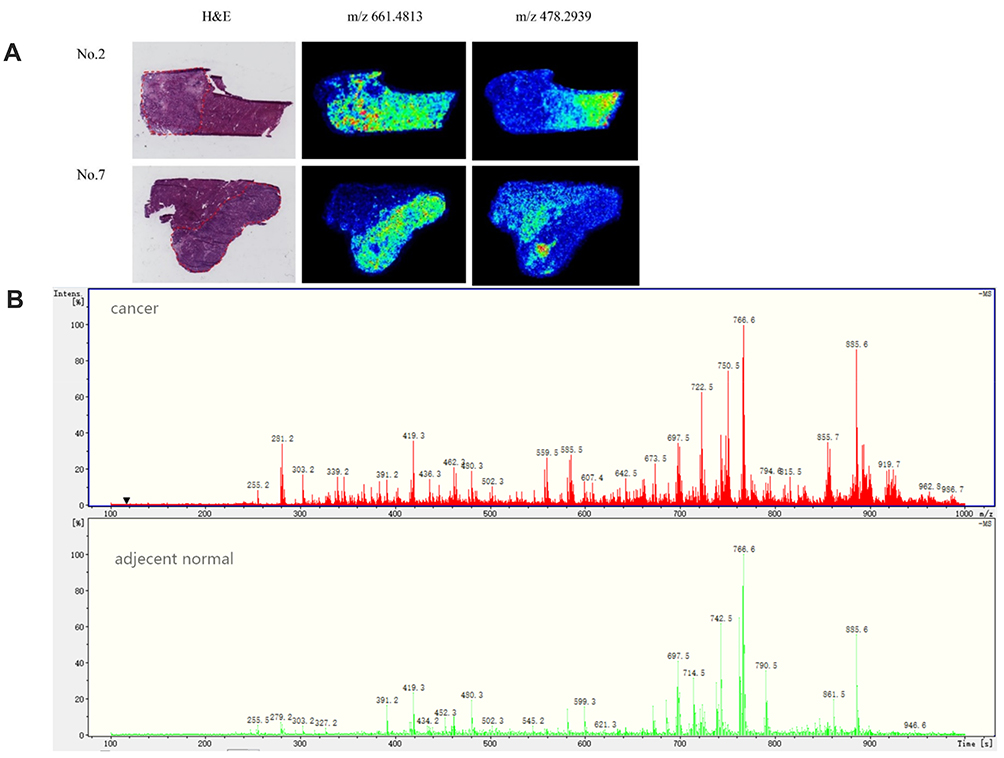 |
Figure 2 Representative H&E staining and in situ ion images of lipid metabolites. (A) Representative H&E staining (from Patient 2 and Patient 7) are shown in left panel, with the cancerous area circled with red line. In situ ion images of lipid metabolites are shown in right panel. MSI data were acquired with the spatial resolution of 200 mm. (B) Mass spectra of representative cancer and normal regions. |
Validation of the OPLS-DA Model
Validation of the OPLS-DA model was performed on the validation group. The predicted probability of each plot being a tumor area was calculated. The performance of the model was assessed by the area under receiver-operating characteristic (AUROC) curve, which reached 0.936 (95% CI: 0.906–0.966) in our model (Figure 3A).
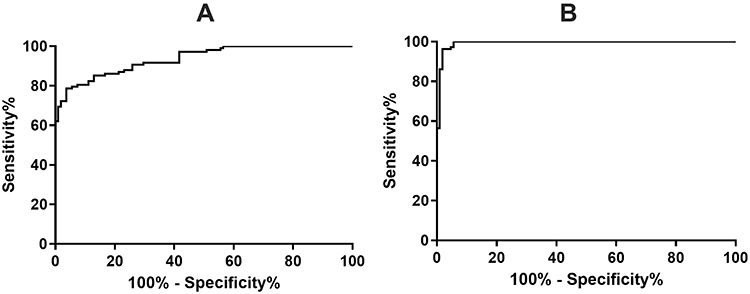 |
Figure 3 Receiver-operating characteristic curve of (A) the OPLSDA model and (B) the logistic regression model. (A) Receiver-operating characteristic curve of the OPLSDA model in discriminating of tumor and adjacent areas in the validation cohort, in an independent sample set. The area under the receiver-operating characteristic curve was 0.936. (B) Receiver-operating characteristic curve of the logistic regression model in discriminating of tumor and adjacent areas in the validation cohort, in an independent sample set. The area under the receiver-operating characteristic curve was 0.993. |
Logistic Regression Model
Further, a simple diagnostic model was also established. The 10 metabolites selected for differentiating tumor and non-tumor areas were imported into SPSS for logical regression. After univariate and multivariate analysis, the final diagnostic equation was obtained: y = 3.4*[m/z 436.2834] - 3.773*[m/z 474.2626] + 3.82*[m/z 661.4813] - 4.394*[m/z 863.5655] + 10.165. Then, Y-values were calculated for each sample in the validation set. The AUROC of the model reached 0.993 (95% CI: 0.985–0.999) in the validation group (Figure 3B).
Metabolites Relating with Clinical Staging
Compared with the non-tumor areas, the concentrations of FA (22:4), PA (P-18:0/0:0) and Glucosylceramide (d18:1/12:0) were detected to be higher in areas from the stage I patients, and even higher in areas from the stage II patients. The concentrations of LPA(16:0), PE(34:2), PE(36:4), PE(38:3), PE(40:6), PE(40:5) and LPE(16:0) showed a decreased trend from the non-tumor areas to areas from the stage I patients, and to areas from the stage II patients (Figure 4).
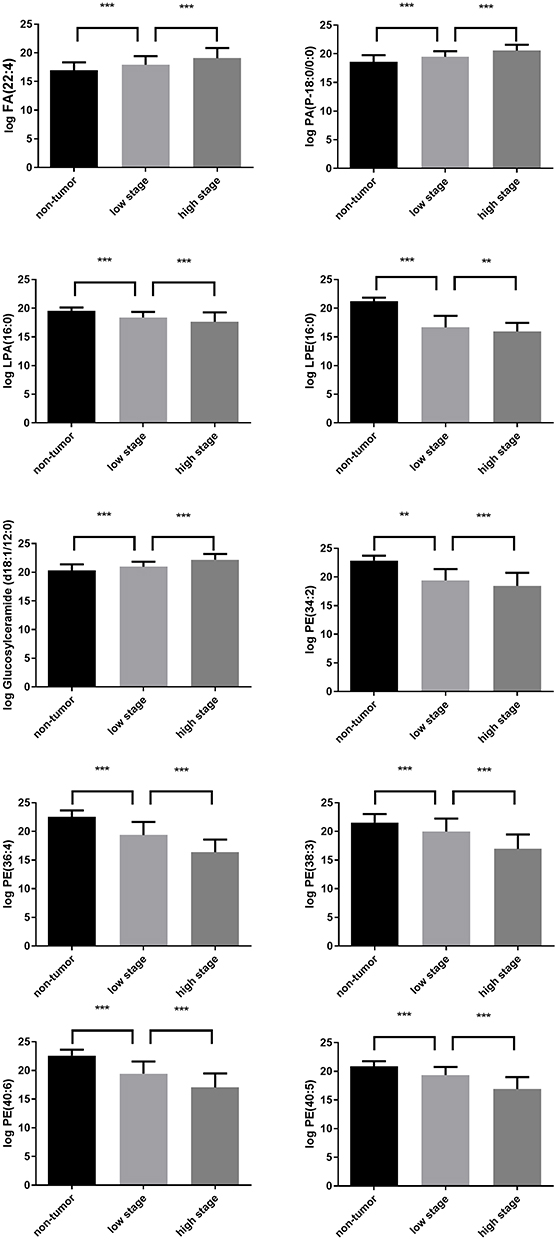 |
Figure 4 Comparison of non-tumor areas with tumor areas in different stages. Compared with the adjacent non-tumor area, three characteristic metabolites showed an increasing trend from stage I to stage II, while five other metabolites showed a decreasing trend from stage I to stage II. **P < 0.01; ***P < 0.001. |
Discussion
The present study identified lipid molecules in differentiating tumor tissue and adjacent tissue of ICC, established a discrimination logistic model which could be used as a classifier to classify tumor and non-tumor regions based on analysis in tumor margins and provided information for biomarker changes in ICC, and proposed to related lipid changes with clinical classification.
Mass spectrometric analysis of CC has been reported in many literatures, most studies focus on proteomics. Dos Santos found that vimentin may be a diagnostic marker of ICC.20 Apolipoprotein (28K m/z peak) in cholangiocarcinoma was found to be significantly lower than that in benign tumors and inflammation.21 It was also found that thymosin beta-4 was overexpressed in extrahepatic cholangiocarcinoma (ECC).22 However, there are few studies on lipid histology. Park et al found that the contents of phosphatidylcholine (pcs) 34:1 [m+h]+ (m/z 760.70) and PC 34:1 [m+na]+ (m/z 782.72) in the cancer epithelium were higher than those in the adjacent epithelium.23 The present study systemically evaluated lipid molecules in cholangiocarcinoma by MS, established a discrimination model based on logistic regression, respectively, and proposed to related lipid changes with clinical classification.
The ten lipids which were most significant included PE (P-16:0/20:4), PI (36:1), PE (P-18:0/20:4), PE (P-16:0/0:0), LPE (18:3), DG (38:6), LPI (16:0), PI (34:0), PE(38:1) and LPE(18:1). Most belong to dimethylphosphatidylethanolamine. Although each lipid group has 2–20 different chemical structures based on the existing KEGG database, we can still locate that glycerophospholipid metabolism pathway plays an important role. Phosphatidylinositol plays an important role in regulating differentiation,24 proliferation25 and apoptosis.26 It also participates in the process of anchoring proteins to the plasma membrane.27 The phosphoinositide phosphatidylinositol (4) phosphate [PtdIns(4)P] binds to GOLPH3. PtdIns(4)P is enriched at the trans-Golgi and recruits GOLPH3 to form a GOLPH3 complex and bind to myosin18A (MYO18A), which binds F-actin. This complex generates a pulling force to extract vesicles from the Golgi, interference with this GOLPH3 complex results in dramatically reduced vesicle trafficking. The GOLPH3 complex has been identified as a driver of cancer in humans, likely through multiple mechanisms that activate secretory trafficking.28 Our finding may be related to the origin of cholangiocarcinoma, and may be helpful for researchers to study the pathophysiological mechanism.29 Further verification of pathways can be achieved by immunohistochemistry and single-cell sequencing.
Then, our study established a model which yielded a great sensitivity and specificity to distinguish between tumor tissues and adjacent tissues. In breast cancer and renal cell, similar models were established and validated using metabolomic profiles.30,31 However, there were no such models for ICC. Thus, we firstly have identified several metabolic biomarkers for ICC and established an accurate and repeatable OPLSDA model which could clearly discriminate tumor from adjacent areas using these biomarkers. In addition, we obtained the most important ten lipids by Lasso regression and established a simple logistic regression model, which greatly improved the efficiency of the model and easily usage in clinical work. Our findings had several clinical values. First, it could be used as a classifier to classify tumor and non-tumor regions and contributed to analysis in tumor margins, which was thought a significant prognostic factor for ICC. Due to the separation of analyses from matrix by mass, the MS assay is characterized by its inherent selection and low interference,32 which might reach a more sensitivity for difficult distinguishing margin. It can also be used to help pathologists to judge whether the incision margin is positive, achieving better plan the treatment of individual patients. Second, it provides information for molecular changes in ICC. In the future, the changes of these molecules could be tested in serum of ICC patients and could provide convenient and sensitive biomarkers for detecting ICC patients.
Another finding of our work is the association of metabolic changes with clinical stages. Compared with adjacent area, the concentration of LPA(16:0), LPE(16:0), PE(34:2), PE(36:4), PE(38:3), PE(40:6) and PE(40:5) were detected to be lower in early stage tumor area, and keep decreased in late stage tumor area. The concentration of FA(22:4), PA(P-18:0/0:0) and Glucosylceramide(d18:1/12:0) were significantly elevated in tumor areas of those with early stage cancer, and keep increased in late stage ones. The different change in metabolic molecules in different stages of cancer was observed in breast cancer.23 However, to our knowledge, this is the first study evaluating the association of lipid markers with clinical stages in ICC. The staging system, which was assessed according to AJCC system, was well-known to be related with survival outcome.33 Thus, our results indicate that these markers are of great prognostic values.
One of the potential use of our results is the real-time analysis of lipids for the discrimination of tissues during surgeries. Previous research have demonstrated the use of mass spectrum coupled with a PIRL-based laser scalpel in discriminating different brain areas.34 Cancer screening of body fluids was the other possible way using mass spectrum which may improve the survival time prognosis of patients. The pathologic confirmation of the diagnosis is necessary before any non-surgical treatment and can be challenging in ICC. Endoscopic imaging and tissue sampling are often inadequate for molecular profiling, tissue sampling has reported high specificity but low sensitivity, and the highly desmoplastic nature of ICC limits the accuracy of cytological and pathological approaches. Liquid biopsy has received growing attention over the years given its promising applications in cancer patients.35 Previous studies showed that mass spectrometry determined a wide range of serum lipids biomarkers which reached high sensitivity and specificity to diagnose pancreatic cancer at an early stage, and are comparable to established diagnostic imaging methods.36 Our results might provide the potential role for liquid biopsy in patients with ICC.35,37
Our research has some limitations. First, future external validation using samples from multiple centers is in preparation. Second, the mechanisms underlying the changes of these metabolites are still uncertain, which needed future investigation. Last but not least, our samples size was small and we would perform validation in a larger group in the future.
Conclusion
The present study first systemically evaluated ten lipid molecules [m/z 722.5130], [m/z 863.5655], [m/z 436.2834], [m/z 474.2626], [m/z 661.4813], [m/z 750.5443], [m/z 571.2889], [m/z 836.5420], [m/z 772.5862] and [m/z 478.2939] in cholangiocarcinoma by MS which were most significant different between ICC and adjacent areas. Then, it established a discrimination logistic model y = 3.4*[m/z 436.2834] - 3.773*[m/z 474.2626] + 3.82*[m/z 661.4813] - 4.394*[m/z 863.5655] + 10.165 which could be used as a classifier to classify tumor and non-tumor regions based on analysis in tumor margins and provided information for biomarker changes in ICC. Last but not least, this study proposed to related lipid changes with clinical classification.
Acknowledgments
This research was supported by National Natural Science Foundation of China (No. 81972698) and Chinese Academy of Medical Sciences Initiative for Innovative Medicine (CAMS-2017-I2M-4-002). Qiao Chen, Jiayi Li and Lei Guo are co-first authors for this study. Xinting Sang and Yilei Mao are co-correspondence authors for this study.
Disclosure
The authors report no conflicts of interest in this work.
References
1. Poultsides GA, Zhu AX, Choti MA, et al. Intrahepatic cholangiocarcinoma. J Am Coll Surg. 2010;90:817–837.
2. Mavros MN, Economopoulos KP, Alexiou VG, et al. Treatment and prognosis for patients with intrahepatic cholangiocarcinoma: systematic review and meta-analysis. JAMA Surg. 2014;149:565. doi:10.1001/jamasurg.2013.5137
3. Mosadeghi S, Liu B, Bhuket T, et al. Sex-specific and race/ethnicity-specific disparities in cholangiocarcinoma incidence and prevalence in the U.S.: an updated analysis of the 2000–2011 surveillance, epidemiology, and end results registry. Hepatol Res. 2016;46:669–677. doi:10.1111/hepr.12605
4. Saha SK, Zhu AX, Fuchs CS, et al. Forty-year trends in cholangiocarcinoma incidence in the U.S.: intrahepatic disease on the rise. Oncologist. 2016;21:594–599. doi:10.1634/theoncologist.2015-0446
5. Banales JM, Cardinale V, Carpino G, et al. Expert consensus document: cholangiocarcinoma: current knowledge and future perspectives consensus statement from the European Network for the Study of Cholangiocarcinoma (ENS-CCA). Nat Rev Gastroenterol Hepatol. 2016;13:261.
6. Rizzo A, Frega G, Ricci AD, et al. Anti-EGFR monoclonal antibodies in advanced biliary tract cancer: a systematic review and meta-analysis. Vivo. 2020;34:479–488. doi:10.21873/invivo.11798
7. Massa A, Varamo C, Vita F, et al. Evolution of the experimental models of cholangiocarcinoma. Cancers. 2020;12:2308. doi:10.3390/cancers12082308
8. Rizzo A, Ricci AD, Brandi G. Pemigatinib: hot topics behind the first approval of a targeted therapy in cholangiocarcinoma. Cancer Treat Res Commun. 2021;27:100337. doi:10.1016/j.ctarc.2021.100337
9. Arentz G, Mittal P, Zhang C, et al. Applications of mass spectrometry imaging to cancer. Adv Cancer Res. 2017;134:27–66.
10. Cho WC. Mass spectrometry-based proteomics in cancer research. Expert Rev Proteomics. 2017;14:725–727. doi:10.1080/14789450.2017.1365604
11. Budhu A, Roessler S, Zhao X, et al. Integrated metabolite and gene expression profiles identify lipid biomarkers associated with progression of hepatocellular carcinoma and patient outcomes. Gastroenterology. 2013;144:1066–1075 e1. doi:10.1053/j.gastro.2013.01.054
12. Bassani-Sternberg M, Coukos G. Mass spectrometry-based antigen discovery for cancer immunotherapy. Curr Opin Immunol. 2016;41:9–17. doi:10.1016/j.coi.2016.04.005
13. Chen G, Li H, Qiu L, et al. Change of fucosylated IgG2 Fc-glycoforms in pancreatitis and pancreatic adenocarcinoma: a promising disease-classification model. Anal Bioanal Chem. 2014;406:267–273. doi:10.1007/s00216-013-7439-3
14. Balluff B, Hanselmann M, Heeren RM. Mass spectrometry imaging for the investigation of intratumor heterogeneity. Adv Cancer Res. 2017;134:201–230.
15. Han EC, Lee YS, Liao WS, et al. Direct tissue analysis by MALDI-TOF mass spectrometry in human hepatocellular carcinoma. Clin Chim Acta. 2011;412:230–239. doi:10.1016/j.cca.2010.09.021
16. Faouder JL, Gigante E, Léger T, et al. Proteomic landscape of cholangiocarcinomas reveals 3 different subgroups according to their localization and the aspect of non-tumor liver. Proteomics. 2019;13:1800128.
17. Lankisch TO, Jochen M, Negm AA, et al. Bile proteomic profiles differentiate cholangiocarcinoma from primary sclerosing cholangitis and choledocholithiasis. Gastroenterology. 2011;140:875–884. doi:10.1016/S0016-5085(11)60273-4
18. Farid SG, Craven RA, Jianhe P, et al. Shotgun proteomics of human bile in hilar cholangiocarcinoma. Proteomics. 2011;11:2134–2138. doi:10.1002/pmic.201000653
19. Reid S, Tibshirani R, Friedman J. A study of error variance estimation in lasso regression. Stat Sin. 2013;2013:35–67.
20. Dos Santos A, Court M, Thiers V, et al. Identification of cellular targets in human intrahepatic cholangiocarcinoma using laser microdissection and accurate mass and time tag proteomics. Mol Cell Proteom. 2010;9:1991–2004
21. Wang X, Dai S, Zhang Z, et al. Characterization of apolipoprotein A-I as a potential biomarker for cholangiocarcinoma. Eur J Cancer Care. 2009;18:625–635. doi:10.1111/j.1365-2354.2008.00965.x
22. Le Faouder J, Laouirem S, Alexandrov T, et al. Tumoral heterogeneity of hepatic cholangiocarcinomas revealed by MALDI imaging mass spectrometry. Proteomics. 2014;14:965–972. doi:10.1002/pmic.201300463
23. Park YS, Chong WY, Lee SC, et al. Lipid profiles for intrahepatic cholangiocarcinoma identified using matrix-assisted laser desorption/ionization mass spectrometry. Clinica Chimica Acta. 2011;412:1978–1982. doi:10.1016/j.cca.2011.07.008
24. Poli A, Billi AM, Mongiorgi S, et al. Nuclear phosphatidylinositol signaling: focus on phosphatidylinositol phosphate kinases and phospholipases C. J Cell Physiol. 2016;231:1645–1655. doi:10.1002/jcp.25273
25. Weber GF, Menko AS. Phosphatidylinositol 3-kinase is necessary for lens fiber cell differentiation and survival. Invest Ophthalmol Vis Sci. 2006;47:4490–4499. doi:10.1167/iovs.06-0401
26. Barberino RS, Santos JMS, Lins T, et al. Epigallocatechin-3-gallate (EGCG) reduces apoptosis of preantral follicles through the phosphatidylinositol-3-kinase/protein kinase B (PI3K/AKT) signaling pathway after in vitro culture of sheep ovarian tissue. Theriogenology. 2020;155:25–32. doi:10.1016/j.theriogenology.2020.05.037
27. Zewe JP, Miller AM, Sangappa S, et al. Probing the subcellular distribution of phosphatidylinositol reveals a surprising lack at the plasma membrane. J Cell Biol. 2020;219. doi:10.1083/jcb.201906127
28. Kuna RS, Field SJ. GOLPH3: a Golgi phosphatidylinositol(4)phosphate effector that directs vesicle trafficking and drives cancer. J Lipid Res. 2019;60:269–275. doi:10.1194/jlr.R088328
29. Kurz M, Brachvogel V, Matter H, et al. Insights into the bile acid transportation system: the human ileal lipid-binding protein-cholyltaurine complex and its comparison with homologous structures. Proteins Struct Funct Bioinform. 2010;50:312–328. doi:10.1002/prot.10289
30. Qiu Y, Zhou B, Su M, et al. Mass spectrometry-based quantitative metabolomics revealed a distinct lipid profile in breast cancer patients. Int J Mol Sci. 2013;14:8047–8061. doi:10.3390/ijms14048047
31. Farshidfar F, Weljie AM, Kopciuk KA, et al. A validated metabolomic signature for colorectal cancer: exploration of the clinical value of metabolomics. Br J Cancer. 2016;115:848–857. doi:10.1038/bjc.2016.243
32. Lassman ME, Mcavoy T, Chappell DL, et al. The clinical utility of mass spectrometry based protein assays. Clinica Chimica Acta. 2016;459:155–161. doi:10.1016/j.cca.2016.05.027
33. Olivier F, David F, Yves-Patrice LT, et al. AJCC 7th edition of TNM staging accurately discriminates outcomes of patients with resectable intrahepatic cholangiocarcinoma: by the AFC-IHCC-2009 study group. Cancer. 2011;117:2170–2177. doi:10.1002/cncr.25712
34. Wurlitzer M, Hessling E, Rinas K, et al. Mass spectrometric lipid profiles of picosecond infrared laser-generated tissue aerosols discriminate different brain tissues. Lasers Surg Med. 2020;52:228–234. doi:10.1002/lsm.23096
35. Lapitz A, Arbelaiz A, O’Rourke CJ, et al. Patients with cholangiocarcinoma present specific RNA profiles in serum and urine extracellular vesicles mirroring the tumor expression: novel liquid biopsy biomarkers for disease diagnosis. Cells. 2020;9:721. doi:10.3390/cells9030721
36. Wolrab D, Jirásko R, Cífková E, et al. Lipidomic profiling of human serum enables detection of pancreatic cancer. Nat Commun. 2022;13:124. doi:10.1038/s41467-021-27765-9
37. Rizzo A, Ricci AD, Tavolari S, et al. Circulating tumor DNA in biliary tract cancer: current evidence and future perspectives. Cancer Genomics Proteomics. 2020;17:441–452. doi:10.21873/cgp.20203
 © 2022 The Author(s). This work is published and licensed by Dove Medical Press Limited. The full terms of this license are available at https://www.dovepress.com/terms.php and incorporate the Creative Commons Attribution - Non Commercial (unported, v3.0) License.
By accessing the work you hereby accept the Terms. Non-commercial uses of the work are permitted without any further permission from Dove Medical Press Limited, provided the work is properly attributed. For permission for commercial use of this work, please see paragraphs 4.2 and 5 of our Terms.
© 2022 The Author(s). This work is published and licensed by Dove Medical Press Limited. The full terms of this license are available at https://www.dovepress.com/terms.php and incorporate the Creative Commons Attribution - Non Commercial (unported, v3.0) License.
By accessing the work you hereby accept the Terms. Non-commercial uses of the work are permitted without any further permission from Dove Medical Press Limited, provided the work is properly attributed. For permission for commercial use of this work, please see paragraphs 4.2 and 5 of our Terms.