")
Back to Journals » Advances and Applications in Bioinformatics and Chemistry » Volume 7
In silico structure-based screening of versatile P-glycoprotein inhibitors using polynomial empirical scoring functions
Authors Shityakov S, Förster C
Received 16 October 2013
Accepted for publication 15 November 2013
Published 24 March 2014 Volume 2014:7 Pages 1—9
DOI https://doi.org/10.2147/AABC.S56046
Checked for plagiarism Yes
Review by Single anonymous peer review
Peer reviewer comments 3
Sergey Shityakov, Carola Förster
Department of Anesthesia and Critical Care, University of Würzburg, Würzburg, Germany
Abstract: P-glycoprotein (P-gp) is an ATP (adenosine triphosphate)-binding cassette transporter that causes multidrug resistance of various chemotherapeutic substances by active efflux from mammalian cells. P-gp plays a pivotal role in limiting drug absorption and distribution in different organs, including the intestines and brain. Thus, the prediction of P-gp–drug interactions is of vital importance in assessing drug pharmacokinetic and pharmacodynamic properties. To find the strongest P-gp blockers, we performed an in silico structure-based screening of P-gp inhibitor library (1,300 molecules) by the gradient optimization method, using polynomial empirical scoring (POLSCORE) functions. We report a strong correlation (r2=0.80, F=16.27, n=6, P<0.0157) of inhibition constants (Kiexp or pKiexp; experimental Ki or negative decimal logarithm of Kiexp) converted from experimental IC50 (half maximal inhibitory concentration) values with POLSCORE-predicted constants (KiPOLSCORE or pKiPOLSCORE), using a linear regression fitting technique. The hydrophobic interactions between P-gp and selected drug substances were detected as the main forces responsible for the inhibition effect. The results showed that this scoring technique might be useful in the virtual screening and filtering of databases of drug-like compounds at the early stage of drug development processes.
Keywords: ATP-binding cassette transporter, P-gp inhibitors, multidrug resistance, molecular docking, POLSCORE
Introduction
P-glycoprotein (P-gp) is a member of the ATP (adenosine triphosphate)-binding cassette multidrug transporter superfamily. It mediates the removal of xenobiotic agents from living cells by a P-gp-mediated efflux mechanism, a major cause of multidrug resistance (MDR).1,2 P-gp plays an important role in limiting drug absorption and distribution in different organs, including the intestines and the brain (blood–brain barrier), where it is extensively distributed and expressed.3,4 P-gp is a 170 kDa transmembrane protein, which includes cytosolic nucleotide-binding domain together with N-terminal and C-terminal halves. Each half in turn is comprised of membrane spanning and transmembrane domains.5
P-gp inhibitors are mainly weakly amphiphilic or hydrophobic substances such as chemotherapeutics, steroid hormones, different antibiotics, and anti-HIV (anti-human immunodeficiency virus) protease inhibitors.6–8 Since P-gp can affect the pharmacokinetics and pharmacodynamics of its substrates, increasing attempts were being made to search for potential P-gp inhibitors at the early stage of drug discovery and development processes.9
A number of in vitro assays for P-gp-oriented drug screening, such as cell-based transwell transport, radioactivity-labeled ligand binding, and drug permeability, have been largely utilized to identify the potential P-gp inhibitor candidates10 and assess P-gp–drug interactions.11 However, due to their expense and time, the in vitro methods are not entirely suitable for the screening of large databases of drug-like chemical compounds. Primarily, these methods are usually used at the later stages of drug development processes, after the thorough structure-based virtual screening of extensive databases of bioactive, drug-like, small molecules. Therefore, in silico screening, based on different algorithms implemented for molecular docking, to predict P-gp inhibitors has paved the road to a rational drug design and screening process.12–14 On the other hand, to harness the discovery of the strongest P-gp blockers, high-resolution, crystallographic molecular structures of P-gp would improve a molecular docking precision for in silico prediction models.
Although a variety of molecular docking models for P-gp inhibitors have been successfully used for prediction of receptor–ligand interactions,14–16 there is no general scoring function regarding the filtration and selection of the best hits. The empirical scoring functions, such as those used in AutoDock17 (Scripps Research Institute, San Diego, CA, USA), AutoDock Vina18 (Scripps Research Institute), and others are most widely applied to estimate the Gibbs free energy of binding (ΔG).19–21 They are based on the counting of the number of hydrophobic and hydrophilic contacts and H-bonds between the P-gp receptor and its ligand.22 Therefore, to find the strongest P-gp blockers, we performed in silico structure-based screening of a P-gp inhibitor database via gradient optimization method, using the appropriate scoring techniques of AutoDock Vina and polynomial empirical scoring (POLSCORE) functions to calculate binding affinities and to correlate them to the experimentally determined half maximal inhibitory concentration (IC50) values.
Computational methods
The electron diffraction of murine P-gp as a holo-structure (3G60) at 3.8 Å resolution with a cyclic-tris-(R)-valineselenazole (QZ59-RRR) ligand5 was retrieved from the Protein Data Bank as a PDB file. The P-gp molecule was processed for the ligand extraction and subjected to the initial molecular dynamics refinement by using the FG-MD (Fragment-Guided Molecular Dynamics) server.23 The VADAR (Volume, Area, and Dihedral Angle Reporter) server24 was implemented for stereochemical validation of the P-gp molecule to investigate the φ–ψ dihedral angles in a Ramachandran plot. Altogether, observed statistics showed that 70% and 23% of all residues were in core and allowed regions before, 82% and 12% after the molecular dynamics refinement. The expected values for the comparison were 90% and 7%, respectively, for the same regions obtained elsewhere, from the literature.25,26
The P-gp inhibitor database included 1,300 molecules, which were assembled by the ADME (absorption, distribution, metabolism, and excretion) research team from the Functional Nano and Soft Materials Laboratory (FUNSOM, Suzhou, People’s Republic of China) and distributed through the scientific community for virtual screening and analysis.27
Prior to the virtual screening procedure, PyRx software (Scripps Research Institute)28 was used to optimize the dataset. Gasteiger charges were added, and polar hydrogen atoms were assigned. The rotatable bonds were set up, and SDFs (structure-data files) were converted into PDBQT (Protein Data Bank, Partial Charge [Q], and Atom Type [T]) format.
The QZ59-RRR-associated binding site was reconstructed as a visual representation of the solvent-excluded molecular surface, known as the Connolly surface,29,30 by MOE 2009.10 (Chemical Computing Group, Montreal, Canada) modeling software. The solid molecular surface was generated with 1.4 Å of probe sphere radius and within 4.5 Å from the ligand atoms (Figure 1).
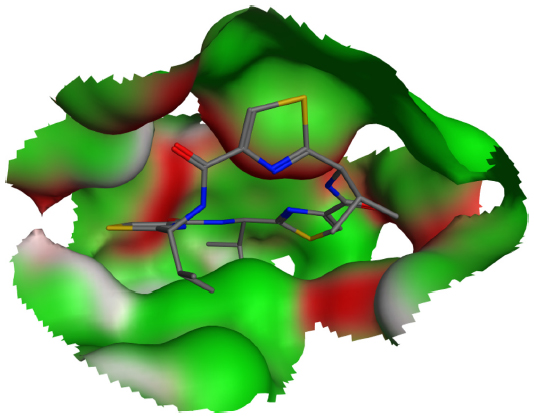 | Figure 1 QZ59-RRR-associated binding pocket in the crystalline structure of murine P-glycoprotein. The shown molecular surface is color-coded as follows: H-bonding areas are white; and hydrophobic and mild polar areas are colored in green and red, respectively. Hydrogen atoms are omitted for clarity. |
Rigid-flexible molecular docking was applied to the center of the QZ59-RRR-associated binding cavity with the AutoDock Vina docking engine,18 adopted for a structure-based virtual screening via the iDOCK (Department of Computer Science and Engineering, Chinese University of Hong Kong, Hong Kong) modification,31 using the following Cartesian coordinates: x =19.11 Å, y =52.37 Å, and z =−0.30 Å. The docking grid with a dimension size of 30 Å ×30 Å ×30 Å was used in the study. The AutoDock Vina output results represented the docking scores as ΔG values. They were further converted to the predicted inhibition constants (Kipred). The Kipred values for analyzed docking poses were calculated from the ΔG parameters as follows:
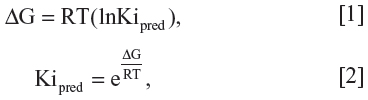
where R (gas constant) is 1.98 cal*(mol*K)−1, and T (room temperature) is 298.15 Kelvin.
The ΔG1–ΔG3 binding affinity predictions were made for a human homology model, a mouse 3G60 model, and a mouse 3G61 model of P-gp using the same docking method and support vector machine algorithm integrated into the Althotas virtual laboratory webserver (Virtua Drug Ltd, Budapest, Hungary). The affinities were further converted in a similar fashion to their corresponding inhibition constants (Ki1[pKi1]–Ki3[pKi3]).
The docked conformations were ranked using the POLSCORE algorithm based on 25 POLSCORE functions to evaluate binding affinity from the P-gp–ligand complexes by calculated pKi values (pKiPOLSCORE). The thorough scoring calibration has been previously performed to use geometric parameters, calculated from the atomic coordinates, to evaluate the experimental pKd (pKi) values as closely as possible to a training set composed of hundreds of co-crystallized protein–ligand complexes. The weights obtained from this training set were used to build appropriate POLSCORE functions.32
The IC50-to-Ki converter was used to compute Ki values from experimentally determined IC50 values for inhibitors of proteins and enzymes that obey classic Michaelis-Menten kinetics of protein–ligand interactions.33 The IC50 values were obtained from the study of Keogh and Kunta as determined when investigating the inhibition of human P-gp transport of 30 nM [3H]-digoxin.34 The values were converted into the experimental inhibition constant values (Kiexp or pKiexp) according to the protein–inhibitor interaction equation for competitive species:35
where P0 is free protein at 0% inhibition (positive control), L50 is free ligand at 50% inhibition, IC50 is free inhibitor at 50% inhibition, and Kd is the dissociation constant. The default parameters for protein concentration (P =0.03 μM) and dissociation constant (Kd =0.0179 μM) were used. The ligand concentration (L =2.0 μM) was specified according to the GF120918 compound’s ability to achieve the entire P-gp inhibition.34
Molecular graphics and visualization were performed with the LigPlot+ program (EMBL-EBI, Wellcome Trust Genome Campus, Hinxton, UK) in order to build two-dimensional interaction diagrams from three-dimensional coordinates.36 Statistical analyses were performed using a linear regression analysis, followed by graphic representation using GraphPad Prism v.4 (GraphPad Software, San Diego, CA, USA).
Results and discussion
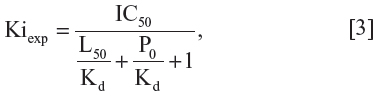
Our search for a strong inhibitor focused on an inhibitor that allows for better intestinal drug absorption and blood–brain barrier transfer after inhibition. We wanted to improve inhibitor selection by extensive in silico prescreening. For this, we considered the P-gp inhibitor dataset, including 1,300 molecules, among which 796 molecules (61.2%) were P-gp inhibitors, and 504 molecules (38.8%) were P-gp non-inhibitors (Supplementary material 1). The experimental data were retrieved and compiled from 104 pieces of published literature to increase the molecular diversity of the database. Data from Ramu and Ramu37,38 (347 molecules) and Bakken and Jurs39 (609 molecules) were important sources of the P-gp inhibitor dataset. The experimental ratio for MDR reversal agents was used as a determining parameter of whether a compound is an inhibitor.27 Since the holo-P-gp structure does not bind ligands, an inward-facing apo-P-gp conformation was chosen as a reliable drug-binding model. This conformation represents an initial stage of the transport cycle that is competent for inhibitor binding.5 Therefore, we screened the P-gp inhibitor database against the binding site associated with the removed QZ59-RRR ligand of murine P-gp protein by calculating the Gibbs free energy of binding. A standard rigid-flexible AutoDock Vina technique produced two main results: a particular conformational sampling as a docking pose of the ligand molecule within the binding site, and an affinity (ΔG) describing the receptor–ligand interaction strength. All docking poses were ranked according to their ΔG values, which ranged from −13.904 to −1.682 kcal*mol−1 (Supplementary material 2). To detect the false-positive docking results, we selected the top-ranked 120 compounds with minimal ΔG values, ranging from −13.904 to −10.002 kcal*mol−1. Of these, 106 (88.3%) were P-gp inhibitors, with a mean value of −10.62 kcal*mol−1 and a standard deviation of 0.57 kcal*mol−1, and 14 molecules (11.7%) were P-gp non-inhibitors, with a mean value of −10.74 kcal*mol−1 and a standard deviation of 0.96 kcal*mol−1 (Figure 2A). To detect the false-negative docking results, we selected the bottom-ranked 150 compounds with maximal ΔG values from −6.998 to −1.682 kcal*mol−1. Of these, 40 (26.7%) were P-gp inhibitors, with a mean value of −6.58 kcal*mol−1 and a standard deviation of 0.37 kcal*mol−1, and 110 molecules (73.3%) were P-gp non-inhibitors, with a mean value of −6.28 kcal*mol−1 and a standard deviation of 0.77 kcal*mol−1 (Figure 2B). These results indicated that in almost 90% of top-ranked compounds, virtual screening worked better at predicting the P-gp inhibitory potencies than separating non-inhibitors for bottom-ranked molecules (substances with high ΔG values), which might be P-gp substrates with a propensity to attach to the P-gp binding cavity. In addition, the area under the receiver operating characteristic curve (AUC) was also examined since the true positive and the true negative are known in this study.40 The result showed a good performance for the AutoDock Vina docking run, with an AUC value of 0.62 and a standard error of 0.048 (P<0.032); while a random selection performance presented with a 0.5 AUC value (Figure 3).
 | Figure 2 P-gp inhibitor/non-inhibitor clustering of chemical compounds based on the minimal and maximal ΔG values to detect false-positive (A) and false-negative (B) results. |
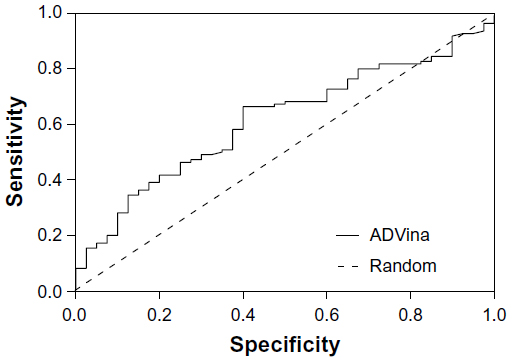 | Figure 3 ROC curve of the AutoDock Vina (Scripps Research Institute, San Diego, CA, USA) screening test for the bottom-ranked 150 compounds. |
The P-gp inhibitor D559 and polypeptide antibiotic actinomycin D were associated with the best binding modes, which represent the minimal ΔG values: −13.904 and −13.126 kcal*mol−1 (−9.1 kcal*mol−1 for QZ59-RRR) because of the strong binding affinity and intermolecular forces between P-gp receptor and its inhibitor. The D559 compound was evaluated as a P-gp inhibitor in the database via experimental data mining, while actinomycin D was not.27 However, actinomycin D was previously determined as a P-gp substrate, and its P-gp-mediated efflux was substantially inhibited in MDR cells by the monoclonal antibody (UIC2 clone) against the extracellular epitope of P-gp.41 Moreover, this polypeptide antibiotic might also bind at high capacity to the P-gp molecule due to its enhanced active efflux mechanism observed with adriamycin as part of a functioning MDR for these different classes of drugs.42
In the next step, the docked conformations were further separated using POLSCORE to evaluate a ligand binding affinity from P-gp–ligand complexes by calculating the pKiPOLSCORE values for selected P-gp inhibitors (n=6). The experimental inhibitory potencies (IC50 or pIC50) of the inhibitors GF120918, itraconazole, ketoconazole, astemizole, quinidine, and verapamil were transformed into inhibition constants (Kiexp or pKiexp) for further comparison with predicted pKiPOLSCORE (Table 1) and other predicted pKi values, such as pKipred, pKi1, pKi2, and pKi3 (Tables 2 and 3), calculated from appropriate ΔG parameters. However, the Kiexp calculation derived from Equation 3 has taken into consideration that the range of inhibitor potencies resolved in fluorescence polarization-based binding assay is limited by the affinity of the fluorescent ligand. In other words, as the Kd value of the fluorescent ligand decreases, the range of resolvable inhibitor potency increases. Therefore, it is not feasible with this method to correctly determine Ki values for inhibitors with binding affinities higher than the fluorescent ligand because of the assay constraint.43
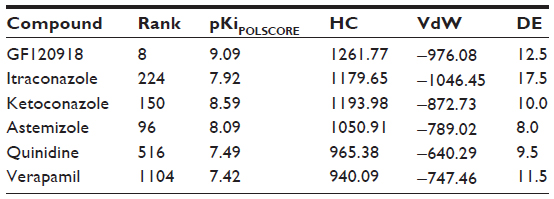 | Table 1 Predicted (pKiPOLSCORE) parameters for P-gp selected inhibitors calculated from POLSCORE functions |
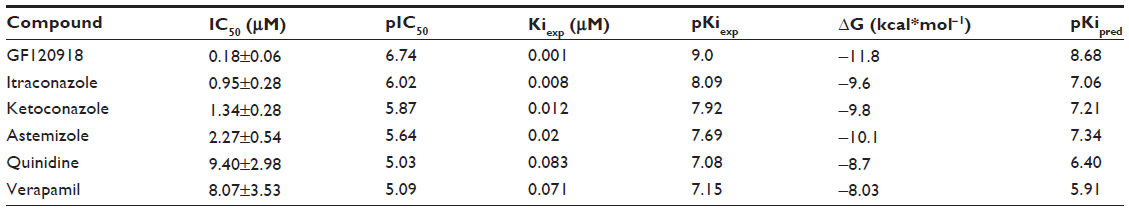 | Table 2 Experimental (pKiexp) and predicted (pKipred) parameters for selected P-gp inhibitors calculated from IC50 and ΔG values |
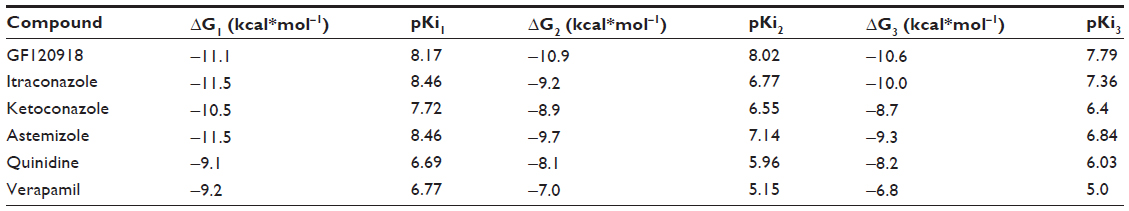 | Table 3 Predicted (pKi1–pKi3) parameters for selected P-gp inhibitors calculated from ΔG1–ΔG3 values |
Using a linear regression fitting technique, a strong correlation was observed for our predicted values and experimental results: r2=0.89, F=32.67, P<0.0046 for pKipred; r2=0.80, F=16.27, P<0.0157 for pKiPOLSCORE; r2=0.79, F=14.99, P<0.0175 for pKi2 (mouse 3G60 model); and r2=0.76, F=12.54, P<0.0240 for pKi3 (mouse 3G61 model) (Figure 4A–E). However, the true pKiPOLSCORE values lie within predictive range closer to the pKiexp determinants, at least for some of the compounds, such as GF120918 (9.09 and 9.0), itraconazole (7.92 and 8.10), and astemizole (8.09 and 7.96).
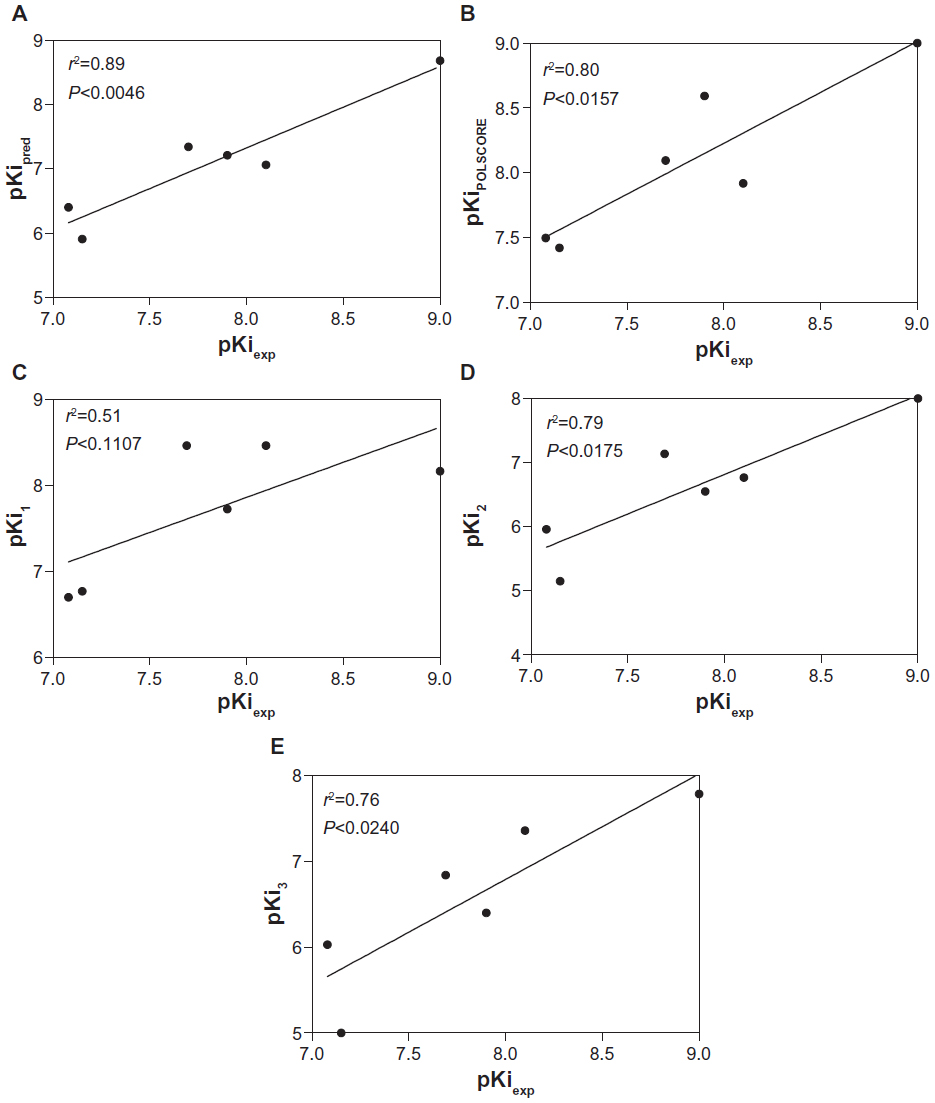 | Figure 4 Relationship between experimental (pKiexp) and predicted pKi values using linear regression analysis to measure correlation strength for examined chemical compounds. The predicted values were calculated from the iDOCK runs (Department of Computer Science and Engineering, Chinese University of Hong Kong, Hong Kong) (pKipred) and POLSCORE (pKiPOLSCORE) (A and B). The Althotas virtual laboratory webserver (Virtua Drug Ltd, Budapest, Hungary) was used to estimate the inhibition constants (pKi1–pKi3) applying the human homology and mouse P-gp models, respectively (C–E). |
On the other hand, the pKi1 value, predicted for the human homology P-gp model, was shown to correlate poorly with experimental inhibition constants (r2=0.51, F=4.17, P<0.1107) (Figure 4C). This low correlation might be explained primarily by the use of the human P-gp homology model as a receptor molecule with a substantial difference in the complex geometry of the binding cavity from the mouse structure. Regardless of a high amount of amino acid conservation between the human and murine P-gp structures, the deviations were established with 13% of sequence identity within the P-gp binding cavity.14 Interestingly, pKi2 showed better correlating strength than pKi3 because of the better 3G60 model optimization used in structure-based virtual screening.
The binding modes for the selected P-gp inhibitors are shown in Figure 5 as two-dimensional schematic diagrams as they revealed very clear ligand occupancies within the P-gp binding pocket. As all of the inhibitors occupy the binding site well, the majority of the contacts between the P-gp binding site and selected substances are nonpolar, making use of the hydrophobic protein residues in the binding pocket. Aller et al5 mentioned the fact that certain amino acid residues contact cyclic hexapeptide inhibitors, but the functional role of these residues in binding to each inhibitor is different. As expected, all analyzed ligands utilized different binding modes with different amino acid residues involved due to structural and conformational mismatches. The active site associated with the QZ59-RRR ligand is composed of amino acid residues, such as Met88, Phe332, Ile338, Phe338, Gln721, Tyr949, Phe724, Phe974, Val978, Tyr303, Phe728, Ser975, and Leu335. As most of the amino acid residues in the P-gp active site are hydrophobic, they are, therefore, involved in strong hydrophobic interactions with the co-crystallized QZ59-RRR ligand.
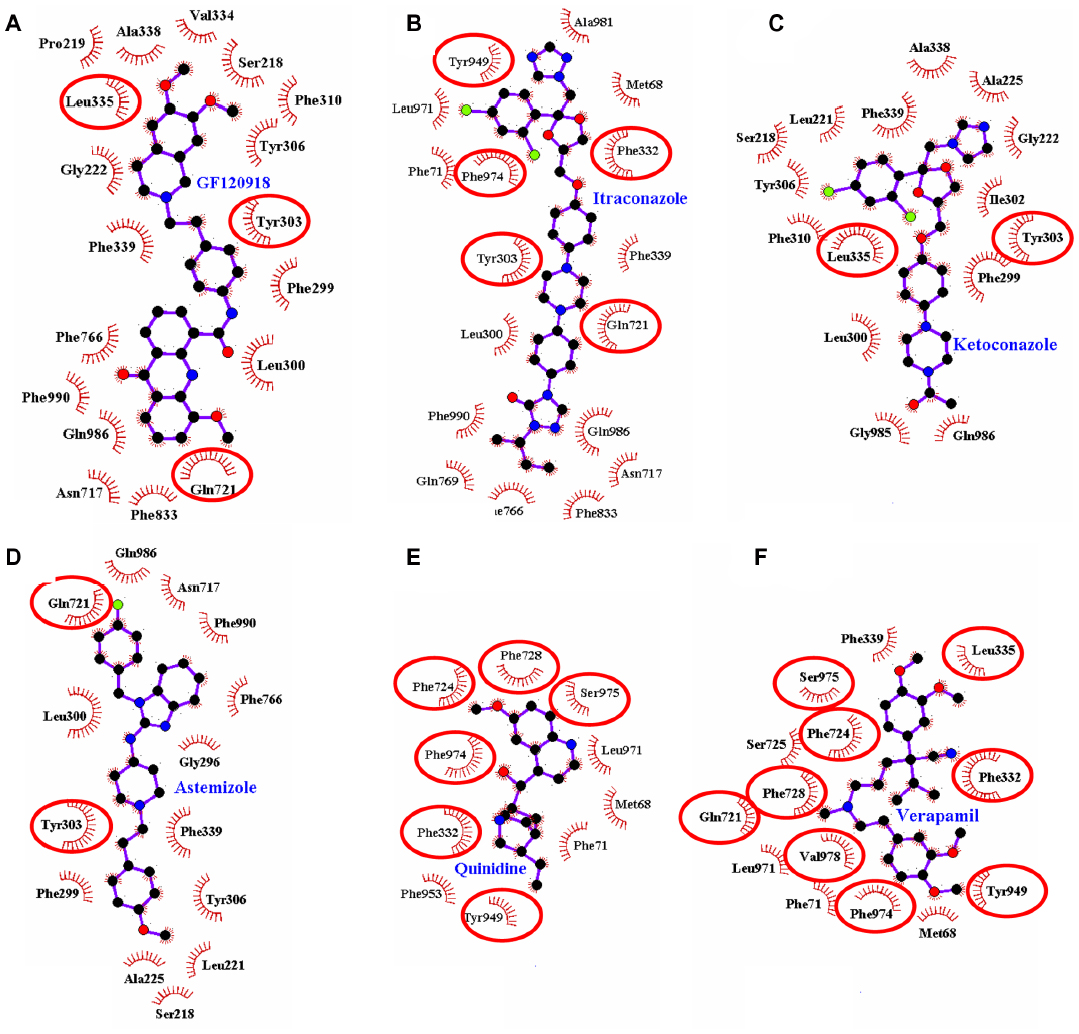 | Figure 5 Receptor–ligand interaction diagrams for six binding sites of the same protein (murine 3G60 P-glycoprotein) each with a different ligand molecule bond. The ligands are: (A) GF120918, (B) itraconazole, (C) ketoconazole, (D) astemizole, (E) quinidine, and (F) verapamil. The spoked arcs represent protein residues making nonbonded (hydrophobic) contacts with the ligand. The contacted ligand atoms are shown with spokes radiating back. The red ellipses in each plot indicate protein residues that are in common to those associated with the QZ59-RRR ligand. |
To find the similarities in binding modes for selected P-gp inhibitors and the QZ59-RRR ligand, we tried to find common amino acid residues involved in hydrophobic interactions. Taken together, we found that quinidine and verapamil interact with the P-gp protein in a similar fashion, indicating protein residues that are in common to those associated with the cyclic hexapeptide inhibitor used as a reference molecule (Figure 5E and F). These ligands may occupy very similar and overlapping binding regions, while the rest of the ligands bind to different regions within the QZ59-RRR-associated binding site.
Interestingly, both important Phe724 and Val978 residues are present in the interaction. It has been previously shown that these residues in mice and Phe728/Val982 in humans are playing pivotal roles in P-gp protection from MTS (methanethiosulfonate) labeling by verapamil, indicating their importance for drug binding.44,45
Additionally, due to the hydrophobic effect, the number of aromatic rings in selected molecules might also play a role in establishing the π–π stacking interactions between them and aromatic residues of P-gp. In this regard, the GF120918 compound is composed of a maximal number of aromatic rings (four) to be driven by a significant contribution from stacking interactions between its rings and the aromatic bases of Phe299, 310, 766, and 833, and Tyr303 and 306 residues. The other molecules include three aromatic rings for itraconazole and astemizole, two rings for ketoconazole and verapamil, and one ring for quinidine. Hence, it can be concluded that the presence of aromatic rings involved in the π–π stacking interactions is also important for the binding activity of the inhibitors.
Conclusion
In this current study, we report an extensive in silico structure-based screening of 1,300 different P-gp inhibitors by the gradient optimization method, using POLSCORE functions. On the basis of the large amount of data on versatile P-gp inhibitors, the filtering and ranking of chemical compounds was performed and examined systematically. The use of AutoDock Vina, together with POLSCORE, to estimate the pKi values for P-gp–inhibitor complexes was concomitant with experimentally determined affinities (IC50 or pIC50) for GF120918, itraconazole, ketoconazole, astemizole, quinidine, and verapamil compounds. A strong correlation (r2=0.80, F=16.27, n=6, P<0.0157) was observed for inhibition constants (Kiexp or pKiexp) calculated from experimental IC50 values and POLSCORE-predicted constants (KiPOLSCORE or pKiPOLSCORE) using a linear regression fitting technique. The hydrophobic forces involved in the interaction between the P-gp protein and analyzed molecules largely contributed to the inhibition effect. To our knowledge, this is the first attempt to filter and examine a large P-gp inhibitor database by gradient optimization docking algorithm combined with POLSCORE functions.
Acknowledgments
Special thanks are extended to Dr Nigel Aminake from Aachen University and Anna Poon from the City College of New York for their assistance in the paper’s writing. The authors are also grateful to the BMBF (Bundesministerium für Bildung und Forschung) for their support of this work by providing the BMBF01 grant to Carola Förster.
Disclosure
The authors report no conflicts of interest in this work.
References
Gottesman MM, Fojo T, Bates SE. Multidrug resistance in cancer: role of ATP-dependent transporters. Nat Rev Cancer. 2002;2(1):48–58. | |
Alibert-Franco S, Pradines B, Mahamoud A, Davin-Regli A, Pagès JM. Efflux mechanism, an attractive target to combat multidrug resistant Plasmodium falciparum and Pseudomonas aeruginosa. Curr Med Chem. 2009;16(3):301–317. | |
Potschka H. Modulating P-glycoprotein regulation: future perspectives for pharmacoresistant epilepsies? Epilepsia. 2010;51(8):1333–1347. | |
Mizutani T, Nakamura T, Morikawa R, et al. Real-time analysis of P-glycoprotein-mediated drug transport across primary intestinal epithelium three-dimensionally cultured in vitro. Biochem Biophys Res Commun. 2012;419(2):238–243. | |
Aller SG, Yu J, Ward A, et al. Structure of P-glycoprotein reveals a molecular basis for poly-specific drug binding. Science. 2009;323(5922):1718–1722. | |
Ueda K, Cardarelli C, Gottesman MM, Pastan I. Expression of a full-length cDNA for the human ‘‘MDR1’’ gene confers resistance to colchicine, doxorubicin, and vinblastine. Proc Natl Acad Sci U S A. 1987;84:3004–3008. | |
Ambudkar SV, Kimchi-Sarfaty C, Sauna ZE, Gottesman MM. Pglycoprotein: from genomics to mechanism. Oncogene. 2003;22:7468–7485. | |
Sauna ZE, Kim IW, Ambudkar SV. Genomics and the mechanism of P-glycoprotein (ABCB1). J Bioenerg Biomembr. 2007;39:481–487. | |
Shityakov S, Salvador E, Förster C. In silico, in vitro, and in vivo methods to analyse drug permeation across the blood–brain barrier: a critical review. OA Anaesthetics. 2013;1(2):13. | |
Adachi Y, Suzuki H, Sugiyama Y. Comparative studies on in vitro methods for evaluating in vivo function of MDR1 P-glycoprotein. Pharm Res. 2001;18(12):1660–1668. | |
Balimane PV, Patel K, Marino A, Chong S. Utility of 96 well Caco-2 cell system for increased throughput of P-gp screening in drug discovery. Eur J Pharm Biopharm. 2004;58(1):99–105. | |
Matsson P, Pedersen JM, Norinder U, Bergström CA, Artursson P. Identification of novel specific and general inhibitors of the three major human ATP-binding cassette transporters P-gp, BCRP and MRP2 among registered drugs. Pharm Res. 2009;26(8):1816–1831. | |
Klepsch F, Chiba P, Ecker GF. Exhaustive sampling of docking poses reveals binding hypotheses for propafenone type inhibitors of P-glycoprotein. PLoS Comput Biol. 2011;7(5):e1002036. | |
Dolghih E, Bryant C, Renslo AR, Jacobson MP. Predicting binding to p-glycoprotein by flexible receptor docking. PLoS Comput Biol. 2011;7(6):e1002083. | |
Bikadi Z, Hazai I, Malik D, et al. Predicting P-glycoprotein-mediated drug transport based on support vector machine and three-dimensional crystal structure of P-glycoprotein. PLoS One. 2011;6(10):e25815. | |
Kothandan G, Gadhe CG, Madhavan T, Choi CH, Cho SJ. Docking and 3D-QSAR (quantitative structure activity relationship) studies of flavones, the potent inhibitors of p-glycoprotein targeting the nucleotide binding domain. Eur J Med Chem. 2011;46(9):4078–4088. | |
Goodsell DS, Morris GM, Olson AJ. Automated docking of flexible ligands: applications of AutoDock. J Mol Recognit. 1996;9(1):1–5. | |
Trott O, Olson AJ. AutoDock Vina: improving the speed and accuracy of docking with a new scoring function, efficient optimization, and multithreading. J Comput Chem. 2010;31(2):455–461. | |
Hill AD, Reilly PJ. A Gibbs free energy correlation for automated docking of carbohydrates. J Comput Chem. 2008;29(7):1131–1141. | |
Shityakov S, Dandekar T. Lead expansion and virtual screening of Indinavir derivate HIV-1 protease inhibitors using pharmacophoric – shape similarity scoring function. Bioinformation. 2010;4(7):295–299. | |
Shityakov S, Broscheit J, Förster C. α-Cyclodextrin dimer complexes of dopamine and levodopa derivatives to assess drug delivery to the central nervous system: ADME and molecular docking studies. Int J Nanomedicine. 2012;7:3211–3219. | |
Böhm HJ. Prediction of binding constants of protein ligands: a fast method for the prioritization of hits obtained from de novo design or 3D database search programs. J Comput Aided Mol Des. 1998;12(4):309–323. | |
Zhang C, Vasmatzis G, Cornette JL, DeLisi C. Determination of atomic desolvation energies from the structures of crystallized proteins. J Mol Biol. 1997;267(3):707–726. | |
Willard L, Ranjan A, Zhang H, et al. VADAR: a web server for quantitative evaluation of protein structure quality. Nucleic Acids Res. 2003;31(13):3316–3319. | |
Morris AL, MacArthur MW, Hutchinson EG, Thornton JM. Stereochemical quality of protein structure coordinates. Proteins. 1992;12(4):345–364. | |
Chiche L, Gregoret LM, Cohen FE, Kollman PA. Protein model structure evaluation using the solvation free energy of folding. Proc Natl Acad Sci U S A. 1990;87(8):3240–3243. | |
Chen L, Li Y, Zhao Q, Peng H, Hou T. ADME evaluation in drug discovery. 10. Predictions of P-glycoprotein inhibitors using recursive partitioning and naive Bayesian classification techniques. Mol Pharm. 2011;8(3):889–900. | |
Wolf LK. New software and websites for the chemical enterprise. Chemical and Engineering News. 2009;87(45):31. | |
Connolly ML. Solvent-accessible surfaces of proteins and nucleic acids. Science. 1983;221(4612):709–713. | |
Connolly ML. Molecular Surfaces: A Review. Washington, DC: Network Science; 1996. Available from: http://www.netsci.org/Science/Compchem/feature14.html. Accessed December 13, 2013. | |
Li HJ, Leung KS, Wong MH. iDOCK: A Multithreaded Virtual Screening Tool For Flexible Ligand Docking. Computational Intelligence in Bioinformatics and Computational Biology (CIBCB), 2012 IEEE Symposium. May 9–12, 2012, 77–84. | |
de Azevedo WF Jr, Dias R. Evaluation of ligand-binding affinity using polynomial empirical scoring functions. Bioorg Med Chem. 2008;16(20):9378–9382. | |
Cer RZ, Mudunuri U, Stephens R, Lebeda FJ. IC50-to-Ki: a web-based tool for converting IC50 to Ki values for inhibitors of enzyme activity and ligand binding. Nucleic Acids Res. 2009;37(Web Server issue):W441–W445. | |
Keogh JP, Kunta JR. Development, validation and utility of an in vitro technique for assessment of potential clinical drug–drug interactions involving P-glycoprotein. Eur J Pharm Sci. 2006;27(5):543–554. | |
Nikolovska-Coleska Z, Wang R, Fang X, et al. Development and optimization of a binding assay for the XIAP BIR3 domain using fluorescence polarization. Anal Biochem. 2004;332(2):261–273. | |
Laskowski RA, Swindells MB. LigPlot+: multiple ligand–protein interaction diagrams for drug discovery. J Chem Inf Model. 2011;51(10):2778–2786. | |
Ramu A, Ramu N. Reversal of multidrug resistance by phenothiazines and structurally related compounds. Cancer Chemother Pharmacol. 1992;30(3):165–173. | |
Ramu A, Ramu N. Reversal of multidrug resistance by bis(phenylalkyl)amines and structurally related compounds. Cancer Chemother Pharmacol. 1994;34(5):423–430. | |
Bakken GA, Jurs PC. Classification of multidrug-resistance reversal agents using structure-based descriptors and linear discriminant analysis. J Med Chem. 2000;43(23):4534–4541. | |
Deng W, Verlinde CL. Evaluation of different virtual screening programs for docking in a charged binding pocket. J Chem Inf Model. 2008;48(10):2010–2020. | |
Mechetner EB, Roninson IB. Efficient inhibition of P-glycoprotein-mediated multidrug resistance with a monoclonal antibody. Proc Natl Acad Sci U S A. 1992;89(13):5824–5828. | |
Inaba M, Sakurai Y. Enhanced efflux of actinomycin D, vincristine, and vinblastine in adriamycin-resistant subline of P388 leukemia. Cancer Lett. 1979;8(2):111–115. | |
Huang X. Fluorescence polarization competition assay: the range of resolvable inhibitor potency is limited by the affinity of the fluorescent ligand. J Biomol Screen. 2003;8(1):34–38. | |
Loo TW, Clarke DM. Identification of residues in the drug-binding site of human P-glycoprotein using a thiol-reactive substrate. J Biol Chem. 1997;272(51):31945–31948. | |
Loo TW, Bartlett MC, Clarke DM. Transmembrane segment 7 of human P-glycoprotein forms part of the drug-binding pocket. Biochem J. 2006;399(2):351–359. |
 © 2014 The Author(s). This work is published and licensed by Dove Medical Press Limited. The full terms of this license are available at https://www.dovepress.com/terms.php and incorporate the Creative Commons Attribution - Non Commercial (unported, v3.0) License.
By accessing the work you hereby accept the Terms. Non-commercial uses of the work are permitted without any further permission from Dove Medical Press Limited, provided the work is properly attributed. For permission for commercial use of this work, please see paragraphs 4.2 and 5 of our Terms.
© 2014 The Author(s). This work is published and licensed by Dove Medical Press Limited. The full terms of this license are available at https://www.dovepress.com/terms.php and incorporate the Creative Commons Attribution - Non Commercial (unported, v3.0) License.
By accessing the work you hereby accept the Terms. Non-commercial uses of the work are permitted without any further permission from Dove Medical Press Limited, provided the work is properly attributed. For permission for commercial use of this work, please see paragraphs 4.2 and 5 of our Terms.