")
Back to Journals » Advances and Applications in Bioinformatics and Chemistry » Volume 7
In silico predictive model to determine vector-mediated transport properties for the blood–brain barrier choline transporter
Authors Shityakov S, Förster C
Received 8 March 2014
Accepted for publication 4 April 2014
Published 2 September 2014 Volume 2014:7 Pages 23—36
DOI https://doi.org/10.2147/AABC.S63749
Checked for plagiarism Yes
Review by Single anonymous peer review
Peer reviewer comments 3
Sergey Shityakov, Carola Förster
Department of Anaesthesia and Critical Care, University of Würzburg, Würzburg, Germany
Abstract: The blood–brain barrier choline transporter (BBB-ChT) may have utility as a drug delivery vector to the central nervous system (CNS). We therefore initiated molecular docking studies with the AutoDock and AutoDock Vina (ADVina) algorithms to develop predictive models for compound screening and to identify structural features important for binding to this transporter. The binding energy predictions were highly correlated with r2=0.88, F=692.4, standard error of estimate =0.775, and P-value<0.0001 for selected BBB-ChT-active/inactive compounds (n=93). Both programs were able to cluster active (Gibbs free energy of binding <−6.0 kcal*mol-1) and inactive (Gibbs free energy of binding >−6.0 kcal*mol-1) molecules and dock them significantly better than at random with an area under the curve value of 0.86 and 0.84, respectively. In ranking smaller molecules with few torsional bonds, a size-related bias in scoring producing false-negative outcomes was detected. Finally, important blood–brain barrier parameters, such as the logBBpassive and logBBactive values, were assessed to predict compound transport to the CNS accurately. Knowledge gained from this study is useful to better understand the binding requirements in BBB-ChT, and until such time as its crystal structure becomes available, it may have significant utility in developing a highly predictive model for the rational design of drug-like compounds targeted to the brain.
Keywords: blood–brain barrier choline transporter, central nervous system, drug delivery vector, molecular docking, virtual screening, Gibbs free energy of binding, diffusion
Introduction
In the drug design and discovery process, the drug permeation across the blood–brain barrier (BBB) is a pivotal task for neuropharmaceuticals to reach their site of action within the central nervous system (CNS). The BBB consists of the brain capillary endothelial cells connected by tight junction proteins, such as occludin and claudins1,2 that circumferentially surround the cell margin restricting passage especially for hydrophilic and positively charged drugs into the CNS.3–5 While careful chemical modifications are helpful to increase the octanol-water partitioning coefficient (logP) for such drugs to improve their brain accumulation, there would be a total decreased exposure of them to the CNS due to the excessive partitioning of these compounds to other tissues.6
An alternative way for a charged molecule to access the brain could be achieved via the BBB native nutrient transporters, such as the blood–brain barrier choline transporter (BBB-ChT). This transporter is responsible for delivery of a positively charged choline molecule into the CNS, where it acts as a structural component of cell membranes and precursor for the neurotransmitter acetylcholine.7
Pharmacological applications of using BBB-ChT for drug delivery to the brain may encompass treatment strategies for traumatic brain injury, hypoxia, or ischemia after a stroke, and other neurodegenerative disorders, including Alzheimer’s and Huntington’s diseases.8,9 Recent research has determined that this transporter system might be a suitable drug delivery vector, because it is only occupied at 25 percent of Michaelis–Menten constant (Km) with choline plasma concentration.7,10 However, the membrane-associated and polytopic state of this choline transporter affects its successful cloning10 and crystallization,11 providing no detailed information on its three-dimensional (3D) structure. For that reason, the neuronal high affinity choline transporter 1 (ChT1) was already employed by other researchers in many molecular docking and 3D structure-activity relationship (3D-QSAR) studies as a substitute for the BBB-ChT to determine structural requirements for various drug-like substances to permeate across the BBB.11–13
Although these studies were shown to be useful in determining lead molecules only for small datasets including novel semi-rigid cyclic and acyclic bis- and mono-quaternary compounds13, they are all lacking a systematic approach in terms of the exhaustive molecular docking using different algorithms and important BBB permeability parameters, such as the brain-to-plasma concentration ratio. Therefore, to find possible candidates for the BBB-ChT-mediated transport, the researchers for the current study performed structure-based virtual screening of the BBB-ChT-active/inactive molecules using the appropriate scoring functions to calculate binding affinities and to correlate them to the molecular physicochemical properties for more accurate BBB permeability prediction. The applicability of the current model will allow identifying prospective drug-like molecules that have desirable BBB-ChT binding properties prior to their chemical synthesis, eliminating the urgency for conventional time and resource-consuming quantitative structure–activity relationship (QSAR) techniques.
Computational methods
The ChT1 homology model to mimic the BBB-ChT protein was constructed using the A-chain of the sodium/galactose symporter (Protein Data Bank ID: 3DH4) as a template14 by the Iterative Threading Assembly Refinement (I-TASSER) server.15 The Volume, Area, and Dihedral Angle Reporter server,16 which is an improved version of the PROCHECK software (European Bioinformatics Institute, Cambridge, UK),17 was implemented for the stereochemical validation of the ChT1 molecule to investigate the Φ-Ψ dihedral angles in a Ramachandran plot.
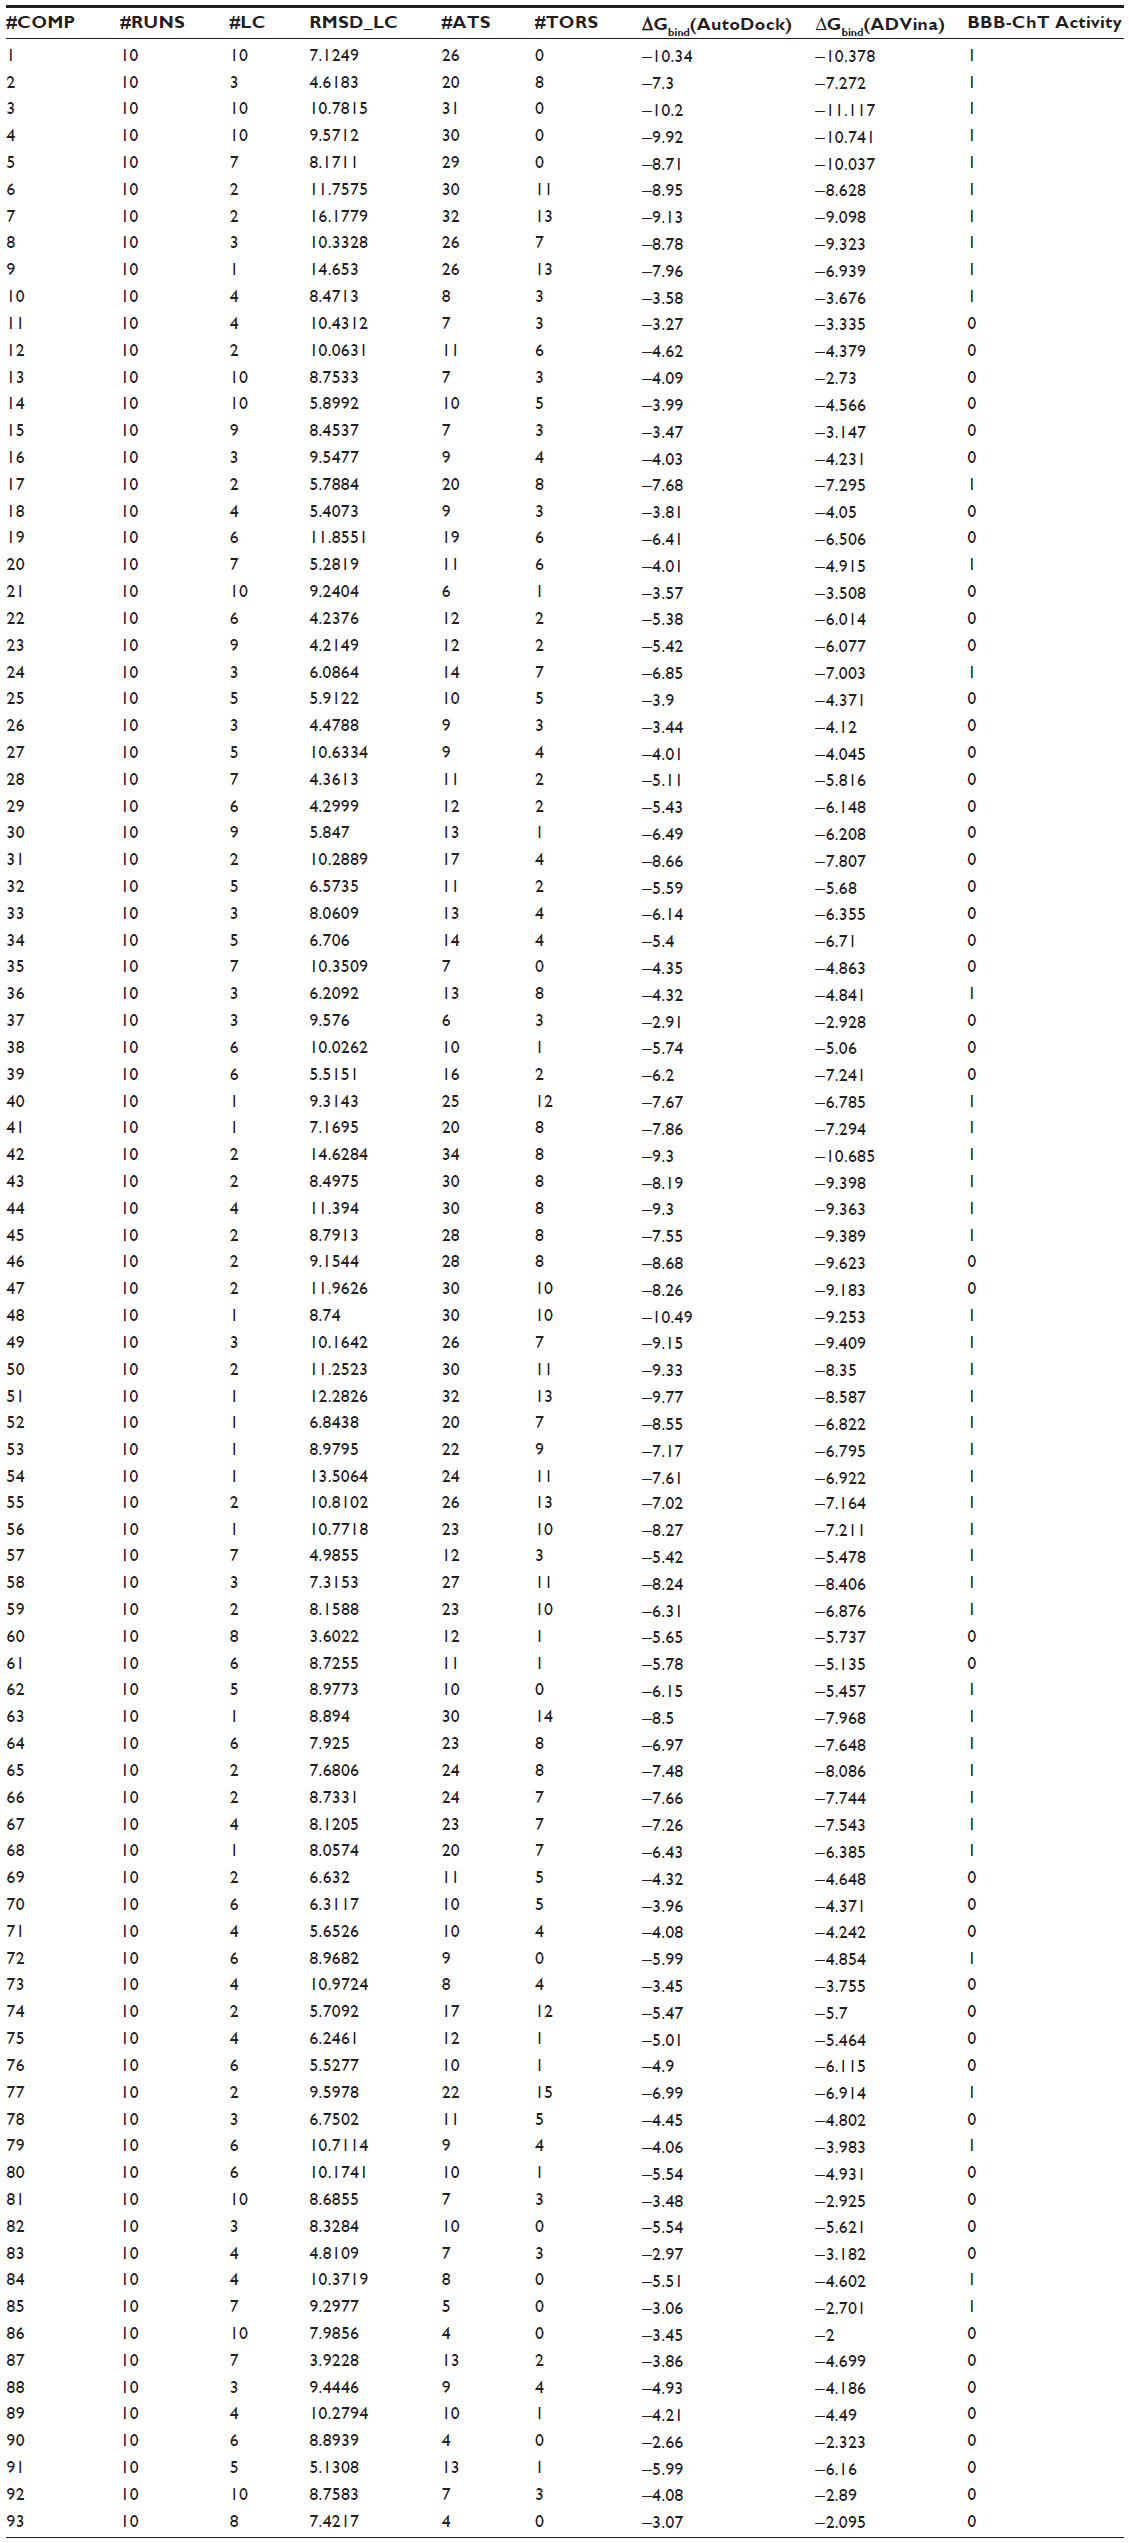
Altogether, observed statistics showed that 87% (508 residues) and 8% (44 residues) of all observed residues were in core and allowed regions. The expected values for the comparison were 90% (522 residues) and 7% (41 residues), respectively, for the same regions obtained elsewhere, from the literature.18,19 The BBB-ChT-active/inactive chemical compound database, where most of them are positively charged, included 93 molecules compiled from different literature sources12,20–22 in the PubChem BioAssay server. Among them, 44 molecules (47.3%) were the BBB-ChT binders (active substances); 49 molecules (52.7%) were the BBB-ChT nonbinders (inactive substances). Prior to the virtual screening procedure, the PyRx software (Scripps Research Institute, San Diego, CA, USA) was used to optimize the dataset.23
After the conversion, all molecules were inspected manually to detect atoms with improper valence due to mixed aromatic-Kekulé representation. Gasteiger charges were added, and polar hydrogen atoms were assigned. The rotatable bonds were set up, and structure data files were converted into the Protein Data Bank partial charge and atom type format. Rigid-flexible molecular docking was applied to the center of the ChT1 transport channel using Cartesian coordinates: x=0.32 Å; y=0.94 Å; and z=−0.44 Å. The AutoDock and AutoDock Vina (ADVina) docking engines (Scripps Research Institute) were implemented via the Raccoon v1.0 (Scripps Research Institute) and iDOCK (Department of Computer Science and Engineering, Chinese University of Hong Kong, Hong Kong) modifications optimized to perform virtual screening.
AutoDock v.4.2.5.1 was used in the study since its previous version incorrectly calculates part of the intermolecular desolvation energy term. The docking grid with a dimension size of 60 × 60 × 60 Å for AutoDock and 22.5 × 22.5 × 22.5 Å for ADVina was used in the study. The docking output results were represented by the docking scores as Gibbs free energy of binding (ΔGbind), and they were further converted to the predicted inhibition constants (Kipred). The Kipred parameters for all the docked poses were calculated from the ΔGbind values as follows:

where R (gas constant) is 1.98 cal(mol*K)−1, and T (room temperature) is 298.15 Kelvin.
The python summarize_results4.py script available from MGLTools (Scripps Research Institute) was used to analyze, summarize, and cluster the AutoDock results. Virtual screen performances were evaluated using areas under the receiver operating characteristic (ROC) curve (AUC) and the Boltzmann-enhanced discrimination of ROC (BEDROC) metrics.24 The AUC was calculated by summation while BEDROC 20 (α value is 20.0) values were determined using the R scripts kindly provided by Hiroaki Yabuuchi from Kyoto University (Department of Genomic Drug Discovery Science, Graduate School of Pharmaceutical Sciences, Kyoto University, Kyoto, Japan). The electrostatic potential maps were calculated with Delphi v5.1 (Computational Biophysics and Bioinformatics, Clemson University, Clemson, SC, USA) using a finite difference solution to the Poisson–Boltzmann equation.25 The calculated octanol-water partitioning coefficient (ClogP) and polar surface area (PSA) for analyzed compounds were determined from molecular interaction fields with the VolSurf+ program (Molecular Discovery, Perugia, Italy). The decimal logarithm value of brain-to-plasma concentration ratio (logBBpassive), based mainly on the passive transport (diffusion) for the dataset of BBB-ChT-active/inactive compounds, was calculated from the ClogP and PSA parameters using empirical Clark’s equation,26

The MATLAB R2012a software (MathWorks, Natick, MA, USA) was used to calculate linear relationships (Table S1) devised from the logarithmic value of the brain-to-plasma concentration ratios (logBBpassive) for analyzed compounds concerning the BBB-ChT transport by using the following equation,

where pKiexp is a negative decimal logarithm of the experimentally determined inhibition constant.
Molecular graphics and visualization were performed with the UCSF Chimera v.1.7 software (Resource for Biocomputing, Visualization, and Informatics, University of California, San Francisco, CA, USA). Statistical analyses were performed using a linear regression analysis, followed by graphic representations using GraphPad Prism v.4 (GraphPad Software, Inc., La Jolla, CA, USA). The differences were considered statistically significant at P-value <0.0001.
Results and discussion
Our search for a CNS-active hit/lead molecule focuses on a substance that allows for better BBB transfer after binding to the BBB-ChT. Therefore, we wanted to improve a substrate selection and filtering by molecular docking prescreening. For this, we compiled a dataset of the BBB-ChT-active/inactive substances, including 93 molecules in total. The first ten BBB-ChT-active bis-pyridinium cyclophanes were determined by their binding affinity to the BBB-ChT in a rat brain and were assessed according to their inhibition of [3H]choline uptake.21 The other 29 various molecules, comprising four active and 25 inactive compounds, were analyzed by the same uptake assay, involving in situ brain perfusion studies of male rats.20 Also, 17 bis-azaaromatic quaternary ammonium salts, among them 15 active and two inactive molecules, were synthesized as ligands for the BBB-ChT protein.22
Finally, 37 chemical compounds including conformationally flexible, semi-rigid, and cyclic quaternary ammonium analogs, among them 15 actives and 22 inactives, were taken from the BBB-ChT 3D-QSAR studies12 to enrich the entire dataset. A standard rigid-flexible docking technique produced two main outcomes: a particular conformational sampling as a docking pose of the chemical compound with the ChT1 transport channel; and a scoring function (ΔGbind) depicting the protein-ligand interaction strength. Since the true positives and the true negatives are known in this study, the AUC and BEDROC 20 values were quantified from random rankings; statistical significance was estimated by a bootstrap method described in the literature by Efron.27 The results showed a better performance for AutoDock with an AUC value of 0.82 and a standard error of 0.045 than for ADVina, which has an AUC value of 0.81 and a standard error of 0.046. From Figure 1A, it is clear that both programs perform well with all the points on a curve above diagonal, a random AUC selection performance presented with only a 0.5 value.
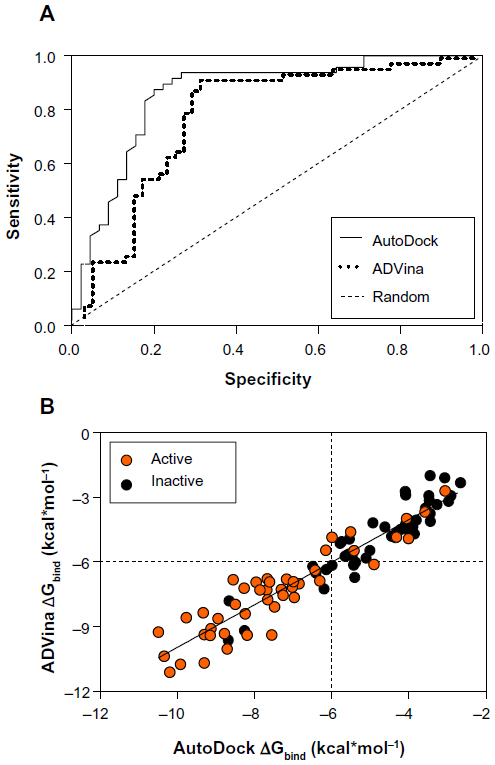 | Figure 1 ROC curves (A) and predicted binding energies (B) from the AutoDock (Scripps Research Institute, San Diego, CA, USA) and ADVina (Scripps Research Institute) runs for 93 analyzed compounds. |
However, the AutoDock performance indicators show that this method slightly outperforms ADVina, although the advantage is insignificant. In terms of early detection, as determined using the BEDROC 20 measure, both programs performed significantly better than random with BEDROC 20 values of 0.97 for AutoDock and 0.92 for ADVina. This new metric also takes into account the shape of the ROC curves,24 resulting in higher values due to the curves’ steep elevation – meaning that known actives are identified at the top of the dataset. The AutoDock and ADVina scoring functions are both weighted functions containing hydrogen bonding and torsional penalty values. While these latter parameters usually differ,28,29 it is important to estimate the overall scoring deviations.
A comparison of the predicted docking energies from both programs is shown in Figure 1B, demonstrating a strong correlation between the docking results. As evident by a high Pearson’s chi-squared test (r2) of 0.88, an F of 692.4, and a standard error of estimation of 0.775, there is a clear association between the predictions from both algorithms. Based on this correlation in terms of the ΔGbind value, it was expected that the compound conformations would also tend to be similar. All docking poses were ranked according to a score that the docking program assigns to each pose, estimating the ΔGbind values in the range from −10.49 to −2.66 kcal*mol−1 for AutoDock and −11.117 to −2.0 kcal*mol−1 for ADVina (Table S2). Three false-positive AutoDock (ADVina) docking results with minimal ΔGbind values ranging from –8.68 (–9.62) to –6.49 (–6.21) kcal*mol−1 were detected for chemical compounds 31, 46, and 47 from the entire dataset. On the contrary, the false-negative AutoDock (ADVina) docking outcomes with significantly higher ΔGbind values ranging from –4.32 (–4.92) to –3.06 (–2.7) kcal*mol−1 were determined for five chemical structures, including compounds 10 (choline), 20, 36, 79, and 85, respectively. All these eight molecules were further extracted as outliers from the BBB-ChT compound database to determine the active and inactive compound clustering for AutoDock and ADVina docking runs based on their ΔGbind values. Notably, the substances with ΔGbind deviating slightly from the threshold value (ΔGbind=−6.0 kcal*mol−1) were not excluded as outliers from the analysis.
It can be seen from Figure 2A and B that the lowest-binding energies were generated by the active compounds. Interestingly, most of the active molecules were found to be largely below the −6.0 kcal*mol−1 threshold with an average ΔGbind value of −7.92±−1.394 kcal*mol−1 for AutoDock and −7.88±1.606 kcal*mol−1 for ADVina. In contrast, the majority of inactive molecules was observed to be above the threshold level with an average ΔGbind value of −4.55±1.057 kcal*mol−1 for AutoDock and −4.61±1.32 kcal*mol−1 for ADVina.
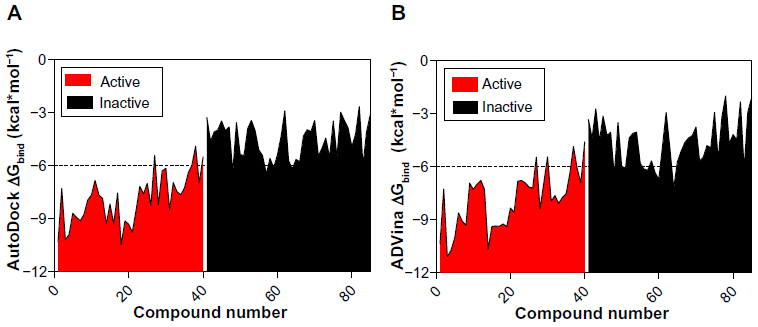 | Figure 2 Clustering of BBB-ChT-active/inactive chemical compounds either for AutoDock (Scripps Research Institute, San Diego, CA, USA) (A) or ADVina (Scripps Research Institute) (B) runs, based on their minimal and maximal ΔGbind values. |
These results indicate again that both docking algorithms perform at the same level with very similar ΔGbind values emphasizing the importance of molecular properties of the analyzed compounds to further explain the clustering process. It was also observed that docking accuracy depends on the size of the compound.30 Therefore, a comparison of the number of heavy atoms presented in each compound, plotted against predicted energetics, revealed a strong correlation coefficient of 0.86, an F of 557.7, and a standard error of estimation of 0.796 for AutoDock; ADVina represented an r2 of 0.87, an F of 595, and a standard error of estimation of 0.814. Figure 3A and B shows that all compounds were divided into two major clusters. Namely, the nine active as false-negatives with 44 inactive molecules landed in the cluster with a small number of heavy atoms (<20). Likewise, the five inactive as false-positives with 35 active molecules landed in the cluster with a greater number of heavy atoms (≥20). Since the number of atoms and torsions (rotatable bonds) is primarily associated with a larger search space, the clustering of the chemical compounds shows that the false-negative docking results occur in a molecular size-dependent manner and that high levels of ΔGbind correlate with low numbers of heavy atoms in the molecule. Moreover, this size-related bias in scoring was previously detected for the AutoDock and ADVina algorithms through a virtual screening of the Diversity Set II (DSII) and the Database of Useful Decoys (DUD) compound libraries.31 Further analysis based on heavy atom count came up with an AUC value of 0.85, a standard error of 0.043 (Figure 4A), and a BEDROC 20 of 0.97, respectively. The AUC for heavy atom count ranking was very similar to the AUC from the AutoDock and ADVina runs, showing that molecular docking contributes no net signal over heavy atom count.
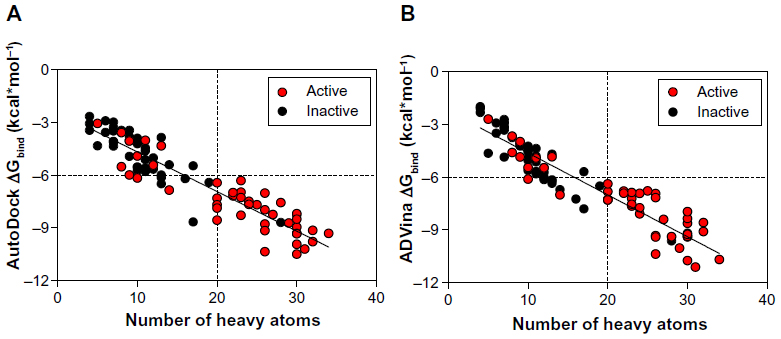 | Figure 3 Predicted binding energies for the dataset of BBB-ChT-active/inactive substances as a function of heavy atoms in the compound are plotted for AutoDock (Scripps Research Institute, San Diego, CA, USA) (A) and ADVina (Scripps Research Institute) (B). |
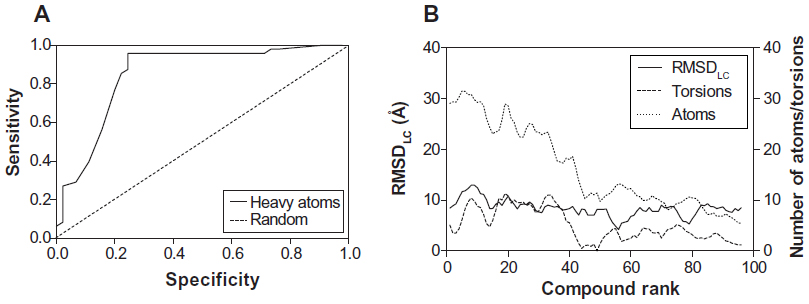 | Figure 4 ROC curve of heavy atom count (A) and schematic data smoothing (B) of 93 analyzed compounds for the comparison of the RMSDLC values, number of atoms, and torsions in the molecule. |
To accurately assess the correlations between the compound ranking and the molecular properties of chemical compounds, we estimated the root-mean-square deviation (RMSDLC) difference between the lowest energy conformation and the reference ligand conformation in the largest cluster. The RMSDLC parameters represented a uniform distribution, which is not dependent on the number of atoms and torsions in the molecule (Figure 4B). On the other hand, the latter two values significantly correlated in a direct manner with the compound ranking; the ranking increased together with a increasing number of atoms and torsions in the docked molecule.
The next step was to validate the data through the correlation between the docking results and experimental affinities (Kiexp) for the BBB-ChT-active ligands (n=29) except 15 cyclic quaternary ammonium analogs. The selection was based on the Ki values for choline (Kicholine), which were in the range of 41–42 μM for the active bis-pyridinium cyclophanes, bis-azaaromatic quaternary ammonium salts, and various molecules from the 3D-QSAR dataset,20 in contrast to the Kicholine of 0.68 μM for ammonium analogs. Regardless of the moderate correlation coefficient (r2=0.47) between the pKipred values, calculated from the appropriate ΔGbind parameters and Kiexp for both algorithms (Figure 5A and B), it was previously reported that scoring tests on 90 protein-ligand complexes from the Protein Data Bank demonstrated a statistically significant correlation even with r2 in the range from 0.45 to 0.55, respectively.32
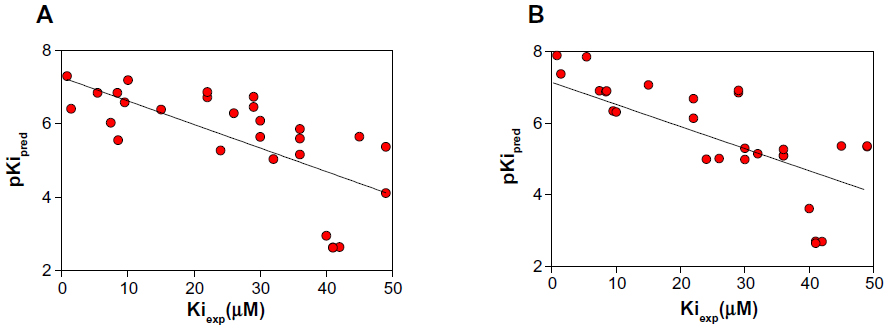 | Figure 5 Negative decimal logarithm of predicted inhibition constants (pKipred), calculated from the ΔGbind values of AutoDock (Scripps Research Institute, San Diego, CA, USA) (A) and ADVina (Scripps Research Institute) (B) runs, between 29 BBB-ChT-active compounds and target protein and plotted against experimentally determined inhibition constants (Kiexp). |
To gain some insight into the binding characteristics of BBB-ChT-active compounds, we docked them into its binding cavity. During the docking process, the protein was considered to be rigid while the ligands were flexible. As it has been already suggested that the BBB-ChT pore is extremely important for a translocation of positively charged drugs across the BBB,22 the analyzed active substances occupied negatively charged portions of the pore within the same binding cavity close to the center of the transporting channel (Figure 6). In accordance with our results, the hypothetical model for the choline transporter binding site20 explains this phenomenon due to strong ionic interaction between the trimethylammonium moiety of ligand and corresponding amino acid residues of protein. In addition, bulk cavity methyl acceptors might play some role to establish a conformational congruence with ligand methyl groups and potentiate the BBB-ChT affinity.
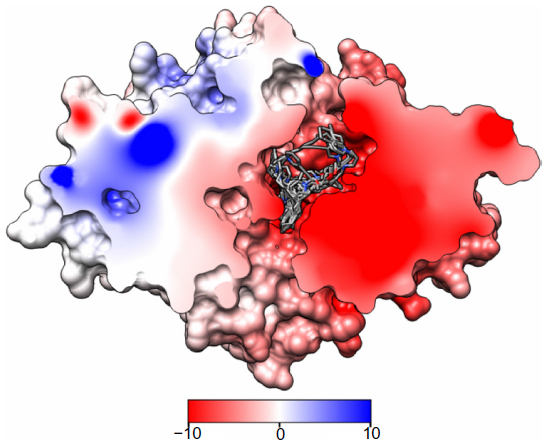 | Figure 6 AutoDock (Scripps Research Institute, San Diego, CA, USA) rigid-flexible molecular docking of BBB-ChT-active compounds (44 molecules) into the binding site of the ChT1 homology model. |
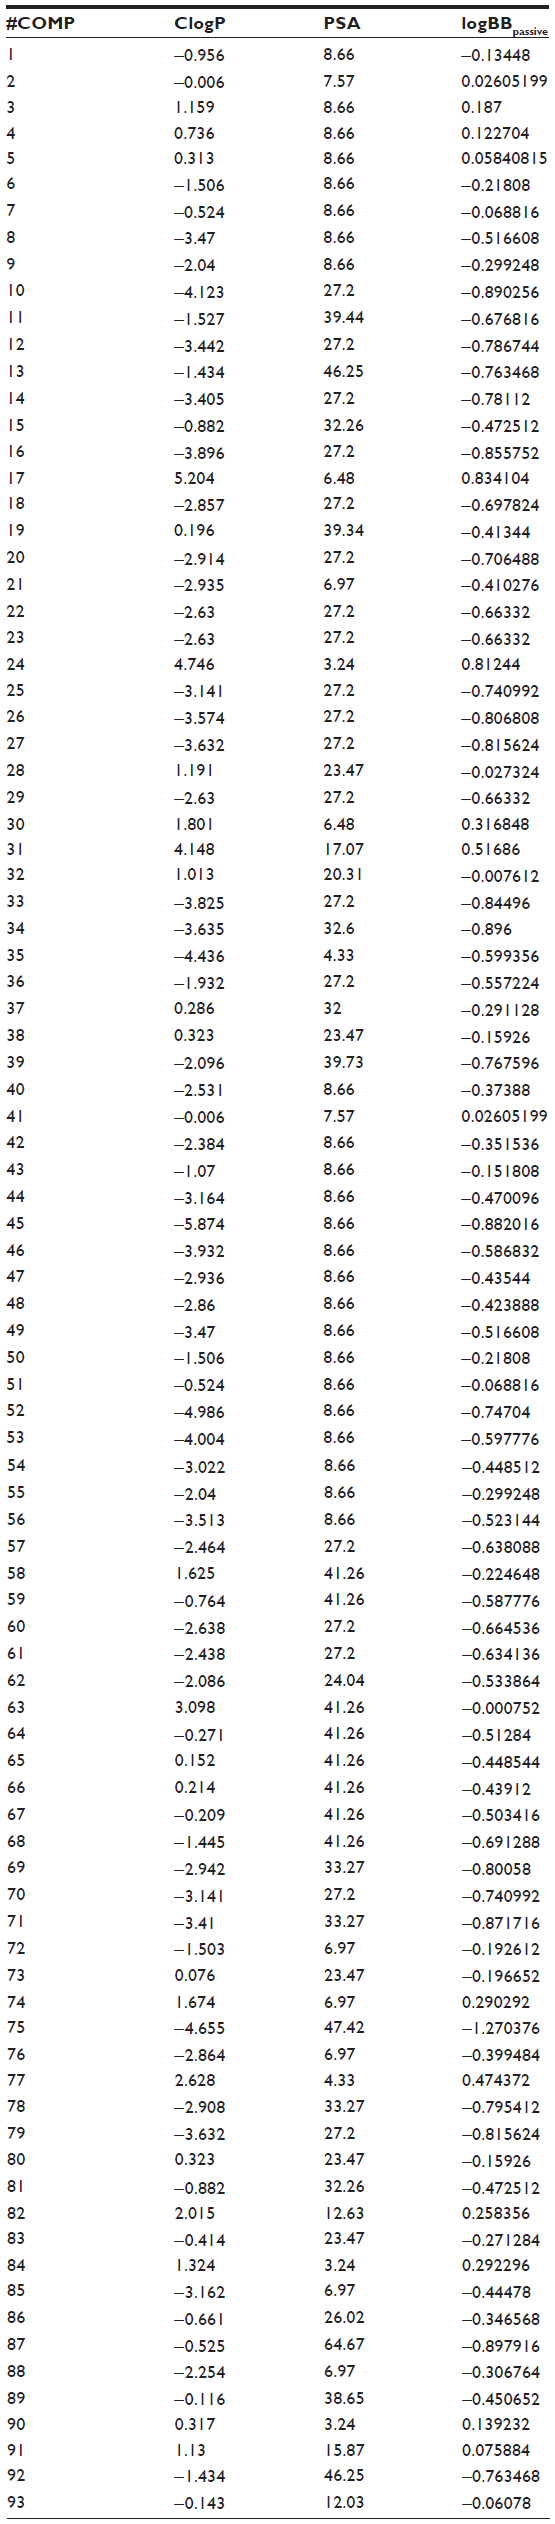
The ClogP, PSA, and logBB values for BBB-ChT-active/inactive compounds were obtained to evaluate their ability to interact at the CNS level and possess optimal BBB permeation properties. All compounds include ClogP values in the range of −5.87 to 5.204 and PSA values in the range of 3.24–64.67 Å2. For a CNS-active molecule to permeate the BBB, an area <60 Å2 is usually needed, and molecules with a PSA of >120–140 Å2 tend to be poor in permeating cell membranes.33 The ClogP values specify the lipophilic character of the examined compounds, which should be high enough for the molecule (ClogP >0) to cross the BBB. The results indicate that most of the BBB-ChT-active compounds have suitable PSA (PSA <60 Å2), but most of them are not lipophilic enough (ClogP <0) to permeate the BBB successfully (Figure 7A). Judging by low ClogP, these drugs will probably retain at the hydrophilic compartment, such as blood serum. However, the ClogP and PSA alone have proven insufficient for the accurate evaluation of the BBB permeation, since they correlate poorly with the logBB values in our previous studies.5,34
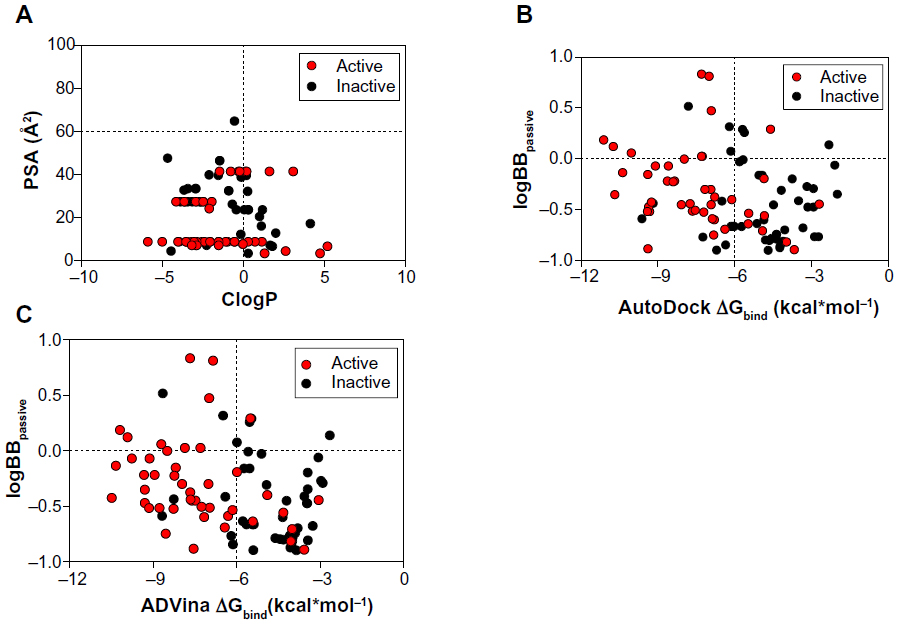 | Figure 7 Relationship between molecular properties, such as ClogP, PSA (A), and Gibbs free energy of binding (ΔGbind), and decimal logarithm of brain-to-plasma concentration ratio (logBBpassive) based on passive transport, such as diffusion (B and C). |
According to the CNS ± activity classification for different chemical compounds, molecules with logBB >0 can cross the BBB readily, while drugs with logBB <0 cannot.35 Therefore, we calculated logBBpassive value for the BBB-ChT-active/inactive compounds using Equation 2 (Table S3), which was empirically devised from a smaller dataset (n=55; r2=0.79; standard error of estimate (SEE) =0.35).26 It can be seen from Figure 7B and C that most of the substances have negative logBBpassive parameters except for the active compounds 2–5, 17, 24, 41, and 84. Based upon these results, the bis-pyridinium cyclophane compounds 3–5 (5b–5c) with the best Kiexp values (Table 1) were subjected to further analysis to define their blood–brain concentrations according to Equation 3. Centrally acting cholinesterase inhibitor donepezil hydrochloride (Aricept) with experimental logBB of 0.89 was used as a reference substance. As demonstrated in Figure 8A and B, the compound distribution into the brain, governed by linear relationship, was significantly improved due to enhanced permeation rate across the BBB after considering the passive (logBBpassive) and BBB-ChT-active transport (logBBactive).
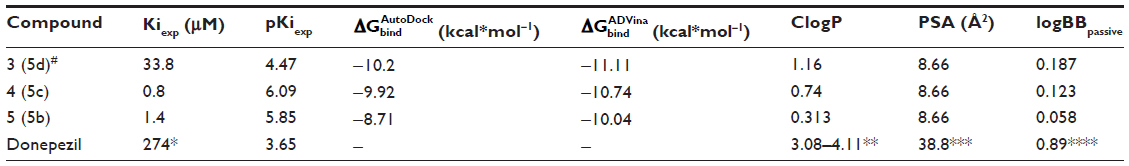 | Table 1 Experimental and predicted parameters to assess BBB permeation for CNS- and BBB-ChT-active compounds |
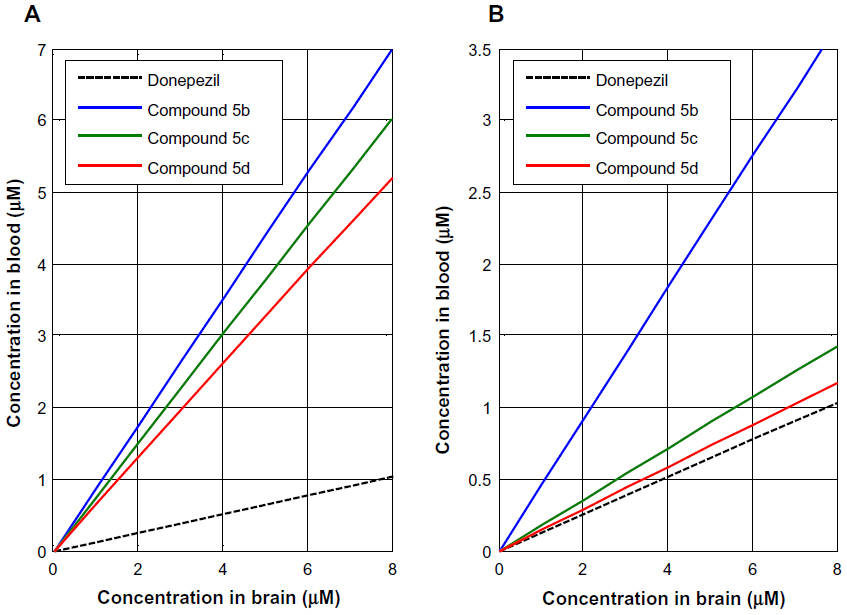 | Figure 8 Brain and blood concentration relationship for the bis-pyridinium cyclophane compounds devised from the decimal logarithm of brain-to-plasma concentration ratio based on diffusion alone (A) and together with BBB-ChT active transport (B). |
Conclusion
In this current study, we report on the development of an in silico structure-based predictive model to determine vector-mediated transport properties for drug-like chemical compounds using the BBB-ChT system. Surprisingly, this transporter has not been cloned, expressed, or crystalized. However, the homology model of ChT1 was implemented in virtual screening as a substitute for the BBB-ChT protein due to the absence of its 3D crystal structure. The molecular docking studies were initiated with the AutoDock and ADVina search algorithms and provided highly correlated ΔGbind values with r2=0.88, F=692.4, SEE=0.775, and P-value<0.0001 for the compiled BBB-ChT database. Both programs were able to cluster active (ΔGbind <−6.0 kcal*mol−1) and inactive (ΔGbind >−6.0 kcal*mol−1) molecules and dock them significantly better than at random with an AUC of 0.82 for AutoDock and 0.81 for ADVina.
In the molecular docking of smaller compounds with few torsional bonds, a size-related bias in scoring was detected, which affects the ligands comprising <20 heavy atoms. This bias was responsible for a failure to preferentially rank only active compounds at the top, producing false-negative outcomes. Finally, important BBB parameters, such as the logBBpassive and logBBactive values, were assessed to evaluate the role of active transport for compounds to cross the BBB. Information obtained from this study is useful to determine the binding requirements in BBB-ChT, and until such time as its crystal structure becomes available, it may have significant utility in elaborating a highly predictive model for the rational design of drug-like compounds targeted to the brain.
Acknowledgments
Special thanks are extended to Dr Ellaine Salvador from Würzburg University and Anna Poon from the City College of New York for their assistance in the writing of this paper. The authors are grateful to the Bundesministerium für Bildung und Forschung (BMBF) for its support of this work by providing the BMBF01 grant to Carola Förster.
Disclosure
The authors report no conflicts of interest in this work.
References
Förster C, Silwedel C, Golenhofen N, et al. Occludin as direct target for glucocorticoid-induced improvement of blood-brain barrier properties in a murine in vitro system. J Physiol. 2005;565(Pt 2):475–486. | |
Förster C, Burek M, Romero IA, Weksler B, Couraud PO, Drenckhahn D. Differential effects of on tight junction proteins in an in vitro model of the hydrocortisone and TNFα human blood-brain barrier. J Physiol. 2008;586(7):1937–1949. | |
Pardridge WM. Targeting neurotherapeutic agents through the blood-brain barrier. Arch Neurol. 2000;59(1):35–40. | |
Pardridge WM. Drug and gene targeting to the brain with molecular Trojan horses. Nat Rev Drug Discov. 2002;1(2):131–139. | |
Shityakov S, Neuhaus W, Dandekar T, Förster C. Analysing molecular polar surface descriptors to predict blood-brain barrier permeation. Int J Comput Biol Drug Des. 2013;6(1–2):146–156. | |
Greig GL. On the shape of energy-detection ROC curves. Percept Psychophys. 1990;48(1):77–81. | |
Allen DD, Smith QR. Characterization of the blood-brain barrier choline transporter using the in situ rat brain perfusion technique. J Neurochem. 2001;76(4):1032–1041. | |
Lockman PR, Allen DD. The transport of choline. Drug Dev Ind Pharm. 2002;28(7):749–771. | |
Pardridge WM. The blood-brain barrier: bottleneck in brain drug development. NeuroRx. 2005;2(1):3–14. | |
Allen DD, Lockman PR, Roder KE, Dwoskin LP, Crooks PA. Active transport of high-affinity choline and nicotine analogs into the central nervous system by the blood-brain barrier choline transporter. J Pharmacol Exp Ther. 2003;304(3):1268–1274. | |
Chang C, Ray A, Swaan P. In silico strategies for modeling membrane transporter function. Drug Discov Today. 2005;10(9):663–671. | |
Geldenhuys WJ, Allen DD, Lockman PR. 3-D-QSAR and docking studies on the neuronal choline transporter. Bioorg Med Chem Lett. 2010;20(16):4870–4877. | |
Geldenhuys WJ, Manda VK, Mittapalli RK, et al. Predictive screening model for potential vector-mediated transport of cationic substrates at the blood-brain barrier choline transporter. Bioorg Med Chem Lett. 2010;20(3):870–877. | |
Faham S, Watanabe A, Besserer GM, et al. The crystal structure of a sodium galactose transporter reveals mechanistic insights into Na+/sugar symport. Science. 2008;321(5890):810–814. | |
Zhang Y. I-TASSER server for protein 3D structure prediction. BMC Bioinformatics. 2008;9:40. | |
Willard L, Ranjan A, Zhang H, et al. VADAR: a web server for quantitative evaluation of protein structure quality. Nucleic Acids Res. 2003;31(13):3316–3319. | |
Laskowski RA, Rullmannn JA, MacArthur MW, Kaptein R, Thornton JM. AQUA and PROCHECK-NMR: programs for checking the quality of protein structures solved by NMR. J Biomol NMR. 1996; 8(4):477–486. | |
Chiche L, Gregoret LM, Cohen FE, Kollman PA. Protein model structure evaluation using the solvation free energy of folding. Proc Natl Acad Sci U S A. 1990;87(8):3240–3243. | |
Morris AL, MacArthur MW, Hutchinson EG, Thornton JM. Stereochemical quality of protein structure coordinates. Proteins. 1992;12(4):345–364. | |
Geldenhuys WJ, Lockman PR, McAfee JH, Fitzpatrick KT, Van der Schyf CJ, Allen DD. Molecular modeling studies on the active binding site of the blood-brain barrier choline transporter. Bioorg Med Chem Lett. 2004;14(12):3085–3092. | |
Zhang Z, Lockman PR, Mittapalli RK, Allen DD, Dwoskin LP, Crooks PA. bis-Pyridinium cyclophanes: novel ligands with high affinity for the blood-brain barrier choline transporter. Bioorg Med Chem Lett. 2008;18(20):5622–5625. | |
Zheng G, Zhang Z, Lockman PR, et al. Bis-azaaromatic quaternary ammonium salts as ligands for the blood-brain barrier choline transporter. Bioorg Med Chem Lett. 2010;20(11):3208–3210. | |
Wolf LK. New software and websites for the chemical enterprise. Chem Eng News. 2009;87:31. | |
Truchon JF, Bayly CI. Evaluating virtual screening methods: good and bad metrics for the “early recognition” problem. J Chem Inf Model. 2007;47(2):488–508. | |
Rocchia W, Sridharan S, Nicholls A, Alexov E, Chiabrera A, Honig B. Rapid grid-based construction of the molecular surface and the use of induced surface charge to calculate reaction field energies: applications to the molecular systems and geometric objects. J Comput Chem. 2002;23(1):128–137. | |
Clark DE. Rapid calculation of polar molecular surface area and its application to the prediction of transport phenomena. 2. Prediction of blood-brain barrier penetration. J Pharm Sci. 1999;88(8):815–821. | |
Efron, B. Second thoughts on the bootstrap. Statistical Science 2003;18(2):135–140. | |
Huey R, Morris GM, Olson AJ, Goodsell DS. A semiempirical free energy force field with charge-based desolvation. J Comput Chem. 2007;28(6):1145–1152. | |
Trott O, Olson AJ. AutoDock Vina: improving the speed and accuracy of docking with a new scoring function, efficient optimization, and multithreading. J Comput Chem. 2010;31(2):455–461. | |
Pan Y, Huang N, Cho S, MacKerell AD Jr. Consideration of molecular weight during compound selection in virtual target-based database screening. J Chem Inf Comput Sci. 2003;43(1):267–272. | |
Chang MW, Ayeni C, Breuer S, Torbett BE. Virtual screening for HIV protease inhibitors: a comparison of AutoDock 4 and Vina. PLoS One. 2010;5(8):e11955. | |
Mitchell JBO, Laskowski RA, Alex A, Forster MJ, Thornton JM. BLEEP - Potential of mean force describing protein-ligand interactions: II. Calculation of binding energies and comparison with experimental data. J Comput Chem. 1999;20(11):1177–1185. | |
Palm K, Stenberg P, Luthman K, Artursson P. Polar molecular surface properties predict the intestinal absorption of drugs in humans. Pharm Res. 1997;14(5):568–571. | |
Shityakov S, Broscheit JA, Förster C. α-Cyclodextrin dimer complexes of dopamine and levodopa derivatives to assess drug delivery to the central nervous system: ADME and molecular docking studies. Int J Nanomedicine. 2012;7:3211–3219. | |
Ajay, Bemis GW, Murcko MA. Designing libraries with CNS activity. J Med Chem. 1999;42(24):4942–4951. | |
Kang YS, Lee KE, Lee NY, Terasaki T. Donepezil, tacrine and alpha-phenyl-n-tert-butyl nitrone (PBN) inhibit choline transport by conditionally immortalized rat brain capillary endothelial cell lines (TR-BBB). Arch Pharm Res. 2005;28(4):443–450. | |
Thevis M, Wilkens F, Geyer H, Schänzer W. Determination of therapeutics with growth-hormone secretagogue activity in human urine for doping control purposes. Rapid Commun Mass Spectrom. 2006;20(22):3393–3402. | |
Xia Z, Jiang X, Mu X, Chen H. Improvement of microemulsion electrokinetic chromatography for measuring octanol-water partition coefficients. Electrophoresis. 2008;29(4):835–842. | |
Choi J, Choi MK, Chong S, Chung SJ, Shim CK, Kim DD. Effect of fatty acids on the transdermal delivery of donepezil: in vitro and in vivo evaluation. Int J Pharm. 2012;422(1–2):83–90. | |
Goh CW, Aw CC, Lee JH, Chen CP, Browne ER. Pharmacokinetic and pharmacodynamic properties of cholinesterase inhibitors donepezil, tacrine, and galantamine in aged and young Lister hooded rats. Drug Metab Dispos. 2011;39(3):402–411. | |
Muehlbacher M, Spitzer GM, Liedl KR, Kornhuber J. Qualitative prediction of blood-brain barrier permeability on a large and refined dataset. J Comput Aided Mol Des. 2011;25(12):1095–1106. |
Supplementary materials
 |
 | Table S2 Docking poses ranked according to a score that the docking program assigns to each pose |
 | Table S3 Calculated logBBpassive value for BBB-ChT-active/inactive compounds using Equation 2 |
 © 2014 The Author(s). This work is published and licensed by Dove Medical Press Limited. The full terms of this license are available at https://www.dovepress.com/terms.php and incorporate the Creative Commons Attribution - Non Commercial (unported, v3.0) License.
By accessing the work you hereby accept the Terms. Non-commercial uses of the work are permitted without any further permission from Dove Medical Press Limited, provided the work is properly attributed. For permission for commercial use of this work, please see paragraphs 4.2 and 5 of our Terms.
© 2014 The Author(s). This work is published and licensed by Dove Medical Press Limited. The full terms of this license are available at https://www.dovepress.com/terms.php and incorporate the Creative Commons Attribution - Non Commercial (unported, v3.0) License.
By accessing the work you hereby accept the Terms. Non-commercial uses of the work are permitted without any further permission from Dove Medical Press Limited, provided the work is properly attributed. For permission for commercial use of this work, please see paragraphs 4.2 and 5 of our Terms.