")
Back to Journals » Drug Design, Development and Therapy » Volume 8
Improving anticancer efficacy of (-)-epigallocatechin-3-gallate gold nanoparticles in murine B16F10 melanoma cells
Authors Chen C, Hsieh D, Hwang K, Chan Y, Hong P, Yeh M, Wu C
Received 28 November 2013
Accepted for publication 20 February 2014
Published 8 May 2014 Volume 2014:8 Pages 459—474
DOI https://doi.org/10.2147/DDDT.S58414
Checked for plagiarism Yes
Review by Single anonymous peer review
Peer reviewer comments 3
Cheng-Cheung Chen,1,2 Dar-Shih Hsieh,1,3 Kao-Jean Huang,4 Yi-Lin Chan,5 Po-Da Hong,6 Ming-Kung Yeh,6–8,* Chang-Jer Wu1,*
1Department of Food Science, National Taiwan Ocean University, Keelung, 2Institute of Preventive Medicine, National Defense Medical Center, Taipei, 3Division of Urology, Department of Surgery, Ren-Ai Hospital, Shulin, New Taipei City, 4Department of Life Science and Institute of Biotechnology, National Dong Hwa University, Hualien, 5Graduate Institute of Medical Sciences, National Defense Medical Center, Taipei, 6Materials Technology Program, Graduate Institute of Applied Science and Technology, National Taiwan University of Science and Technology, Taipei, 7School of Pharmacy, National Defense Medical Center, Taipei, 8Food and Drug Administration, Ministry of Health and Welfare, Taipei, Taiwan, Republic of China
*These authors contributed equally to this work
Abstract: (-)-Epigallocatechin-3-gallate (EGCG), the major bioactive constituent in green tea, has been reported to effectively inhibit the formation and development of tumors. To maximize the effectiveness of EGCG, we attached it to nanogold particles (EGCG-pNG) in various ratios to examine in vitro cytotoxicity and in vivo anti-cancer activity. EGCG-pNG showed improved anti-cancer efficacy in B16F10 murine melanoma cells; the cytotoxic effect in the melanoma cells treated with EGCG-pNG was 4.91 times higher than those treated with EGCG. The enhancement is achieved through mitochondrial pathway-mediated apoptosis as determined by annexin V assay, JC-10 staining, and caspase-3, -8, -9 activity assay. Moreover, EGCG-pNG was 1.66 times more potent than EGCG for inhibition of tumor growth in a murine melanoma model. In the hemolysis assay, the pNG surface conjugated with EGCG is most likely the key factor that contributes to the decreased release of hemoglobin from human red blood cells.
Keywords: gold nanoparticles, EGCG, anticancer, melanoma
Introduction
Malignant melanoma, the major fatal form of skin cancer, is an aggressive and refractory cancer derived from melanocytes.1 In recent years, the incidence of melanoma has been continuously increasing worldwide and becoming a huge public health issue.1 Surgery, radiation therapy, and chemotherapy are the standard means of treating melanoma.2–4 The disease is intrinsically curable, but this largely depends upon early diagnosis, otherwise the prognosis is not as optimistic as one would wish.5
Phytochemicals have aroused much interest in treating recalcitrant cancers because of their minimal side effects.6,7 (−)-Epigallocatechin-3-gallate (EGCG), the major polyphenolic constituent in green tea, has been reported to have anti-proliferative and chemopreventive effects against several cancers, such as bladder, breast, prostate, colon, and skin cancer.8–10 Not surprisingly, EGCG has become one of the most popular phytochemicals in the study of cancer treatment. However, poor bioavailability, susceptibility to oxidation, first-pass metabolism, and rapid efflux have been the major hurdles in drug development.11–13 An efficient delivery system is therefore required to improve targeting and bioavailability of EGCG. Given this, primary tasks in the study of EGCG include finding an appropriate target site for delivery, and the maintenance of adequate cell fluid concentration.
Nanomaterial-based therapeutics have recently attracted increasing attention. With some unique chemical and physical properties, gold nanoparticles have been trialed as a vehicle for nanomaterial-based therapeutics.14,15 Indeed, gold nanoparticles have been broadly used in biomedical applications (eg, as contrast agents, cancer drug vehicles, transfection agents, antineoplastic agents, etc).16 Most importantly, surfaces of gold nanoparticles with desired molecules attached have been developed to transport, for example, complex molecular cargoes to metastasis sites as well as to specific cell populations.17 EGCG-pNG was reported to have synergistic anticarcinogenic activity, whereby bladder cancer tumor growth was inhibited in a C3H/HeN mice model through cell apoptosis.15 However, nanoparticles may provoke some negative effects, for example, blood cell toxicity.18–20 The composition of blood is rather complicated, and generally divided into three main groups playing key roles in the homeostasis of blood: white blood cells (immune response), red blood cells (RBCs; oxygen delivery), and platelets (thrombosis). Unfortunately, the vulnerability of these cells when exposed to nanoparticles has rarely been studied.21
In our previous study,15 EGCG-pNG successfully exhibited an anti-cancer effect on bladder cells in vitro and in vivo. We chose to investigate the effects of EGCG-pNG in melanoma because of the condition’s increasing incidence, high fatality rate for skin tumors, and therapy-refractory characteristics. In this report, the anti-cancer efficacy of EGCG-pNG on B16F10 murine melanoma cells was investigated in vitro and in vivo. Furthermore, we paid particular attention to the hemolysis of RBCs when EGCG-pNG was applied.
Materials and methods
Cell culture and chemicals
B16F10 murine melanoma cells and African green monkey kidney cells (Vero cells, as control cells) were both obtained from the Bioresource Collection and Research Center (BCRC) of the Food Industrial Research and Development Institute, Hsinchu, Taiwan. Initially, B16F10 and Vero cells from BCRC were dispensed in cryogenic vials with dimethylsulfoxide (DMSO) and stored in a liquid nitrogen tank. All test cells were refrozen and used from the above original cryogenic vials of cells. Dulbecco’s Modified Eagle’s Medium (DMEM; Life Technologies, Carlsbad, CA, USA) containing 10% fetal bovine serum with 100 units/mL penicillin and 100 μg/mL streptomycin was used for B16F10 and Vero cell culture. The EGCG was purchased from Taiyo Kagaku Co (Tokyo, Japan), and pNG was purchased from Gold Nano Tech, Inc., (Taipei, Taiwan). Taxol® (paclitaxel, T7191 Sigma, purity ≥97%) was purchased from Sigma-Aldrich (St Louis, MO, USA), and N-Benzyloxycarbonyl-Val-Ala-Asp (O-Me) fluoromethyl ketone (Z-VAD-FMK) was purchased from BD (Becton, Dickinson and Company; BD Pharmingen, San Jose, CA, USA; catalog number 550377).
Preparation of EGCG-pNG
The preparation of EGCG-pNG has been described in our previous report.22 Briefly, EGCG:pNG ratios of 12.5:1.25, 25:1.25, 50:1.25, 100:1.25, 12.5:2.5, 25:2.5, 50:2.5 and 100:2.5 (all μM:ppm) were physically mixed via ultrasonication at room temperature for 5 minutes, followed by high-speed centrifugation at 14,000 rpm for 2 hours; the supernatant was then removed. All pellets were dissolved in deionized water. The centrifugation and supernatant-removing process was repeated twice. Finally, we dissolved the pellets in deionized water, and the EGCG-pNG nanoparticles were ready to use.
Characterization of EGCG-pNG
Evaluation of the size and zeta-potential of EGCG-pNG, and the EGCG ratio in EGCG-pNG is described in our previous report.22 Briefly, nanoparticle size of EGCG-pNG (in the ratio of EGCG:pNG:12.5:1.25, 25:1.25, 50:1.25, 100:1.25, 12.5:2.5, 25:2.5, 50:2.5 and 100:2.5 [all μM:ppm]) was characterized by photon correlation spectroscopy (Zetasizer Nano ZS; Malvern Instruments, Malvern, Worcestershire, UK) under 633 nm wavelength at room temperature with 173° detection angle. Mean hydrodynamic sizes were subsequently calculated through cumulant analysis (Z-average mean) from the raw data. Zeta potentials of all nanoparticles were analyzed via laser Doppler anemometry (Zetasizer Nano ZS). The free EGCG was determined via a high-performance liquid chromatography (HPLC) (Waters Corporation, Milford, MA, USA) system equipped with an automated gradient controller, 510 pumps, U6K injector, 481 detector, 746 data module, and Waters μBondapak C18 column (3.9×300 mm). The concentration of pNG was calculated based on ultraviolet-visible spectrophotometer (PerkinElmer Inc., Waltham, MA, USA) analysis via the standard curve of acknowledged pNG concentrations at 520 nm. The fraction of EGCG contained in the EGCG-pNG was calculated by dividing the total EGCG amount by the sum of the total pNG and EGCG amounts.
Cytotoxicity assay
Viable B16F10 and Vero cell numbers were quantified indirectly using WST-8 assay (Enzo Life Sciences, Inc., Lausen, Switzerland), with which the modified substrates could be reduced to a yellow formazan dye by the dehydrogenases in the mitochondria of viable cells. One hundred microliters of cells (1×10⁴) were subcultured into each well of a 96-well plate for 24 hours. Different concentrations of the EGCG (0, 6.25, 12.5, 25, 50, 100, 200, and 400 μM) or pNG (0, 1.25, 2.5, 5, 10, and 20 ppm), or the indicated combination ratios of EGCG and pNG post-ultrasound shaking, were then treated with the cells for 24 hours. Taxol® (0.5 μM) was used for the positive control. The excess EGCG was completely removed to avoid a redox reaction between EGCG and the WST-8 reagent, and the WST-8 reagent was added after the medium was exchanged. The fresh cells only in assigned wells were regarded as negative controls, and 450 nm absorbance was determined using an ELISA reader (EnSpire® Multimode Plate Readers 2300-001M; PerkinElmer Inc., USA). Cell viability was presented as the relative percentage ratio of the absorbance in the medium (containing EGCG, pNG, or EGCG-pNG at each concentration) to that in the control medium. The inhibitory concentrations of EGCG or PNG required to decrease 50% cell count (IC50) were evaluated via the non-linear least-squares method.
Annexin V binding assay
B16F10 cells were pretreated with pNG 2.5 ppm, EGCG 50 μM, EGCG-pNG 50 μM:2.5 ppm, and Taxol® 0.5 μM, respectively, for 24 hours. Annexin V-fluorescein isothiocyanate (FITC) Detection Kit (Enzo Life Sciences, Inc.) was used to analyze annexin V binding ability. Collected cells were washed with cold phosphate-buffered saline (PBS), centrifuged for 5 minutes at 1,500 rpm, and suspended repeatedly in binding buffer. The annexin V-FITC and propidium iodide (PI) were then added to 1×10⁵ preprocessed cells in a 5 mL test tube fitted on the flow cytometry apparatus. Cells were gently mixed and incubated on ice for 10 minutes in the dark. Finally, binding buffer was added to each tube, and 10,000 events were analyzed by Cytomics FC 500 (Beckman Coulter, Indianapolis, IN, USA) in each sample.
Mitochondrial membrane depolarization study by JC-10 coupled with Hoechst 33342 staining
B16F10 cells were cultured in a 96-well plate for 24 hours. The cells were treated with pNG 2.5 ppm, EGCG 50 μM, EGCG-pNG 50 μM:2.5 ppm, and Taxol® 0.5 μM, respectively, for 24 hours. JC-10 (Enzo) was then added for observation of mitochondrial depolarization, and Hoechst 33342 (Enzo) was added to cell nuclei DNA staining. The cells were visualized using a BD Pathway™ 435 high-content bioimager system (BD Biosciences). Polarized mitochondria with J-aggregate forms and depolarized mitochondria with monomer form were marked by orange and green fluorescence staining, respectively, while simultaneously being excited by 490 nm laser sources.
Caspase activities measurement based on enzyme-linked immunosorbent assay (ELISA)
B16F10 cells were cultured in 96-well plates with opaque sidewalls for 24 hours, and cells were then incubated with pNG (P2.5), EGCG (E50), EGCG-pNG (E50-P2.5), or Taxol® (0.5 μM) for 24 hours. Caspase-3, Caspase-8, and Caspase-9 Colorimetric Assay Kits (Enzo) were used independently to assess the activities of the above effector caspases, which trigger cell apoptosis by cleaving intracellular protein substrates. Yellow chromophores, p-nitroaniline (pNA), are labeled on those caspase substrates and can be released upon cleavage by an individual caspase. The indicated caspase substrates were mixed in the wells and incubated at 37°C for 2 hours. The amount of yellow pNA product is proportional to the amount of individual caspase cleavage activity presented in the samples. All samples were read at 405 nm in an ELISA reader. The fold increases in independent caspase activities were determined by comparing absorbance from the pNG, EGCG, or combination treated samples with those of the control samples.
In vivo induction and treatment of melanoma
Male C57/BL6 mice were purchased from the National Laboratory Animal Center (Taipei, Taiwan). The animals were housed in a climate-controlled room (24°C, 12-hour light/dark cycle, 50% ± 10% relative humidity, autoclaved bedding), with food (laboratory rodent diet, LabDiet® 5001; LabDiet, St Louis, MO, USA) and water ad libitum. All animal experiments were approved and monitored by the Institutional Animal Care and Use Committee of National Dong Hwa University (Hualien, Taiwan), and all work with the animals conformed to their guidelines for the humane care of animals.
Mice were injected with B16F10 cells (2×10⁵/mouse) at a volume of 100 μL PBS subcutaneously into the right footpad via a 30 G needle. The control group (PBS), EGCG group (2 mg EGCG/mouse), and EGCG-pNG group (2 mg EGCG-pNG [50 μM:2.5 ppm]/mouse) were tested in tumor-bearing mice. PBS, EGCG, and EGCG-pNG were administrated independently via intra-tumoral injection twice weekly on day 14 after tumor implantation. Tumor size, food intake, and body mass were measured twice weekly following the inoculation of tumor cells. A caliper was used to assess tumor growth by measuring two bisecting diameters in each tumor. Equation 1 was used to calculate tumor volumes:

All mice were sacrificed at day 29 after B16F10 cells were injected to grow into tumors and the tumors were sampled for subsequent histological examination.
Hemolysis assay
The hemolysis assay method was modified from a previous report.23 Ethylenediaminetetraacetic acid (EDTA)-stabilized human blood samples were freshly obtained from Hualien Armed Forces General Hospital, Taiwan. The RBC sample for testing was prepared by mixing 5 mL of blood with 10 mL of PBS, and the mixture was centrifuged at 10,000 × g for 10 minutes. After the RBC pellet was washed with 10 mL of PBS five times, 50 mL of PBS was added for further dilution and the testing sample was ready to use. Red hemoglobin leaching in the supernatant was used to assess the hemolysis level under exposure to various concentrations of EGCG, pNG, and EGCG-pNG. Measurements of hemoglobin absorption in RBCs were taken as positive and negative control under double-distilled water (dd-H2O) and PBS exposure, respectively. A 200 μL suspension of diluted RBCs was added into 800 μL of different concentrations of the EGCG (1.57, 3.125, 6.25, 12.5, 25, 50, 100, 200, 400, and 800 μM), pNG (0.625, 1.25, 2.5, 5, 10, and 20 ppm), and EGCG-pNG (50:2.5, 50:1.25, 25:2.5, 25:1.25, 12.5:2.5, and 12.5:1.25 [all μM:ppm]) solutions, and all samples were kept under static conditions at room temperature for 3 hours. Finally, all samples were centrifuged at 10,000 × g for 3 minutes, and 100 μL of supernatant from each sample was transferred to an independent well in a 96-well plate. Hemoglobin absorbance was determined using an ELISA reader at 570 nm, with a background correction performing at 655 nm. Equation 2 was used to calculate the hemolysis percentage of RBCs:

Statistical analysis
All data were presented as means ± standard deviation for at least three samples. The one-way analysis of variance (ANOVA) method was used to determine statistical significance. Different significance levels are marked at P<0.05, P<0.01, or P<0.001.
Results and discussion
Characterization of EGCG-pNG
The nanoparticle sizes and zeta potentials of EGCG-pNG are as noted in Table 1. Percentage packing of EGCG on pNG was evaluated based on EGCG content in the EGCG-pNG particles, and the percentage of EGCG content was observed to increase with an increasing EGCG:pNG ratio from 12.5 μM:1.25 ppm (1%) to 100 μM:1.25 ppm (27%) and 12.5 μM:2.5 ppm (7%) to 100 μM:2.5 ppm (29%), respectively (Table 1). As shown in Table 1, alteration of the EGCG:pNG ratio led to changes in the effective diameters and zeta potentials of EGCG-pNG nanoparticles. The EGCG-pNG particles at a ratio of 50 μM:1.25 ppm contained 27% EGCG conjugate, were around 64.7 nm in size, and had a zeta potential of −3.36 mV; these particles were used for further study. In our previous report,22 EGCG-pNG at a ratio of 50 μM:2.5 ppm showed longer EGCG activity half-life (110 days versus [vs] 5 hours), longer controlled release time (2 hours vs 30 minutes), and higher antioxidant activity (four times) than EGCG alone. Well nanoparticle dispersion was also deduced with an optimum zeta potential (±30 mV), which is more likely to occur for charged particles due to electrostatic repulsion.23
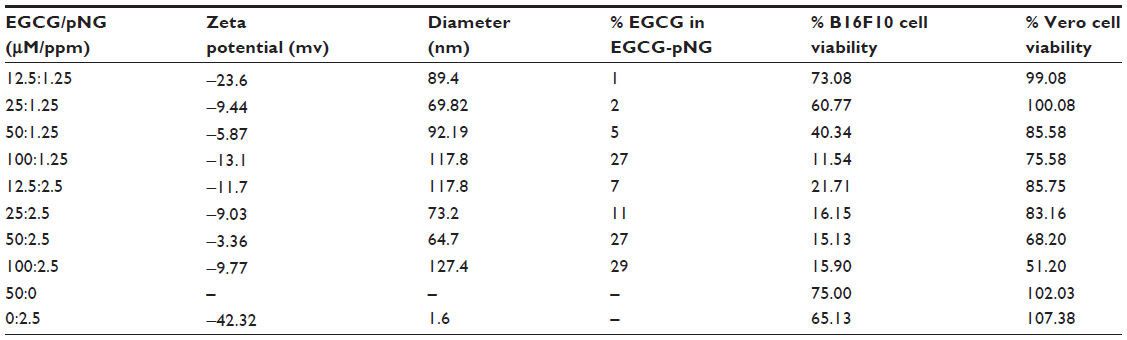 | Table 1 Characterization of EGCG-pNG versus cell viabilities after 24 hours of treatment |
Improving the anti-tumor effect of EGCG-pNG in vitro
Tumor cytotoxicity of EGCG and/or pNG was assessed by checking the viability of B16F10 murine melanoma cells and African green monkey kidney cells (Vero cells, as normal cells). Under 24-hour post-EGCG and/or pNG treatment, the viability of B16F10 cells was found to reduce in a concentration-dependent manner. After B16F10 and Vero cells were treated with 6.25, 12.5, 25, 50, 100, 200, or 400 μM EGCG for 24 hours, the viabilities of the B16F10 cell group were determined to be 92.56% ± 3.63%, 93.85% ± 27.56%, 79.36% ± 29.55%, 75.00% ± 15.41%, 40.26% ± 13.43%, 18.03% ± 5.65%, and 18.72% ± 4.87%, respectively. The viabilities of the EGCG-treated Vero cell group were 110.95% ± 5.20%, 107.94% ± 3.94%, 109.94% ± 4.51%, 102.03% ± 3.94%, 90.95% ± 0.85%, 47.19% ± 5.09%, and 36.53% ± 2.46%, respectively (Figure 1A). On the other hand, after B16F10 and Vero cells were treated with 1.25, 2.5, 5, 10, and 20 ppm pNG for 24 hours, the viabilities for the B16F10 cell group were 102.05% ± 0.91%, 65.13% ± 5.42%, 7.18% ± 1.78%, 2.99% ± 5.63%, and 0.68% ± 1.07%, respectively, whereas the viabilities of the pNG-treated Vero cell group were 103.47% ± 2.46%, 107.37% ± 2.36%, 96.12% ± 3.63%, 83.63% ± 2.96%, and 48.91% ± 2.68% respectively (Figure 1B).
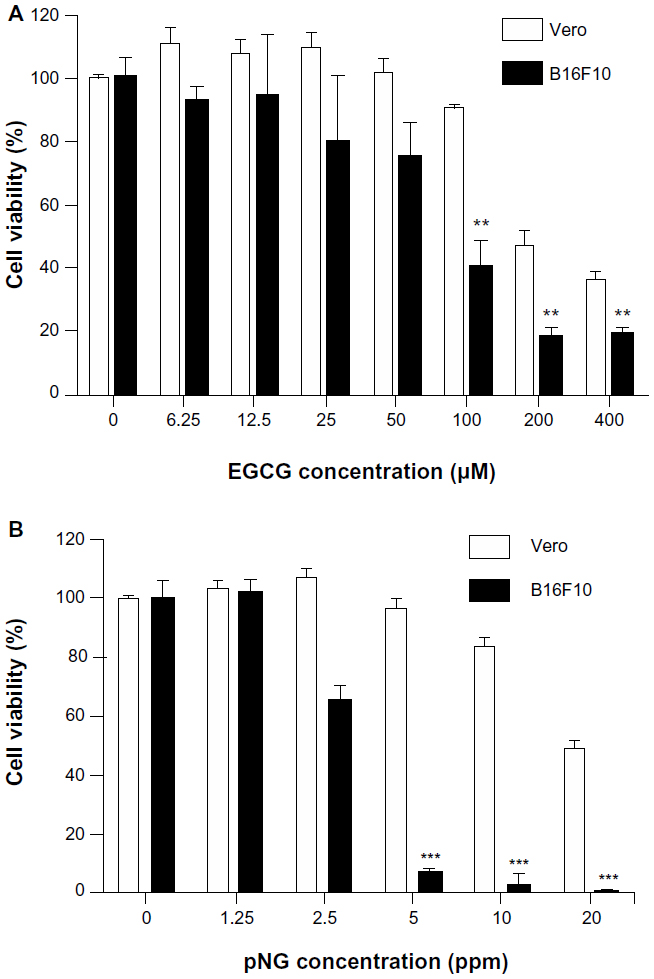 | Figure 1 The effects of EGCG and pNG on Vero and B16F10 cell proliferation. |
The IC50 of EGCG and pNG against murine B16F10 melanoma cells was determined to be approximately 88 μM and 3.8 ppm, respectively, whereas the IC50 of EGCG and pNG against Vero cells was determined to be approximately 133 μM and 13.1 ppm, respectively.
Improving the anti-tumor effect of EGCG-pNG was first determined by observation of cell morphology and counting of cell numbers with a given ratio of EGCG and pNG. Treatment with EGCG-pNG resulted in more cells with an abnormal morphology and fewer live cells than EGCG- or pNG-treated groups (Figure 2A). As per our protocol, mixing EGCG and pNG by sonication physically produced EGCG-pNG, which demonstrated the improved ability to reduce the viability of B16F10 cells compared with EGCG or pNG (Figure 2B). The EGCG-pNG (combination of 25 μM EGCG and 2.5 ppm pNG by ultrasound) significantly reduced B16F10 cell viability to 16.15% versus control, whereas the cell viability in the presence of EGCG or pNG alone was reduced to 79.36% and 65.13%, respectively, versus control. As a result, EGCG-pNG (conjugated formula of EGCG and pNG under sonication) does show an improved effect on suppression of B16F10 cells in Figure 2B. In contrast, EGCG-pNG (combination of 25 μM EGCG and 2.5 ppm pNG by ultrasound) significantly reduced B16F10 cell viability to 16.15% versus control, whereas the Vero cell viability in the same condition was only reduced to 83.16% versus control (Figure 2B). As a result, EGCG-pNG (conjugated formula of EGCG and pNG under sonication) did show a relatively weak cytotoxic effect on the Vero cell group, the normal cell control group, compared with the B16F10 cell group. The positive control, Taxol® (0.5 μM), demonstrated significantly reduced B16F10 cell viability to 10.44% versus control, whereas Vero cell viability in the same condition was reduced to 27.43% versus control.
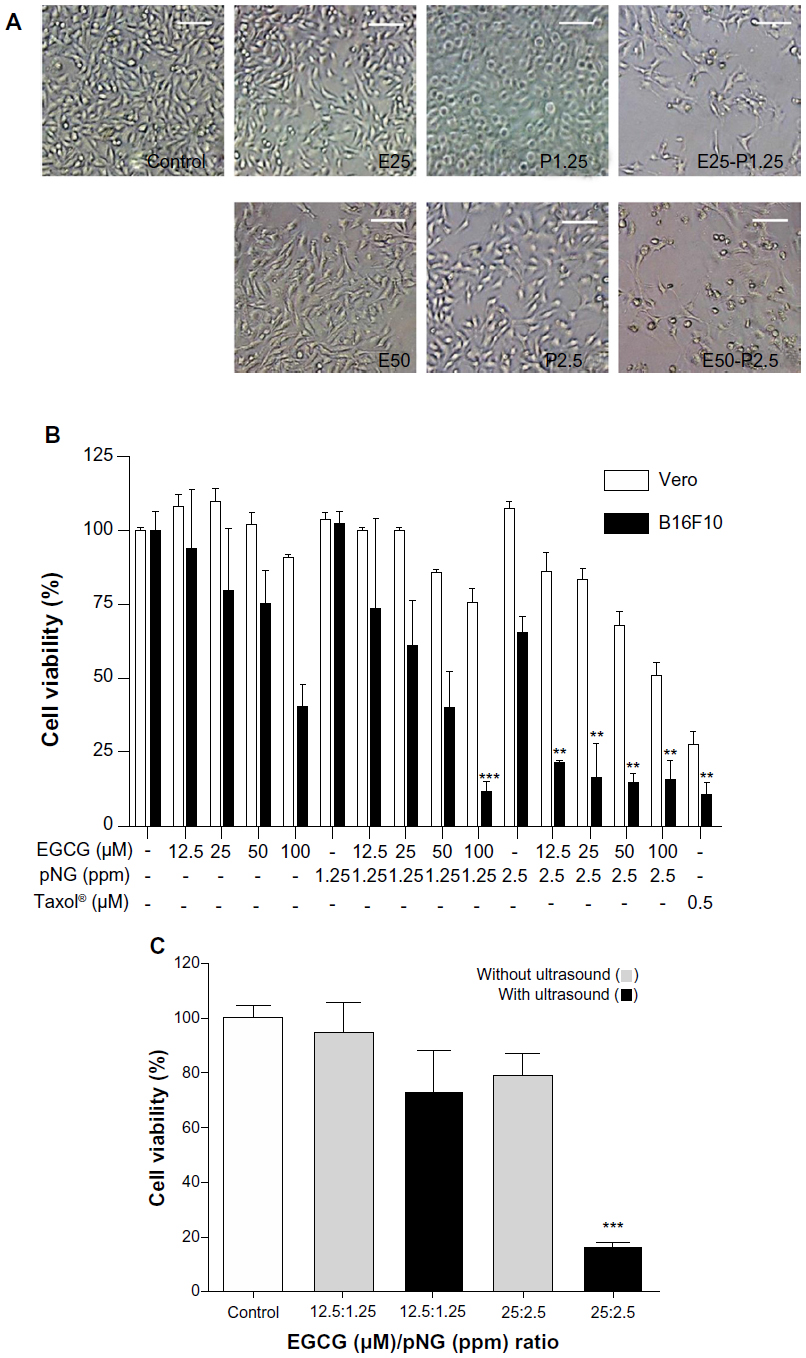 | Figure 2 Improving anti-proliferative activity of EGCG and pNG in vitro. |
We also wanted to know if the same mixing ratio of EGCG and pNG without sonication would also result in the same improved anti-melanoma effect. The cell viability of B16F10 cells was evaluated with the indicated ratios of mixtures of EGCG and pNG with or without ultrasound preprocessing. First, EGCG and nanogold (wherein the ratio of EGCG to nanogold is 12.5 μM:1.25 ppm and 25 μM:2.5 ppm) were prepared. Second, EGCG and the nanogold were mixed with or without ultrasound preprocessing. As a result, EGCG and pNG in a combination of 25 μM:2.5 ppm under the ultrasound preprocess significantly reduced the number of B16F10 cells to 4.88-fold (16.15% vs 78.89% cell viability relative to control) compared with the mixture without ultrasound preprocessing (Figure 2C), suggesting that the EGCG and pNG mixture is not able to enhance the cytotoxicity effect without ultrasound preprocessing. In our previous report,15 we found the physically ultrasonicated EGCG and pNG resulted in an improved cytotoxic effect over EGCG or pNG alone in bladder cancer cells. In this study, we further used the B16F10 cell line to confirm or deny the improved anti-melanoma effect. According to our results, the pure mixture of EGCG and pNG (wherein the ratio of EGCG to nanogold is 25 μM:2.5 ppm) without ultrasonication did not significantly improve the anti-melanoma effect. Conversely, EGCG-pNG (the ultrasonication product of EGCG and pNG mixture with the same ratio of EGCG to nanogold of 25 μM:2.5 ppm) could significantly improve a cytotoxic effect in B16F10 cells. That is why we claimed ultrasound treatment was a key process in enhancing the cytotoxicity of EGCG-pNG hybrids. In our previous report,15 we also proved that EGCG was attached to the surface of pNG by checking the alteration of zeta potential, scanning electron microscopy (SEM) structure, and decreasing conductivity in the EGCG-pNG hybrid. EGCG attached to the spherical pNG, as a vehicle for efficient delivery of EGCG, could increase the EGCG surface contact area for target cells over that of free EGCG and might increase the cell internalization via pNG nm-size delivery. We believe that is why the pure mixture of EGCG and pNG, without formation of EGCG-pNG, did not express any significant improvement in cytotoxicity in B16F10 cells.
In this study, taking the IC50 of EGCG and pNG for B16F10 and Vero cells into account, we wanted to choose an optimized mixed ratio of EGCG and pNG to proceed to further testing. Among the eight kinds of EGCG-pNG we prepared, the 100 μM:2.5 ppm EGCG-pNG showed the lowest cell viability (11.54%) for B16F10 cells, but the mixed EGCG concentration was over IC50 (88 μM). Finally, we chose 50 μM:2.5 ppm EGCG-pNG with penultimate cell viability (15.13%) for B16F10 cells to proceed to further experiments.
According to the IC50 results of EGCG and pNG against murine B16F10 melanoma cells, we designed the indicated mixed ratios of EGCG and pNG to evaluate the possible improving effect of EGCG-pNG on suppression of B16F10 cells. The trend for reduction in B16F10 cell viability with EGCG-pNG (wherein the ratio of EGCG to nanogold is in the range of 12.5:1.25, 25:1.25, 50:1.25, 100:1.25 [all μM:ppm]) depended on EGCG concentration. These results might be related to the increasing EGCG content with an increasing EGCG:pNG ratio as described in our previous report.15 On the other hand, EGCG-pNG demonstrated very close cytotoxic values without significance (P>0.05) on suppression of B16F10 cells in the range of 12.5:2.5, 25:2.5, 50:2.5, and 100:2.5 (all μM:ppm). As shown in Figure 2B and Table 1, the cell viability of EGCG-pNG 100 μM:2.5 ppm (127.4 nm) was higher than that of EGCG-pNG 50 μM:2.5 ppm (64.7 nm). This may be because the size of EGCG-pNG 100 μM:2.5 ppm is larger than the EGCG-pNG 50 μM:2.5 ppm (Table 1). Kagan et al24 reported that a nanomaterial with a smaller dimension could lead to greater toxicity. Smaller EGCG-pNG might be more able to contact cells and increase the uptake rate, leading to the greater anti-proliferation effects on B16F10 cells in this study. Xu et al25 reported that cells had a higher uptake for smaller gold nanoparticles. Cho et al26 further reported that the size of the gold nanostructures influenced their uptake by the cells in a similar way regardless of the surface chemistry. On the other hand, the Vero cell group, as the normal cell control, retained 51%–100% cell viability after EGCG-pNG treatment, demonstrating the relative lower cytotoxicity of EGCG-pNG for normal cells when compared with B16F10 cells (Table 1).
EGCG has been reported to have high anti-tumor activity.8,10,11 Toxicity of green tea-containing supplements has also been reported as related to liver damage and toxic effects in rodents.27–29 To preserve anti-tumor activity and avoid possible toxicity from EGCG, pNG conjugated with a relatively low dose of EGCG could also effectively inhibit tumor growth and reduce the possible toxicity of EGCG. Our experimental data led us to conclude that EGCG-pNG has a strong melanoma cytotoxic effect on B16F10 cells. So far as we know, this is the first case using physically derived gold nanoparticles in conjunction with EGCG with ultrasound preprocessing against melanoma. Combined treatment with EGCG and vorinostat or vitamin A has also shown improved and enhanced anti-melanoma efficacy.30,31 In our previous study, EGCG-pNG was also proven to access synergistic anti-cancer ability against bladder cancer.15,22
Apoptosis induction of B16F10 melanoma cells by EGCG-pNG
EGCG has been widely reported to induce apoptosis in various cancer cells.32–34 To further determine whether the enhanced cytotoxicity of EGCG-pNG in B16F10 cells also occurred via the same mechanism, B16F10 cells were first treated with pNG 2.5 ppm, EGCG 50 μM, EGCG-pNG 50 μM:2.5 ppm, and Taxol® 0.5 μM, respectively, for 24 hours. Annexin V and PI staining for apoptotic bodies were evaluated by flow cytometry analysis with 10,000 cells. The fractions of annexin V-positive B16F10 cells were 3.59% ± 0.30%, 12.63% ± 0.61%, 20.93% ± 0.55%, and 25.7% ± 0.54% after treatment with pNG 2.5 ppm, EGCG 50 μM, EGCG-pNG 50 μM:2.5 ppm, and Taxol® 0.5 μM, respectively, at 24 hours (Figure 3A). The fractions of annexin V-positive and PI-negative B16F10 cells were 1.0% ± 0.17%, 3.2% ± 0.23%, 6.5% ± 0.23%, and 11.7% ± 0.41% after treatment with pNG 2.5 ppm, EGCG 50 μM, EGCG-pNG 50 μM:2.5 ppm, and Taxol® 0.5 μM, respectively, at 24 hours (Figure 3B). The fraction of the annexin V-positive cells increased 1.7-fold for cells added with EGCG and 5.8-fold for cells added with pNG compared with that of cells added with EGCG-pNG (Figure 3A). The fraction of the annexin V-positive and PI-negative cells increased 2.03-fold for cells added with EGCG and 6.0-fold for cells added with pNG compared with that of cells added with EGCG-pNG (Figure 3B). It appears that EGCG-pNG has an enhanced effect on B16F10 apoptotic cell death. Taxol®-induced apoptosis, as the positive control, was observed through the increasing fraction of the annexin V-positive cells and the fraction of the annexin V-positive and PI-negative cells.
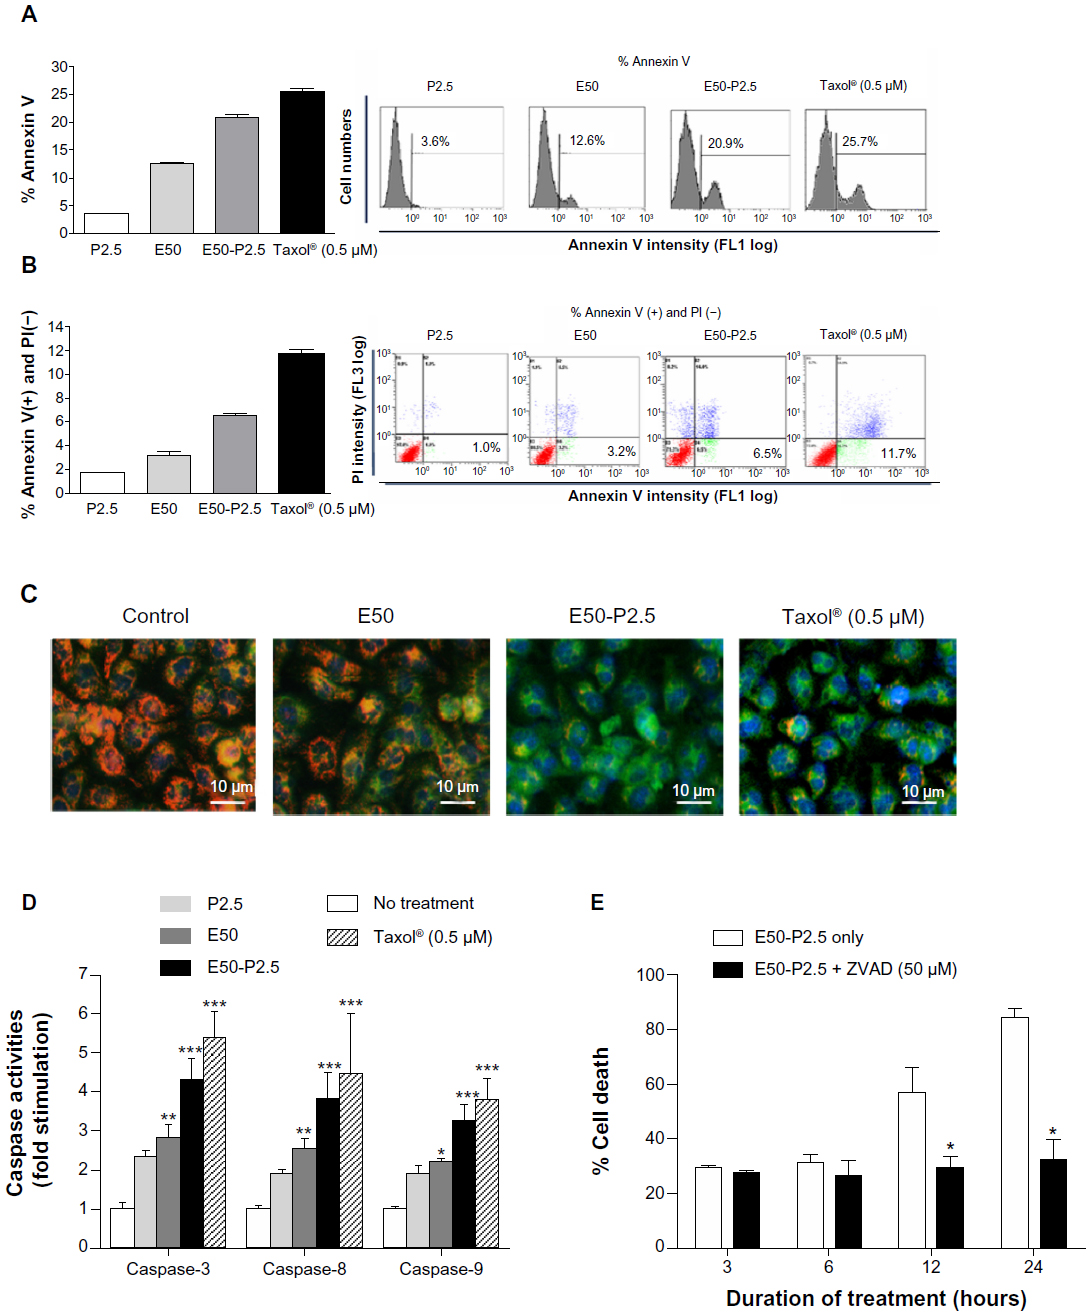 | Figure 3 Enhanced apoptosis induction of EGCG by pNG in B16F10 cells. |
JC-10, a cationic dye, could remain inside the healthy mitochondria and generate orange JC-10 aggregate emissions at 590 nm. With a mechanism similar to that of JC-1, JC-10 is an improved fluorescent probe used for the detection of potential change in mitochondrial membranes. The major advantages of JC-10 over JC-1 include improved solubility in aqueous media and a better ability to detect subtler changes in potential mitochondrial membrane loss. Along with cell injury, JC-10 monomers are generated with potential decreases in mitochondrial membrane and results in a shift to green emission at 525 nm. In the healthy B16F10 cells without any treatment, the fluorescence spectrum displayed a high intensity of orange fluorescence with JC-10 aggregates. However, the cells treated with EGCG, EGCG-pNG, or Taxol® (the positive control) displayed low to high intensities of green fluorescence with JC-10 monomers, indicating apoptotic signs (Figure 3C). The blue images in Figure 3C show the location of the B16F10 cell nuclei stained by Hoechst 33342 for easy observation and are not related to the damage level of mitochondria.
Caspase family proteins play a critical role in apoptosis induction. Caspase-8 is activated predominantly through a death receptor pathway and caspase-9 is activated mainly via a mitochondrial pathway. Both caspase-8 and -9 are responsible for activating the downstream factor, caspase-3. The activity expressions of caspase-3, -8, and -9 in B16F10 cells treated with EGCG-pNG (4.28 ± 0.97, 3.82 ± 1.1, 3.24 ± 0.77-fold increases versus the cells-only control) proved to be relatively higher than the cells treated with EGCG only (3.25 ± 0.57, 3.00 ± 0.40, 2.18 ± 0.07-fold increases versus the cells-only control) (Figure 3D). The activity expressions of caspase-3, -8, and -9 in B16F10 cells treated with the positive control, Taxol® 0.5 μM (5.37 ± 0.68, 4.46 ± 0.59, 3.81 ± 0.52-fold increases versus the cells-only control) demonstrated positive, and the highest, results compared with EGCG and EGCG-pNG (Figure 3D).
In order to test whether in vitro caspase inhibition could reverse cytotoxicity under EGCG-pNG treatment, we used a pan-caspase inhibitor (Z-VAD-FMK) known to bind to the catalytic sites of active caspases, rendering them inactive. Briefly, B16F10 cells were treated with EGCG-pNG (50 μM:2.5 ppm) in the presence or absence of Z-VAD-FMK (50 μM) for 3–24 hours. The results showed that inhibition of caspases by Z-VAD-FMK at early time points (3–6 hours) did not alter EGCG-pNG-induced cell death. However, at later time points (12–24 hours), inhibition of caspases significantly reversed cell death in B16F10 cells (Figure 3E). These data suggest that EGCG-pNG treatment may initiate a time-dependent apoptotic activation via a caspase pathway in B16F10 melanoma cells.
In this study, the discrepancy between the cell viability test and flow data should be noted. In Figure 1, in the cell viability test, P2.5 (65% viability) demonstrated a higher proportion of dead cells than E50 (75% viability). In Figure 3A and B, the flow data suggest that E50 demonstrated a higher proportion of apoptotic cells than P2.5. In this study, we used a WST-8 assay to evaluate overall cell viability, regardless of cell death types and stages. Types of cell death, such as apoptosis, necrosis, autophagy, cornification, the termination of cell proliferation, and others, could affect the numbers of viable cells.35,36 On the other hand, the flow data from annexin V-FITC and PI staining were specific for apoptotic bodies. The purposes of the WST-8 test and apoptosis assay do not completely overlap. We believed that P2.5 might induce more cell death than E50 via non-apoptotic pathways and demonstrate a lesser apoptotic effect than E50 in B16F10 cells.
In 1972, Kerr et al reported the concept of apoptosis to describe a mode of cell death morphologically different from that of necrosis.37 The morphological characterizations of apoptosis include rounding cell, condensed chromatin, DNA fragmentation, and engulfment by neighboring cells.35,36 In this study, we used cell morphology observation, annexin V/PI staining, JC-10 staining, and detection of caspase-3, -8, and -9 activity to evaluate possible apoptotic pathways in B16F10 cells via EGCG-pNG. We demonstrated that EGCG-pNG induced an enhanced apoptotic effect in the B16F10 cells by increasing abnormal cell observation, increasing the percentage of apoptotic bodies, increasing caspase-3, -8, -9 activity, and increasing alteration of mitochondria potential. In our previous study, similar results were also reported in the mouse bladder cancer cells.15
EGCG-mediated apoptosis in various types of cancers has been well documented.34,38–40 EGCG associated with heavy metals (eg, Zn2+ and Cd2+) has reportedly been able to enhance the biological activities of EGCG,41,42 particularly in tumor cell necrosis or apoptosis.41 Shukla et al43 reported that the development of radioactive gold nanoparticles combined with EGCG (198AuNP-EGCg) effectively uploaded nanoparticles onto prostate tumor cells and facilitated EGCG internalization through 67 laminin receptors.
Improving the anti-tumor effect of EGCG-pNG in vivo
We conducted an in vivo anti-tumor efficacy evaluation in a C57/BL6 mouse model (Figure 4A). Mice were first implanted with B16F10 cells on the footpads to grow melanoma in situ and were then treated with PBS, EGCG, or EGCG-pNG via intra-tumoral injection twice a week on day 14 after tumor implantation. Our results revealed that tumor volumes shrank in the footpads of mice receiving either EGCG or EGCG-pNG in comparison with the control group (Figure 4B). In the control group, histological sections of tumors showed apparent engorgement of tumor vessels compared with those in the EGCG-pNG group. Melanocyte infiltration was also observed to be greater in the control group than in the EGCG-pNG group (Figure 4C). Both EGCG and EGCG-pNG groups showed significant anti-tumor effects when compared with the control group (Figure 4D). The tumor volumes in the EGCG-pNG group were also significantly reduced compared with those in the control group (P<0.001) (Figure 4D). Less fluid accumulation in the footpad melanoma was observed in the EGCG-pNG group than in either the EGCG or the control group. EGCG-pNG was 1.66 times more effective than free EGCG in inhibiting tumor growth on day 29 in the melanoma mouse model.
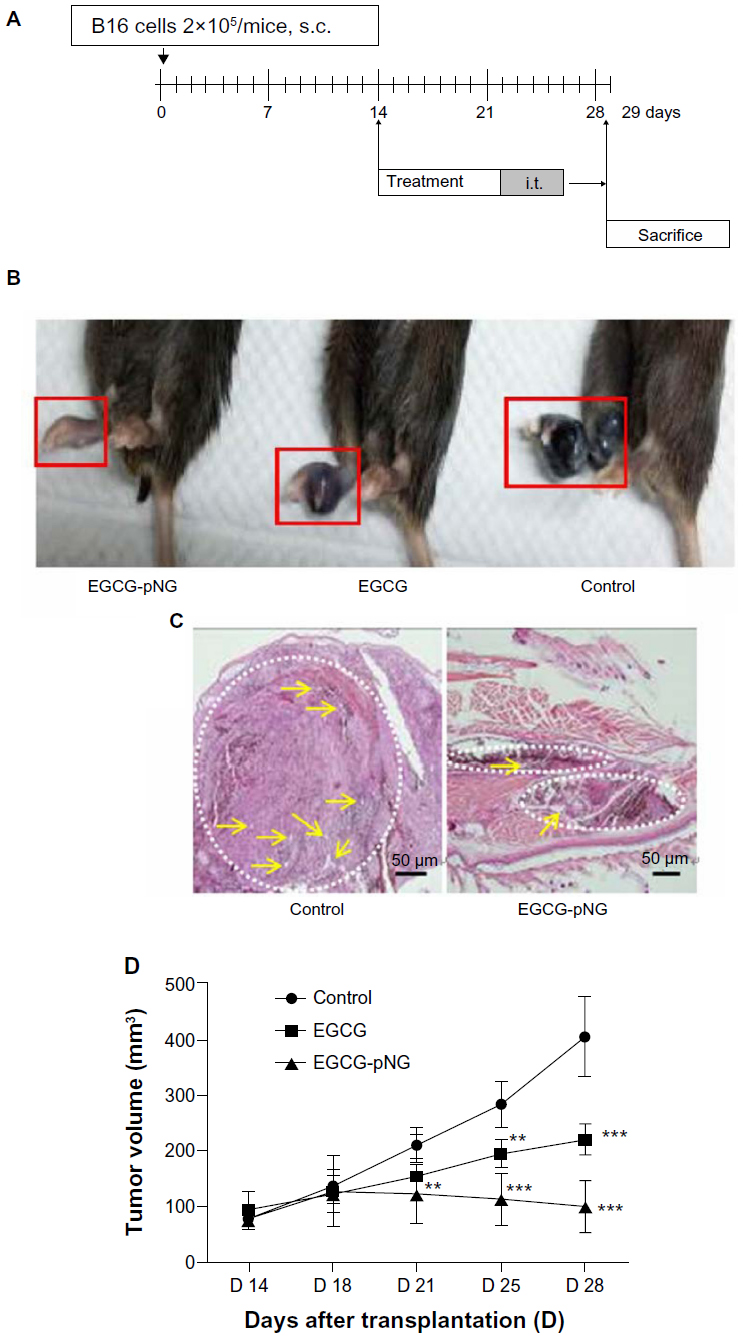 | Figure 4 Increased tumor growth inhibition of EGCG by pNG in vivo. |
To check for possible renal and hepatic side effects, nanogold and EGCG-pNG were administrated subcutaneously in the footpads to determine the liver and renal functions via serum biochemistry data in test mice. Briefly, normal mice were given the same dose of pNG 2.5 ppm and EGCG-pNG 50 μM:2.5 ppm as those in the mice tumor model for 7 consecutive days. On day 8, the mice were killed and serum was collected. No significant differences were found in the serum levels of creatinine, blood urea nitrogen, bilirubin alkaline phosphatase, alanine aminotransferase, or aspartate aminotransferase between the EGCG-pNG- or nanogold-treated and untreated control animals (data not shown).
In clinical statistics, Walsh et al44 reported that primary melanoma on the foot or ankle exhibited a lower survival rate (52%) than melanoma located elsewhere on the leg (84%). On the other hand, recurrence or metastasis were still possible for the primary melanoma, such as foot melanoma, with adequate surgical resection during the clinical course. Instead of using a well-established melanoma dorsal model to investigate the potential of EGCG-pNG as a candidate for the anti-melanoma drug, we set up another more realistic melanoma footpad model for the mainly anti-cancer evaluation of primary melanoma developed on the foot in this study. A melanoma footpad model might offer a more realistic system to evaluate a new anti-cancer drug for direct or combined therapy in primary melanoma.
In our previous study, the anti-cancer effect of EGCG-pNG for bladder tumors was demonstrated in the C3H/HeN mouse model.15 In this study, EGCG-pNG was first proved to perform with strong anti-cancer efficacy for melanoma by direct intra-tumoral administration in the C57/BL6 mouse model. Common major barriers impeding the distribution and penetration of anti-cancer drugs in solid tumors include rigid extracellular matrix and elevated interstitial fluid pressure.45 Direct intra-tumoral drug administration can not only bypass these major hindrances via systemic delivery but can also avoid rapid drug clearance by increasing local retention in the target tumor, resulting in better therapeutic payloads.
Enhanced biocompatibility of EGCG-pNG in human RBCs
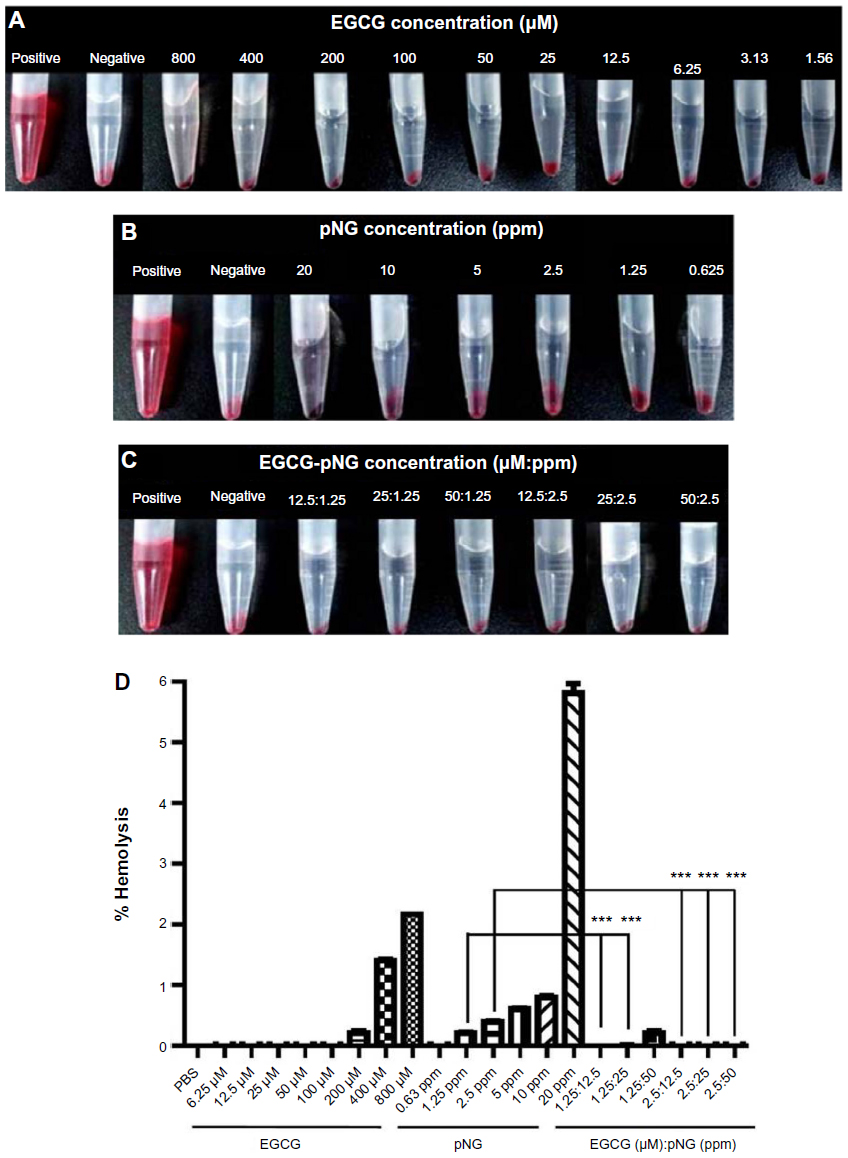
Toxicity evaluation of EGCG and/or pNG was performed by measuring the damage to human RBCs exposed to EGCG and/or pNG by hemolysis assay. Red hemoglobin is released when RBCs are damaged, and can be measured at 570 nm, the absorbance of hemoglobin. Figure 5A–C are photographs of the RBCs exposed to EGCG and/or pNG with different concentrations or ratios. As shown in Figure 5D, we found that the higher the concentrations of EGCG and pNG, the higher the release of hemoglobin from the cell lysis. With either EGCG or pNG, 3-hour incubation with RBCs showed a concentration-dependent hemolysis. By using the IC50 and LC1 (the condition leading to 1% hemolysis) of EGCG conjugated with pNG, the best combination ratio of EGCG-pNG was determined to be EGCG 50 μM:pNG 2.5 ppm, whereby lower release of hemoglobin from cell lysis was established.
 | Figure 5 RBC hemolysis after treatment. |
As shown in Table 2, all EGCG-pNG in a range of 12.5 μM:1.25 ppm to 50 μM:2.5 ppm demonstrated a decline in hemolysis level compared with bare pNG. This may result from the neutralization of the negative surface of pNG by EGCG. On the other hand, 0% hemolysis of pure 12.5–50 μM EGCG was equal to or less than the hemolysis levels of corresponding EGCG-pNG with identical EGCG dose. In contrast with the pure low-dose EGCG (12.5–100 μM) without hemolysis effect, pure high-dose EGCG (200–800 μM) demonstrated a dose-dependent hemolysis effect from 0.21% to 2.16%. The different hemolysis results between pure low-dose EGCG and pure high-dose EGCG might be related to the dual function, anti-oxidant function in the low dose and the pro-oxidant function in the high dose of EGCG. EGCG, as a conventional antioxidant, has been reported to induce oxidative stress when applied in high doses.46,47
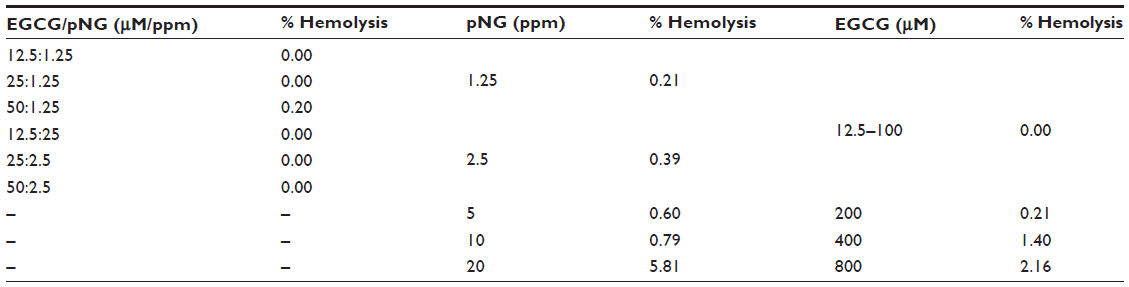 | Table 2 Three-hour hemolysis level of EGCG-pNG, pNG, and EGCG |
Love et al21 reported that the level of hemolysis induction by gold nanoparticles was related to the zeta potential on the gold surface in a concentration-dependent manner. Lundqvist et al48 and others49–51 recently suggested that the difference in nanoparticle adsorption is due to various surface functional groups. The pNG surface conjugated with EGCG is most likely to be the key factor that contributes the lesser release of hemoglobin from human RBCs. The other normal cell toxicity (eg, endothelial cell toxicity) has also been used for toxicity evaluation in nanoscience. Duan et al52 reported that silica nanoparticles could be a potential hazard by inducing a toxic effect on endothelial cells in terms of cardiovascular disease development. EGCG-pNG, as a biocompatible material candidate, really needs more toxicity evaluation before further application in biomedicine.
Anti-cancer potentials of EGCG-pNG
The combination of the anti-cancer properties of EGCG and the stable gold-nanoparticle delivery system, EGCG-pNG, a nanosize compound, was successfully fabricated by our group via the attachment of EGCG onto pNG via a sonication process. In general, nanomedicines were designed to improve pharmacokinetics through more passive and active targeting, steady drug release, prolonged blood circulation, and more opportunities to be taken up by cells via endocytosis.53 The enhanced permeability and retention effect (EPR effect) is also a well-known property allowing anti-cancer nanomedicines to accumulate in tumor tissue much more than they do in normal tissues, resulting in improved anti-cancer effects.54 Targeting of specific receptors and/or angiogenesis factors was also a common strategy used to enhance the effects of anti-cancer drugs.55 The 67 laminin receptor, a specific cell surface receptor of EGCG, has been reported to overexpress in various cancer cells but not in normal cells. Shukla et al43 reported that 198AuNP-EGCG nanoparticles, prepared via redox chemistry, could selectively bind to 67 laminin receptors, which are overexpressed in prostate tumor cells, with excellent affinity and show efficacy in treating prostate cancer. On the other hand, gold nanoparticles have been reported to bind vascular permeability factor/vascular endothelial growth factor and basic fibroblast growth factor, two endothelial cell mitogens and mediators of angiogenesis, resulting in inhibition of endothelial/fibroblast cell proliferation in vitro, and induced permeability, and angiogenesis in vivo.55 Applications of EGCG-pNG therapy in anti-cancer fields via 67 laminin receptors and/or targeting of angiogenesis factors might be feasible strategies for future study. In terms of safety, EGCG-pNG was fabricated via sonication using EGCG, a natural compound, and pNG, a physical product without any chemical reducers or stabilizers. The enhanced biocompatibility of EGCG-pNG due to reduced hemolysis compared with bare pNG is another benefit for further possible clinical trials.
As a natural compound, EGCG was originally considered to be nontoxic and was recently found to be efficacious as a prophylactic, but also as a therapeutic, agent acting through different pathways. Inevitably, the rather poor bioavailability and potential side effects of EGCG need to be considered when we extrapolate results obtained in vitro to situations in vivo. Modified EGCG, such as EGCG-pNG, has been designed using nanotechnology to enhance efficacy and/or reduce toxicity. As previously mentioned, EGCG-pNG prepared at indicated ratios could demonstrate higher stability over a reasonable period of time at a pH <4, a prolonged retention time, and enhanced biocompatibility in human RBCs compared with free EGCG. In our study, EGCG-pNG also successfully displayed improved anti-cancer properties for bladder cancer and melanoma in vitro and in vivo. For further possible applications and increasing therapeutic feasibility, the bioavailability and possible side effects of EGCG-pNG need to be further evaluated in future studies.
Conclusion
We report for the first time that gold nanoparticles coated with EGCG is a combination capable of inhibiting the growth of murine B16F10 melanoma cells. The combined EGCG-pNG exerts an improved effect, greatly increasing inhibition of the growth of B16F10 melanoma cells. The inhibitory mechanism of EGCG-pNG was determined through cell apoptosis by increasing abnormal cell observation, percentage of apoptotic bodies, caspase-3, -8, -9 activity, and alteration of mitochondria potential. In particular, EGCG-pNG showed marked efficacy against the growth of melanoma tumors in vivo. The high biocompatibility of EGCG-pNG was also established via hemolysis assay. In conclusion, EGCG-pNG particles promise infinite potential in the treatment of various cancers in addition to melanoma.
Acknowledgments
The authors thank Gold NanoTech, Inc., Taiwan, for kindly providing physical nanogold particles.
Disclosure
The authors declare that they have no competing interests.
References
Markovic SN, Erickson LA, Rao RD, et al; Melanoma Study Group of the Mayo Clinic Cancer Center. Malignant melanoma in the 21st century, part 1: epidemiology, risk factors, screening, prevention, and diagnosis. Mayo Clin Proc. 2007;82(3):364–380. | |
Guevara-Canales JO, Gutiérrez-Morales MM, Sacsaquispe-Contreras SJ, Sánchez-Lihón J, Morales-Vadillo R. Malignant melanoma of the oral cavity. Review of the literature and experience in a Peruvian Population. Med Oral Patol Oral Cir Bucal. 2012;17(2):e206–e211. | |
Pusceddu S, Bajetta E, Carcangiu ML, Formisano B, Ducceschi M, Buzzoni R. A literature overview of primary cervical malignant melanoma: an exceedingly rare cancer. Crit Rev Oncol Hematol. 2012;81(2):185–195. | |
Vikey AK, Vikey D. Primary malignant melanoma, of head and neck: a comprehensive review of literature. Oral Oncol. 2012;48(5):399–403. | |
Bhatia S, Tykodi SS, Thompson JA. Treatment of metastatic melanoma: an overview. Oncology (Williston Park). 2009;23(6):488–496. | |
Sak K. Chemotherapy and dietary phytochemical agents. Chemother Res Pract. 2012;2012:282570. | |
Alisi A, Balsano C. Enhancing the efficacy of hepatocellular carcinoma chemotherapeutics with natural anticancer agents. Nutr Rev. 2007; 65(12 Pt 1):550–553. | |
Kuo PL, Lin CC. Green tea constituent (−)-epigallocatechin-3-gallate inhibits Hep G2 cell proliferation and induces apoptosis through p53-dependent and Fas-mediated pathways. J Biomed Sci. 2003;10(2):219–227. | |
Mukhtar H, Agarwal R. Skin cancer chemoprevention. J Investig Dermatol Symp Proc. 1996;1(2):209–214. | |
Singh BN, Shankar S, Srivastava RK. Green tea catechin, epigallocatechin-3-gallate (EGCG): mechanisms, perspectives and clinical applications. Biochem Pharmacol. 2011;82(12):1807–1821. | |
Kale A, Gawande S, Kotwal S, et al. Studies on the effects of oral administration of nutrient mixture, quercetin and red onions on the bioavailability of epigallocatechin gallate from green tea extract. Phytother Res. 2010;24(Suppl 1):S48–S55. | |
Landis-Piwowar KR, Huo C, Chen D, et al. A novel prodrug of the green tea polyphenol (-)-epigallocatechin-3-gallate as a potential anticancer agent. Cancer Res. 2007;67(9):4303–4310. | |
Dube A, Nicolazzo JA, Larson I. Chitosan nanoparticles enhance the intestinal absorption of the green tea catechins (+)-catechin and (-)-epigallocatechin gallate. Eur J Pharm Sci. 2010;41(2):219–225. | |
Xia Y, Li W, Cobley CM, et al. Gold nanocages: from synthesis to theranostic applications. Acc Chem Res. 2011;44(10):914–924. | |
Hsieh DS, Wang H, Tan SW, et al. The treatment of bladder cancer in a mouse model by epigallocatechin-3-gallate-gold nanoparticles. Biomaterials. 2011;32(30):7633–7640. | |
Dreaden EC, Alkilany AM, Huang X, Murphy CJ, El-Sayed MA. The golden age: gold nanoparticles for biomedicine. Chem Soc Rev. 2012;41(7):2740–2779. | |
Schroeder A, Heller DA, Winslow MM, et al. Treating metastatic cancer with nanotechnology. Nat Rev Cancer. 2011;12(1):39–50. | |
Love SA, Maurer-Jones MA, Thompson JW, Lin YS, Haynes CL. Assessing nanoparticle toxicity. Annu Rev Anal Chem (Palo Alto Calif). 2012;5:181–205. | |
Maurer-Jones MA, Bantz KC, Love SA, Marquis BJ, Haynes CL. Toxicity of therapeutic nanoparticles. Nanomedicine (Lond). 2009;4(2):219–241. | |
Mayer A, Vadon M, Rinner B, Novak A, Wintersteiger R, Fröhlich E. The role of nanoparticle size in hemocompatibility. Toxicology. 2009;258(2–3):139–147. | |
Love SA, Thompson JW, Haynes CL. Development of screening assays for nanoparticle toxicity assessment in human blood: preliminary studies with charged Au nanoparticles. Nanomedicine (Lond). 2012;7(9):1355–1364. | |
Hsieh DS, Lu HC, Chen CC, Wu CJ, Yeh MK. The preparation and characterization of gold-conjugated polyphenol nanoparticles as a novel delivery system. Int J Nanomedicine. 2012;7:1623–1633. | |
Bhumkar DR, Joshi HM, Sastry M, Pokharkar VB. Chitosan reduced gold nanoparticles as novel carriers for transmucosal delivery of insulin. Pharm Res. 2007;24(8):1415–1426. | |
Kagan VE, Bayir H, Shvedova AA. Nanomedicine and nanotoxicology: two sides of the same coin. Nanomedicine. 2005;1(4):313–316. | |
Xu C, Tung GA, Sun S. Size and Concentration Effect of Gold Nanoparticles on X-ray Attenuation As Measured on Computed Tomography. Chemistry of Materials. 2008;20(13):4167–4169. | |
Cho EC, Au L, Zhang Q, Xia Y. The Effects of Size, Shape, and Surface Functional Group of Gold Nanostructures on Their Adsorption and Internalization by Cells. Small. 2010;6(4):517–522. | |
Bonkovsky HL. Hepatotoxicity associated with supplements containing Chinese green tea (Camellia sinensis). Ann Int Med. 2006;144(1):68–71. | |
Mazzanti G, Menniti-Ippolito F, Moro PA, et al. Hepatotoxicity from green tea: a review of the literature and two unpublished cases. Eur J Clin Pharmacol. 2009;65(4):331–341. | |
Galati G, Lin A, Sultan AM, O’Brien PJ. Cellular and in vivo hepatotoxicity caused by green tea phenolic acids and catechins. Free Radic Biol Med. 2006;40(4):570–580. | |
Lee JH, Kishikawa M, Kumazoe M, Yamada K, Tachibana H. Vitamin A enhances antitumor effect of a green tea polyphenol on melanoma by upregulating the polyphenol sensing molecule 67-kDa laminin receptor. PloS One. 2010;5(6):e11051. | |
Nihal M, Roelke CT, Wood GS. Anti-melanoma effects of vorinostat in combination with polyphenolic antioxidant (−)-epigallocatechin-3-gallate (EGCG). Pharm Res. 2010;27(6):1103–1114. | |
Suganuma M, Saha A, Fujiki H. New cancer treatment strategy using combination of green tea catechins and anticancer drugs. Cancer Sci. 2011;102(2):317–323. | |
Yang CS, Wang X, Lu G, Picinich SC. Cancer prevention by tea: animal studies, molecular mechanisms and human relevance. Nat Rev Cancer. 2009;9(6):429–439. | |
Shankar S, Ganapathy S, Srivastava RK. Green tea polyphenols: biology and therapeutic implications in cancer. Front Biosci. 2007;12:4881–4899. | |
Galluzzi L, Vitale I, Abrams JM, et al. Molecular definitions of cell death subroutines: recommendations of the Nomenclature Committee on Cell Death 2012. Cell Death Differ. 2012;19(1):107–120. | |
Kroemer G, Galluzzi L, Vandenabeele P, et al. Classification of cell death: recommendations of the Nomenclature Committee on Cell Death 2009. Cell Death Differ. 2009;16(1):3–11. | |
Kerr JF, Wyllie AH, Currie AR. Apoptosis: a basic biological phenomenon with wide-ranging implications in tissue kinetics. British Journal of Cancer. 1972;26(4):239–257. | |
Sharangi AB. Medicinal and therapeutic potentialities of tea (Camellia sinensis L.) – a review. Food Res Int. 2009;42(5–6):529–535. | |
Bug M, Dobbelstein M. Anthracyclines induce the accumulation of mutant p53 through E2F1-dependent and -independent mechanisms. Oncogene. 2011;30(33):3612–3624. | |
Sonnenschein C, Soto AM. The death of the cancer cell. Cancer research. July 1, 2011;71(13):4334–4337. | |
Yang J, Yu H, Sun S, et al. Mechanism of free Zn(2+) enhancing inhibitory effects of EGCG on the growth of PC-3 cells: interactions with mitochondria. Biol Trace Elem Res. 2009;131(3):298–310. | |
Yu HN, Shen SR, Yin JJ. Effects of interactions of EGCG and Cd2+ on the growth of PC-3 cells and their mechanisms. Food Chem Toxicol. 2007;45(2):244–249. | |
Shukla R, Chanda N, Zambre A, et al. Laminin receptor specific therapeutic gold nanoparticles (198AuNP-EGCg) show efficacy in treating prostate cancer. Proc Natl Acad Sci U S A. 2012;109(31):12426–12431. | |
Walsh SM, Fisher SG, Sage RA. Survival of patients with primary pedal melanoma. J Foot Ankle Surg. 2003;42(4):193–198. | |
Xie H, Goins B, Bao A, Wang ZJ, Phillips WT. Effect of intratumoral administration on biodistribution of 64Cu-labeled nanoshells. Int J Nanomedicine. 2012;7:2227–2238. | |
Yiannakopoulou ECh. Targeting oxidative stress response by green tea polyphenols: clinical implications. Free Radic Res. 2013;47(9):667–671. | |
Kanadzu M, Lu Y, Morimoto K. Dual function of (–)-epigallocatechin gallate (EGCG) in healthy human lymphocytes. Cancer Lett. 2006;241(2):250–255. | |
Lundqvist M, Stigler J, Elia G, Lynch I, Cedervall T, Dawson KA. Nanoparticle size and surface properties determine the protein corona with possible implications for biological impacts. Proc Natl Acad Sci U S A. 2008;105(38):14265–14270. | |
Monopoli MP, Walczyk D, Campbell A, et al. Physical-chemical aspects of protein corona: relevance to in vitro and in vivo biological impacts of nanoparticles. J Am Chem Soc. 2011;133(8):2525–2534. | |
Maiorano G, Sabella S, Sorce B, et al. Effects of cell culture media on the dynamic formation of protein-nanoparticle complexes and influence on the cellular response. ACS Nano. 2010;4(12):7481–7491. | |
Lacerda SH, Park JJ, Meuse C, et al. Interaction of gold nanoparticles with common human blood proteins. ACS Nano. 2010;4(1):365–379. | |
Duan J, Yu Y, Li Y, Yu Y, Li Y, Zhou X, et al. Toxic effect of silica nanoparticles on endothelial cells through DNA damage response via Chk1-dependent G2/M checkpoint. PloS one. 2013;8(4):e62087. | |
Bombelli FB, Webster CA, Moncrieff M, Sherwood V. The scope of nanoparticle therapies for future metastatic melanoma treatment. Lancet Oncol. 2014;15(1):e22–e32. | |
Chen CC, Wu CJ, Yeh MK. Gold nanoparticle-based platforms as cancer-targeted molecules delivery systems. Int J Nanotechnol. 2013;10(10/11):840–849. | |
Mukherjee P, Bhattacharya R, Wang P, et al. Antiangiogenic properties of gold nanoparticles. Clin Cancer Res. 2005;11(9):3530–3534. |
 © 2014 The Author(s). This work is published and licensed by Dove Medical Press Limited. The full terms of this license are available at https://www.dovepress.com/terms.php and incorporate the Creative Commons Attribution - Non Commercial (unported, v3.0) License.
By accessing the work you hereby accept the Terms. Non-commercial uses of the work are permitted without any further permission from Dove Medical Press Limited, provided the work is properly attributed. For permission for commercial use of this work, please see paragraphs 4.2 and 5 of our Terms.
© 2014 The Author(s). This work is published and licensed by Dove Medical Press Limited. The full terms of this license are available at https://www.dovepress.com/terms.php and incorporate the Creative Commons Attribution - Non Commercial (unported, v3.0) License.
By accessing the work you hereby accept the Terms. Non-commercial uses of the work are permitted without any further permission from Dove Medical Press Limited, provided the work is properly attributed. For permission for commercial use of this work, please see paragraphs 4.2 and 5 of our Terms.