")
Back to Journals » Clinical Optometry » Volume 12
Improvement or Worsening of Human Contrast Sensitivity Due to Blue Light Attenuation at 450 nm
Authors Tavazzi S , Cozza F, Nigrotti G, Braga C, Vlasak N, Larcher S , Zeri F
Received 18 December 2019
Accepted for publication 20 March 2020
Published 1 April 2020 Volume 2020:12 Pages 57—66
DOI https://doi.org/10.2147/OPTO.S242818
Checked for plagiarism Yes
Review by Single anonymous peer review
Peer reviewer comments 4
Editor who approved publication: Mr Simon Berry
Silvia Tavazzi,1,2 Federica Cozza,1,2 Gabriele Nigrotti,2 Chiara Braga,2 Natalia Vlasak,3 Silvano Larcher,4 Fabrizio Zeri1,2,5
1Department of Materials Science, University of Milano Bicocca, Milan, Italy; 2Research Centre in Optics and Optometry (COMiB), University of Milano Bicocca, Milan, Italy; 3Hoya Vision Care, Amsterdam, the Netherlands; 4Hoya Lens Italy, Milan, Italy; 5Ophthalmic Research Group, School of Life and Health Sciences, Aston University, Birmingham, UK
Correspondence: Silvia Tavazzi Email [email protected]
Purpose: The work was aimed at comparing contrast sensitivity performance in an indoor environment with two filters, which differ only in the presence of a band at 450± 20 nm in the transmittance spectrum.
Patients and Methods: Thirty-nine subjects participated. The filters were the Standard (ST) and Professional (PRO) Drive lenses (Hoya, Japan), the latter showing the attenuation band at 450 nm. Photopic contrast sensitivity (CS) was measured at different spatial frequencies from 1.5 to 18 cpd through Functional Acuity Contrast Test with both lenses (LogCSST and LogCSPRO, respectively). The areas under the curves of LogCSST and LogCSPRO as a function of the spatial frequency were also considered.
Results: In the range of the measured values of LogCSST for the thirty-nine participants, at each spatial frequency and also for the areas, the difference Δ = LogCSPRO – LogCSST was found to decrease and change sign from positive to negative as a function of LogCSST, thus allowing to deduce a threshold (LogCSthreshold) for LogCSST corresponding to Δ=0. Significant CS worsening was found with the PRO compared to the ST lens for the subjects showing LogCSST > LogCSthreshold. Vice versa, CS improvement was found when LogCSST < LogCSthreshold.
Conclusion: In the choice of a blue-filtering lens, practitioners should take into consideration that the attenuation of light in the range 420– 470 nm is expected to produce a CS worsening in subjects showing a relatively high initial CS (higher than a threshold CS). For these subjects, the general reduction of transmitted light intensity prevails on possible advantages. On the contrary, subjects showing a relatively low initial CS are expected to show a CS improvement because the attenuation of light in the range 420– 470 nm is expected to reduce intraocular scattering and to mimic the effect as an optical filter of the human macular pigment, advantages which prevail on the reduction of the transmitted light intensity.
Keywords: optometry practice, blue filtering, optics and spectroscopy, intraocular scattering, macular pigment
Introduction
An optical filter is a device that selectively transmits, absorbs, or reflects light depending on wavelength. In the visible range, it can transmit long wavelengths only above a cut-off (long-pass), short wavelengths only below a cut-on (short-pass), or intermediate band of wavelengths (band-pass). In addition, there are filters with more complex transmittance spectra. Beyond the definitions, it is the transmittance spectrum that describes the properties of a filter.
The relationship between the transmittance spectrum of a specific colored filter and the effects on visual performances and ocular health have been extensively discussed in the literature, mainly for blue-filtering lenses. Indeed, blue-light filtering lenses have received increased attention in recent years because of their potential to reduce the effects of light scatter and chromatic aberrations, and the possible protection which they offer against photo-oxidative effects induced by photons of relatively high energy.1–7 Some authors found visual acuity and/or contrast sensitivity improvement when using blue-filtering lenses both in healthy subjects and in subjects affected by cataract, age-related macular degeneration, or other retinal diseases.2–7 However, other papers reported neutral or negative effects of tinted lenses and filters on visual performances.8–10 In general, there is little objective and conclusive evidence that tinted lenses or filters improve visual function, and it is unclear whether lenses with specific spectral characteristics are better than any others. Another controversial aspect is the correlation between the subjective preferences of the wearer and the results of psychophysical tests.3
Two types of blue-filtering lenses were recently proposed by Hoya (Tokyo, Japan), the Standard Drive (ST) lens and Professional Drive (PRO) lens. From the optical point of view, they are both long-pass transmittance filters with a cut-off at (426±2) nm.7 Both filters were compared to a clear lens, as reported elsewhere, and they were found to maintain or improve some visual functions compared to the clear control lens.7 The effect was mainly attributed to the reduction of intraocular light scattering thanks to the strong light attenuation in the blue spectral range below the cut-off (426 nm).
The purpose of this further study is to investigate in detail the differences of contrast sensitivity in an indoor environment between the two filters (ST and PRO), bearing in mind that the only spectral difference between them is an additional band between about 420 and 470 nm in the PRO spectrum, in the same spectral region of the absorption of the human macular pigment (MP).11
Materials and Methods
Materials
The two types of Drive lens under investigation in this work are the Standard Drive (ST) and the Professional Drive (PRO) (Hoya, Japan). A third type of lens was also dispensed in the preliminarily phase of the work. In addition to the refractive index nD at 589.3nm (Fraunhofer D line), some other properties of the three filters are reported in Table 1. The optical transmittance spectra of the filters were measured using a Jasco V-650 spectrophotometer. The clear lens was preliminarily provided to study the effects of the shift of the cut-off from 405 nm (clear lens) to 426 nm (ST and PRO filters). The results of the comparison between the clear lens, on one side, and the ST/PRO lenses, on the other side, are reported elsewhere.7
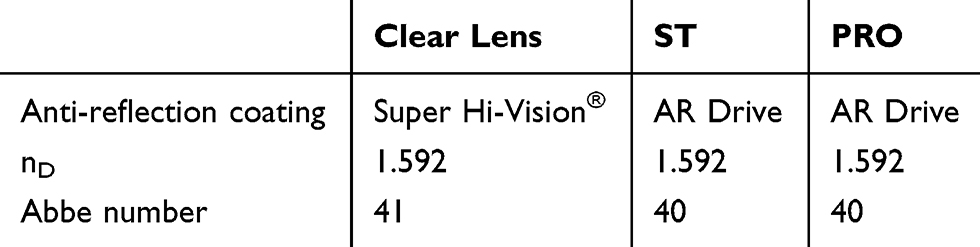 |
Table 1 Lens Properties. Some Optical Properties of the Clear Lens Used in the Preliminary Phase of the Study and of the Lenses Under Investigation in the Experimental Phase (ST/PRO) |
Lenses were either single vision or progressive additional lenses (SVLs or PALs, respectively). The clear SVLs used in the preliminary phase, were standard front aspherical lenses (Nulux®, Hoya, Japan). The clear PALs were made with a front design approach, 14 mm corridor length, and power-based variable inset. As far as the ST/PRO lenses are concerned, the SVLs were both power by power aspherical optimized on back side atoric lenses optimized for a standard position of wear. The ST/PRO PALs were both FreeForm integrated double-surface design with 15 mm corridor length, individual inset based on power and individual monocular pupil distance.
Study Design
A diagram showing the study procedure is reported in Figure 1. The study was conducted in accordance with the Declaration of Helsinki and was approved by the Ethics Committee of the University of Milano Bicocca (prot. Int. 0059770/17, classif. II.18, C.IPA unimib C.AOO:AMMU06, C. reg. prot.: RP01). Before being enrolled in the study each subject expressed his/her written informed consent and gave the researchers permission to collect and treat personal and optometric data.
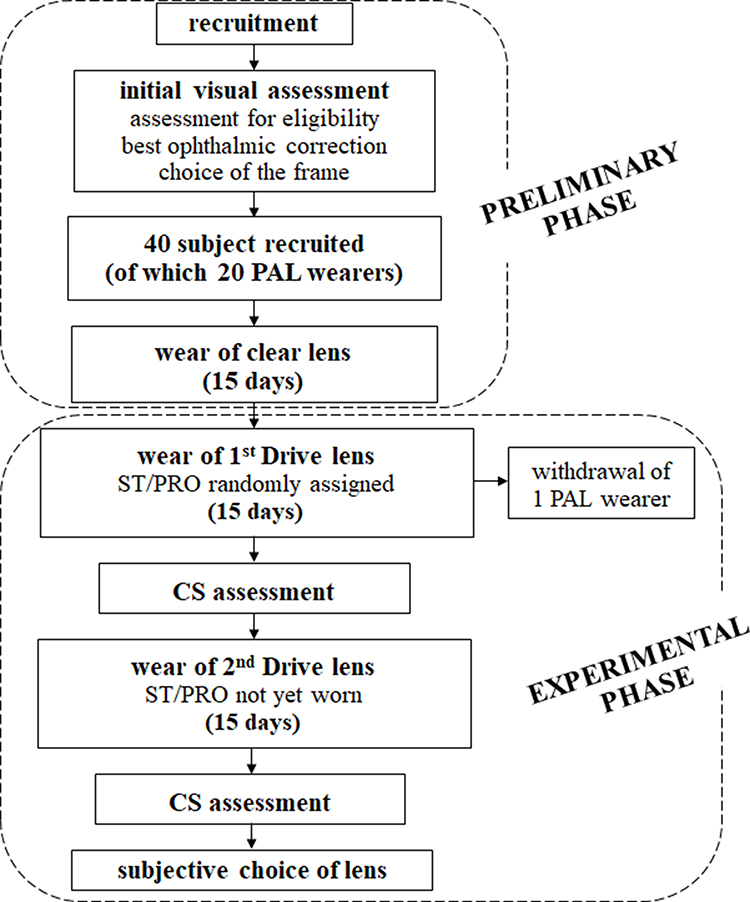 |
Figure 1 Study design. Flow diagram of the study design. |
Forty subjects were recruited for this work (Figure 1) - twenty adults who used PALs (PAL sub-group) and twenty who used SVLs. Special attention was paid to the PAL sub-group in this work because their mean age was higher than that of the SVL wearers (as discussed in a following paragraph), which was expected to increase intraocular light scatter.12 The inclusion criteria were the absence of any known ocular pathology, having a binocular best corrected visual acuity (BCVA) of at least logMAR = 0.1 (logarithms of the minimum angle of resolution), having good binocular vision (no anomalies in ocular motility, heterophorias at distance and near and fusional reserves at distance within the limit of the expected values,13 no suppression, and a stereoscopic acuity of at least 60 arcsec), and being a regular wearer of either PALs (to be included in the PAL sub-group) or SVLs. One participant in the PAL sub-group dropped out of the study (Figure 1).
In the preliminary phase of the study (Figure 1), an initial eye and visual examination were performed to determine each subject’s eligibility and to find the best ophthalmic correction. Ophthalmoscopy and slit-lamp examinations were carried out to detect any ocular anomaly. The presence of an anomaly in ocular motility was investigated by the H pattern test that is considered reasonable for the purpose and easier to perform in a clinical setting than other techniques.14,15 Non-cycloplegic subjective refraction at distance was carried out by a phoropter procedure. The mean spherical equivalent (MSE) was calculated for each eye as the algebraic sum of the value of the sphere and half of the cylindrical value. The addition for near in PAL sub-group was firstly determined according to the expected age and then adjusted subjectively.14 BCVA was measured with the optical correction at far distance arranged in a trial frame at distance of 4 m using high-contrast (97%) ETDRS chart displayed on an LCD optotype system (Vision Chart CSO, Florence, Italy). The visual acuity threshold was determined in the logarithm of the minimum angle of resolution (logMAR) using a letter-by-letter criterion. Dissociated heterophorias, either at distance or near, were measured through an alternating cover test and a prism bar. Fusional reserves at distance were measured with prism bar. A possible suppression was evaluated by the Worth 4-Dot test at distance, and stereoscopic acuity was measured by the circles subtest (Wirt rings) of the Stereo Fly Test (Stereo Optical Co.) at a distance of 40 cm with the optical correction at near distance arranged for both eyes in a trial frame.
After the initial visual assessment, each participant was asked to choose a frame from a limited set of frames. Before entering the experimental phase, the participants received a pair of spectacles with clear lenses to wear for fifteen days. The experimental phase of this work began after fifteen days (Figure 1), when 50% of participants (randomly selected) received spectacles with the ST lenses. They were asked to wear them for as long as possible over the next fifteen days. The remaining participants received the PRO lenses. After these fifteen days of wear, contrast sensitivity measurements were conducted (Figure 1). For the next fifteen days, each participant wore the Drive lenses they had not yet tested (Figure 1), after which psychophysical contrast sensitivity analyses were repeated. All the measurements of contrast sensitivity of the experimental phase were taken with the dispensed glasses. Photopic CS was detected binocularly through Functional Acuity Contrast Test (FACT) (room lighting fluorescent lamps, chart luminance 60.0±3.3 cd/m2) at 3-meter observation distance and the threshold measured as logarithm of the contrast sensitivity (LogCS). The emission spectrum of the room fluorescent lamps was measured by a spectrophotometer Hamamatsu C10082CAH. The spectrum (here omitted) showed many peaks of different intensity and width, which is a typical characteristic of commercial fluorescent lamps. The integral of the spectrum was calculated in the restricted range of interest for this work (420–470 nm) and in the whole visible range (400–750 nm). The ratio between the two integrals was found to be about 10%. The investigated spatial frequencies were 1.5, 3.0, 6.0, 12.0, 18.0 cpd (cycles/degree). The data measured with the ST and PRO lenses are indicated in this work as LogCSST and LogCSPRO, respectively. In addition to the single CS values for each spatial frequency, the areas under the curves of LogCSST and LogCSPRO as a function of the spatial frequency were also considered ( ).
).
A single blind crossover study was performed. Participants were masked to the randomization scheme, but investigators were not. Although a double-masked randomized control paradigm is usually considered to be the gold standard, the slightly different yellow appearance of the ST and PRO lenses was easily identifiable by the optometrists involved in data collection. To the best of our knowledge, participants were unaware of possible benefits and expected differences between the two filters under investigation.
Finally, at the end of the study when the subjects had worn all three types of lenses for fifteen days each, they were asked to make a subjective choice about which lens they wanted to keep. No detailed questionnaire was administered. The subjects were simply asked to express which lens they would like to keep.
Statistical Analysis
Descriptive statistics were produced for the measurements collected during the initial assessment and the experimental phase. Numerosity (N) and relative percentage values (%) were reported for each level of the categorical variables, while mean and standard deviation (SD) were calculated for the numerical ones. Differences between ST and PRO lenses were evaluated using t-tests for paired samples. Statistical significance was set at the overall level of 0.05. Concerning the CS values measured at each spatial frequency, the Bonferroni correction was applied to compensate for the possible increase of the chance of a rare event, as expected when multiple hypotheses are tested. Therefore, each individual hypothesis (for each spatial frequency) was tested at a significance level of 0.01, ie 0.05 divided by the number of hypotheses. Concerning the comparison between the areas underlying the CS curves, the level was set at 0.05.
Results
Figure 2 shows the measured transmittance spectra of the ST and PRO filters (plano lenses) and the transmittance spectrum of the human MP,11 which will be discussed in the following section. The spectral difference between PRO and ST filters is highlighted in the inset of Figure 2, which shows the spectrum obtained by subtracting the optical density (OD) of the ST plano-lens from the OD of the PRO plano-lens, where OD is defined as Log(1/transmittance). The difference is represented by a band centered at about 450 nm extending between about 420 nm and 470 nm.
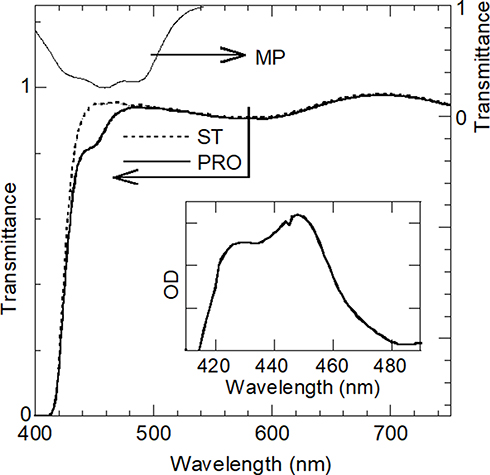 |
Figure 2 Transmittance spectra (axis on the left) of the ST and PRO filters (plano lenses) and transmittance spectrum (axis on the right) of the human macular pigment (MP) taken from the optical density (OD) reported in Werner et al11 (transmittance = 10−OD). Inset: spectrum obtained by subtracting the OD of the ST plano-lens from the OD of the PRO plano-lens, where OD is defined as Log(1/transmittance). The range of OD values (ordinate axis) in the inset is 0.00–0.07. |
The demographic characteristics, the mean spherical equivalent (MSE) values and the BCVA of the whole sample of thirty-nine subjects and, in brackets, of the PAL sub-group are reported in Table 2.
 |
Table 2 Participants. Demographic Characteristics, Mean Spherical Equivalent (MSE) Values, and BCVA of the Whole Sample of Subjects and, in Brackets, of the PAL Sub-Group |
To study the possible difference between the CS with the two Drive lenses under investigation, mean and standard deviation (SD) of LogCSST and LogCSPRO were calculated from the measured data at each spatial frequency. The results are reported in Table 3, together with the percentual difference ε between the two mean values (ε = 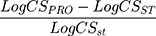 ), and the p-value obtained by paired Student’s t-test, calculated on all subjects and, in brackets, for the PAL sub-group.
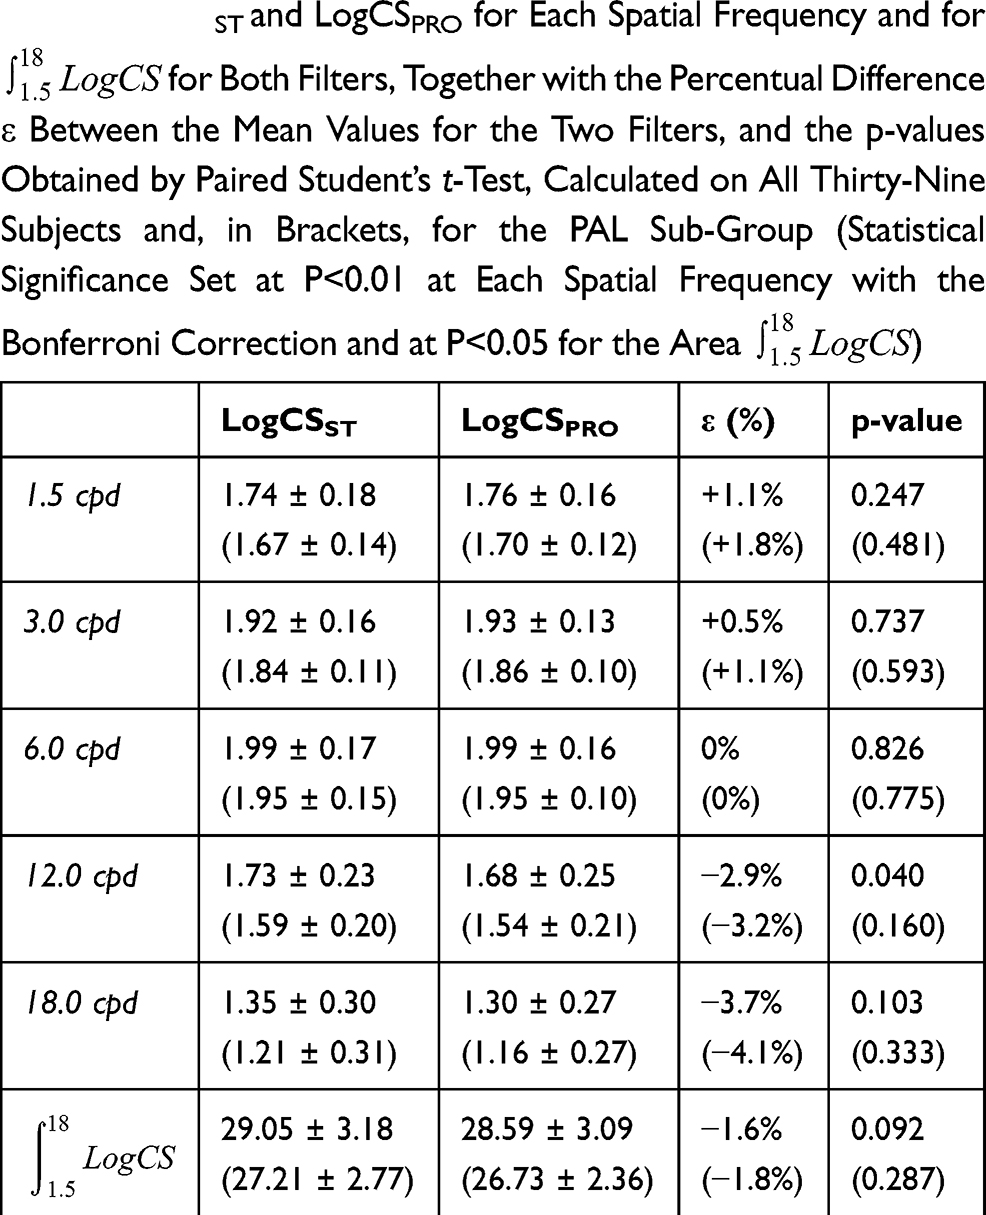


It is possible to state that there is no significant difference between LogCSST and LogCSPRO both for the whole sample of thirty-nine subjects and for the PAL sub-group (nineteen subjects). The percentage differences ε in Table 3 are sometimes positive and sometimes negative and the p-values are all greater than the significance level.
Table 3 data can be processed in a different way, analyzing the individual values subject by subject. This allowed for a different interpretation of the results in which two sub-groups can be identified. If one considers the graph in Figure 3, it is possible to identify a criterion for dividing the sample into two sub-groups. For each subject, Figure 3 shows the difference Δ between the CS performances with the two filters (Δ = LogCSPRO - LogCSST) on the ordinate axis as a function of the value obtained with the ST lens on the abscissa axis (LogCSST). To give an example, the data in Figure 3 correspond to those taken at the frequency of 6 cpd. Similar graphs can be obtained at the other spatial frequencies or for the area  . From the graph, one can note that subjects with a relatively low CS with the ST lens typically have a benefit with the PRO lens because Δ is typically positive, ie the CS is increased with the PRO lens compared to the ST one. The opposite is found for subjects who have a relatively high CS with the ST lens. In this case, Δ is typically negative, ie CS is better with the ST lens, suggesting that the PRO lens is not able to provide an advantage and therefore is not recommended.
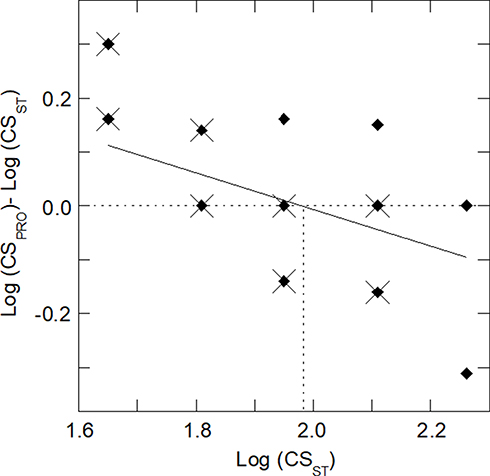 |
Figure 3 CS difference (Δ) between PRO and ST filters. Difference Δ for each subject between LogCSPRO and LogCSST at 6 cpd with the PRO and ST lenses, respectively, as a function of LogCSST. Some points in the graph are superimposed. Full diamonds indicate all 39 participants, while crosses indicate the subjects of the PAL sub-group. The upper half of the figure ((Δ > 0) indicates the area where the measured CSPRO is better than CSST, while the lower half (Δ < 0) indicates the area where CSST is better than CSPRO. The continuous line indicates the result of linear regression of the data of the 39 subjects: y = 0.6717–0.3395 x, R = 0.466). A vertical dotted line indicates the abscissa corresponding to y = 0 in the regression equation, ie LogCSthreshold. |
The continuous line in Figure 3 indicates the result of linear regression of the data of the overall group of 39 subjects. From the equation of this line, it was possible to deduce a specific value of LogCSST corresponding to Δ = 0. This value is here defined LogCSthreshold and it can represent a threshold value to predict the clinical advantage of the PRO filter compared to the ST one. For the subjects whose LogCSST is lower than LogCSthreshold, an improvement of the CS is expected using the PRO filter, while for the subjects whose LogCSST is higher than LogCSthreshold, CS is expected to be worse with the PRO filter compared to the ST. For example, at 6 cpd, LogCSthreshold is 1.98 (as indicated by the vertical dotted line in Figure 3).
Through the linear regression of the data at each of the five spatial frequencies (from 1.5 to 18 cdp, not only at 6 cpd), it was possible to obtain five threshold values LogCSthreshold, one for each spatial frequency. Similarly, one can deduce a threshold value for the area  . This set of six reference values were deduced by considering the whole sample of 39 subjects. They are shown in Table 4, where the regression equations, the corresponding Pearson coefficients, and all the threshold values LogCSthreshold are reported.
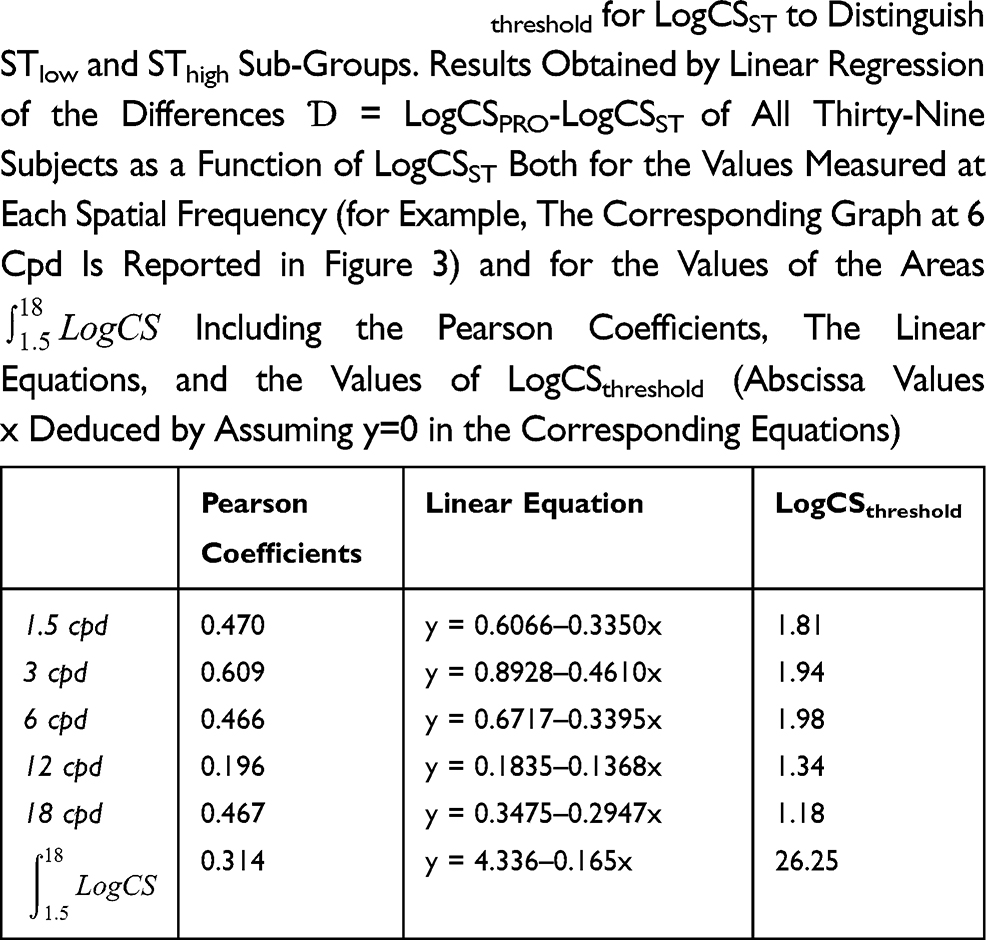 |
Table 4 Threshold Values LogCSthreshold for LogCSST to Distinguish STlow and SThigh Sub-Groups. Results Obtained by Linear Regression of the Differences Ɗ = LogCSPRO-LogCSST of All Thirty-Nine Subjects as a Function of LogCSST Both for the Values Measured at Each Spatial Frequency (for Example, The Corresponding Graph at 6 Cpd Is Reported in Figure 3) and for the Values of the Areas |

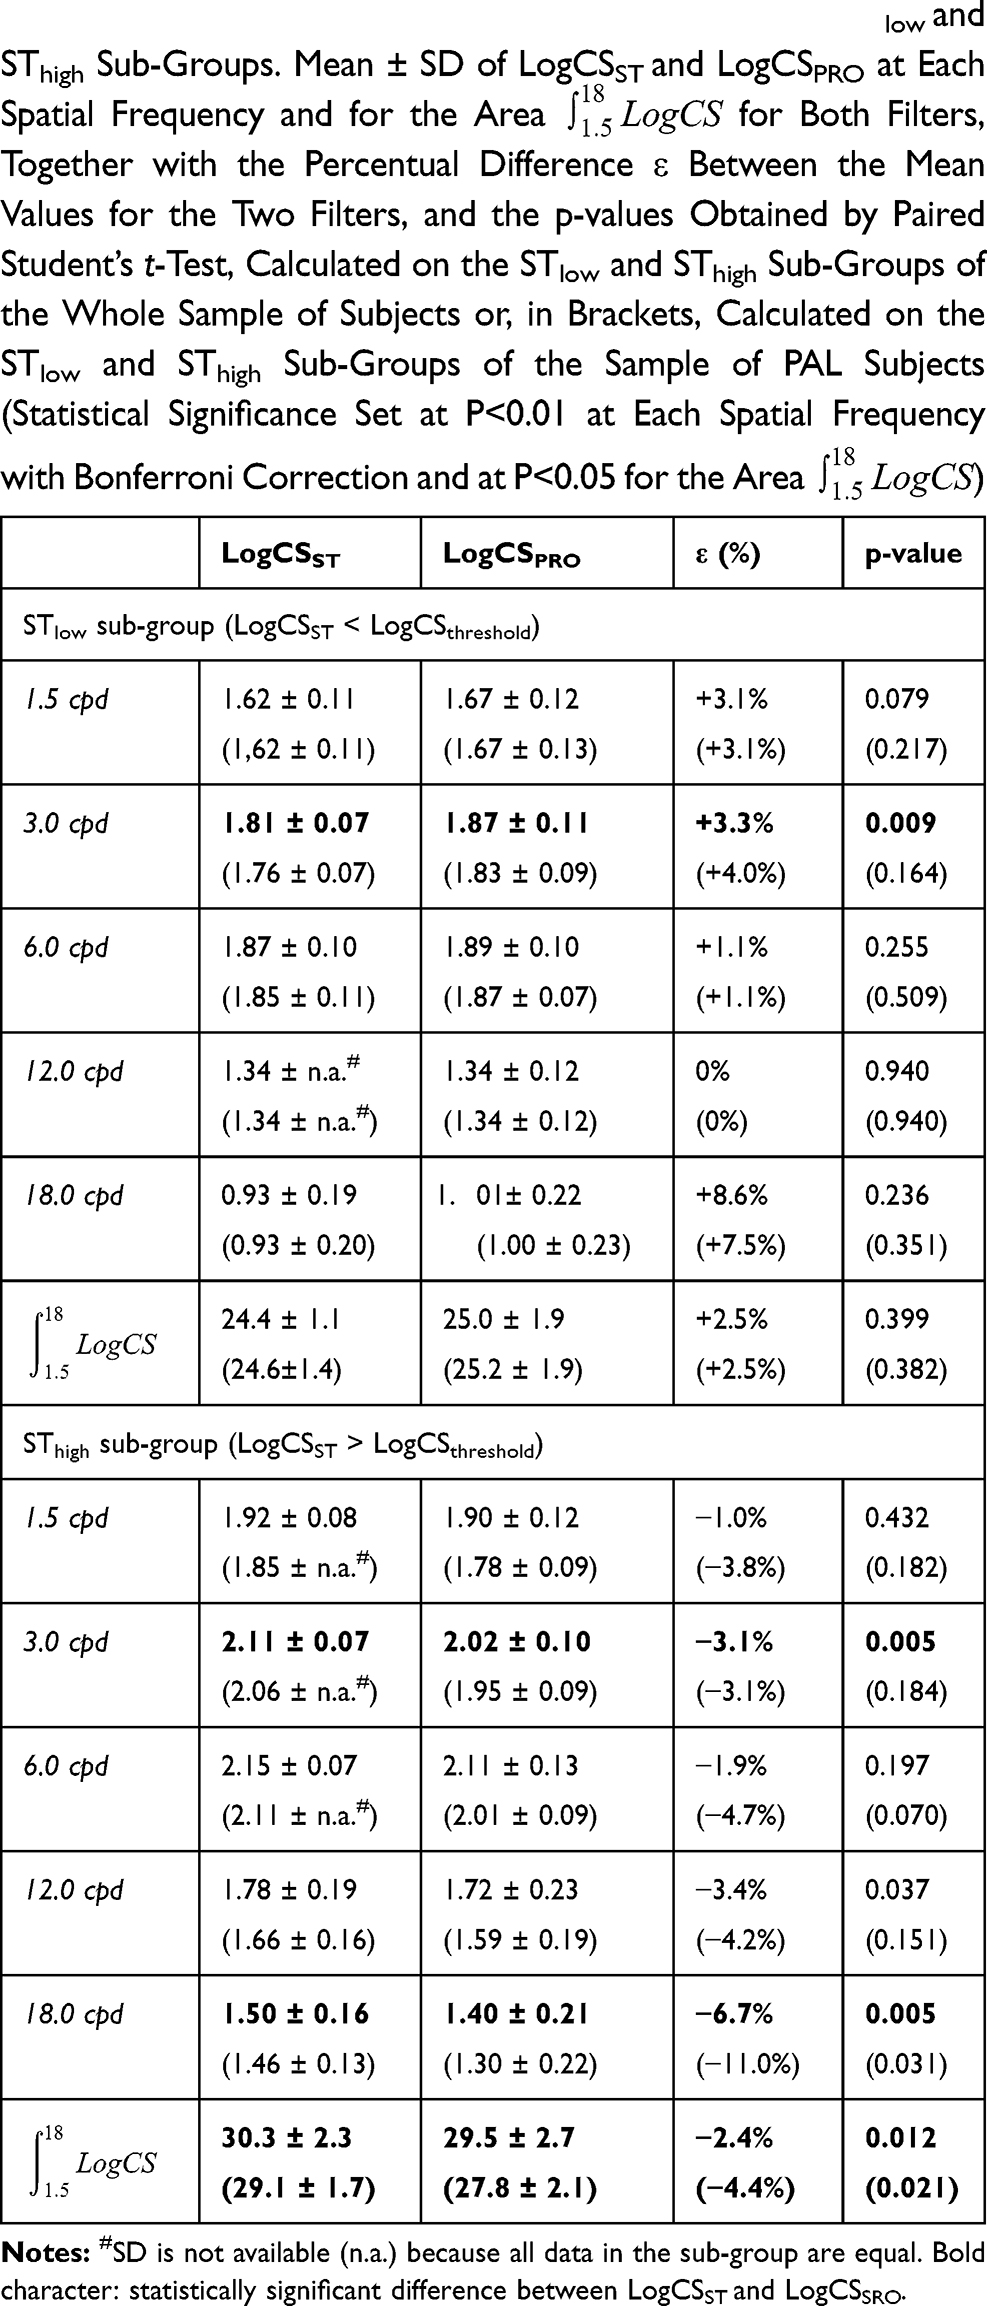
Based on the LogCSthreshold values reported in Table 4, two sub-groups (for each spatial frequency and also based on the area under the curve) were defined as STlow and SThigh to indicate the two sub-groups for which CS improvement (STlow) or worsening (SThigh) was expected with the PRO filters compared to the ST lens. The comparison between the two filters (ie between LogCSST and LogCSPRO) was repeated separately for each sub-group (STlow and SThigh). In this way, the difference between the visual performance achieved with the two filters now appears significant for various comparisons in respect to the findings for the overall group (Table 3). Table 5 shows these new findings. No percentual variations ε of the STlow sub-group are negative (the mean value of LogCSPRO is always equal or better than the mean value of LogCSST), while the opposite scenario is found for the SThigh sub-group showing only negative ε values (the mean value of LogCSPRO is always worse). For the STlow sub-group at 3 cpd, the difference between the two filters is significant with statistical significance at 0.01. At the same spatial frequency, the difference between ST and PRO filters is significant also for the SThigh sub-group, as well as in other two cases, including the area  . These results indicate that the overall performance with the ST filter was better than the performance with the PRO one for the SThigh sub-group and vice versa, although with less statistical significance, for the STlow sub-group. As it was suspected, subjects starting from a poor CS with the ST lens typically had a benefit using the PRO lens. Conversely, for subjects who already had a good performance with the ST lens, the use of the PRO lens produced some worsening of the CS.


To conclude the analysis, the number of subjects who had a CS benefit with the PRO lens compared to the ST lens or vice versa was counted and compared to the subjective preference they showed. For simplicity, only the spatial frequency of 3 cpd was considered (Figure 4) to decide the recommended filter for each subject based on CS measurements. This spatial frequency was used because it corresponds to a relatively high CS and because the difference between the two filters (PRO and ST) was significant both in the STlow subgroup and in the SThigh one (Table 5). Obviously, the prescription can also be made on the basis of CS at another spatial frequencies or considering the area  to use a parameter that takes into account the entire range of frequencies. In Figure 4, the two main bars represent the number of subjects who had a CS benefit with the PRO or ST lens. To assess whether a better psychophysical result matches the subjective preference, in the same figure the three bars next to each main bar represent the number of subjects, among each sub-group, who chose the PRO lens, the ST lens, or did not want either of the two filters (preferring a clear lens without any yellow colour). Concerning the comparison between recommended and preferred lenses, similar results were found when considering the CS results at other spatial frequencies or the area
  .
.
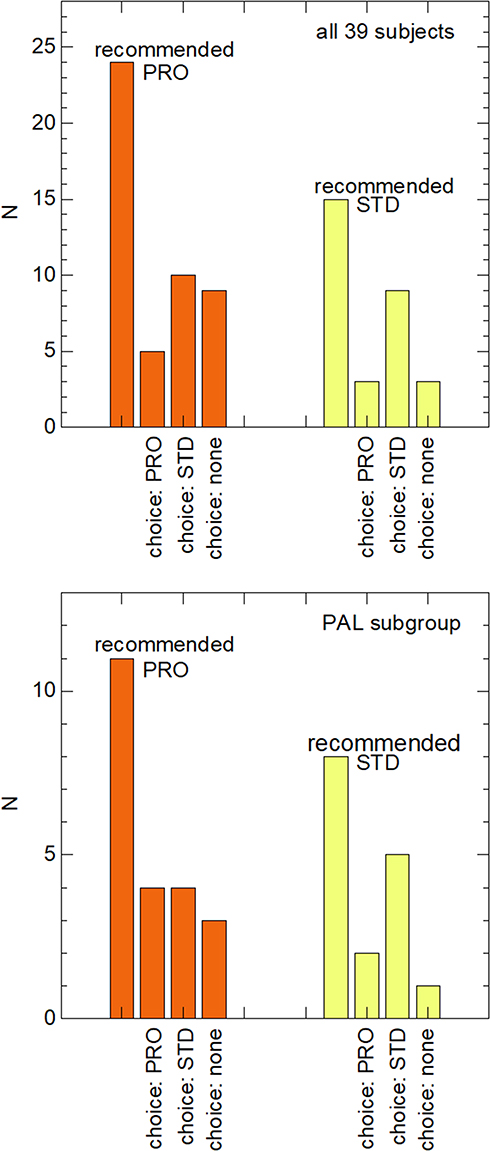 |
Figure 4 Subjective preference and recommended lens based on CS measured at 3 cpd. Number (N) of subjects showing a better CS with either the PRO or the ST lens based on the measured CS at 3 cpd (main bars) and number of subjects, among them, who chose the PRO lens, the STD lens, or did not want either of the two filters, both considering all 39 subjects (first panel) and considering the PAL sub-group (second panel). |
Discussion
In first approximation, the overall results do not seem to show significant differences in contrast sensitivity achieved with the use of the two different filters under investigation (Table 3). CS with the ST and PRO lenses was, on average, the same and was confirmed either when considering all subjects involved in this study (age varying from 24 to 73 years) and when considering the sub-group of older subjects (from 46 to 73 years, already PAL wearers). This outcome is not new and was already discussed in a previous paper concerning Drive ST/PRO filters compared to a clear lens.7 Both filters were found to maintain or improve some visual functions compared to the clear control lens and this improvement was attributed to the shift of the cut-off from 405 nm (clear lens) to 426 nm.7 As can be observed in Figure 2, the shift causes the transmittance to be reduced to zero below 426 nm both for the ST and for the PRO filter.
However, a more detailed analysis showed that there are some significant differences in the CS between the two filters. Indeed, for subjects who showed a relatively low CS with the ST filter (STlow sub-group), the use of the PRO filter determined an improvement in CS which was, on average, in the order of +3% (Table 5) proving significant at 3 cpd. On the contrary, subjects showing a relatively high CS with the ST filter (SThigh sub-group) were affected by a general worsening when using the PRO filter (mean worsening of about −3%), which was significant at 3 cpd, at 18 cpd, and when considering the area  .
.
This distinction between (i) the subjects who have a benefit with the use of the PRO lens compared to the ST one and (ii) those who have some worsening can be interpreted taking into consideration the optical transmittance properties of the two filters. From the optical point of view, the only difference between them is the presence of the additional band at 450 nm in the PRO transmittance spectrum. Their different performances can be attributed as being due to the balance between expected advantages of the attenuation of light in the 420–470 nm range vs the undesirable, though unavoidable, reduction of transmitted light intensity. The advantages are expected to be a possible reduction of intraocular light scattering, if present,12 and the selective filtering of light in the same spectral range miming the role, as an optical filter, of the human MP. Indeed, as shown in Figure 2, the additional band of the PRO lens covers the same spectral range as the absorption of human MP. The relationship between MP and visual performance was also reported by other authors.16–19 For example, Loughman et al16 found BCVA and CS positively associated with MP optical density. In other words, despite the reduction of the overall intensity of the transmitted light, the PRO filter can help subjects who show relatively low LogCSST and are positively affected by the reduction of intraocular scattering and/or by further filtering of light in the range of the MP absorption. For the other subjects (with high CS), intraocular scattering is negligible and the contribution of the PRO filter in miming the MP absorption is not so helpful, so the disadvantage of a general reduction of transmitted light intensity prevails, and the PRO lens produces an overall CS worsening.
As mentioned before, the CS measurements were carried out in an environment illuminated with white light, about 10% of the intensity being in the range 420–470 nm with respect to the total intensity in the visible. It may be interesting to repeat the study by illuminating the room with white LEDs, which are known to have a strong peak of emission centered at about 450 nm, in the same spectral position of the characteristic band of the PRO lens. It may also be interesting to repeat the measurements with solar lighting in order to mimic the outdoor conditions instead of the lighting conditions of an indoor environment.
From the trend of the differences Δ=LogCSPRO-LogCSST as a function of LogCSST (Figure 3), threshold values for LogCSST, defined as LogCSthreshold, were deduced to distinguish the two sub-groups (STlow and SThigh) at the different spatial frequencies and for the area  (Table 4). This approach allowed for a distinction of the two sub-groups and a demonstration that the effect of the PRO filter was opposite (Table 5).
Based on the CS at 3 cpd, about 62% (twenty-four) of the subjects were classified as STlow (the recommended lens was PRO) and about 38% (fifteen) as SThigh (the recommended lens was ST), as shown in Figure 4. However, the PRO lens was not the one most frequently chosen subjectively by participants. Only eight subjects out of thirty-nine (20%) chose the PRO lens; nineteen participants out of thirty-nine (49%) chose the ST one, while twelve subjects (31%) did not want any yellow lens. Maybe the slightly darker coloration of the PRO filter compared to the ST lens made it less pleasant for some subjects despite the better results of the psychophysical outcomes. This interpretation is also confirmed by the rejection of some subjects of a yellow Drive lens, whether it was ST or PRO (Figure 4). Excluding the twelve subjects who did not want any Drive lens, the prescription of the PRO lens corresponds to the subjective choice in 33% of the cases (50% if considering only PAL wearers), while the correspondence is 75% for the lighter yellow ST lens (71% if considering only PAL wearers). Prescription and subjective choice could also be compared by taking into consideration the prescription based on other spatial frequencies or the prescription based on the area  , which takes into account all the five CS values. Data were omitted in the session of results, but the results were in reasonable agreement with those at 3 cpd reported in Figure 4. For example, based on the areas and excluding those who did not want any Drive lens, the prescription of the PRO lens corresponded to the subjective choice in 40% of the cases, while the correspondence was 63% for the lighter yellow ST lens.
Finally, a potential limitation of the present research should be mentioned. The photopic CS was measured through the FACT. Although this chart has been improved in reliability with respect to the older version (Vistech chart), it showed a certain degree of ceiling effect for young healthy people and a floor effect in old people with cataract.20,21 This could be due to the reduced range of CS measured by the test.20 However, this issue appeared limited to the spatial frequency of 1.5 cpd.20,21 Moreover, the measurement can be considered reliable if the area under the CS function is specified.21 Considering that the results of the present study are significant at a higher spatial frequency than 1.5 cpd and for the overall area under the CS curves ( ), the known potential limitation of the FACT just described is not expected to play a relevant role here.
Conclusions
Contrast sensitivities when using either the Standard (ST) or the Professional (PRO) Drive lenses (Hoya, Japan) were compared by taking into consideration that the two filters differ only and exclusively for the attenuation of the transmitted light in the region of the spectrum between 420 and 470 nm.
For subjects who showed a relatively low CS with the ST filter, the use of the PRO filter allowed the CS to improve, with statistical significance at 3 cpd. The positive effect of the PRO filter is attributable to the reduction of intraocular scattering and to a filtering of light in the same range of the MP absorption, thus miming its role as an optical filter. These effects are therefore found to prevail on the general reduction of transmitted light intensity. Therefore, the PRO lens might be particularly useful in those people suffering pathological ocular conditions which cause a CS reduction as already reported in the literature in case of filters which filter blue light.2,3,6,22 On the contrary, subjects already showing a relatively high CS with the ST filter were affected by a worsening when using the PRO filter, which is attributed to the general reduction of the transmitted light intensity. In this case, the ST filter is recommended. In addition to the visual performance, the subjective choice of the participants was also analyzed and it was found to be influenced by the yellow color of the lenses, especially for the PRO lens.
Disclosure
Natalia Vlasak and Silvano Larcher are fully employed in Hoya Vision Care and Hoya Lens Italy, respectively. Professor Silvia Tavazzi reports grants from Hoya Holdings outside the submitted work. Dr Federica Cozza reports grants from Hoya outside the submitted work. Dr Gabriele Nigrotti reports grants from research activity commissioned to the University of Milano Bicocca by Hoya (June 2017 and June 2018) outside the submitted work. Dr Chiara Rosa Giuseppina Braga reports grants from Università of Milano Bicocca outside the submitted work, Dr Natalia Vlasak reports grants from Hoya Holdings N.V. outside the submitted work. Dr Silvano Larcher reports grants from Hoya Holdings N.V. outside the submitted work. Dr Fabrizio Zeri reports grants from Hoya Holdings N.V. outside the submitted work. The authors report no other conflicts of interest and with the exception of Natalia Vlasak and Silvano Larcher, have no proprietary interest in any of the materials mentioned in this article.
References
1. Boulton M. Retinal photodamage. J Photochem Photobiol B. 2001;64:144–161.
2. Zigman S. Light filters to improve vision. Optom Vis Sci. 1992;69:325–328. doi:10.1097/00006324-199204000-00012
3. Rosenblum YZ, Zak PP, Ostrovsky MA, et al. Spectral filters in low‐vision correction. Ophthalmic Physiol Opt. 2000;20:335–341. doi:10.1046/j.1475-1313.2000.00545.x
4. De Fez MD, Luque MJ, Viqueira V. Enhancement of contrast sensitivity and losses of chromatic discrimination with tinted lenses. Optom Vis Sci. 2002;79:590–597. doi:10.1097/00006324-200209000-00010
5. Mahjoob M, Heydarian S, Koochi S. Effect of yellow filter on visual acuity and contrast sensitivity under glare condition among different age groups. Int Ophthalmol. 2016;36:509–514. doi:10.1007/s10792-015-0154-7
6. Colombo L, Melardi E, Ferri P, et al. Visual function improvement using photocromic and selective blue-violet light filtering spectacle lenses in patients affected by retinal diseases. BMC Ophthalmol. 2017;17:149. doi:10.1186/s12886-017-0545-9
7. Cozza F, Monzio Compagnoni M, Airoldi C, et al. The effects of two longpass filters on visual performance. J Optom. 2019;
8. Hayashi K, Hayashi H. Visual function in patients with yellow tinted intraocular lenses compared with vision in patients with non-tinted intraocular lenses. Br J Ophthalmol. 2006;90:1019–1023. doi:10.1136/bjo.2006.090712
9. Muftuoglu O, Karel F, Duman R. Effect of a yellow intraocular lens on scotopic vision, glare disability, and blue color perception. J Cataract Refract Surg. 2007;33:658–666. doi:10.1016/j.jcrs.2006.12.018
10. Leung TW, Li RW, Kee CS. Blue-light filtering spectacle lenses: optical and clinical performances. PLoS One. 2017;12:e0169114. doi:10.1371/journal.pone.0169114
11. Werner JS, Donnelly SK, Kliegl R. Aging and human macular pigment density. Vis Res. 1987;27:257–268. doi:10.1016/0042-6989(87)90188-X
12. Coppens JE, Franssen L, van den Berg TJ. Wavelength dependence of intraocular straylight. Exp Eye Res. 2006;82:688–692. doi:10.1016/j.exer.2005.09.007
13. Scheiman M, Wick B. Clinical Management of Binocular Vision: Heterophori, Accommodative, and Eye Movement Disorders. Lippincott Williams & Wilkins; 2002.
14. Hansraj R. Pursuit eye movements: A review. S Afr Optom. 2008;67:160–165.
15. De Luca M, Zeri F, Spinelli D, Zoccolotti P. The acquisition of reading fluency in an orthographically transparent language (Italian): an eye movement longitudinal study. Med Sci Monit. 2010;16:SC1–7.
16. Loughman J, Akkali MC, Beatty S, et al. The relationship between macular pigment and visual performance. Vis Res. 2010;50:1249–1256. doi:10.1016/j.visres.2010.04.009
17. Stringham JM, Gracia PV, Smith PA, McLin LN, Foutch BK. Macular pigment and visual performance in glare: benefits for photostress recovery, disability glare and visual discomfort. Invest Ophthalmol Vis Sci. 2011;52:7406–7415. doi:10.1167/iovs.10-6699
18. Putnam CM, Bassi CJ. Macular pigment spatial distribution effects on glare disability. J Optom. 2015;8:258–265. doi:10.1016/j.optom.2014.12.004
19. Tavazzi S, Perego F, Ferraro L, Acciarri M, Zeri F. An investigation of the role of macular pigment in attenuating photostress through comparison between blue and green photostress recovery times. Curr Eye Res. 2019;44:399. doi:10.1080/02713683.2018.1554151
20. Pesudovs K, Hazel CA, Doran RM, Elliott DB. The usefulness of Vistech and FACT contrast sensitivity charts for cataract and refractive surgery outcomes research. Br J Ophthalmol. 2004;88:11–16. doi:10.1136/bjo.88.1.11
21. Bühren J, Terzi E, Bach M, Wesemann W, Kohnen T. Measuring contrast sensitivity under different lighting conditions: comparison of three tests. Optom Vis Sci. 2006;83:290–298. doi:10.1097/01.opx.0000216100.93302.2d
22. Zigman S. Vision enhancement using a short wavelength light- absorbing filter. Optom Vis Sci. 1990;67:100–104. doi:10.1097/00006324-199002000-00007
 © 2020 The Author(s). This work is published and licensed by Dove Medical Press Limited. The full terms of this license are available at https://www.dovepress.com/terms.php and incorporate the Creative Commons Attribution - Non Commercial (unported, v3.0) License.
By accessing the work you hereby accept the Terms. Non-commercial uses of the work are permitted without any further permission from Dove Medical Press Limited, provided the work is properly attributed. For permission for commercial use of this work, please see paragraphs 4.2 and 5 of our Terms.
© 2020 The Author(s). This work is published and licensed by Dove Medical Press Limited. The full terms of this license are available at https://www.dovepress.com/terms.php and incorporate the Creative Commons Attribution - Non Commercial (unported, v3.0) License.
By accessing the work you hereby accept the Terms. Non-commercial uses of the work are permitted without any further permission from Dove Medical Press Limited, provided the work is properly attributed. For permission for commercial use of this work, please see paragraphs 4.2 and 5 of our Terms.