")
Back to Journals » International Journal of Nanomedicine » Volume 10 » Special Issue on diverse applications in Nano-Theranostics
Improvement in the amine glass platform by bubbling method for a DNA microarray
Authors Jee SH, Kim JW, Lee JH, Yoon YS, An SSA , Park JH
Received 10 May 2015
Accepted for publication 20 July 2015
Published 3 October 2015 Volume 2015:10(Special Issue on diverse applications in Nano-Theranostics) Pages 273—280
DOI https://doi.org/10.2147/IJN.S88320
Checked for plagiarism Yes
Review by Single anonymous peer review
Peer reviewer comments 3
Editor who approved publication: Dr Thomas Webster
Seung Hyun Jee,1 Jong Won Kim,2 Ji Hyeong Lee,2 Young Soo Yoon1
1Department of Chemical and Biological Engineering, Gachon University, Seongnam, Gyeonggi, Republic of Korea; 2Genomics Clinical Research Institute, LabGenomics Co., Ltd., Bundang-gu, Seongnam-si, Gyeonggi-do, Republic of Korea
Abstract: A glass platform with high sensitivity for sexually transmitted diseases microarray is described here. An amino-silane-based self-assembled monolayer was coated on the surface of a glass platform using a novel bubbling method. The optimized surface of the glass platform had highly uniform surface modifications using this method, as well as improved hybridization properties with capture probes in the DNA microarray. On the basis of these results, the improved glass platform serves as a highly reliable and optimal material for the DNA microarray. Moreover, in this study, we demonstrated that our glass platform, manufactured by utilizing the bubbling method, had higher uniformity, shorter processing time, lower background signal, and higher spot signal than the platforms manufactured by the general dipping method. The DNA microarray manufactured with a glass platform prepared using bubbling method can be used as a clinical diagnostic tool.
Keywords: DNA microarray, glass platform, bubbling method, self-assambled monolayer
Introduction
New molecular diagnostics, such as DNA, protein, and tissue microarrays, have been developed for fast and easy application. A DNA microarray is a device that integrates the synthesized minute capture probe on a platform. One of the core technologies for DNA microarray is the platform used for the strong attachment of DNAs. In recent years, many researchers have published studies on platform fabrication methods used to hybridize biomaterials, especially DNA.1–5 However, the commercial DNA microarray needs a durable platform with high stability and uniform surface chemistry, as well as absence of any particles or contaminations.
In DNA microarray, strong binding to the surface of the platform and accessibility of the DNA influence spot size, shape, and DNA retention. The surface of the platform requires the following conditions: 1) should be free of contamination, 2) have uniform roughness, 3) have low background signals, and 4) have uniform surface distribution with surface modification by self-assembled monolayer (SAM).
Numerous methods for modifying the surface DNA attachment have been explored.6,7 For various DNA microarray applications, surface stability and fidelity of the immobilized, functional DNA sequence are the core attributes to consider in the development of a useful DNA microarray. Amino-silane-based surface modifications have been demonstrated to induce the hybridization of DNA to the glass platform for attaching anchor DNA oligomers.8,9 However, surface modifications, which are formed using the dipping method, are unstable and nonuniform, due to the weak and precarious binding energy of the molecules on the surface from the chemical concentration gradient on the surface. Therefore, we need to develop other methods that result in a uniform chemical concentration on the surface to replace the general dipping method for improved attachment of DNA oligomers to amino-silane-based SAM.
A representative DNA microarray is the human papilloma virus (HPV) DNA microarray (Biomedlab, Chunchon, South Korea). It is currently used as a common diagnostic for HPV infection.10 More recently, a new HPV DNA microarray that can simultaneously detect 24 different HPV types has been approved and commercialized in the European Union under the trade name Papillo Check (Greiner Bio-One, Frickenhausen, Germany). Papillo Check has been shown to be a sensitive, reproducible, and robust diagnostic tool for HPV genotyping, with the potential for high throughput diagnosis in clinical settings.11,12 In addition, a recent report describes the development of a DNA microarray for the effective diagnosis of genitourinary infections that cause sexually transmitted diseases (STDs).13
In this study, a DNA microarray with high uniformity was constructed on a glass platform manufactured by a bubbling method. Moreover, the diagnostic capability of the glass platform with high uniformity and productivity for DNA microarray was demonstrated by its successful application to the detection of STD diagnosis in real clinical cases.14
Experimental procedure
Platform manufacturing
Substrates used for the DNA microarray platform were 25 mm ×75 mm ×1 mm soda lime glass slides (Marienfeld, Lauda-Königshofen, Germany). All references in the text to water refer to deionized (DI) water obtained from a water purification system (Romax, Seoul, Republic of Korea) with 6.0 μS/cm of conductivity and 0.22 μm filtered. The glass slides were cleaned by sonification in 1:1 concentrated HCl:ethanol for 30 min, and then rinsed in flowing DI water for 1 min. The surface activation process was performed by dipping the platforms in an Radio Corporation of America (RCA) solution (NH4OH:H2O2:H2O =1:1:5) to ensure good adhesion between the amino-silane-based SAM and the cleaned platform surface for 5 min at 65°C.15
The bubbling method for manufacturing the amine-treated surface on the platform was performed with a 0.2% solution of 3-aminopropyl trimethoxysilane (APTS) (DI water:APTS =499 mL:1 mL) and APTS gas vapored at 150°C. Nitrogen gas was used as a carrier gas, with APTS gas at a flow rate of 3 L/min. The bubbling process was carried out for 1, 5, and 10 min. The properties of the platform were compared to a platform prepared by a dipping process using a 0.2% solution of APTS for 10, 20, and 30 min. The glass platforms manufactured by the dipping method for 10, 20, and 30 min were renamed dipping 10, dipping 20, and dipping 30, respectively. Moreover, the glass platforms manufactured by the bubbling method for 1, 5, and 10 min were renamed bubbling 1, bubbling 5, and bubbling 10, respectively. Figure 1 shows the bubbling system for the novel surface modification process. Measurements to investigate the amine groups on the surface of the platforms were carried out by atomic force microscopy (AFM). The transmittances and surface profiles of the glass platforms were measured using a UV–visible spectrometer. A cleaned glass platform without any surface modifications was used as a reference glass for the UV–visible spectrometer.
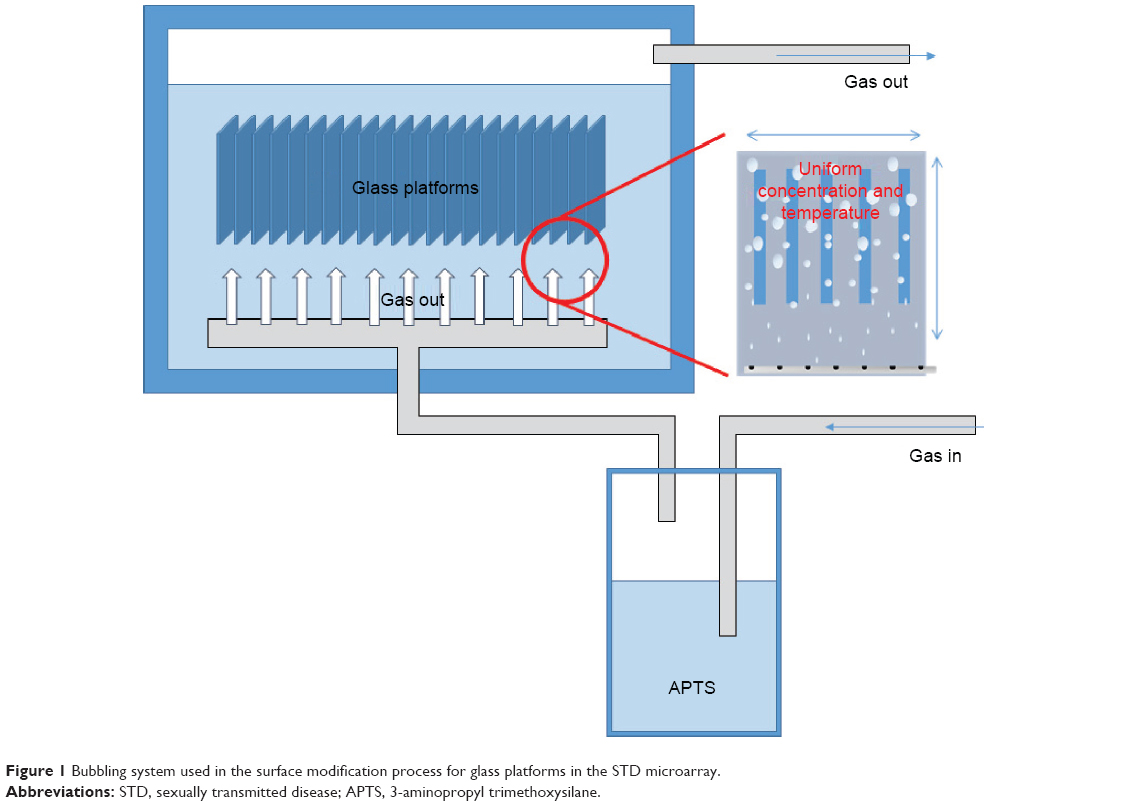 | Figure 1 Bubbling system used in the surface modification process for glass platforms in the STD microarray. |
Microarray manufacturing and target preparation
All oligonucleotides, including capture for all 14 pathogens probes (GV, MH, CT, SA, HSV1, NG, KP, CA, EF, TV, MG2, UU, HSV2, and IC) and position markers, were synthesized and purified by Bioneer (Daejeon, Republic of Korea).16 Capture probes used in the microarray fabrication were 35-mers and were 5′ aminohexyl terminated. The position marker (5′-A5-3′) used for the microarray was an amine modified at the 3′ end and Cy3 labeled at the 5′ end.
Six microliters of 200 M amine-modified capture probes were incubated at 30°C for 2 h. Six hundred mM sodium carbonate buffer (pH 9.5) and 1 L dimethyl sulfoxide were added to the mixed solution. The final mixture was spotted on an APTS-modified glass platform fabricated by the bubbling method using a microspotter (VersArray ChipWriter Compact System, Bio-Rad Laboratories, Hercules, CA, USA) according to the manufacturer’s instructions, and then the platform was allowed to stand overnight in a humid chamber. Figure 2 shows the STD DNA microarray image with each capture probe spots, which consisted of 14 pathogens with each tree spots. The STD microarray was designed with a spot diameter of 2×d=200 μm, and a distance between the spots of horizontal (X) =300 μm and vertical (Y) =300 μm. The glass platform with capture probe spots was incubated for a Schiff reaction and reduction in a NaBH4 solution. Then, the glass platform was washed with DI water for 1 min and spin-dried by centrifugation at 1,000 rpm for 2 min.
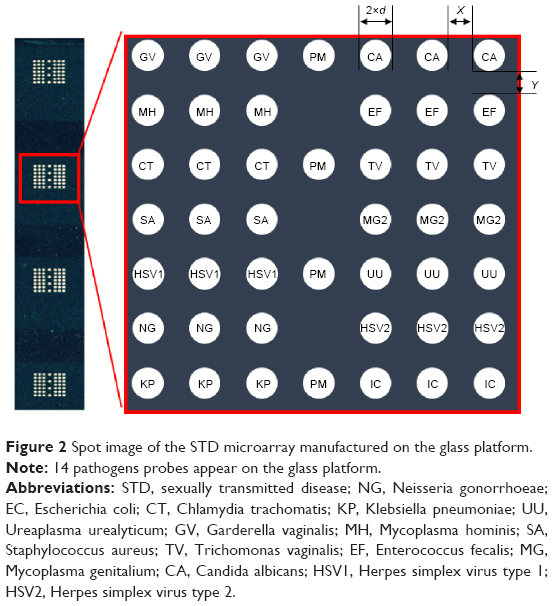 | Figure 2 Spot image of the STD microarray manufactured on the glass platform. |
Hybridization and data acquisition
Reference target materials (negative control [NC]: MH [low concentration], HSV2 [low concentration], IC (high concentration), and TV [high concentration]) for investigating the spot signals along with the β-globin gene were prepared from American Type Culture Collection (Manassas, VA, USA). Negative control materials can make fluorescence in the IC spot and the position marker. The reference materials were denatured at 95°C for 5 min and cooled on ice for 5 min. The reference materials were then diluted in the same volume of hybridization buffer containing 0.01% Triton X-100 and 1× SSPE (0.15 M NaCl, 10 mM NaH2PO4, and 1 mM EDTA), and incubated on the microarray at 47°C for 90 min at each of the spots. Figure 2 shows the STD DNA microarray image with spot names for reference materials. After hybridization, the array was rinsed with washing buffer containing 0.005% Triton X-100 and 6× SSPE (0.9 M NaCl, 60 mM NaH2PO4, and 6 mM EDTA, pH 7.4) for 10 min, and then rinsed with DI water at room temperature. The microarray was then scanned with an Axon GenePix 4000B fluorescence reader (Axon Instruments, Foster City, CA, USA). The signal intensity of the position marker and the IC spot was analyzed for their performance. The laser power and photomultiplier tube settings were 100 and 600 W, respectively. The 16 bit TIFF images obtained were analyzed by a GenePix Pro 3.0 (Axon Instruments).
Results and discussion
Background intensities of glass platforms
Figure 3 shows the average background images and intensities following hybridization with capture probes for all six glass platform surfaces. Background intensities were measured for an average of ten glass platforms. All intensities were measured using the same Axon GenePix 4000B fluorescence reader (Axon Instruments) and were plotted on the same scale to allow ready visual comparison of the data. Figure 3A shows the background scan images of the unblocked glass platform after hybridization. There were no contaminations and defects by dusts on the all amine-modified surfaces as seen in Figure 3A.
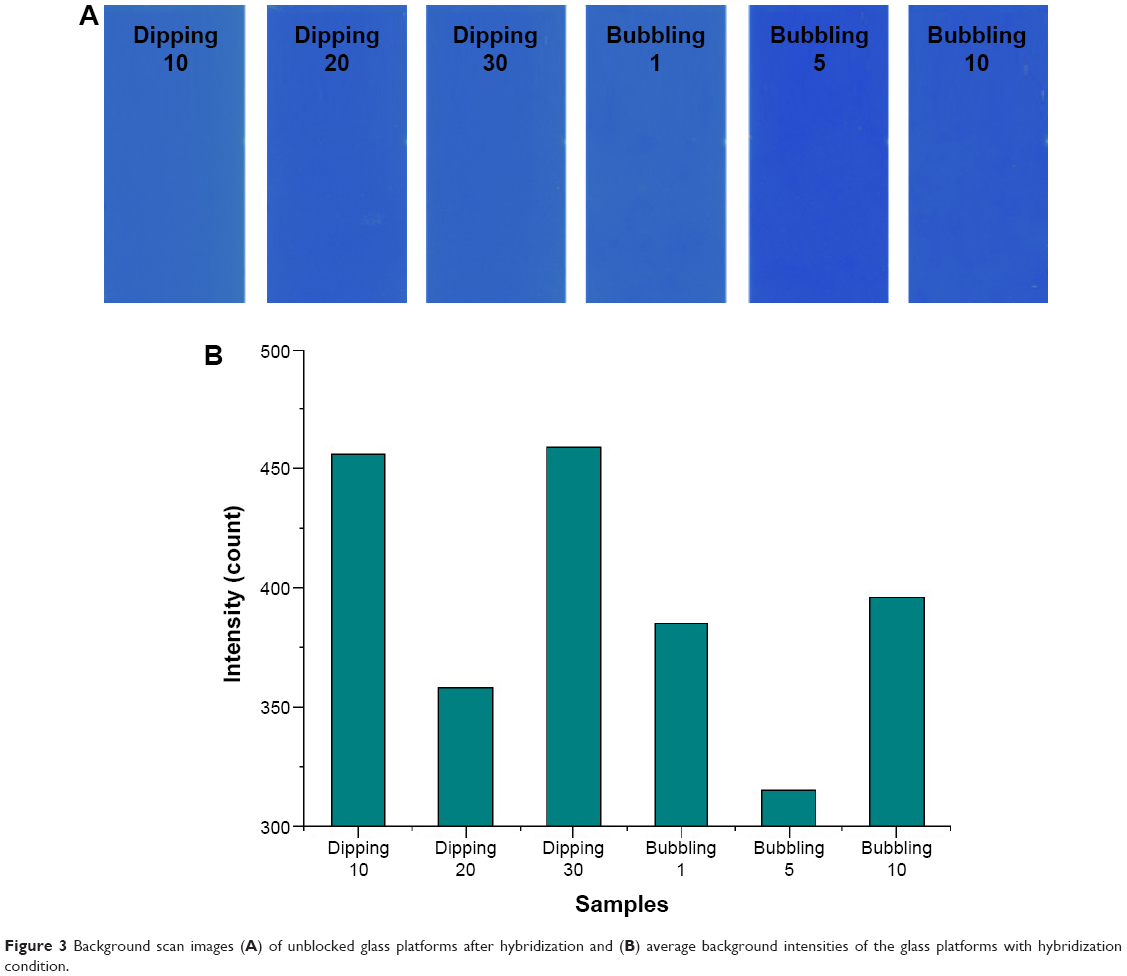 | Figure 3 Background scan images (A) of unblocked glass platforms after hybridization and (B) average background intensities of the glass platforms with hybridization condition. |
Figure 3B shows the average background intensities of the glass platforms with conditions of hybridization. The amine-modified surfaces prepared with the bubbling method for 5 min (bubbling 5) after hybridization gave the lowest background intensities (315 counts) when compared with the other surfaces, as seen in Figure 3B. This means that a uniform APTS concentration was maintained, owing to circulation of the APTS solution in the whole bath of the bubbling system. Therefore, there is minimal background intensity variation among all glass platforms prepared by the bubbling method in a bath.
Characteristics of the surface chemistry on glass platforms
Optical microscopy and UV–visible spectrometry was conducted to analyze the background intensity of the glass platforms prepared by the dipping and bubbling methods. Manufactured APTS-modified surfaces of the glass platforms were clean, without any particles or contamination as determined by observation with naked eyes and optical microscopy at a magnification of 400. No formation of agglomerations of ATPS molecules on the surface was observed, due to the increased dispersion of molecules and the APTS uniformity maintained on the surface of the platform prepared by the bubbling system. Figure 4 shows the UV–visible spectra at surface-modified glass platforms manufactured under each condition. No molecule agglomerations, particles, or decomposition was detected by UV–visible spectroscopy after cleaning using the RCA solution. The transmittance of the platform was decreased as the surface modification process time increased. This means that the surface density of the APTS molecules thin layer was increased. Besides, APTS monolayer may be able to form as a double layer. This can disturb hybridization between the platform surface and the probe DNA.
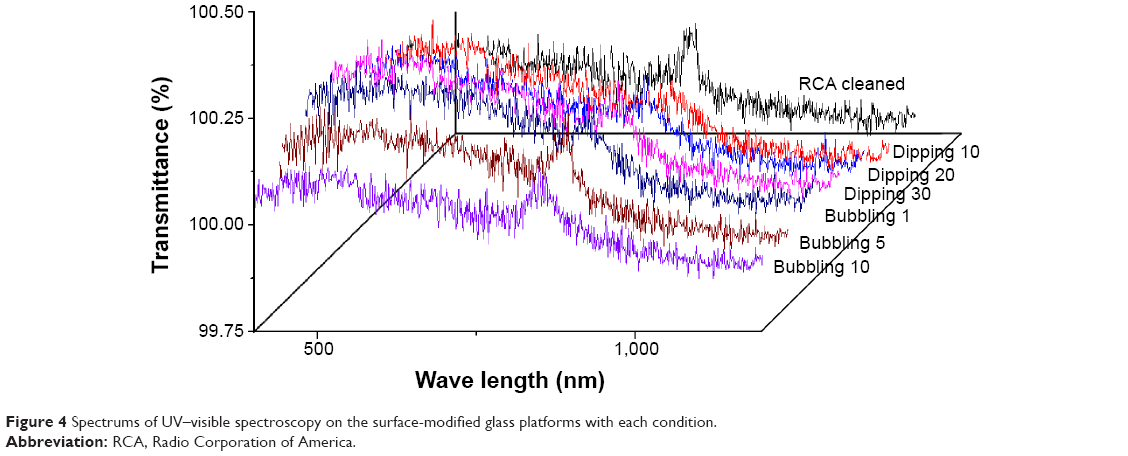 | Figure 4 Spectrums of UV–visible spectroscopy on the surface-modified glass platforms with each condition. |
The formation of APTS, as the SAM, on the surface of the platform was analyzed using AFM. Figure 5 shows AFM images of the platform with a SAM prepared by the dipping (Figure 5 [Dipping 10, Dipping 20, and Dipping 30]) or bubbling method (Figure 5 [Bubbling 1, Bubbling 5, and Bubbling 10]). The surface morphology of the platforms were nearly identical, although the process time was increased. Uniformity of the surface was also unaltered by the process time. This means that APTS could be deposited on the surface of the platform as a highly uniform monolayer by the bubbling method.
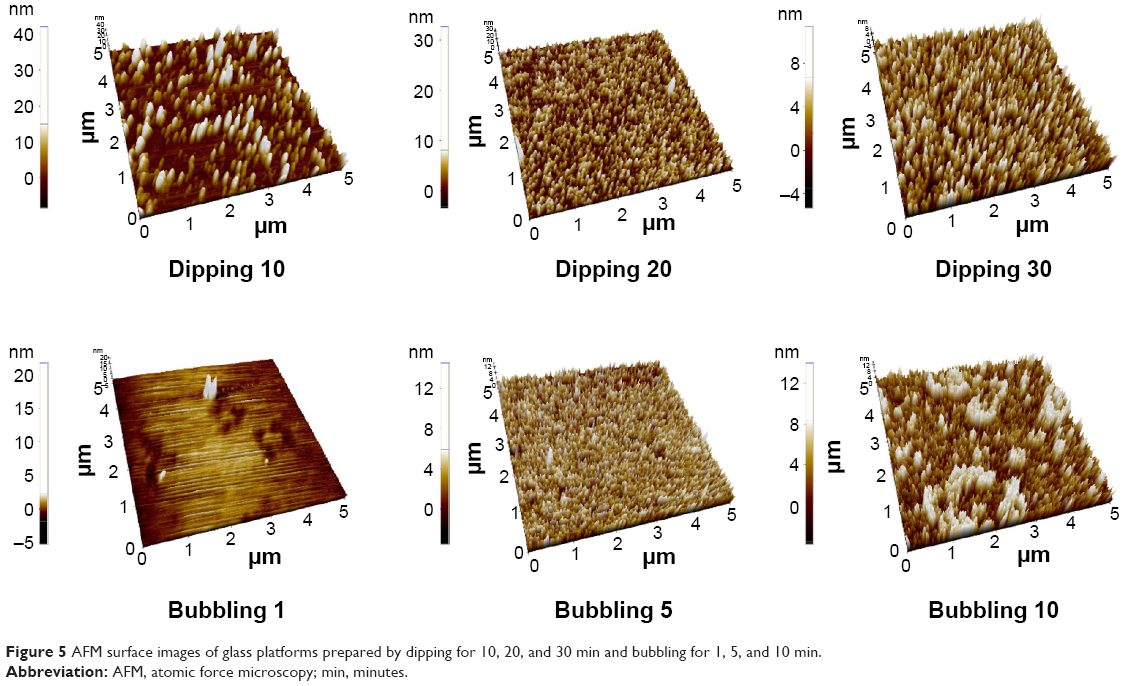 | Figure 5 AFM surface images of glass platforms prepared by dipping for 10, 20, and 30 min and bubbling for 1, 5, and 10 min. |
In the AFM images, the average root mean squares (Rms) for the surface roughness of the glass platforms prepared with the dipping method for 10, 20, and 30 min were 5.911, 2.906, and 2.592 nm, respectively; on the other hand, the Rms for the surface roughness of the glass platforms prepared with bubbling method for 1, 5, and 10 min were 1.065, 2.109, and 3.087 nm, respectively. The glass platform fabricated by dipping for 10 min had an unstable surface due to incomplete surface modifications. The APTS formation on the surface of dipped platforms had a maximum formation density in the glass platform fabricated by dipping for 30 min, as shown in Figure 5 (Dipping 30). On the other hand, the APTS formation on the surface of platforms by bubbling method had a maximum formation density in the glass platform fabricated by bubbling for 5 min, as shown in Figure 5 (Bubbling 5). As shown in Figure 3, the glass platforms with low background intensities (Bubbling 5) had Rmss of 2.1 nm. We determined that APTS formation was optimized at a surface roughness with Rmss near 2.1 nm since the background intensity after hybridization was lowest in the glass platform fabricated by bubbling for 5 min.
Spot footprint
The spot footprint is the most important assessment of quality, and it comprises parameters such as the position and diameter of spots to describe the uniformity of the microarray. We focused on the spot footprint for the optimal surface chemistry. The STD microarray has one kind of probe and standard PCR-active materials. Figure 6 shows the values of the spot footprint (diameter and position [X, Y]). The glass platform fabricated by bubbling for 5 min, produced by the bubbling method for 5 min, had the most precise spot diameter and position of all samples, when comparing spot design. In the results shown in Figure 5, the quality of the APTS formation is seen to be affected by the spot position and diameter. This means that a given spot footprint can reduce error values of the STD microarray diagnosis. In addition, we demonstrated that the spot size and position are not affected by the surface modification conditions since there are no overlaps or unexpected spot errors between the spots.
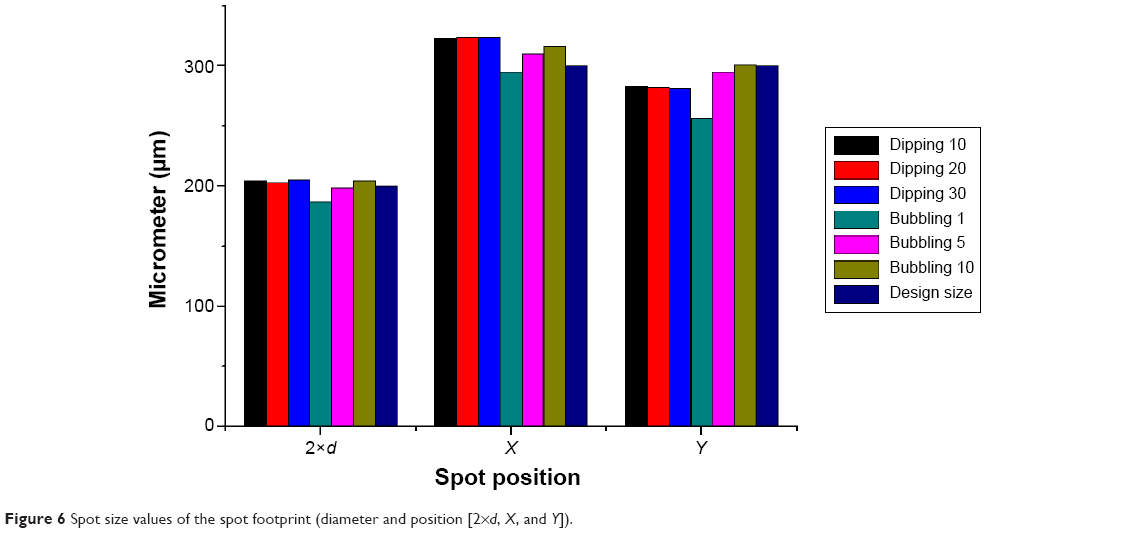 | Figure 6 Spot size values of the spot footprint (diameter and position [2×d, X, and Y]). |
Signal intensities of STD microarray
Here, the average spot signal intensity of the position marker and NC spots was defined as the spot intensity divided by the background intensity (S/B). The spot signal intensities were measured using a GenePix 4000B fluorescence reader (Axon Instruments) and its software. Figure 7A shows that the signal intensities (S/B) of the STD microarrays using the glass platforms with APTS surfaces yielded the highest signal intensities for oligonucleotides after hybridization with the target DNA. Moreover, Figure 7B shows the standard deviation values of the signal intensities of the 20 STD microarrays prepared with the various platform conditions. The spot signal intensity of the STD microarray using the glass platform made by the bubbling process was higher than that of the platform made by the dipping process. In addition, the lowest variation in the magnitude of signal intensities across all surfaces was observed in the STD microarrays with glass platforms prepared by the bubbling method. Specifically, the STD microarray using the glass platform prepared by the bubbling process for 5 min had the highest signal intensity (8.812) and minimum standard deviation (0.0692) due to the optimized APTS surface of the glass platform as shown in Figure 3. The improved surface characteristics of the glass platform resulted from a uniform and expeditious process that was possible because the ATPS concentration on the platform surface could be maintained by the bubbling process. These results show that surface characteristics are a critical property for all microarray-based diagnostics, including this STD microarray. An APTS-modified surface has to be prepared with the optimal thickness and uniform surface roughness. A surface that is incomplete or has excessive APTS modifications could decrease the signal intensity of the microarray. Consequently, the bubbling method is an effective process to manufacture glass platforms for DNA microarrays since a higher signal intensity and uniformity, as well as a high productivity for the glass platforms can increase the diagnostic accuracy of the DNA microarray.
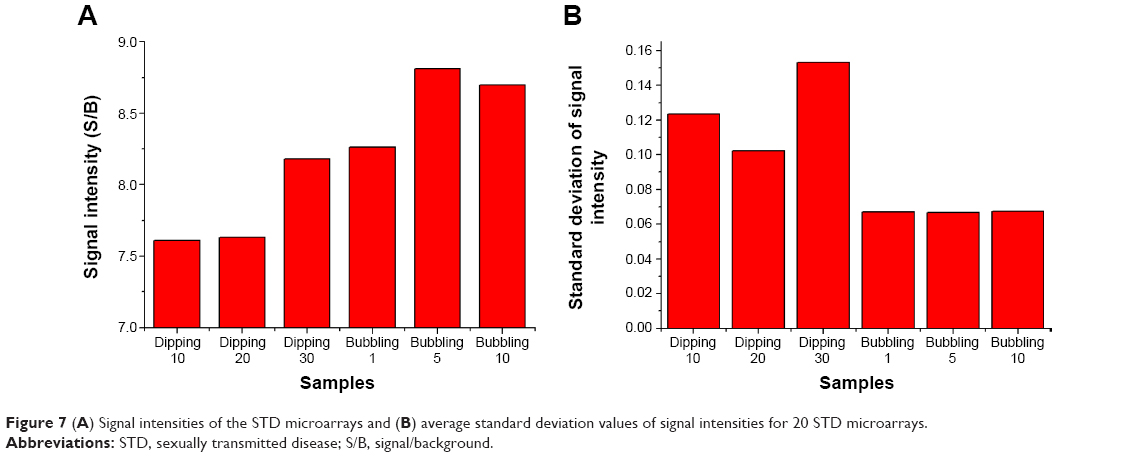 | Figure 7 (A) Signal intensities of the STD microarrays and (B) average standard deviation values of signal intensities for 20 STD microarrays. |
Conclusion
The surface modification of glass platforms was performed using ATPS. The glass platforms were manufactured by a bubbling method that was applied to an STD microarray. These platforms were highly uniform and had an optimal surface chemistry. No molecule agglomeration, particles, or decomposition was detected by optical microscopy or UV–visible spectroscopy. The minimum background intensity of the glass platform was obtained by 5 min of the bubbling method. The surface characteristics of the glass platforms prepared by this method were optimized for all microarray-based diagnostics, including the diagnosis of STDs with this microarray. In this study, the bubbling method for manufacturing glass platforms with high uniformity and process yield is an effective process for the manufacture of DNA microarrays.
Acknowledgment
This research was supported by a grant (#D131355) from Gyeonggi Technology Development Program funded by Gyeonggi Province, Republic of Korea.
Disclosure
The authors report no conflicts of interests in this work.
References
Roh C, Lee H-Y, Kim S-E, Jo S-K. A highly sensitive and selective viral protein detection method based on RNA oligonucleotide nanoparticle. Int J Nanomedicine. 2010;5:323–329. | ||
Bessueille F, Dugas V, Vikulov V, Cloarec JP, Souteyrand E, Martin JR. Assessment of porous silicon substrate for well-characterised sensitive DNA chip implement. Biosens Bioelectron. 2005;21:908–916. | ||
Fang Y, Frutos AG, Lahiri J. Membrane protein microarrays. J Am Chem Soc. 2002;124:2394–2395. | ||
Charles PT, Goldman ER, Rangasammy JG, Schauer CL, Chen M-S, Taitt CR. Fabrication and characterization of 3D hydrogel microarrays to measure antigenicity and antibody functionality for biosensor applications. Biosens Bioelectron. 2004;20:753–764. | ||
Huang R-P. Detection of multiple proteins in an antibody-based protein microarray system. J Immunol Methods. 2001;255:1–13. | ||
Lindroos K, Liljedahl U, Raitio M, Syvanen A. Minisequencing on oligonucleotide microarrays: comparison of immobilization chemistries. Nucleic Acids Res. 2001;29:e69–e87. | ||
Zammatteo N, Jeanmart L, Hamels S, et al. Comparison between different strategies of covalent attachment of DNA to glass surfaces to build DNA microarrays. Anal Biochem. 2000;280:143–150. | ||
Nakagawa T, Tanaka T, Niwa D, Osaka T, Takeyama H, Matsunaga T. Fabrication of amino silane-coated microchip for DNA extraction from whole blood. J Biotechnol. 2005;116:105–111. | ||
Yoza B, Arakaki A, Matsunaga T. DNA extraction using bacterial magnetic particles modified with hyperbranched polyamidoamine dendrimer. J Biotechnol. 2003;101:219–228. | ||
Kim CJ, Jeong JK, Park M, Park TS, et al. HPV oligonucleotide microarray-based detection of HPV genotypes in cervical neoplastic lesions. Gynecol Oncol. 2003;89:210–217. | ||
Fidelis AC, Dutra RF, Souza PRE, de Melo CP, Maia MMD. A simple HPV 18 detection method based on ultra specific primer immobilized on glass slides. J Clin Lab Anal. 2013;27:143–147. | ||
Schopp B, Holz B, Zago M, et al. Evaluation of the performance of the novel PapilloCheck® HPV genotyping test by comparison with two other genotyping systems and the HC2 test. J Med Virol. 2010;82:605–615. | ||
Mabey D, Peeling RW, Ustianowski A, Perkins MD. Tropical infectious diseases: diagnostics for the developing world. Nat Rev Microbiol. 2004;2:231–240. | ||
Lee G-I, Yoen J, Kang J, et al. A comparison of oligonucleotide-based microarray and real-time PCR for the detection of sexually transmitted infections. BioChip J. 2013;7:68–74. | ||
Jee SH, Kim SH, Ko JH, Yoon YS. Study on work function change of ITO modified by using a self-assembled monolayer for organic based devices. J Korean Phys Soc. 2006;49:2034–2039. | ||
Chung W-Y, Jung YL, Park KS, et al. A sexually transmitted disease (STD) DNA chip for the diagnosis of genitourinary infections. Biosens Bioelectron. 2011;26:4314–4319. |
 © 2015 The Author(s). This work is published and licensed by Dove Medical Press Limited. The full terms of this license are available at https://www.dovepress.com/terms.php and incorporate the Creative Commons Attribution - Non Commercial (unported, v3.0) License.
By accessing the work you hereby accept the Terms. Non-commercial uses of the work are permitted without any further permission from Dove Medical Press Limited, provided the work is properly attributed. For permission for commercial use of this work, please see paragraphs 4.2 and 5 of our Terms.
© 2015 The Author(s). This work is published and licensed by Dove Medical Press Limited. The full terms of this license are available at https://www.dovepress.com/terms.php and incorporate the Creative Commons Attribution - Non Commercial (unported, v3.0) License.
By accessing the work you hereby accept the Terms. Non-commercial uses of the work are permitted without any further permission from Dove Medical Press Limited, provided the work is properly attributed. For permission for commercial use of this work, please see paragraphs 4.2 and 5 of our Terms.