")
Back to Journals » International Journal of Nanomedicine » Volume 11
Improved proliferation of antigen-specific cytolytic T lymphocytes using a multimodal nanovaccine
Authors Li B, Siuta M, Bright V, Koktysh D, Matlock BK, Dumas ME, Zhu M, Holt A, Stec D, Deng S, Savage PB , Joyce S, Pham W
Received 10 May 2016
Accepted for publication 14 September 2016
Published 16 November 2016 Volume 2016:11 Pages 6103—6121
DOI https://doi.org/10.2147/IJN.S112432
Checked for plagiarism Yes
Review by Single anonymous peer review
Peer reviewer comments 3
Editor who approved publication: Professor Carlos Rinaldi
Bo Li,1,2 Michael Siuta,1 Vanessa Bright,1,2 Dmitry Koktysh,3,4 Brittany K Matlock,5 Megan E Dumas,1 Meiying Zhu,1 Alex Holt,1 Donald Stec,3,6 Shenglou Deng,7 Paul B Savage,7 Sebastian Joyce,8,9 Wellington Pham1,2,6,10–12
1Institute of Imaging Science, Vanderbilt University School of Medicine, 2Department of Radiology and Radiological Sciences, 3Department of Chemistry, Vanderbilt University, 4Vanderbilt Institute of Nanoscale Science and Engineering, 5Vanderbilt Flow Cytometry Shared Resource, Vanderbilt University, 6Vanderbilt Institute of Chemical Biology, 7Department of Chemistry and Biochemistry, Brigham Young University, 8Department of Pathology, Microbiology and Immunology, Vanderbilt University, 9Veterans Administration Tennessee Valley Healthcare System, 10Department of Biomedical Engineering, 11Vanderbilt Ingram Cancer Center, 12Vanderbilt Brain Institute, Vanderbilt University, Nashville, TN, USA
Abstract: The present study investigated the immunoenhancing property of our newly designed nanovaccine, that is, its ability to induce antigen-specific immunity. This study also evaluated the synergistic effect of a novel compound PBS-44, an α-galactosylceramide analog, in boosting the immune response induced by our nanovaccine. The nanovaccine was prepared by encapsulating ovalbumin (ova) and an adjuvant within the poly(lactic-co-glycolic acid) nanoparticles. Quantitative analysis of our study data showed that the encapsulated vaccine was physically and biologically stable; the core content of our nanovaccine was found to be released steadily and slowly, and nearly 90% of the core content was slowly released over the course of 25 days. The in vivo immunization studies exhibited that the nanovaccine induced stronger and longer immune responses compared to its soluble counterpart. Similarly, intranasal inhalation of the nanovaccine induced more robust antigen-specific CD8+ T cell response than intraperitoneal injection of nanovaccine.
Keywords: nanovaccine, dendritic cells, GalCer, inhalable vaccine
Background
The induction of robust antigen-specific cytolytic T lymphocytes is a fundamental step in anticancer immunotherapy.1,2 The activation of T cells can be achieved only when their surface receptors are exposed to antigens presented by antigen-presenting cells (APCs) and simultaneous engagement of costimulatory molecules on T cells and APCs. APCs include macrophage cells, B cells, and dendritic cells (DCs); however, only DCs are capable of activating naïve T cells, an action vital for the generation of adaptive immunity.3,4 DCs are among a few other cells that can present complex protein fragments, carbohydrates, and lipid antigens through CD1a, b, c, and d molecules in humans and only CD1d in mice.5,6 Not only can DCs process endogenous antigens, but they can also cross-present exogenous antigens to CD8+ T cells, which leads to the induction of the cellular immune responses responsible for tumor cell clearance.7 Therefore, DCs represent one of the most unique APCs because of their ability to process and present both endogenous and exogenous antigens.
Previously, we demonstrated a novel antigen delivery technique that significantly improved tumor antigen uptake by DCs in cancer therapy.8 We showed that the delay of tumor growth was achieved in the transgenic mice that received MUC1-pulsed DCs. The result of this DC-based vaccination therapy strongly correlated with increased apoptotic tumor cell death. However, we did not observe a robust immune response that can completely overcome the tumor burden. Work of several research groups, including ours,8–13 suggested that improved efficacy of DC-based therapy could be accomplished by combining the subunits of tumor antigens and a strong adjuvant. Further, in order to realize minimal toxicity and maximal therapeutic benefit, encapsulation of the antigens and adjuvant with biodegradable nanoparticles might just very well serve the purpose, because such encapsulation ensures a stable and sustained release of core contents from inside the nanoparticle envelop over an extended period of time. The encapsulated vaccines are not only safe, but also able to induce potent and long-lasting immune responses.14 The primary advantage of this approach is that DCs are predisposed to uptake nanoparticles, and these nanoparticle-loaded DCs quickly mature, which leads to the T cell activation. We put this hypothesis to test by encapsulating ovalbumin (ova) and PBS-44 with poly(lactic-co-glycolic acid [PLGA]) nanoparticles. In this proof-of-principle study, we chose ova since it is one of the well-established stimulatory antigens to both CD4+ and CD8+ T cells. The adjuvant used in this study is a novel derivative of α-galactosylceramide (αGalCer), PBS-44. αGalCer is a glycolipid that is presented to the type 1 semi-invariant natural killer T (NKT) cells by DCs through CD1d molecules;15 activated NKT cells start to release proinflammatory and immunomodulatory cytokines,16 which further prompts CD40L-mediated transactivation of DCs that present the adjuvant to NKT cells.17 Therefore, αGalCer has emerged as an effective immunomodulator and a powerful adjuvant for the induction of pathogen- and tumor-specific immune responses.18–21 By integrating nanotechnology with vaccine design, we aimed to achieve two purposes in this study. First, we set to evaluate and compare the efficacy of our model nanovaccine, PLGA-encapsulated ova plus PBS-44 (NanoVac), with its unencapsulated counterpart (soluble Vac) and also with PLGA-encapsulated either ova (OvaVac) or PBS-44 (PBS-44Vac). Second we intended to test the impact of two vaccine administration routes, intranasal (IN) inhalation and intraperitoneal (IP) inoculation, in terms of the level and duration of antigen-specific cellular immune response. The results obtained from this study suggested that the NanoVac formulation was able to elicit stronger and longer antigen-specific cellular immune response than all of other formulations, especially in comparison to the soluble counterpart. We also found that the adjuvant, PBS-44, in our NanoVac greatly increased NanoVac’s ability in enhancing such antigen-specific immune response, Further, we demonstrated that vaccine administration route, indeed, had distinct impact on the vaccine efficacy; in this study, it was evident that IN route was much superior than IP injection route in almost all paired groups.
Methods
Materials
Poly(D,L-lactide-co-glycolide) 50/50 was obtained from Wako Chemical (Richmond, VA, USA). Polyvinyl alcohol (PVA) and ovalbumin (ova) (grade V) protein were purchased from Sigma-Aldrich Co. (St Louis, MO, USA). Ova-specific dextramer, R-phycoerythrin–conjugated MHC Dextramer H-2Kb/SIINFEKL (ova dextramer), was obtained from Immundex (Copenhagen, Denmark). Further, anti-CD4, -CD11b, -CD11c, -B220, -CD8a antibodies, and enzyme-linked immunosorbent assay (ELISA) kits for interferon-γ (IFN-γ), interleukin (IL)-2, IL-4, and tumor necrosis factor-α (TNF-α) were from BD Biosciences (San Diego, CA, USA); anti-CD3, NK1.1, IFN-γ, IL-4, and Fixable Viability Dye were purchased from eBioscience (San Diego, CA, USA); and ACK lysis buffer was from Thermo Fisher Scientific (Waltham, MA, USA).
Animals
The Vanderbilt University Institutional Animal Care and Use Committee gave ethical approval for this study. Animal experiments were carried out as per the guidelines provided by the Vanderbilt University Institutional Animal Care and Use Committee and the National Institute of Health Guide for the Care and Use of Laboratory Animals.
Synthesis and characterization of PBS-44
As shown in Figure 1, olefin 2 was synthesized starting from aldehyde 1 using a previously reported procedure.16 Asymmetric dihydroxylation of compound 2 in the presence of osmium trioxide and N-methylmorpholine N-oxide provided a 2:1 mixture of isomers 3 and 4. Acid-catalyzed deprotection of the Boc group of compound 3 provided the corresponding phytosphingosine, which was coupled with nervonic acid using dicyclohexylcarbodiimide coupling. To facilitate the purification of the amphiphilic molecules in organic solvents, acylation of the hydroxyl groups was carried out using acetic anhydride and dimethyl aminopyridine to provide 5. Selective acyl deprotection to reveal the primary alcohol 6 was achieved using protection/deprotection approach.
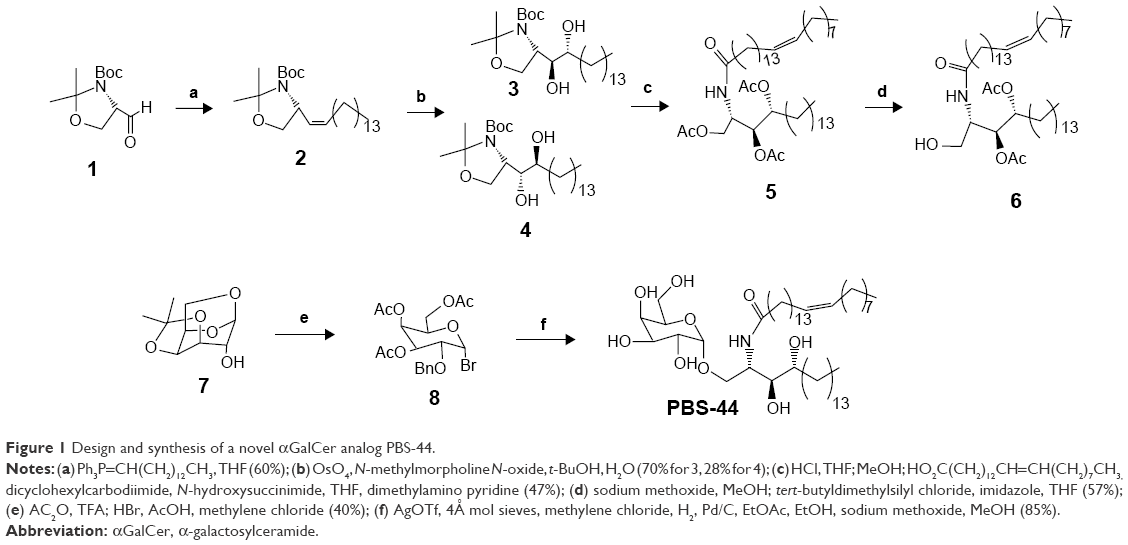 | Figure 1 Design and synthesis of a novel αGalCer analog PBS-44. |
Galactosyl donor 8 was prepared in a few steps starting from commercially available anhydrogalactose 7. Coupling of compound 8 with ceramide 6 provided predominantly the α-anomer with a small portion of the β-anomer. Removing the protecting group at this position enables the purification to obtain pure α-anomer. Finally, acetate protecting groups were cleaved off to provide the final αGalCer product, PBS-44.
Synthesis of nanovaccine
The procedure of nanovaccine synthesis was as described previously.22 In brief, ova (100 μL, 150 mg/mL) in ddH2O and PBS-44 (100 μL, 2 mg/mL) in methylene chloride were added to a glass vial containing a PLGA (500 mg) solution in methylene chloride (4 mL) with vigorous stirring. The mixture was then homogenized at 10,000 rpm for 1 minute in an iced water bath, which was followed by pouring the mixture into a solution of 2% PVA (10 mL). The mixture was further stirred for 20 seconds before it was poured into a solution of 0.5% PVA (20 mL). The resulting mixture was continuously stirred vigorously for 3 hours at room temperature (RT) to evaporate the organic solvent. The final product was obtained by washing with ddH2O (3×) and lyophilization. The encapsulation efficiency was calculated as described previously23,24 with minor modification. In brief, the vaccine (10 mg) was dissolved in dimethylsulfoxide (750 mL) for 1 hour at RT, followed by the addition of a solution of 0.5%/0.2 N NaOH (2 mL), and the mixture was stirred for 1 hour. The ova concentration was determined by a BCA protein assay (Pierce Life Technologies). The encapsulation efficiencies of NanoVac and OvaVac were 82%±3% and 84%±4%, respectively.
Characterization of the physical property of the NanoVac by scanning electron microscopy (SEM), atomic force microscopy (AFM), and optical imaging
The silicon wafer pieces were used as sample substrates for PLGA-based nanoparticle imaging. Before sample deposition, the wafers were subjected to extensive cleaning using fresh “piranha” solution. Afterward, a small drop of chloroform was applied on the surface of dried Si wafer. After chloroform evaporation, the sample was used for optical and AFM imaging. For SEM imaging, the samples were additionally sputtered with an Au coating in argon atmosphere.
Optical imaging of the samples was performed using optical 100× objective lens from the confocal DXR Raman microscope (Thermo Fisher Scientific). For AFM, the samples were analyzed using Dimension Icon Microscope (Bruker Corporation, Billerica, MA, USA). Tapping mode approach was used to acquire the images, while the SEM images were obtained using an S4200 high-resolution microscope (Hitachi Ltd., Tokyo, Japan).
Preparation of bone marrow-derived DCs (BMDCs)
BMDCs were generated from mouse bone marrow (BM) cells, as previous described by the authors.8,25,26 Briefly, the BM cells from mouse femurs and tibias were flushed out with RPMI 1640 medium using a 27-gauge needle and collected into a 50 mL conical tube after they are passed through a nylon mesh cell strainer of 70 μm pore size. Red blood cells were lysed from the BM cells by incubation for 3 minutes in 0.83% ammonium chloride at RT. The remaining BM cells were then counted and cultured in six-well plates at a density of 1×10⁶ cells/mL in RPMI 1640 medium supplemented with 5% fetal bovine serum, 55 nM of 2-mercaptoethanol, 50 μg/mL gentamycin, and 20 ng/mL recombinant murine granulocyte macrophage colony-stimulating factor. Fresh medium containing granulocyte macrophage colony-stimulating factor was added to each plate on day 3 of culture. On day 6, the weakly attached cells were collected and used for experiments as immature BMDCs.
Controlled release of ova antigen and PBS-44
Duplicated NanoVac samples were stirred constantly at RT in small glass vials, with each of them containing a concentration of the vaccine (10 mg/1 mL in 1× phosphate-buffered saline [PBS]). On days 1, 2, 4, 7, 10, 14, 21, and 25, a small fraction of each sample (10 μL) was collected and stored at −20°C until analysis. The release of ova was measured by BCA method using Synergy 2 Multi-Mode Reader. The concentrations of ova in all samples were calculated from the standard curve generated by series dilution of albumin standard (Thermo Fisher Scientific, Cat: 23209).
The analysis of the release of PBS-44 from NanoVac was mainly achieved qualitatively. The study employed two batches of immature DCs (1.0×10⁶ each) for analysis: 1) untreated, used as vehicle and 2) treated with NanoVac (0.5 mg/mL). Four days after incubation of the nanoparticles with DCs, the cells were washed and lysed mechanically and the supernatant was collected and lyophilized. Then the residue was taken up in deuterated chloroform for proton nuclear magnetic resonance (NMR) analysis. For the untreated control DCs, the cells were mechanically lysed using a homogenizer to minimize additional unspecific signals from the lysis buffer. The solution was centrifuged; the cytosolic material in the supernatant was collected and processed in a way similar to that of cells treated for NMR study.
Immunization and procedures
Eight cohorts of wild type (wt) C57BL/6 mice (n=6 each) were treated with NanoVac, OvaVac, PBS-44Vac, or soluble Vac. Each treatment regimen was administered either by IP injection or IN inhalation, and each mouse received an equivalent dose of ova (100 μg) and/or PBS-44 (2 μg). For IN distribution, ketamine or xylazine (0.15 or 0.01 mg/g)-administered mouse was held in an upward position to straighten the respiratory tract before the administration of vaccines to the lungs through spontaneous inspiration of minute amount of the vaccine (50 μL) over the course of 2–3 minutes. The IP injection was performed in awake mice. Two boosters of the same dose at 7-day intervals were given after the priming dose. Six weeks postpriming, peripheral blood was collected and spleen harvested for specific immune cell analysis by flow cytometry. An identical experiment was repeated once with the end point set at 10 weeks after priming to validate the reproducibility and durability of the treatment. Also, serum cytokine analysis was performed at this time point by ELISA.
In vitro cytokine release assay
Single-cell suspension was obtained by gently grinding the spleen of wt C57BL/6 mice through a 40 μm cell strainer with 3 mL of ACK lysis buffer, followed by a brief wash with cold PBS and centrifugation (10 minutes, 1,200 rpm). Then, 1×10⁶ cells were distributed to round-bottom wells of a 96-well plate and the corresponding vaccine was added in triplicate with an equivalent amount of ova and PBS-44 as such: NanoVac (32 μg/100 μL) or soluble Vac (PBS-44, 2 μg/100 μL and ova, 0.32 μg/μL). The treated splenocytes were cultured in RPMI 1460 medium containing 10% FBS, 1% penicillin/streptomycin, sodium pyruvate, L-glutamine, 2.5% HEPES, and 0.0018% (w/w) 2-mercaptoethanol (BME). The cell culture was incubated at 37°C supplemented with 5% CO2 for up to 7 days and the cytokine levels were measured at 6, 24, 48, and 72 hours, and 7 days posttreatment.
Evaluation of NKT cell proliferation and intracellular cytokines posttreatment
Three groups of wt C57BL/6 mice (n=6 each) were treated with dimethylsulfoxide (as control), NanoVac, and soluble vaccine. The mice were sacrificed for determining the splenocytic NKT cells and the corresponding cytokines on days 2 (n=3 each) and 7 (n=3 each) by flow cytometry. The procedure was performed as described previously27,28 with minor modification. In brief, after surface staining with anti-CD3 and NK1.1 fluorescent-labeled antibodies, the cell suspension with 1.0×10⁶ cells was incubated with Fixable Viability Dye (1 mL) at 4°C for 30 minutes, followed by a brief wash with FACS buffer. The resulting cells were suspended in fixation buffer, centrifuged, and resuspended in permeabilization buffer and centrifuged before exposure to anti-IFN-γ and IL-4 fluorescent-labeled antibodies for FACS analysis.
Dextramer assay to determine the frequency of ova-specific CD8+ T cells
The peripheral blood collected from each treatment group (n=3) under noncoagulating condition was lysed with ACK lysis buffer for 3 minutes and washed with cold PBS twice. The remaining cells were treated with 3 μL of ova dextramer for 10 minutes, followed by the addition of cocktail of Dasatinib (50 nM) and fluorescently labeled anti-CD4, -B220, -CD11b, CD11c, and -CD8 monoclonal antibodies (at 1:100 dilution). The mixtures were further incubated at RT in the dark for 1 hour, washed with FACS buffer (1× PBS, 2% FBS, and 50 nM Dasatinib), resuspended in PBS with propidium iodide (PI; 1:2,000), and stored at 4°C in the dark until analysis.
Preparation of splenocytes was performed as described earlier. The red blood cells were lysed with 3 mL of cold ACK buffer for 5 minutes. After brief centrifugation, the cell suspension was washed with PBS twice prior to labeling with ova dextramer for 10 minutes, followed by the addition of fluorescent antibodies as described earlier for 1 hour. Cells were washed with cold PBS, resuspended in 200 mL of PBS containing PI (1:2,000), and stored at 4°C in the dark until analysis.
Multiparametric flow cytometry was used to enumerate ova-specific CD8+ T cells. Single cells were identified by forward-light scatter and side-light scatter pulse geometry gating. Dead cells were excluded by selecting the cells negative for PI. Further exclusion of CD4+ T cells, DCs, monocytes, granulocytes, NKT cells, and B cells (FITC-conjugated anti-CD4, anti-CD11b, anti-CD11c, and anti-B220) was performed by selecting the FITC-negative cell population. Ova-specific CD8+ T cells were quantified by gating for the Pacific Blue–conjugated anti-CD8 and R-phycoerythrin–conjugated H-2Kb/SIINFEKL double-positive cell population. Flow cytometry was performed on a Special Order Research Product LSRII (BD Biosciences, San Jose, CA, USA), data collected using BD FACSDiva (BD Biosciences), and emerging data analyzed using FlowJo software (FlowJo, LLC, Ashland, OR, USA).
In vivo cytokine analysis
Briefly, a 96-well plate was coated with capture antibodies overnight. The plate was blocked with 1% BSA for 1 hour and serum samples were added in duplicates at a proper concentration. After 2 hours of incubation at RT, the plate was washed and exposed to the corresponding detection antibodies for 1 hour at RT. Then, biotin-conjugated secondary antibodies were introduced into the plate and incubated at RT for 1 hour before adding streptavidin-conjugated horseradish peroxidase. The plate was read on a Synergy 2 Multi-Mode Reader at 450 nm. The quantification of the cytokines was performed from the standard curve generated from the recombinant protein standard provided by the manufacturer.
Histological analysis of the migration to the lymph nodes (LNs)
Immunohistochemistry (IHC) staining of the LN sections was performed as previously described.25 In brief, the tissue sections were treated with 3% hydrogen peroxide to quench the endogenous peroxidases, followed by ultra V block (Lab Vision, Fremont, CA, USA) for 5 minutes before the addition of primary antibody. The sections were incubated with affinity-purified hamster anti-CD11c antibody (eBioscience) at 1:200 dilution for 1 hour at RT, washed in PBS ×3, incubated with biotin-conjugated secondary antibody for 1 hour, followed by treatment with the Vectastain ABC Elite kit (Vector Laboratories, Burlingame, CA, USA) and DAB (Dako, Carpinteria, CA, USA). The tissue slides were counterstained with Fast Green (Dako).
Statistical analysis
The experimental data were reported as mean ± standard deviation (SD). We compared the test groups by two-tailed Student’s t-test using GraphPad software (GraphPad Software, Inc., La Jolla, CA, USA). The P values are one-tailed, and differences with P-values <0.05 were considered statistically significant.
Results
Physical property of PBS-44
PBS-44 was synthesized according to the scheme shown in Figure 1 and as described in the “Materials and methods” section. The purity of the compound was confirmed by electron spray ionization mass spectrometry, 1H and 13C NMR and two-dimensional NMR were used to characterize and confirm the structure of the compound. These methods indicated that the PBS-44 preparation was over 97% pure (Figures S1–S5 and Supplementary materials). Using the current synthetic approach, PBS-44 can be obtained both in high quality and quantity.
Physical property of the NanoVac
To determine the physical property of the NanoVac, the size and shape of the nanovaccine were determined by optical microscopy (Figure 2A), SEM (Figure 2B), and AFM (Figure 2C). The data suggested that the NanoVac nanoparticles were well dispersed in solution with no signs of aggregation. The hydrodynamic diameter of the NanoVac was determined using dynamic light scattering on a Zetasizer Nano ZS (Malvern Instruments, Malvern, UK). The average size of the NanoVac was approximately 429 nm (Figure 2D), and the zeta potential of the probe was −23.9 (Figure 2E). Similar results were observed for OvaVac (Figure S6).
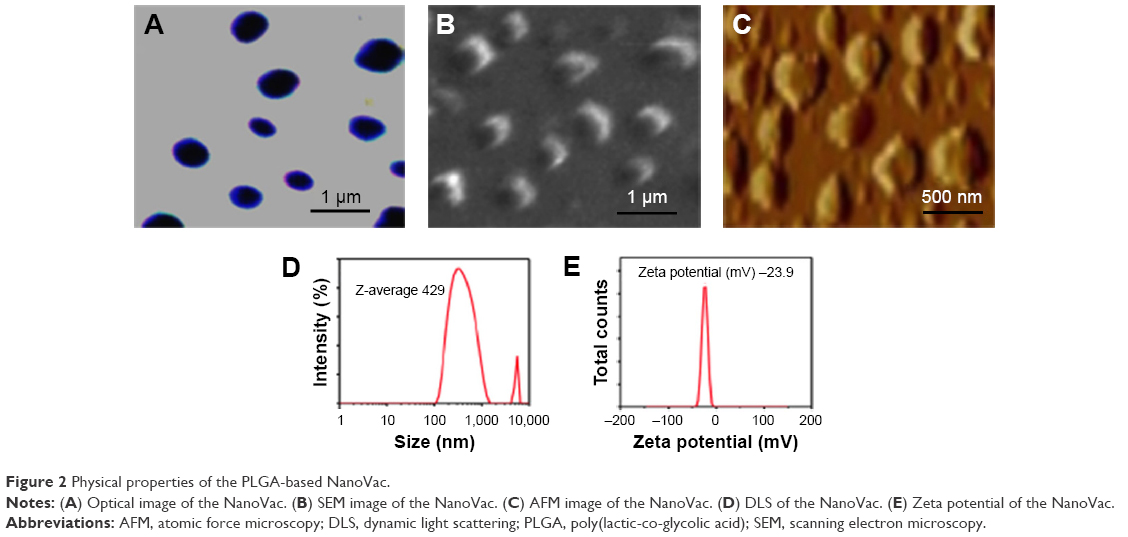 | Figure 2 Physical properties of the PLGA-based NanoVac. |
Prolonged release of vaccine materials from PLGA nanoparticles
The release of ova from NanoVac and OvaVac was analyzed using BCA assay over the course of 25 days. After an initial burst of ova (25%) from the PLGA nanoparticles for the first 2 days, the release seemed to be slow and steady for the rest of the time. Approximately, 90% of ova were detected on day 25 (Figures 3A and S7), and yet, no evidence of degradation or alteration of the antigen was observed for up to 1 month of testing using mass spectrometry (data not shown).
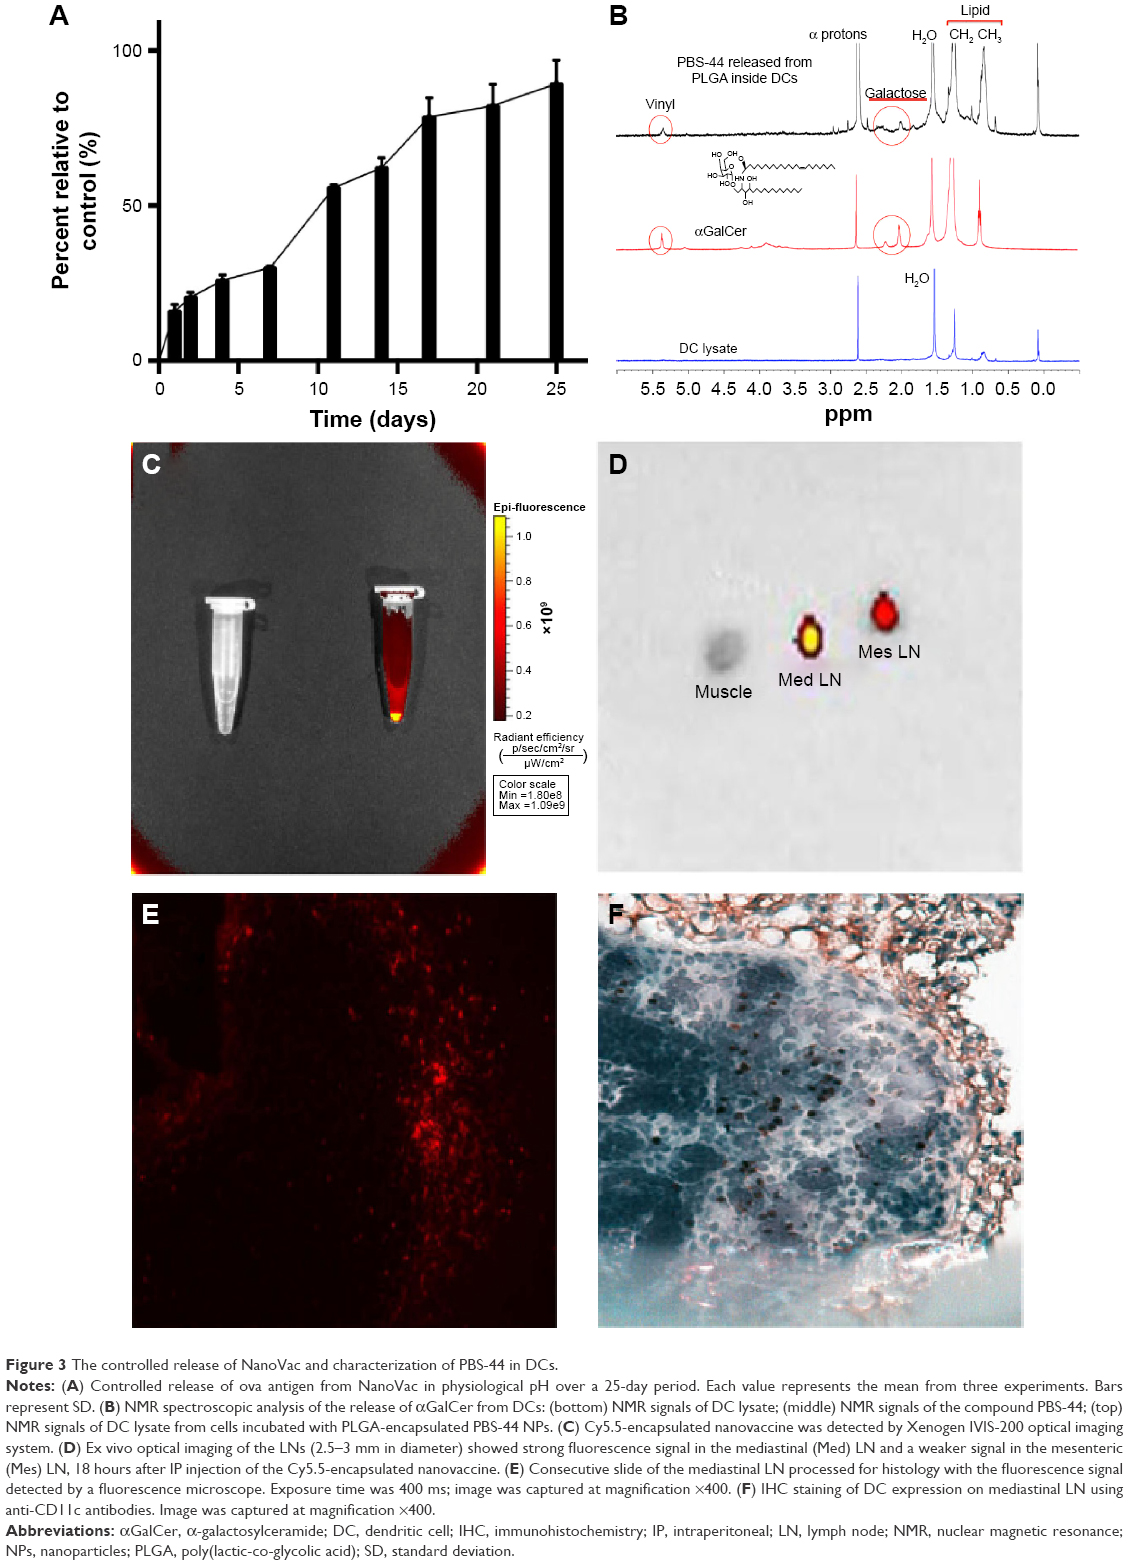 | Figure 3 The controlled release of NanoVac and characterization of PBS-44 in DCs. |
To examine the release of PBS-44 from the NanoVac, we took a different approach since PBS-44 is a hydrophobic chemical that does not have a chromophore, thus greatly limiting the use of conventional methods such as high-performance liquid chromatography or ultraviolet–visible absorbance spectrometry for characterization. Therefore, we opted to use NMR spectroscopy to detect the release of PBS-44 in NanoVac. A caveat exists for NMR analysis of PBS-44, in which the NMR signal of its lipid moieties might be masked by natural lipids from the cells. To ensure that NMR could detect PBS-44 in such a scenario, we tested the release of PBS-44 from NanoVac in DCs. As shown in Figure 3B, PBS-44 was detected in NanoVac-loaded DCs 4 days after the incubation of DCs with NanoVac. Although the lipid peaks at 0.85 and 1.25 ppm that are representative of DCs were also observed in PBS-44, the peaks at 2 and 4.8 ppm are characteristic of galactose and vinyl protons of PBS-44, which were used as markers for the confirmation of PBS-44 in 1H-NMR.
Ex vivo imaging corroborates with IHC data
To confirm that residential DCs could take up the NanoVac and migrate to the draining LNs, another batch of NanoVac was synthesized where the encapsulation of Cy5.5 dye was included along with PBS-44 and ova (Figure 3C). After the animals (n=5) were treated with Cy5.5-conjugated NanoVac by IN inhalation route, they were sacrificed and the LNs were dissected for optical imaging in 18 hours. The data showed strong fluorescence signals in LNs that were removed from mediastinal and mesenteric regions (Figure 3D). The migration of the Cy5.5-labeled NanoVac-laden DCs in the LNs was confirmed by examining the LN tissue slide either under fluorescence microscope (Figure 3E) or by IHC staining using CD11c antibody (Figure 3F). Overall, the data clearly suggested that lung DCs are well capable of taking up inhaled NanoVac and migrate to the draining LNs of either proximal or distant regions.
NavoVac induces prolonged increase of IFN-γ secretion in vitro
Before assessing the effects of the nanovaccines in vivo, we wanted to compare NanoVac versus its soluble counterpart regarding their ability to sensitize splenocytes for cytokine release. As shown in Figure S8A, NanoVac stimulated significant production of IFN-γ, starting from 6 hours posttreatment through day 7; yet, this upward trend seemed very likely to continue for a period of time. The IFN-γ in the soluble Vac-treated cells plateaued at 48 hours and the downward trend seemed to be inevitable. In contrast, we observed the level of IL-4 continued to increase over a period of 7 days in soluble vaccine-treated cells, while a decreasing amount of IL-4 was detected in the NanoVac-treated cells (Figure S8B).
NanoVac induces the proliferation of NKT cells and production of IFN-γ
After confirming that the NanoVac was able to induce prolonged increase of IFN-γ from the splenocytes in vitro (Figures S8A and B), we assessed the proliferation and response of NKT toward NanoVac. In this in vivo cytokine study, we used similar time frame for PBS-44 as for αGalCer.29,30 Further, considering the slow release of the NanoVac, we chose 24 hours posttreatment. As shown in Figure 4A, B, the levels of IFN-γ and IL-4 in the NanoVac-treated cohort increased during the 7-day period. In contrast, cytokines in the soluble Vac-treated group decreased significantly (Figure 4A, B). To study the proliferation of NKT cells, we chose NK1.1 and CD3 as cell surface markers, as described in the literature.31–33 As shown in Figure 4C, the splenic NKT cells in the NanoVac-treated group increased by 82% from days 2 to 7. On the other hand, no proliferation of NKT levels was found in the soluble Vac-treated group in the same period of time.
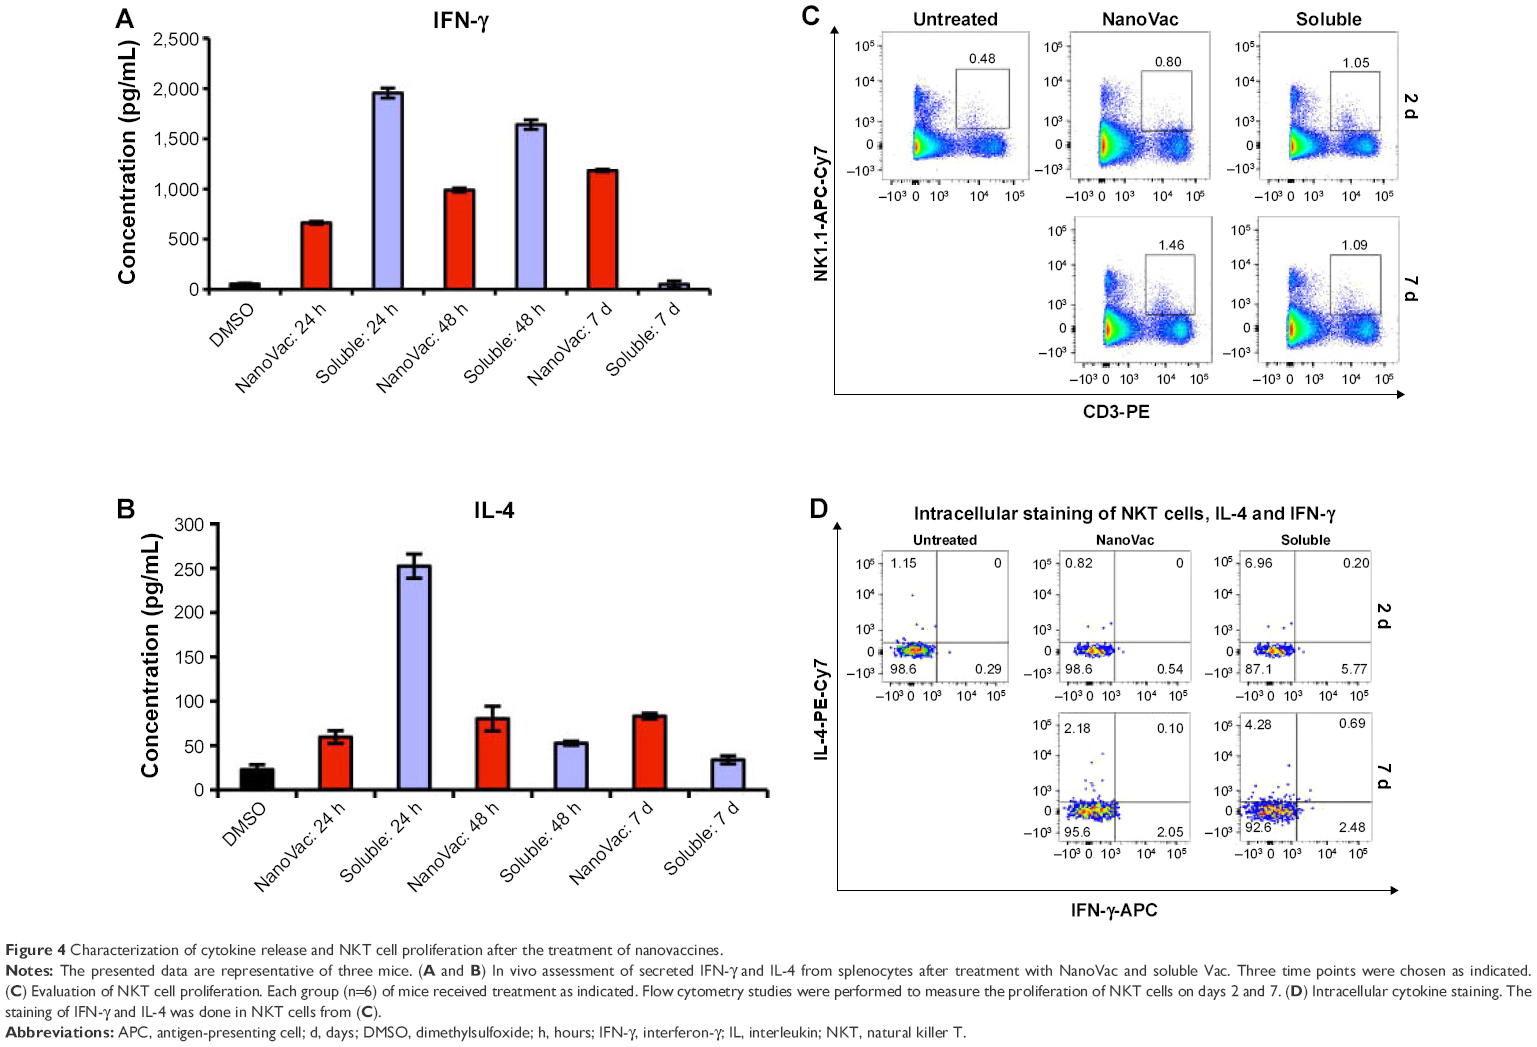 | Figure 4 Characterization of cytokine release and NKT cell proliferation after the treatment of nanovaccines. |
The intracellular cytokine staining of IFN-γ increased fourfold, while it decreased twofold from days 2 to 7 for the NanoVac and soluble Vac, respectively (Figure 4D). Similar pattern was observed for IL-4.
Administration of NanoVac by IN inhalation induces more robust antigen-specific CD8+ T cell response than that of IP injection
C57BL/6 mice are ideal for this study because the immunodominant epitope of ova (SIINFEKL) is presented to CD8+ T cells by H-2Kb MHC class I molecules on DCs.
To demonstrate the benefit of prolonged release of materials from the NanoVac, we selected late time points after priming to test antigen-specific immune response (Figure 5A). Ova-specific CD8+ T cells were quantified using the gating strategy shown in Figure 5B. As expected, we observed a significantly increased population of ova-specific CD8+ T cells at 6 weeks postpriming in mice treated with NanoVac both by IN and IP administration than in the group administered its soluble counterpart or other control groups (Figure 5C, D). The absolute ova-specific CD8+ cells were significantly higher (P<0.05) in NanoVac-treated splenocytes than in splenocytes treated with the soluble vaccine. It is noteworthy that this observation was made only when the treatments were delivered by IN route (Figure 5E) and not by IP route (Figure 5F). Furthermore, in the same trend, ova-specific CD8+ proliferation was noted in the NanoVac-treated animals at 10 weeks postpriming, but with a greater dimension (Figure 6A, B). Comparing the overall effect of NanoVac to those of OvaVac and PBS-44Vac, the synergistic effect generated by the combination of ova and PBS-44 in NanoVac was significant in the peripheral blood of either 6- or 10-week group treated by IN route and in the 6-week group treated by IP route (Figures 5C and 6A). While in splenocytes, the synergistic effect was significant only in IN route groups, but not in IP route groups (Figures 5D and 6B). Again, at 10 weeks postpriming, the absolute number of ova-specific CD8+ T cells are significantly higher (P<0.01) in NanoVac-treated group than that of soluble-treated group only found in IN route (Figure 6C) but not in the IP route (Figure 6D).Taken altogether, the NanoVac was capable of inducing a relatively high level of antigen-specific CD8+ T cells over 10 weeks after priming. How far this phenomenon can last beyond the 10-week period is yet to be determined, and such experiments may well worth to study in the future.
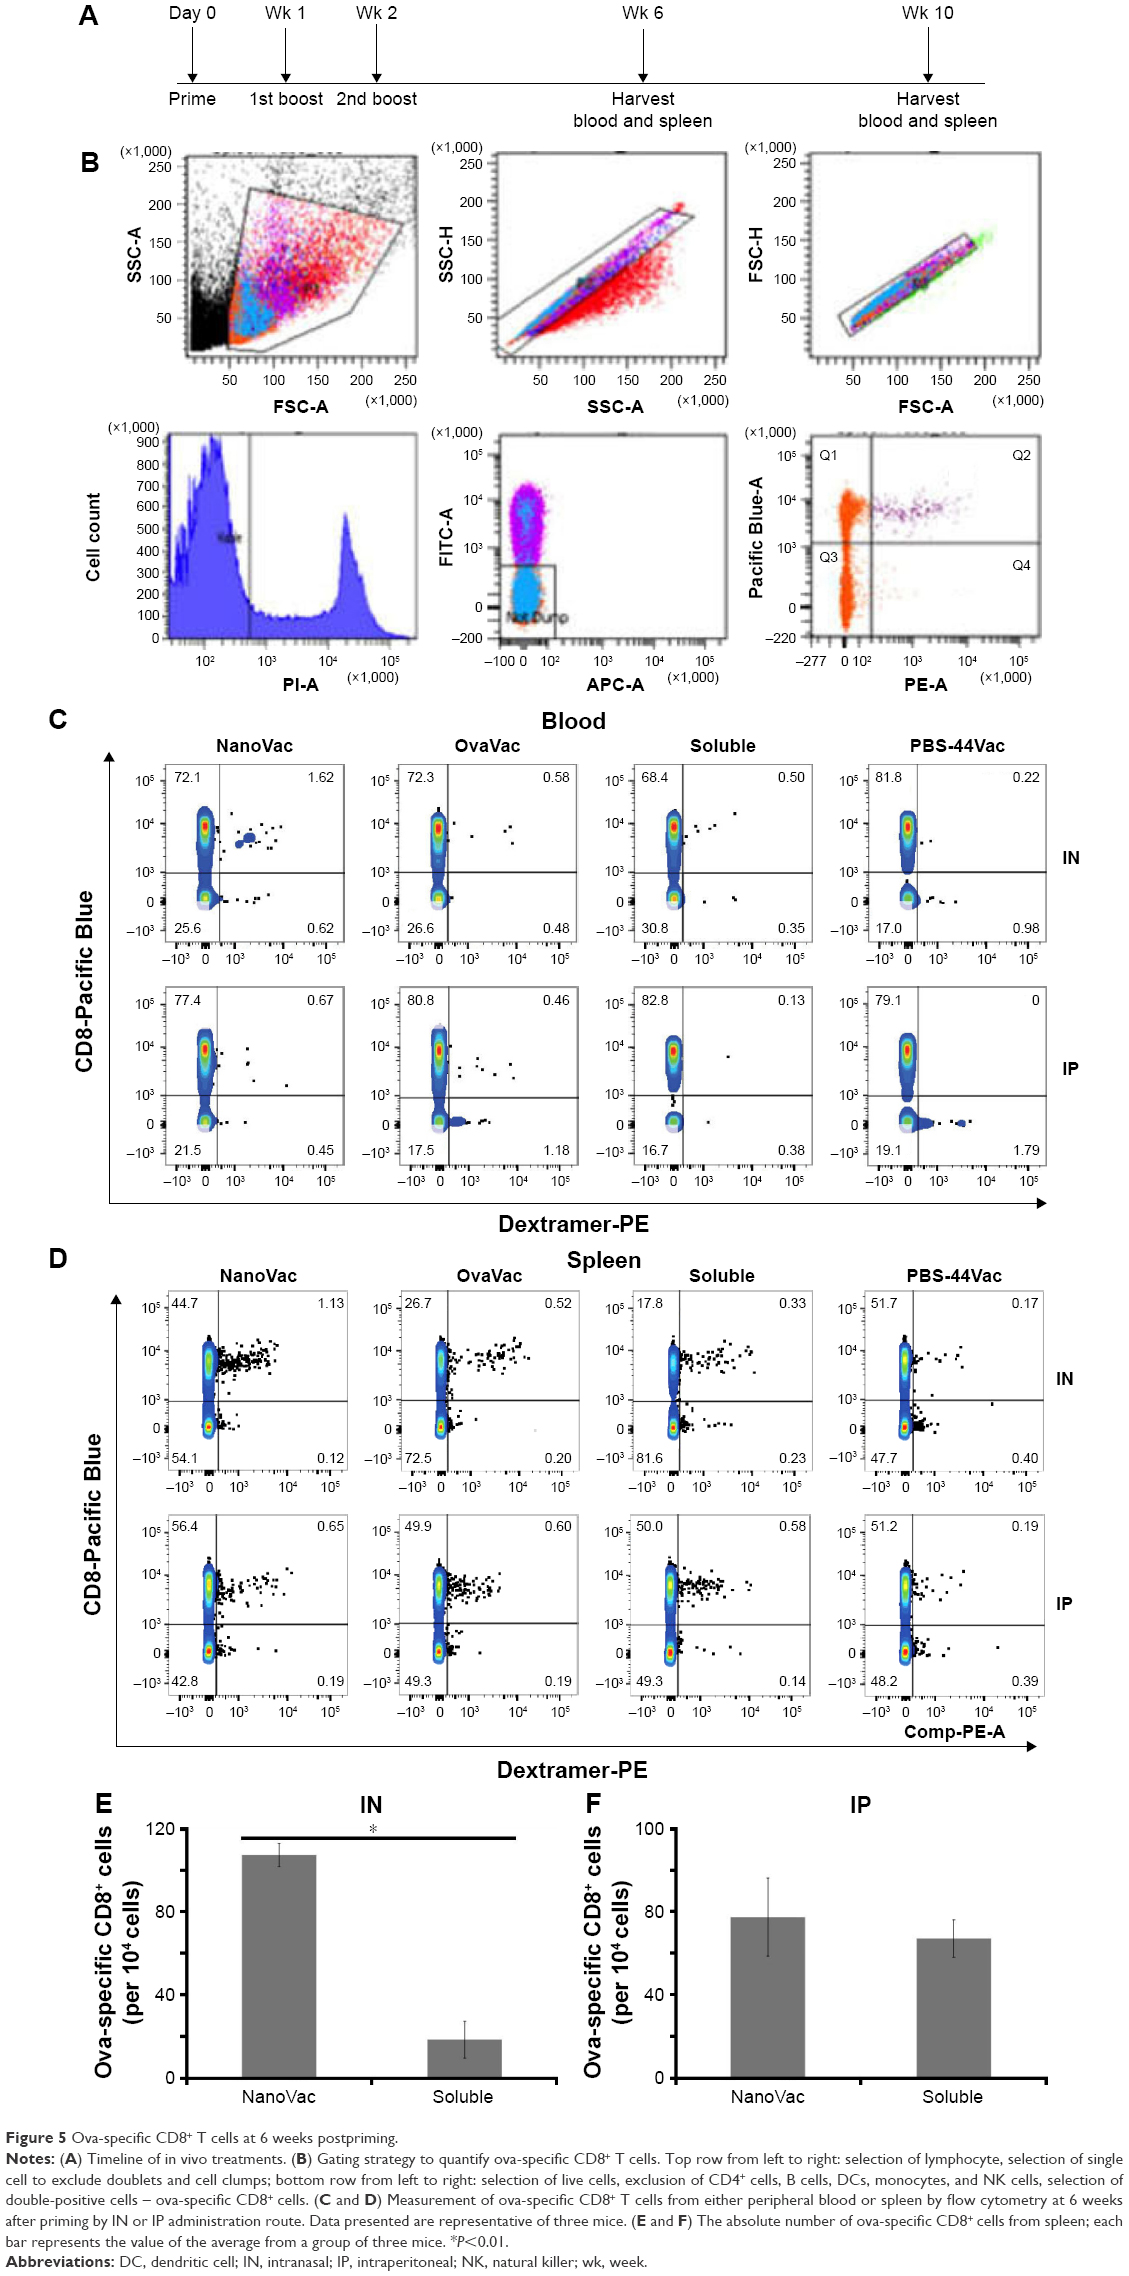 | Figure 5 Ova-specific CD8+ T cells at 6 weeks postpriming. |
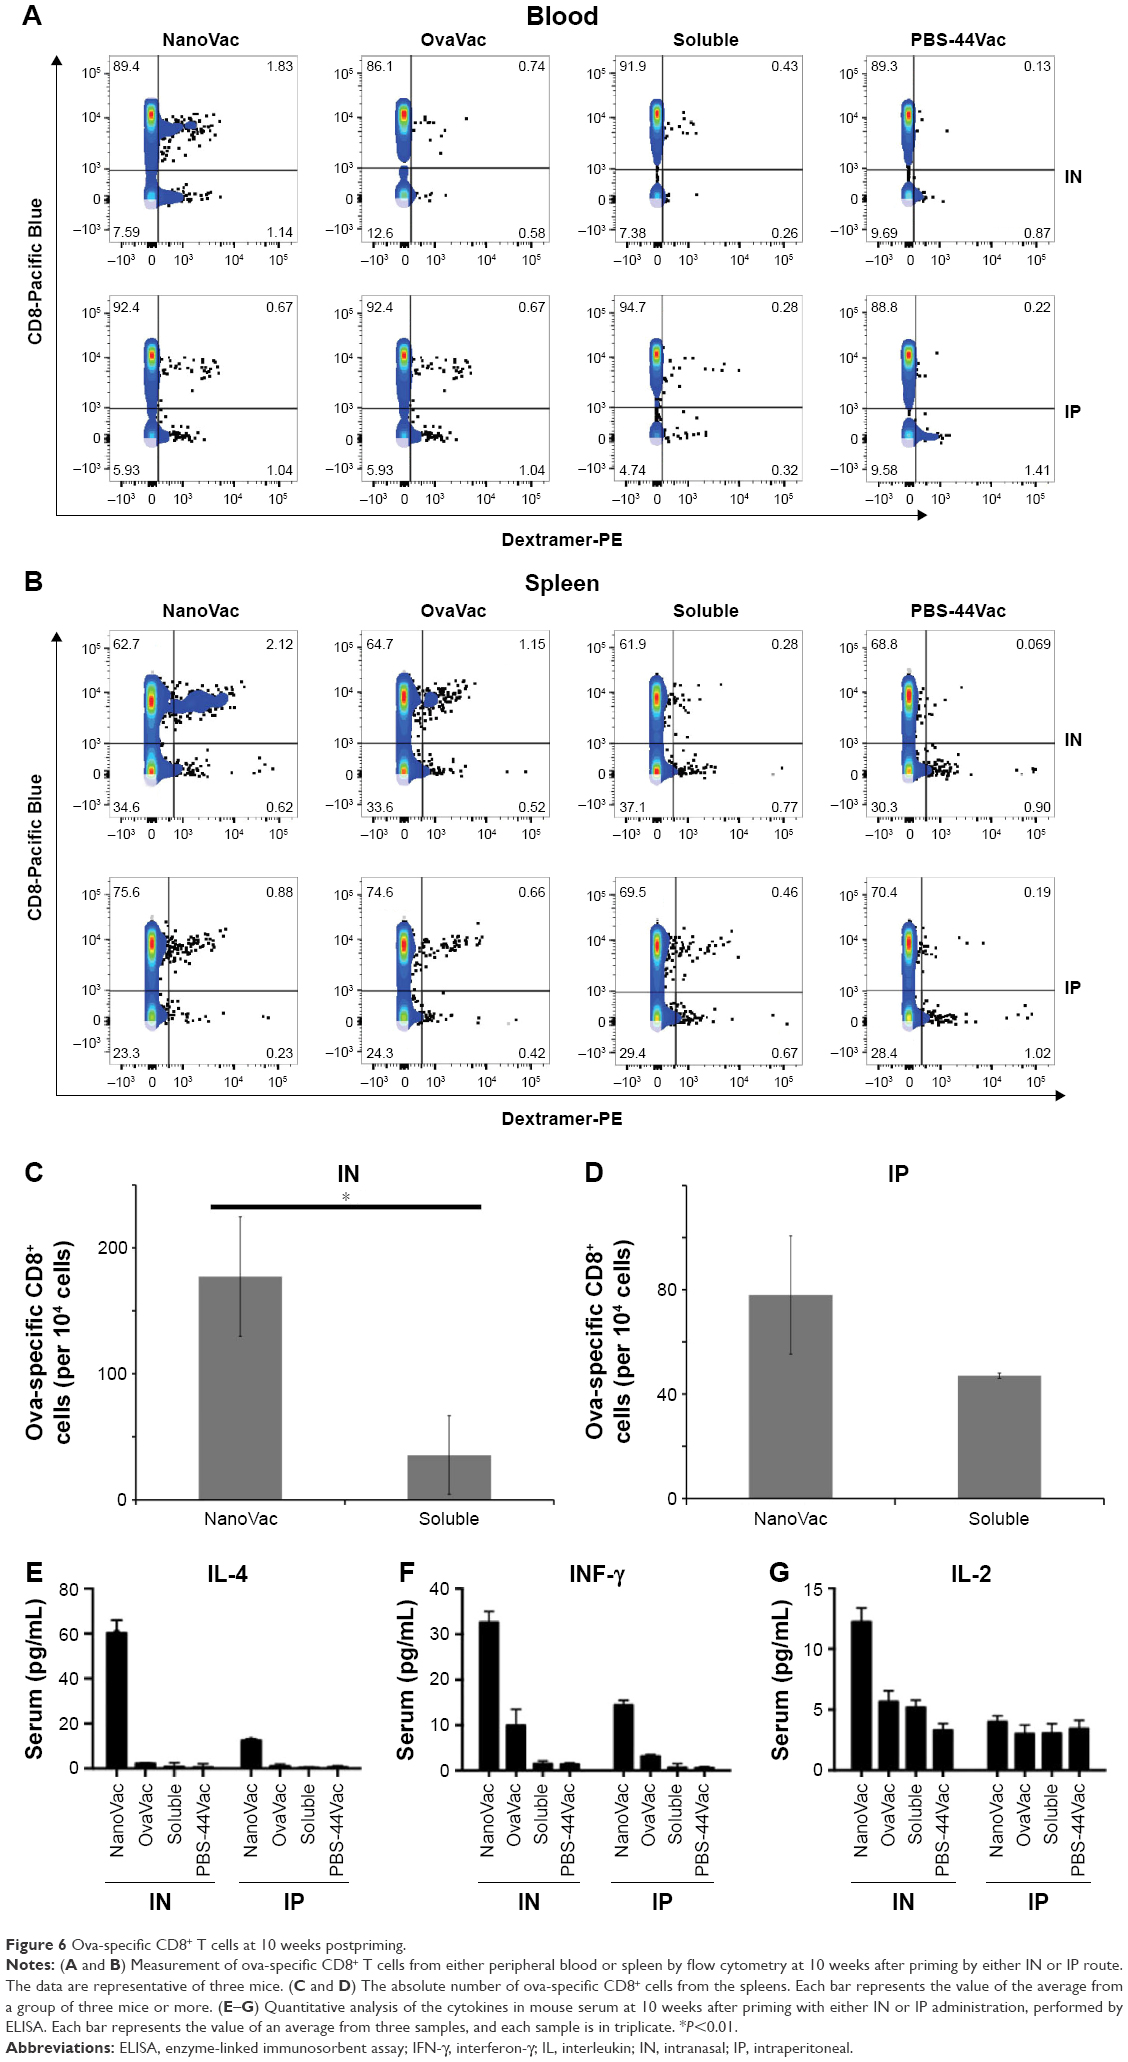 | Figure 6 Ova-specific CD8+ T cells at 10 weeks postpriming. |
Assessment of cytokine release after nanovaccine treatment
To evaluate the cytokine release pattern upon vaccination, ELISA was performed using sera collected from peripheral blood at the end point of the study set at 10 weeks postpriming. We chose to perform this assay at the late time point based on the data of our release study. Data from Figure 6E–G show that the level of IFN-γ in the NanoVac-treated group was over tenfold higher than that of the soluble group in both IN and IP cohorts (P<0.01); and the level was about twofold higher in the group treated with NanoVac by IN inhalation than in the group treated by IP injection (P<0.05). We also observed a comparatively higher level of IL-4 in the group treated with NanoVac by IN inhalation either in comparison to the soluble group by IN route (P<0.01) or the NanoVac-treated group by IP route (P<0.05). The IL-2 level was also observed to be moderately elevated in NanoVac-treated group; it was over twofold higher in the group treated with NanoVac by IN than that of either the soluble group by IN route or the NanoVac-treated group by IP route (P<0.05).
Discussion
The objective of this study was to integrate nanotechnology with adjuvant therapy to develop nanovaccines that are able to generate robust, prolonged, and antigen-specific immune responses, which will eventually lead to safe, enduring, and efficacious immunotherapy. Based on previous observations regarding preferable uptake of nanoparticles by DCs,34–36 we hypothesize that by encapsulating the antigenic components within nanoparticles, a sustained release of these components from the nanovaccines could be expected over an extended period. The advantage of this approach is that the encapsulation of vaccine components by nanotechnology is able to minimize the toxicity related to overactive immune system due to stimulation associated with vaccines delivered by a bolus dose. Furthermore, in contrast to bioconjugation approaches, no chemical modification was required to incorporate the adjuvant and antigen into nanoparticles. The controlled release of encapsulated vaccine components is particularly important for cancer immunotherapy, especially if a potent adjuvant, like PBS-44, is included. In fact, an increasing body of evidence indicates that αGalCer, whose analog is PBS-44, is a potent NKT cell agonist when presented by CD1d molecules.9,37–39 Thus, an array of cytokines, such as IFN-γ, TNF-α, IL-2, or IL-4, are released in response to αGalCer stimulation,40–43 which is believed to be responsible for their roles of action in either research or clinical studies, including their antitumor effects.44 Nevertheless, this robust immune response induced by αGalCer is also one of its major adverse effects. A number of animal and human studies have revealed that anticancer vaccines that use αGalCer as an adjuvant sometimes generate overactive immune responses.37,45
In this study, we exploited synthetic chemistry to develop a novel derivative of αGalCer, PBS-44. We achieved that outcome by modifying the length of the phytosphingosine chain, which, as expected, would further enhance the efficacy of the compound in respect to its ability to induce strong immune responses. To investigate the kinetics of the effective vaccine components released from PLGA encapsulation, we tested the rate of ova release at multiple time points by BCA assay. As shown in Figures 3A and S7, ova were released steadily and gradually over a prolonged period of time after exposure to the media at a similar physiological pH status. This release remained quite stable throughout the 25-day period, and approximately 90% of the total release was observed.
To further characterize the uptake and release of PBS-44 by DCs, the NanoVac was incubated with DCs for several days to ensure not only sufficient uptake, but also sufficient release of PBS-44 within DCs, which would enable a stable assessment of PBS-44. Using NMR spectroscopy, we detected and verified the integrity of the compound inside the cells. Notably, significant amounts of lipids were discovered within the DCs, such that the NMR signals of those endogenous lipids overlapped those from PBS-44 (Figure 3B). In addition, the alpha protons of PBS-44 were also being masked by those that came from the endogenous peptides or proteins inside the DCs. In contrast, the proton signals of PBS-44’s vinyl and galactose groups were very distinctive compared to the endogenous signals and were more suitable for identification.
During the investigation of whether the NanoVac could truly induce stronger immune response by stimulating antigen-specific cytolytic T lymphocyte proliferation compared to its soluble counterparts, we were also interested to validate the differences of treatment efficacy by utilizing various administration routes, such as IN inhalation and IP injection. One of the underlying hypotheses regarding vaccine inhalation is based on the fact that a large repertoire of DCs in the lungs is easily accessible to the agents being inhaled.46,47 Therefore, we hope that by capitalizing on the benefits of the diversity afforded by nanotechnology, copious amounts of antigens and adjuvants can be delivered to the lungs, where the residing DCs will be stimulated to induce an immune response. Delivery of the inhalable agents is simple, and it merits further examination. If the IN inhalation approach is proven to be effective, it may enable us to overcome the barriers that have thus far prevented cell therapy from becoming a safe, sound, and effective approach to cancer treatment. The data obtained from this work confirm our hypothesis that 1) PLGA nanoparticles are capable of protecting encapsulated vaccine payload and 2) owing to the characteristically controllable and sustained vaccine release pattern, the NanoVac is able to continuously provide stimuli that enables an extended, accumulative immune response to reach its potentially maximal level and stay at that level for a longer period of time. Same observations were noted when we analyzed the samples from both animal peripheral blood and spleens for antigen-specific immune response at the end of the study. We have clearly shown that the NanoVac was capable of inducing IFN-γ release in a cumulative pattern and the timing of achieving this peak level seemed far beyond that of soluble Vac, which peaked within 24 hours (Figure 4A). This observation is consistent with the published data regarding the release pattern of IFN-γ by αGalCer. We have also shown that the increased IFN-γ by NanoVac was likely to be contributed by NKT cells, which was supported by the evidence that showed an increased population of CD3+/NK1.1 cells and the corresponding intracellular cytokine levels (Figure 4C, D). Taken together, our data showed that given by IN inhalation, the NanoVac increased the level of antigen-specific CD8+ cells near threefold and fourfold in the peripheral blood at 6 and 10 weeks postpriming, respectively, compared to its soluble counterpart and the increment was above twofold between NanoVac and OvaVac groups. When given by IP injection, NanoVac generated fivefold and twofold increase in antigen-specific CD8+ T cells in the peripheral blood at 6 and 10 weeks postpriming, respectively, compared to the soluble vaccine, while no significant difference was observed when compared with OvaVac. Similar patterns of increments of antigen-specific CD8+ cells were also observed in the splenocytes of the same corresponding study groups. Furthermore, when we made a direct comparison in terms of the differences of ova-specific CD8+ T cells between cohorts of animals treated with IN inhalation and IP injection, we found that IN inhalation was able to generate an increment of over twofold than IP injection in NanoVac-treated groups. This phenomenon clearly indicated that IN inhalation is a better approach to deliver the nanovaccine than IP injection.
In summary, we demonstrated in this study that PLGA encapsulation is well capable of achieving a controllable and sustained release of its core content, and also is protective of its core content from rapid degradation. We also showed for the first time that the NanoVac is highly efficient in inducing a vigorous, prolonged antigen-specific immune response; particularly, PBS-44 further enhances the action of NanoVac. Our study revealed the tremendous potential that nanotechnology represents in medical research and the promising outlook for further clinical applications.
Acknowledgments
The authors appreciate Dr Pavlo Gilchuk for the technical support during the course of the work. This work was partially funded by a grant from NIH, RO1CA16700 (WP), RO1AI042284 (SJ), the National Center for Research Resources, UL1 RR024975-01, which is now the National Center for Advancing Translational Sciences, 2UL1 TR000445-06, under the VICTR CTSA grant, and the Vanderbilt-Ingram Cancer Center Thoracic Program Initiative, all funded to WP. It was also partially supported by a VA Merit Award BX001444 (SJ). The authors would like to thank VMC Flow Cytometry Shared Resource for performing the flow cytometry experiments, which was supported by the Vanderbilt Ingram Cancer Center (P30 CA68485) and the Vanderbilt Digestive Disease Research Center (DK058404).
Disclosure
The authors report no conflicts of interest in this work.
References
Schumacher TN, Schreiber RD. Neoantigens in cancer immunotherapy. Science. 2015;348(6230):69–74. | ||
Sharma P, Allison JP. The future of immune checkpoint therapy. Science. 2015;348(6230):56–61. | ||
Albert ML, Sauter B, Bhardwaj N. Dendritic cells acquire antigen from apoptotic cells and induce class I-restricted CTLs. Nature. 1998;392(6671):86–89. | ||
Bellone M, Iezzi G, Rovere P, et al. Processing of engulfed apoptotic bodies yields T cell epitopes. J Immunol. 1997;159(11):5391–5399. | ||
Moody DB, Briken V, Cheng TY, et al. Lipid length controls antigen entry into endosomal and nonendosomal pathways for CD1b presentation. Nat Immunol. 2002;3(5):435–442. | ||
Pham W, Kobukai S, Hotta C, Gore JC. Dendritic cells: therapy and imaging. Expert Opin Biol Ther. 2009;9(5):539–564. | ||
Cruz LJ, Tacken PJ, Rueda F, Domingo JC, Albericio F, Figdor CG. Targeting nanoparticles to dendritic cells for immunotherapy. Methods Enzymol. 2012;509:143–163. | ||
Kobukai S, Kremers GJ, Cobb JG, et al. Induction of antitumor immunity by dendritic cells loaded with MPA11P-conjugated mucin-1 peptide antigen. Transl Oncol. 2011;4(1):1–8. | ||
Chen S, Ndhlovu LC, Takahashi T, et al. Co-inhibitory roles for glucocorticoid-induced TNF receptor in CD1d-dependent natural killer T cells. Eur J Immunol. 2008;38(8):2229–2240. | ||
Didierlaurent AM, Collignon C, Bourguignon P, et al. Enhancement of adaptive immunity by the human vaccine adjuvant AS01 depends on activated dendritic cells. J Immunol. 2014;193(4):1920–1930. | ||
Dupuis M, Murphy TJ, Higgins D, et al. Dendritic cells internalize vaccine adjuvant after intramuscular injection. Cell Immunol. 1998;186(1):18–27. | ||
Gungor B, Yagci FC, Tincer G, et al. CpG ODN nanorings induce IFNalpha from plasmacytoid dendritic cells and demonstrate potent vaccine adjuvant activity. Sci Transl Med. 2014;6(235):235ra61. | ||
Shah JA, Darrah PA, Ambrozak DR, et al. Dendritic cells are responsible for the capacity of CpG oligodeoxynucleotides to act as an adjuvant for protective vaccine immunity against Leishmania major in mice. J Exp Med. 2003;198(2):281–291. | ||
Bachmann MF, Jennings GT. Vaccine delivery: a matter of size, geometry, kinetics and molecular patterns. Nat Rev Immunol. 2010;10(11):787–796. | ||
Macho-Fernandez E, Cruz LJ, Ghinnagow R, et al. Targeted delivery of alpha-galactosylceramide to CD8alpha+ dendritic cells optimizes type I NKT cell-based antitumor responses. J Immunol. 2014;193(2):961–969. | ||
Goff RD, Gao Y, Mattner J, et al. Effects of lipid chain lengths in alpha-galactosylceramides on cytokine release by natural killer T cells. J Am Chem Soc. 2004;126(42):13602–13603. | ||
Bendelac A, Savage PB, Teyton L. The biology of NKT cells. Annu Rev Immunol. 2007;25:297–336. | ||
Bai L, Sagiv Y, Liu Y, et al. Lysosomal recycling terminates CD1d-mediated presentation of short and polyunsaturated variants of the NKT cell lipid antigen alphaGalCer. Proc Natl Acad Sci U S A. 2009;106(25):10254–10259. | ||
Chang DH, Osman K, Connolly J, et al. Sustained expansion of NKT cells and antigen-specific T cells after injection of alpha-galactosyl-ceramide loaded mature dendritic cells in cancer patients. J Exp Med. 2005;201(9):1503–1517. | ||
Im JS, Arora P, Bricard G, et al. Kinetics and cellular site of glycolipid loading control the outcome of natural killer T cell activation. Immunity. 2009;30(6):888–898. | ||
Kunii N, Horiguchi S, Motohashi S, et al. Combination therapy of in vitro-expanded natural killer T cells and alpha-galactosylceramide-pulsed antigen-presenting cells in patients with recurrent head and neck carcinoma. Cancer Sci. 2009;100(6):1092–1098. | ||
Zhu G, Mallery SR, Schwendeman SP. Stabilization of proteins encapsulated in injectable poly(lactide-co-glycolide). Nat Biotechnol. 2000;18(1):52–57. | ||
Kirby GT, White LJ, Rahman CV, et al. PLGA-based micropartilcles for the sustained release of BMP-2. Polymers. 2011;3(1):571–586. | ||
Morita T, Horikiri Y, Suzuki T, Yoshino H. Applicability of various amphiphilic polymers to the modification of protein release kinetics from biodegradable reservoir-type microspheres. Eur J Pharm Biopharm. 2001;51(1):45–53. | ||
Kobukai S, Baheza R, Cobb JG, et al. Magnetic nanoparticles for imaging dendritic cells. Magn Reson Med. 2010;63(5):1383–1390. | ||
Toki S, Omary RA, Wilson K, Gore JC, Peebles RS Jr, Pham W. A comprehensive analysis of transfection-assisted delivery of iron oxide nanoparticles to dendritic cells. Nanomedicine. 2013;9(8):1235–1244. | ||
Badovinac VP, Harty JT. Intracellular staining for TNF and IFN-g detects different frequencies of antigen-specific CD8 T cells. J Immunol Methods. 2000;238(1–2):107–117. | ||
Papadogiannakis EI, Kontos VI, Tamamidou M, Roumeliotou A. Determination of intracellular cytokines IFN-gamma and IL-4 in canine T lymphocytes by flow cytometry following whole-blood culture. Can J Vet Res. 2009;73(2):137–143. | ||
Tashiro T, Sekine-Kondo E, Shigeura T, et al. Induction of Th1-biased cytokine production by alpha-carba-GalCer, a neoglycolipid ligand for NKT cells. Int Immunol. 2010;22(4):319–328. | ||
Van Kaer L. Alpha-Galactosylceramide therapy for autoimmune diseases: prospects and obstacles. Nat Rev Immunol. 2005;5(1):31–42. | ||
Chang YJ, Huang JR, Tsai YC, et al. Potent immune-modulating and anticancer effects of NKT cell stimulatory glycolipids. Proc Natl Acad Sci U S A. 2007;104(25):10299–10304. | ||
Shimamoto M, Ueno Y, Tanaka S, et al. Selective decrease in colonic CD56(+) T and CD161(+) T cells in the inflamed mucosa of patients with ulcerative colitis. World J Gastroenterol. 2007;13(45):5995–6002. | ||
Yu J, Mitsui T, Wei M, et al. NKp46 identifies an NKT cell subset susceptible to leukemic transformation in mouse and human. J Clin Invest. 2011;121(4):1456–1470. | ||
Cruz LJ, Tacken PJ, Fokkink R, et al. Targeted PLGA nano- but not microparticles specifically deliver antigen to human dendritic cells via DC-SIGN in vitro. J Control Release. 2010;144(2):118–126. | ||
Ghotbi Z, Haddadi A, Hamdy S, Hung RW, Samuel J, Lavasanifar A. Active targeting of dendritic cells with mannan-decorated PLGA nanoparticles. J Drug Target. 2011;19(4):281–292. | ||
Waeckerle-Men Y, Groettrup M. PLGA microspheres for improved antigen delivery to dendritic cells as cellular vaccines. Adv Drug Deliv Rev. 2005;57(3):475–482. | ||
Fais F, Morabito F, Stelitano C, et al. CD1d is expressed on B-chronic lymphocytic leukemia cells and mediates alpha-galactosylceramide presentation to natural killer T lymphocytes. Int J Cancer. 2004;109(3):402–411. | ||
Metelitsa LS, Weinberg KI, Emanuel PD, Seeger RC. Expression of CD1d by myelomonocytic leukemias provides a target for cytotoxic NKT cells. Leukemia. 2003;17(6):1068–1077. | ||
Im JS, Tapinos N, Chae GT, et al. Expression of CD1d molecules by human schwann cells and potential interactions with immunoregulatory invariant NKT cells. J Immunol. 2006;177(8):5226–5235. | ||
Furlan R, Bergami A, Cantarella D, et al. Activation of invariant NKT cells by alphaGalCer administration protects mice from MOG35-55-induced EAE: critical roles for administration route and IFN-gamma. Eur J Immunol. 2003;33(7):1830–1838. | ||
Ishikawa E, Motohashi S, Ishikawa A, et al. Dendritic cell maturation by CD11c- T cells and Valpha24+ natural killer T-cell activation by alpha-galactosylceramide. Int J Cancer. 2005;117(2):265–273. | ||
Lu X, Song L, Metelitsa LS, Bittman R. Synthesis and evaluation of an alpha-C-galactosylceramide analogue that induces Th1-biased responses in human natural killer T cells. Chembiochem. 2006;7(11):1750–1756. | ||
Ortaldo JR, Young HA, Winkler-Pickett RT, Bere EW Jr, Murphy WJ, Wiltrout RH. Dissociation of NKT stimulation, cytokine induction, and NK activation in vivo by the use of distinct TCR-binding ceramides. J Immunol. 2004;172(2):943–953. | ||
Morita M, Motoki K, Akimoto K, et al. Structure-activity relationship of alpha-galactosylceramides against B16-bearing mice. J Med Chem. 1995;38(12):2176–2187. | ||
Biburger M, Tiegs G. Alpha-galactosylceramide-induced liver injury in mice is mediated by TNF-alpha but independent of Kupffer cells. J Immunol. 2005;175(3):1540–1550. | ||
Gonzalez-Juarrero M, Orme IM. Characterization of murine lung dendritic cells infected with Mycobacterium tuberculosis. Infect Immun. 2001;69(2):1127–1133. | ||
Marchal-Somme J, Uzunhan Y, Marchand-Adam S, et al. Dendritic cells accumulate in human fibrotic interstitial lung disease. Am J Respir Crit Care Med. 2007;176(10):1007–1014. |
Supplementary materials
Characterization data for PBS-44 molecule
Proton and 13C-nuclear magnetic resonance (NMR) of PBS-44
1H-NMR (500 MHz, CDCl3) δ 7.42 (d, J=8.5 Hz, 1H), 5.35 (t, J=4.5 Hz, 2H), 4.91 (d, J=3.5 Hz, 2H), 4.19 (q, J=4.5 Hz, 2H), 3.94 (d, J=3 Hz, 1H), 3.89 (d, J=3 Hz, 3H), 3.87 (t, J=4.5 Hz, 1H), 3.8–3.6 (m, 6H), 3.6–3.5 (m, 1H), 3.38 (m, 1H), 2.2 (t, 6 Hz, 2H), 2.1 (q, J=4.5 Hz, 8H), 1.6 (m, 8H), 1.3 (m, 44H), 0.9 (t, J=6 Hz, 6H); 13C-NMR (CDCl3, 500 MHz) δ 174.86, 130.17, 100.05, 77.69, 77.43, 74.96, 72.33, 71.14, 70.59, 70.09, 69.25, 67.70, 62.14, 50.78, 49.52, 49.35, 49.17, 49.02, 48.85, 36.78, 32.75, 32.23, 32.21, 30.05, 29.80, 29.59, 27.48, 27.46, 26.20, 26.18, 22.96, 22.95, 14.23; ESI-MS calcd. (M+H)+ (C48H93NO9) 828.6850, found 828.6955 and (M+Na)+ 850.6756.
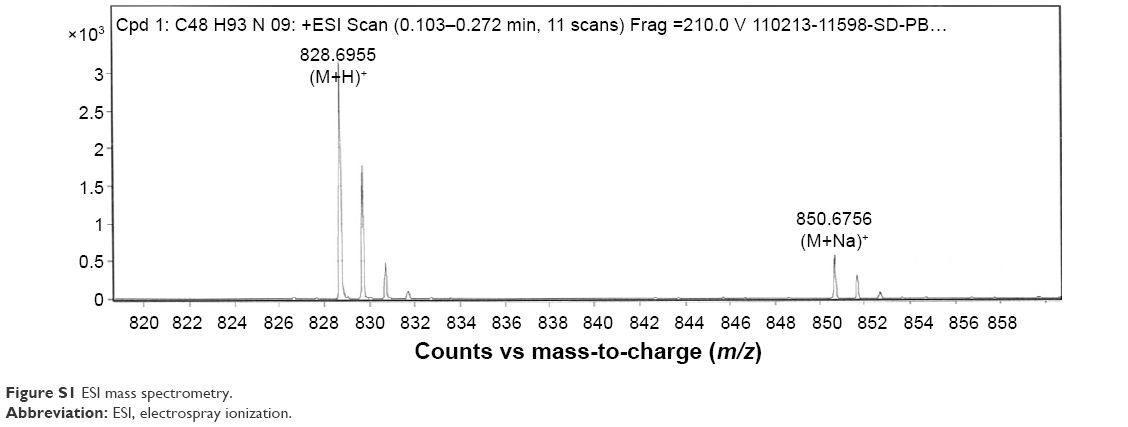 | Figure S1 ESI mass spectrometry. |
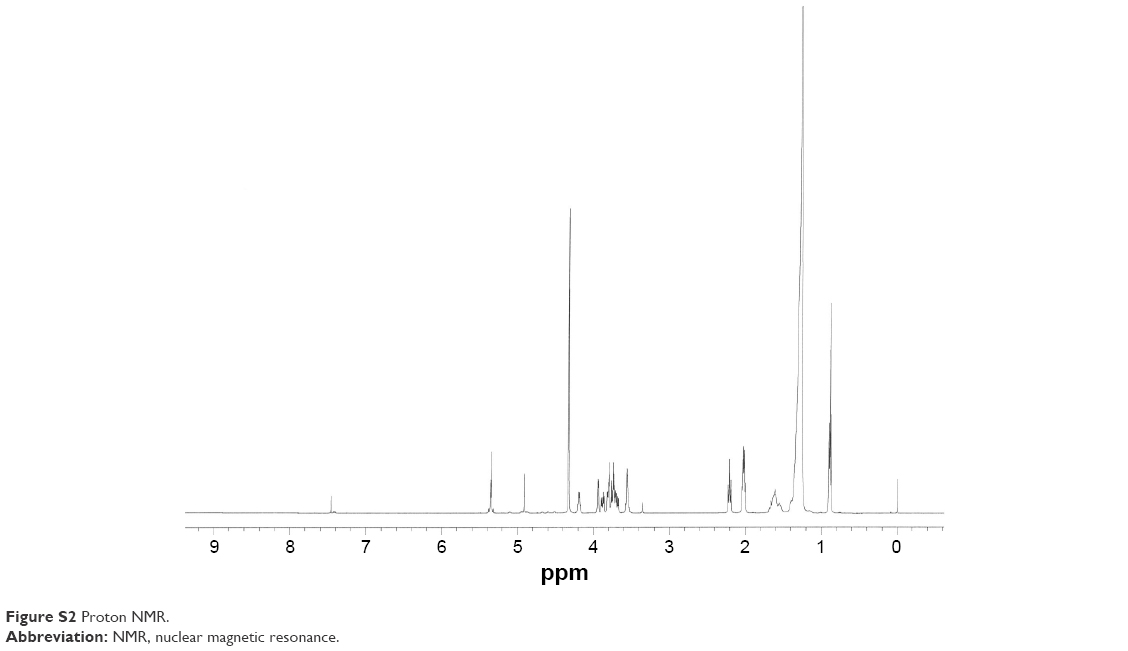 | Figure S2 Proton NMR. |
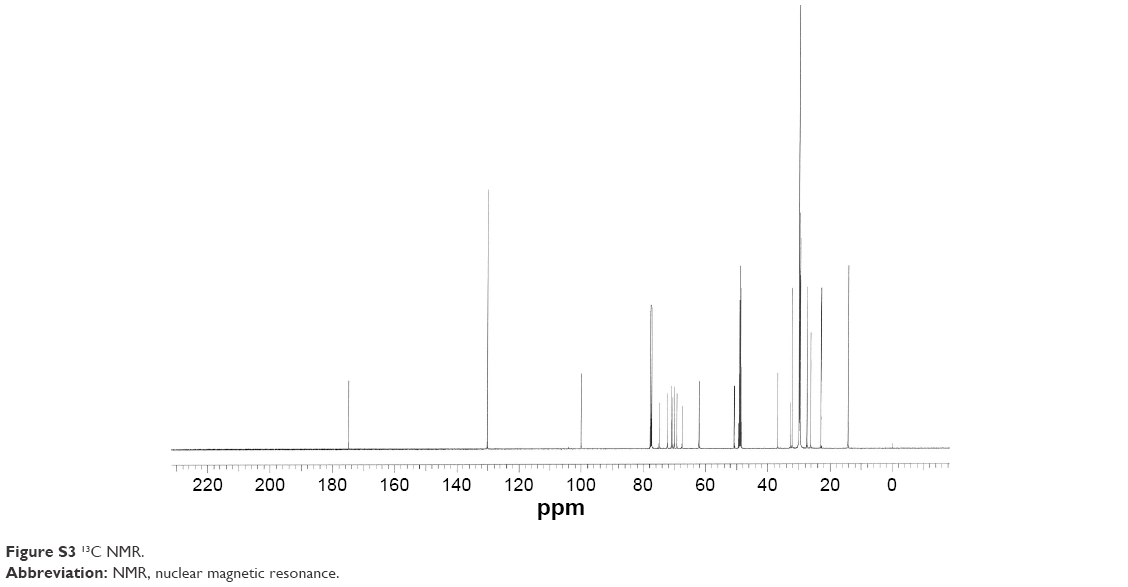 | Figure S3 13C NMR. |
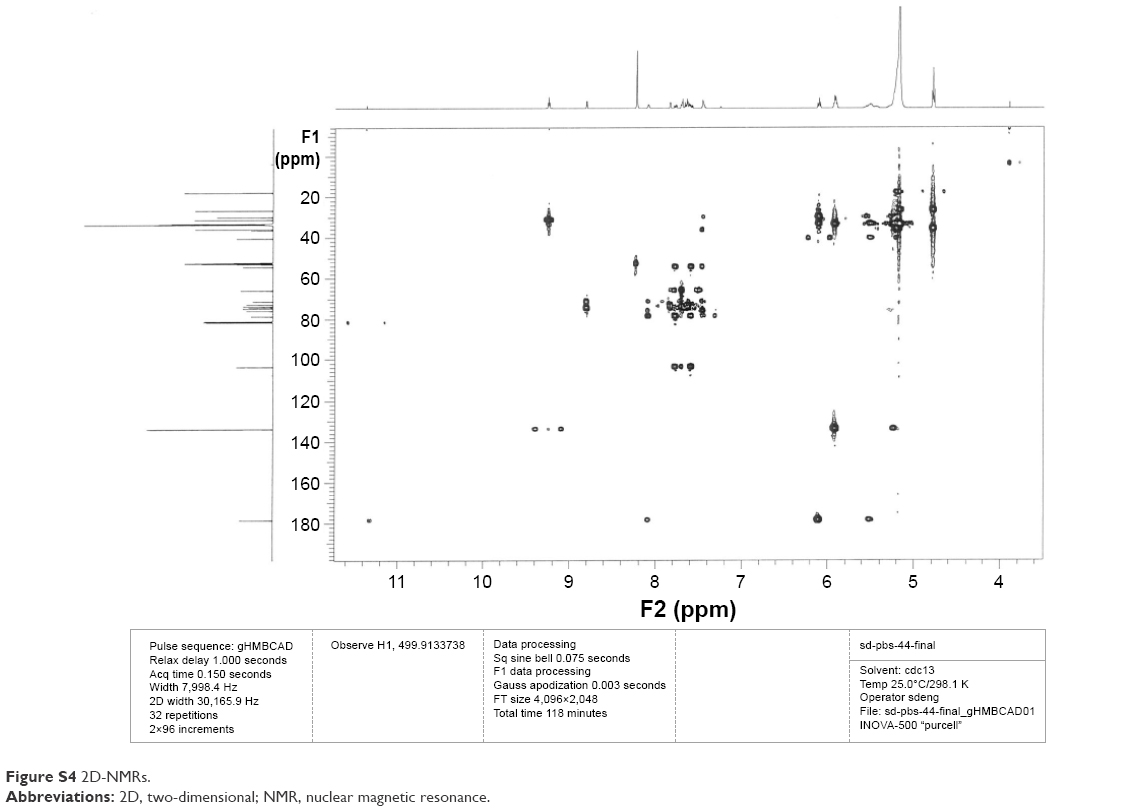 | Figure S4 2D-NMRs. |
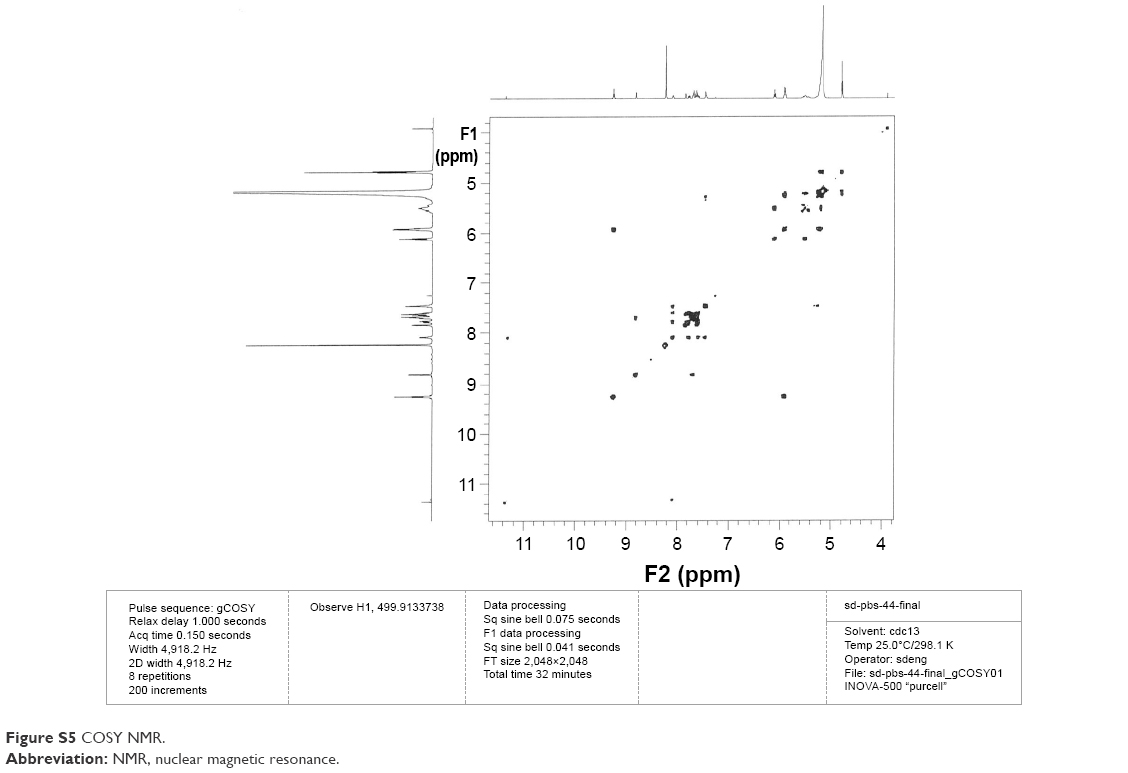 | Figure S5 COSY NMR. |
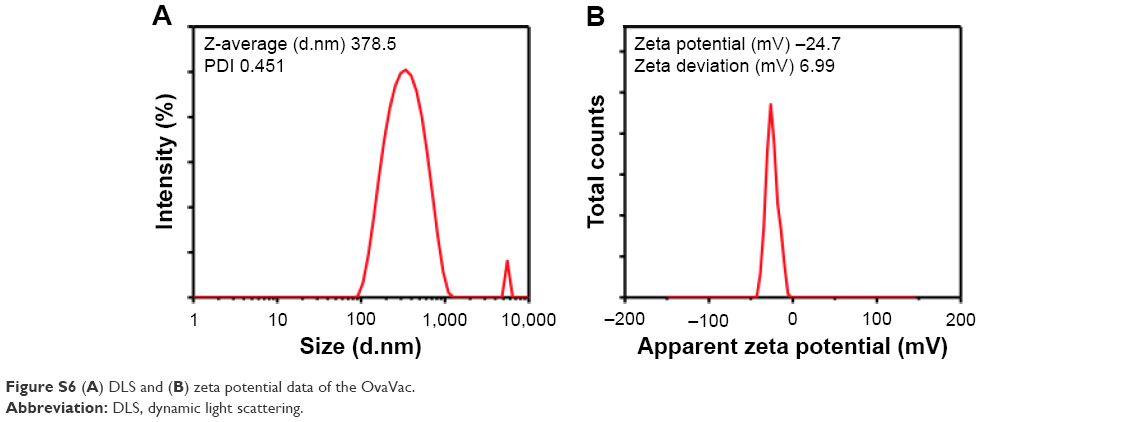 | Figure S6 (A) DLS and (B) zeta potential data of the OvaVac. |
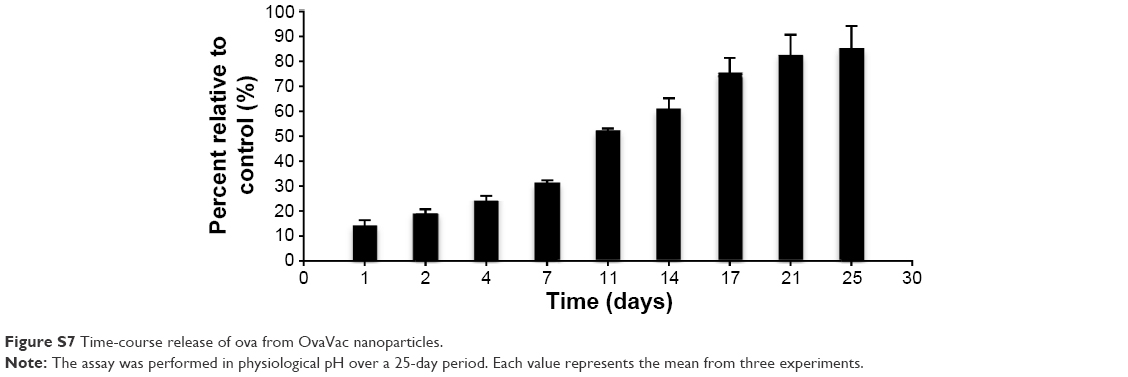 | Figure S7 Time-course release of ova from OvaVac nanoparticles. |
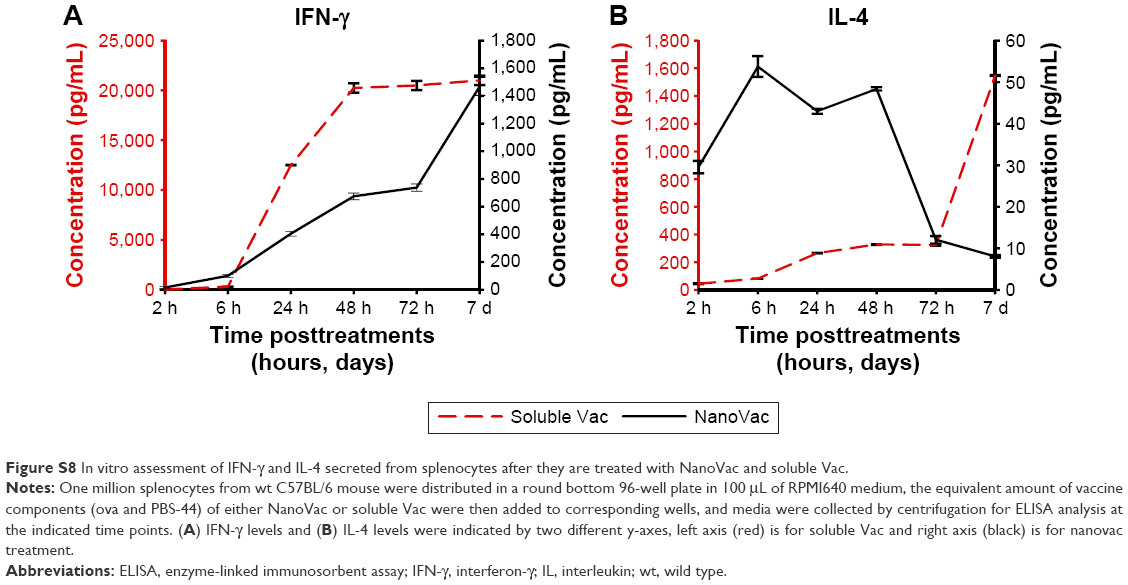 | Figure S8 In vitro assessment of IFN-γ and IL-4 secreted from splenocytes after they are treated with NanoVac and soluble Vac. |
 © 2016 The Author(s). This work is published and licensed by Dove Medical Press Limited. The full terms of this license are available at https://www.dovepress.com/terms.php and incorporate the Creative Commons Attribution - Non Commercial (unported, v3.0) License.
By accessing the work you hereby accept the Terms. Non-commercial uses of the work are permitted without any further permission from Dove Medical Press Limited, provided the work is properly attributed. For permission for commercial use of this work, please see paragraphs 4.2 and 5 of our Terms.
© 2016 The Author(s). This work is published and licensed by Dove Medical Press Limited. The full terms of this license are available at https://www.dovepress.com/terms.php and incorporate the Creative Commons Attribution - Non Commercial (unported, v3.0) License.
By accessing the work you hereby accept the Terms. Non-commercial uses of the work are permitted without any further permission from Dove Medical Press Limited, provided the work is properly attributed. For permission for commercial use of this work, please see paragraphs 4.2 and 5 of our Terms.