")
Back to Journals » Cancer Management and Research » Volume 11
Importance of gene expression signatures in pancreatic cancer prognosis and the establishment of a prediction model
Authors Yan XK, Wan HF, Hao XY, Lan T , Li W , Xu L, Yuan KF , Wu H
Received 24 August 2018
Accepted for publication 9 November 2018
Published 27 December 2018 Volume 2019:11 Pages 273—283
DOI https://doi.org/10.2147/CMAR.S185205
Checked for plagiarism Yes
Review by Single anonymous peer review
Peer reviewer comments 3
Editor who approved publication: Professor Harikrishna Nakshatri
Xiaokai Yan,1,* Haifeng Wan,1 Xiangyong Hao,2 Tian Lan,1 Wei Li,1 Lin Xu,1,3 Kefei Yuan,1,3,* Hong Wu1,3
1Department of Liver Surgery and Liver Transplantation, West China Hospital, Sichuan University, Chengdu, China; 2Department of General Surgery, Gansu Provincial Hospital, Lanzhou 730000, Gansu Province, China; 3Laboratory of Liver Surgery, West China Hospital, Sichuan University, Chengdu, China
*These authors contributed equally to this work
Background and aim: Pancreatic cancer (PC) is one of the most common tumors with a poor prognosis. The current American Joint Committee on Cancer (AJCC) staging system, based on the anatomical features of tumors, is insufficient to predict PC outcomes. The current study is endeavored to identify important prognosis-related genes and build an effective predictive model.
Methods: Multiple public datasets were used to identify differentially expressed genes (DEGs) and survival-related genes (SRGs). Bioinformatics analysis of DEGs was used to identify the main biological processes and pathways involved in PC. A risk score based on SRGs was computed through a univariate Cox regression analysis. The performance of the risk score in predicting PC prognosis was evaluated with survival analysis, Harrell’s concordance index (C-index), area under the curve (AUC), and calibration plots. A predictive nomogram was built through integrating the risk score with clinicopathological information.
Results: A total of 945 DEGs were identified in five Gene Expression Omnibus datasets, and four SRGs (LYRM1, KNTC1, IGF2BP2, and CDC6) were significantly associated with PC progression and prognosis in four datasets. The risk score showed relatively good performance in predicting prognosis in multiple datasets. The predictive nomogram had greater C-index and AUC values, compared with those of the AJCC stage and risk score.
Conclusion: This study identified four new biomarkers that are significantly associated with the carcinogenesis, progression, and prognosis of PC, which may be helpful in studying the underlying mechanism of PC carcinogenesis. The predictive nomogram showed robust performance in predicting PC prognosis. Therefore, the current model may provide an effective and reliable guide for prognosis assessment and treatment decision-making in the clinic.
Keywords: risk score, nomogram, TCGA, GEO
Introduction
Pancreatic cancer (PC), as one of the most common tumors, is the leading cause of cancer-related death worldwide and has a very poor prognosis.1 Currently, the American Joint Committee on Cancer (AJCC) staging system remains the most widely used predictive model for PC. The system was designed to provide a guide for prognosis assessment and therapeutic decisions.2 However, the AJCC staging system was constructed to assess only the three basic indicators of anatomic spread (including the extent of the tumor, the extent of spread to the lymph nodes, and the presence of metastasis) and is unable to comprehensively elucidate tumor behaviors.3 In fact, PC patients with the same AJCC stage may have different clinical prognosis after receiving the same treatments. Therefore, the current predictive system is not sufficient to predict the outcomes of patients with PC, and refinement is necessary.
Over the past few decades, great efforts have been made to identify the molecular markers of cancer. The importance of gene signatures in the initiation, progression, and prognosis of tumors has been shown in many studies.4–11 Thousands of genes can be studied simultaneously with the use of next-generation sequencing and novel microarray technologies, facilitating the investigation of the interaction between gene signatures and tumors.12,13 Therefore, an increasing number of researchers are interested in using gene signatures for the risk stratification of patients.14
To the best of our knowledge, to date, only two studies have used gene expression signatures to build predictive models for PC.15,16 Both the studies assessed the power of their prognostic models in a single dataset, and none of these models was constructed based on both clinicopathological factors and gene signatures. In the current study, we endeavored to identify important prognosis-related genes through a multi-dataset analysis, and built composite predictive models for PC that are more applicable in guiding prognostic assessments and treatment decision-making.
Materials and methods
Gene Expression Omnibus (GEO) datasets
We searched and downloaded mRNA expression profiling data series concerning PC from the GEO (https://www.ncbi.nlm.nih.gov/geo/) using the following keywords: “pancreatic cancer” and “pancreatic ductal adenocarcinoma.” The “Organism” parameter was limited to “Homo sapiens,” and the “study type” parameter was set to “Expression profiling by array.” Ineligible studies were excluded using the following criteria: 1) studies with less than 15 PC samples or non-tumor pancreatic samples; 2) studies using only PC cell lines or xenografts; 3) studies analyzing only blood samples or tumor samples; and 4) studies analyzing only pancreatic endocrine tumors. Finally, five PC datasets (GSE15471, GSE16515, GSE28735, GSE62452, and GSE71729) were selected for further analysis. Probes were matched with the gene names in accordance with the annotation file provided by the manufacturer. If multiple probes matched a single gene, probes were integrated by using the arithmetic mean to account for the expression level of a single gene. The expression data were log2 transformed.
The Genome Cancer Atlas (TCGA) TCGA dataset
Transcriptome data (fragments per kilo-base of exon per million fragments) and the corresponding PC clinical information were obtained from TCGA (https://cancergenome.nih.gov/). After removing patients who died within 3 months and patients without gene expression information, 172 patients with corresponding survival information were retained. Genes expressed in over 80% of samples were retained, and the zero values in the expression matrix were replaced with the minimum non-zero value of the corresponding gene. Then the expression data were log2 transformed.
Identification of differentially expressed genes (DEGs) and bio-information analysis
A Significant Analysis of Microarrays (SAM) algorithm was used to identify genes that were differentially expressed between tumor and non-tumor samples via BRB-Array Tools (https://linus.nci.nih.gov/BRB-ArrayTools). A false discovery rate of <0.005 was set as the cutoff criterion.17 DEGs (including downregulated and upregulated genes) in the five GEO datasets were selected through overlapping analysis, and then functional annotation and pathway enrichment analyses were performed using DAVID software (https://david.ncifcrf.gov/). A protein–protein interaction (PPI) network was established for DEGs using Search Tool for the Retrieval of Interacting Genes (https://string-db.org/) and visualized using Cytoscape 3.6.0.
Identification of potential prognostic genes
The expression values of DEGs in the GSE28735, GSE62452, GSE71729, and TCGA datasets were analyzed through a univariate Cox proportional hazard regression model. Genes significantly associated with overall survival (OS) in all these datasets were identified as survival-related genes (SRGs), and a P-value <0.05 was set as the cutoff criterion. Correlation analyses and survival analyses were performed to assess the importance of SRGs in PC progression and prognosis.
A risk score for each dataset was computed through the summation of the gene expression value multiplied by the corresponding coeffcient from a univariate Cox regression model (TCGA dataset as a training cohort for risk score, and the other GEO datasets as external validation cohorts). The performance of the risk score in predicting OS was evaluated through a survival analysis, Harrell’s concordance index (C-index),18 area under the curve (AUC) of the receiver operating characteristic (ROC) curve,19 and a calibration plot comparing predicted vs observed Kaplan–Meier estimates of survival probability.20
Development, comparison, and validation of predictive nomogram
In the TCGA dataset, a predictive nomogram was built on the basis of risk score and clinicopathological information using a backward stepwise Cox proportional hazard model.21 The calibration ability of the nomogram was assessed using a calibration plot comparing nomogram-predicted vs observed Kaplan–Meier estimates of survival probability, using 1,000 bootstrap resamples.20 We compared the discriminative ability of the nomogram with that of the AJCC stage through the C-index and AUC.18 In addition, based on the total point in the nomogram, patients were stratified into three subgroups in the TCGA dataset, including a low-risk group (total point <33.3%), a medium-risk group (total point between 33.3% and 66.6%), and a high-risk group (total point >66.6%), and survival curves for these subgroups were estimated using the Kaplan–Meier method.
Statistical analysis
SAM analysis was performed using BRB-Array Tools. All other statistical analyses were completed using R (https://www.r-project.org/, v3.3.4). A P-value <0.05 (two-sided) was considered to indicate statistical significance. A chi-square or Fisher’s exact test was used to assess differences in categorical variables. Student’s t-test or a non-parametric Mann–Whitney U-test was used to detect differences in continuous variables between two groups. ANOVA or the Kruskal–Wallis test was used to detect the differences in continuous variables between multiple groups. OS was assessed using the log-rank test. HR and 95% CIs were estimated using a Cox regression model. Box plots were constructed using the R package “ggplot2.”22 The ROC curve was plotted using the R package “qROC.”23 A heat-map was plotted using the R package “gplots.”24 The survival analysis and Cox proportional hazard regression analysis were carried out using the R package “survival.”25 The C-index and nomogram were completed using the R package “rms.”26
Ethics statement
All datasets (GSE15471, GSE16515, GSE28735, GSE62452, GSE71729, and TCGA) are freely available as public resources. Therefore, additional approval by an ethics committee was not needed in this study.
Results
Identification of DEGs
A total of 9,886, 3,961, 2,276, 3,732, and 1,605 genes differentially expressed between tumor and non-tumor tissues were identified after the SAM analysis of GSE15471, GSE16515, GSE28735, GSE62452, and GSE71729 datasets, respectively (Figure S1A–E). A total of 945 DEGs were found in the five GEO datasets through overlapping analysis (Figure 1A and B; Table S1), including 389 downregulated genes and 556 upregulated genes in tumor samples compared with non-tumor samples. Distinct expression patterns of the 945 DEGs in the five GEO datasets were presented through hierarchical clustering analysis (Figure S2A–E).
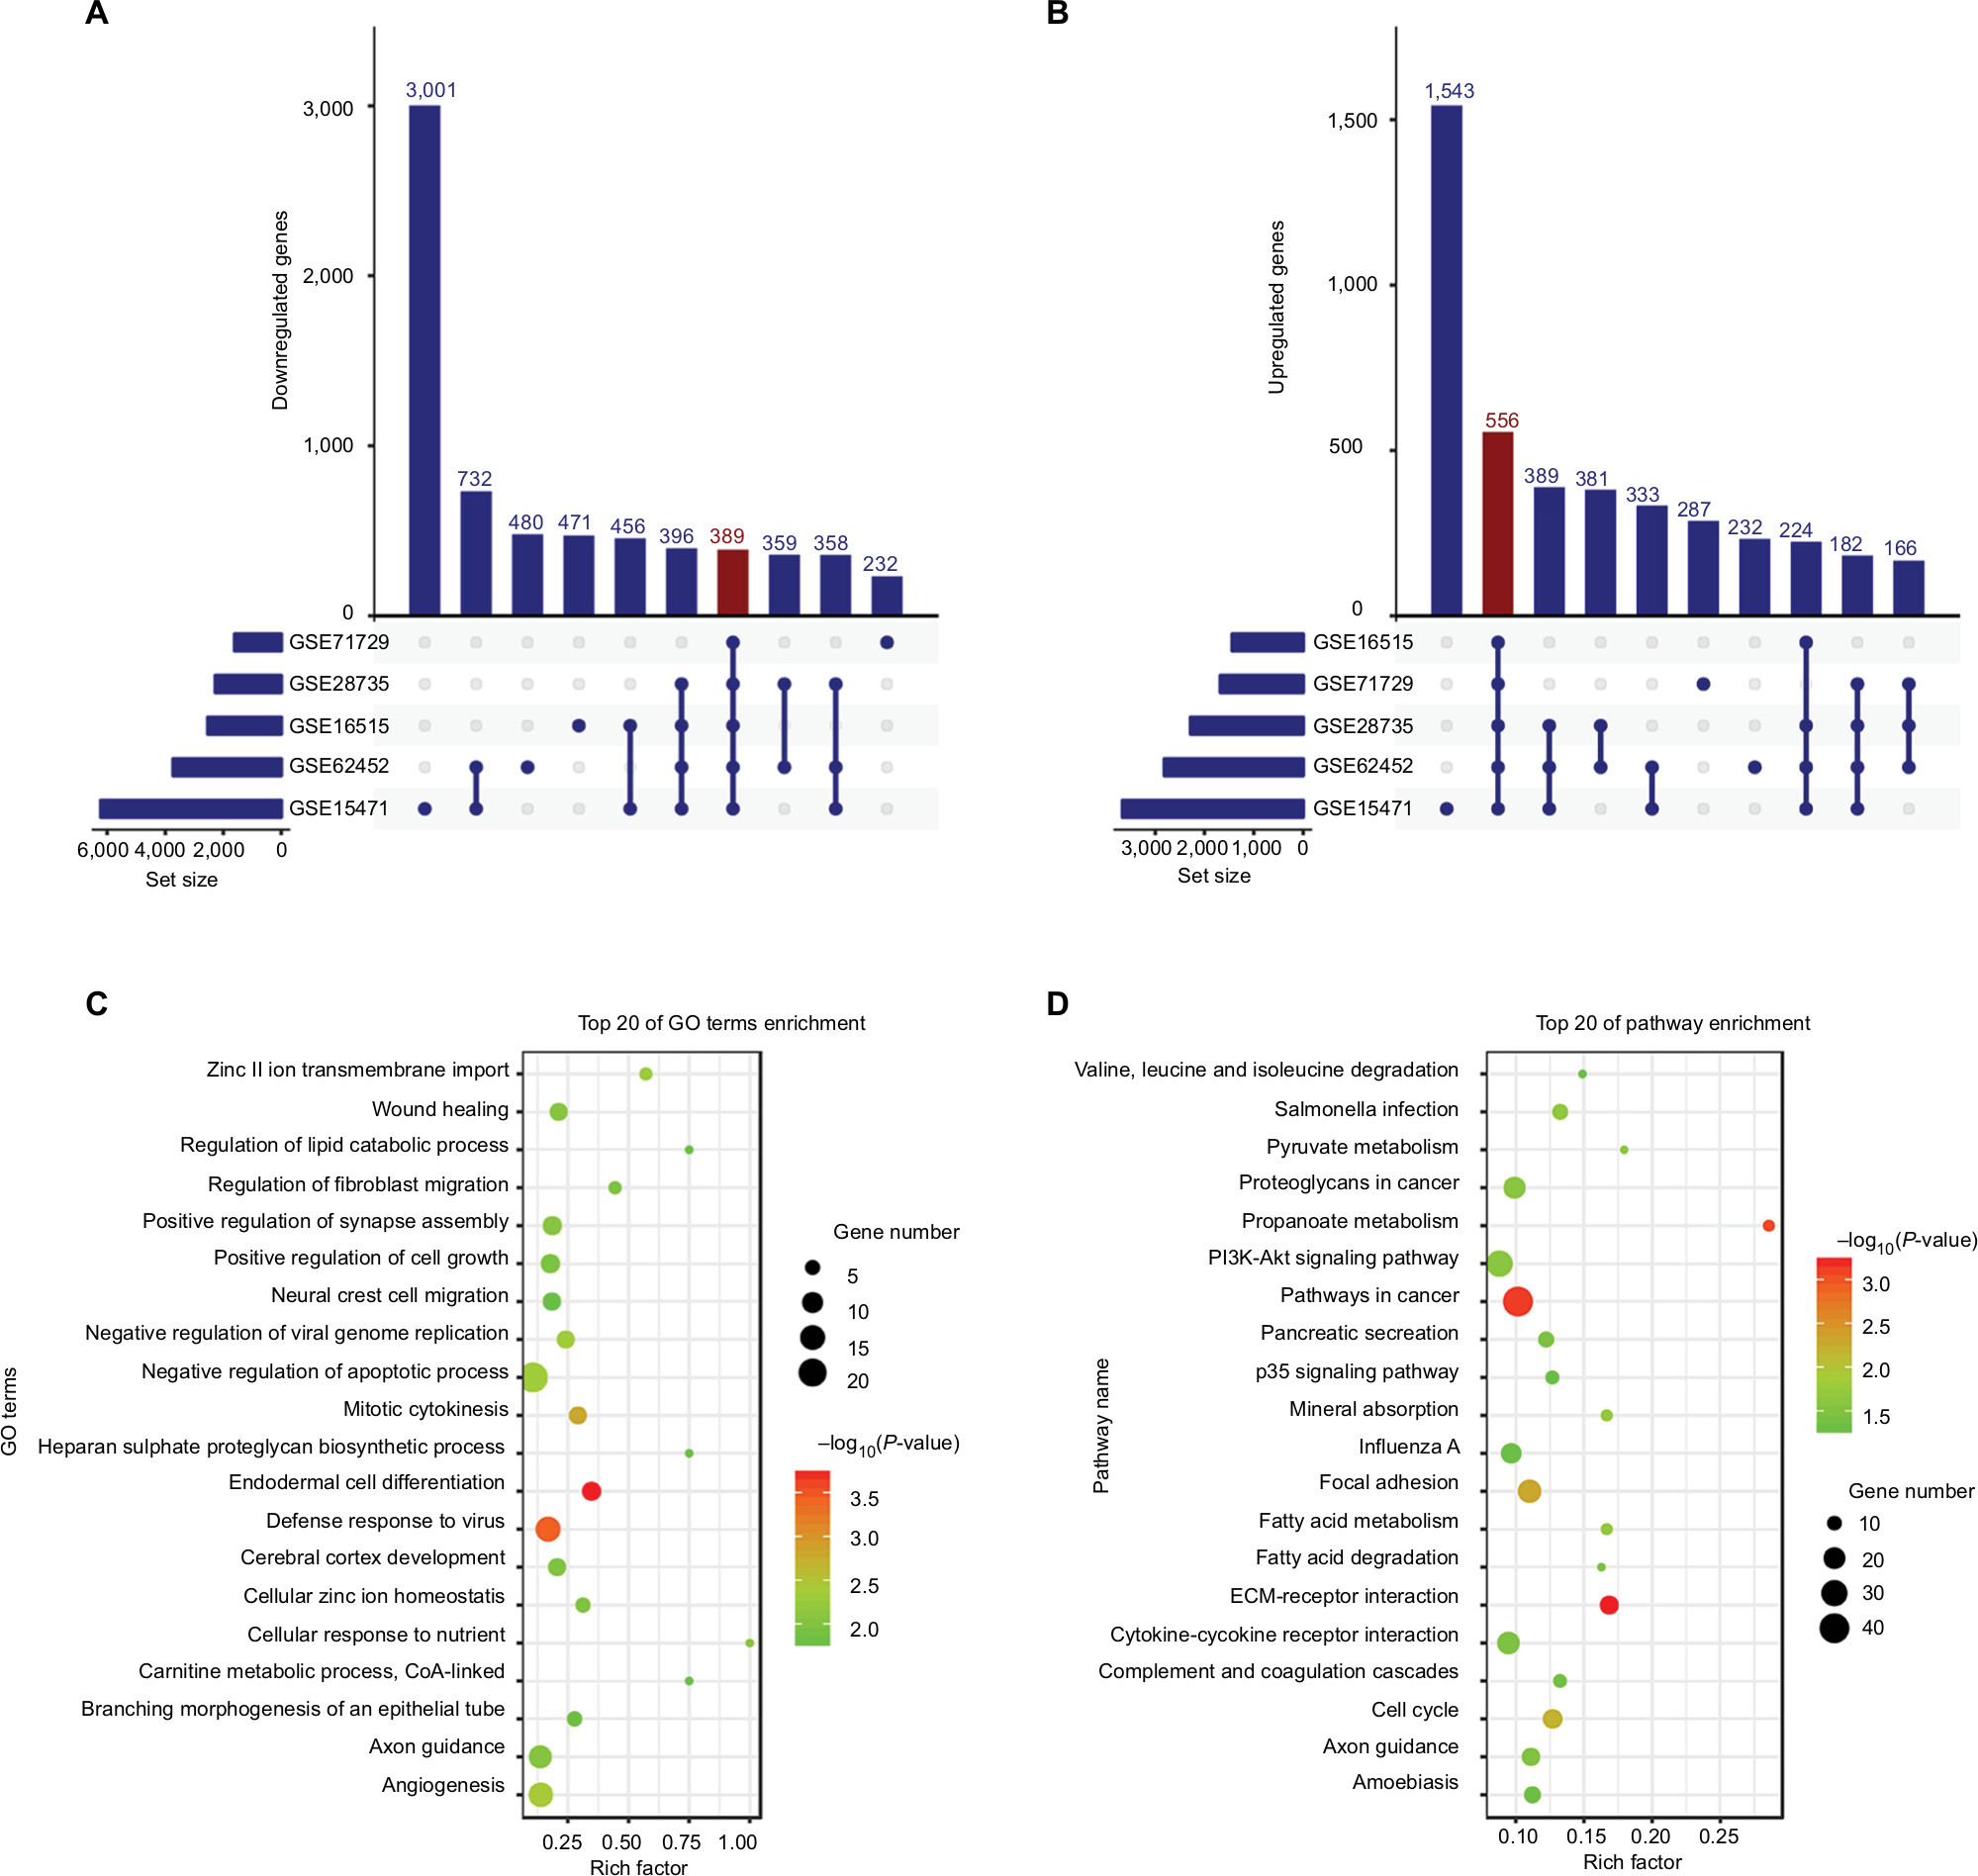 | Figure 1 DEGs in five GEO datasets. Notes: The figure shows 389 downregulated (A) and 556 upregulated (B) genes in PC samples. (C) GO biological process analysis for the DEGs. (D) KEGG pathway enrichment analysis for the DEGs. Set size refers to the number of genes differentially expressed between tumor and non-tumor samples in different GEO datasets. Abbreviations: DEGs, differentially expressed genes; GO, Gene ontology; KEGG, Kyoto Encyclopedia of Genes and Genomes; PC, pancreatic cancer. |
Functional annotation analysis, pathway enrichment analysis, and PPI network for DEGs
In Gene ontology (GO) biological process analysis, the 945 DEGs were found to be principally enriched in zinc II ion transmembrane import, wound healing, regulation of lipid catabolic process, regulation of fibroblast migration, positive regulation of synapse assembly, positive regulation of cell growth, as well as other biological processes (Figure 1C). Kyoto Encyclopedia of Genes and Genomes (KEGG) analysis showed that the DEGs were mainly associated with salmonella infection, pyruvate metabolism, proteoglycans in cancer, PI3K-Akt signaling pathway, pathways in cancer, pancreatic secretion, p53 signaling pathway, and other biological pathways (Figure 1D). PPI network was constructed to evaluate the interactive relationships among the DEGs (Figure S3).
Identification of SRGs and the correlation of SRGs with clinicopathological information
Among the 945 DEGs, a total of 64, 190, 136, and 596 genes associated with OS were identified in the GSE28735, GSE62452, GSE71729, and TCGA datasets, respectively. We also found four SRGs (LYRM1, KNTC1, IGF2BP2, and CDC6) in the four datasets (Figure 2A) through overlapping analysis.
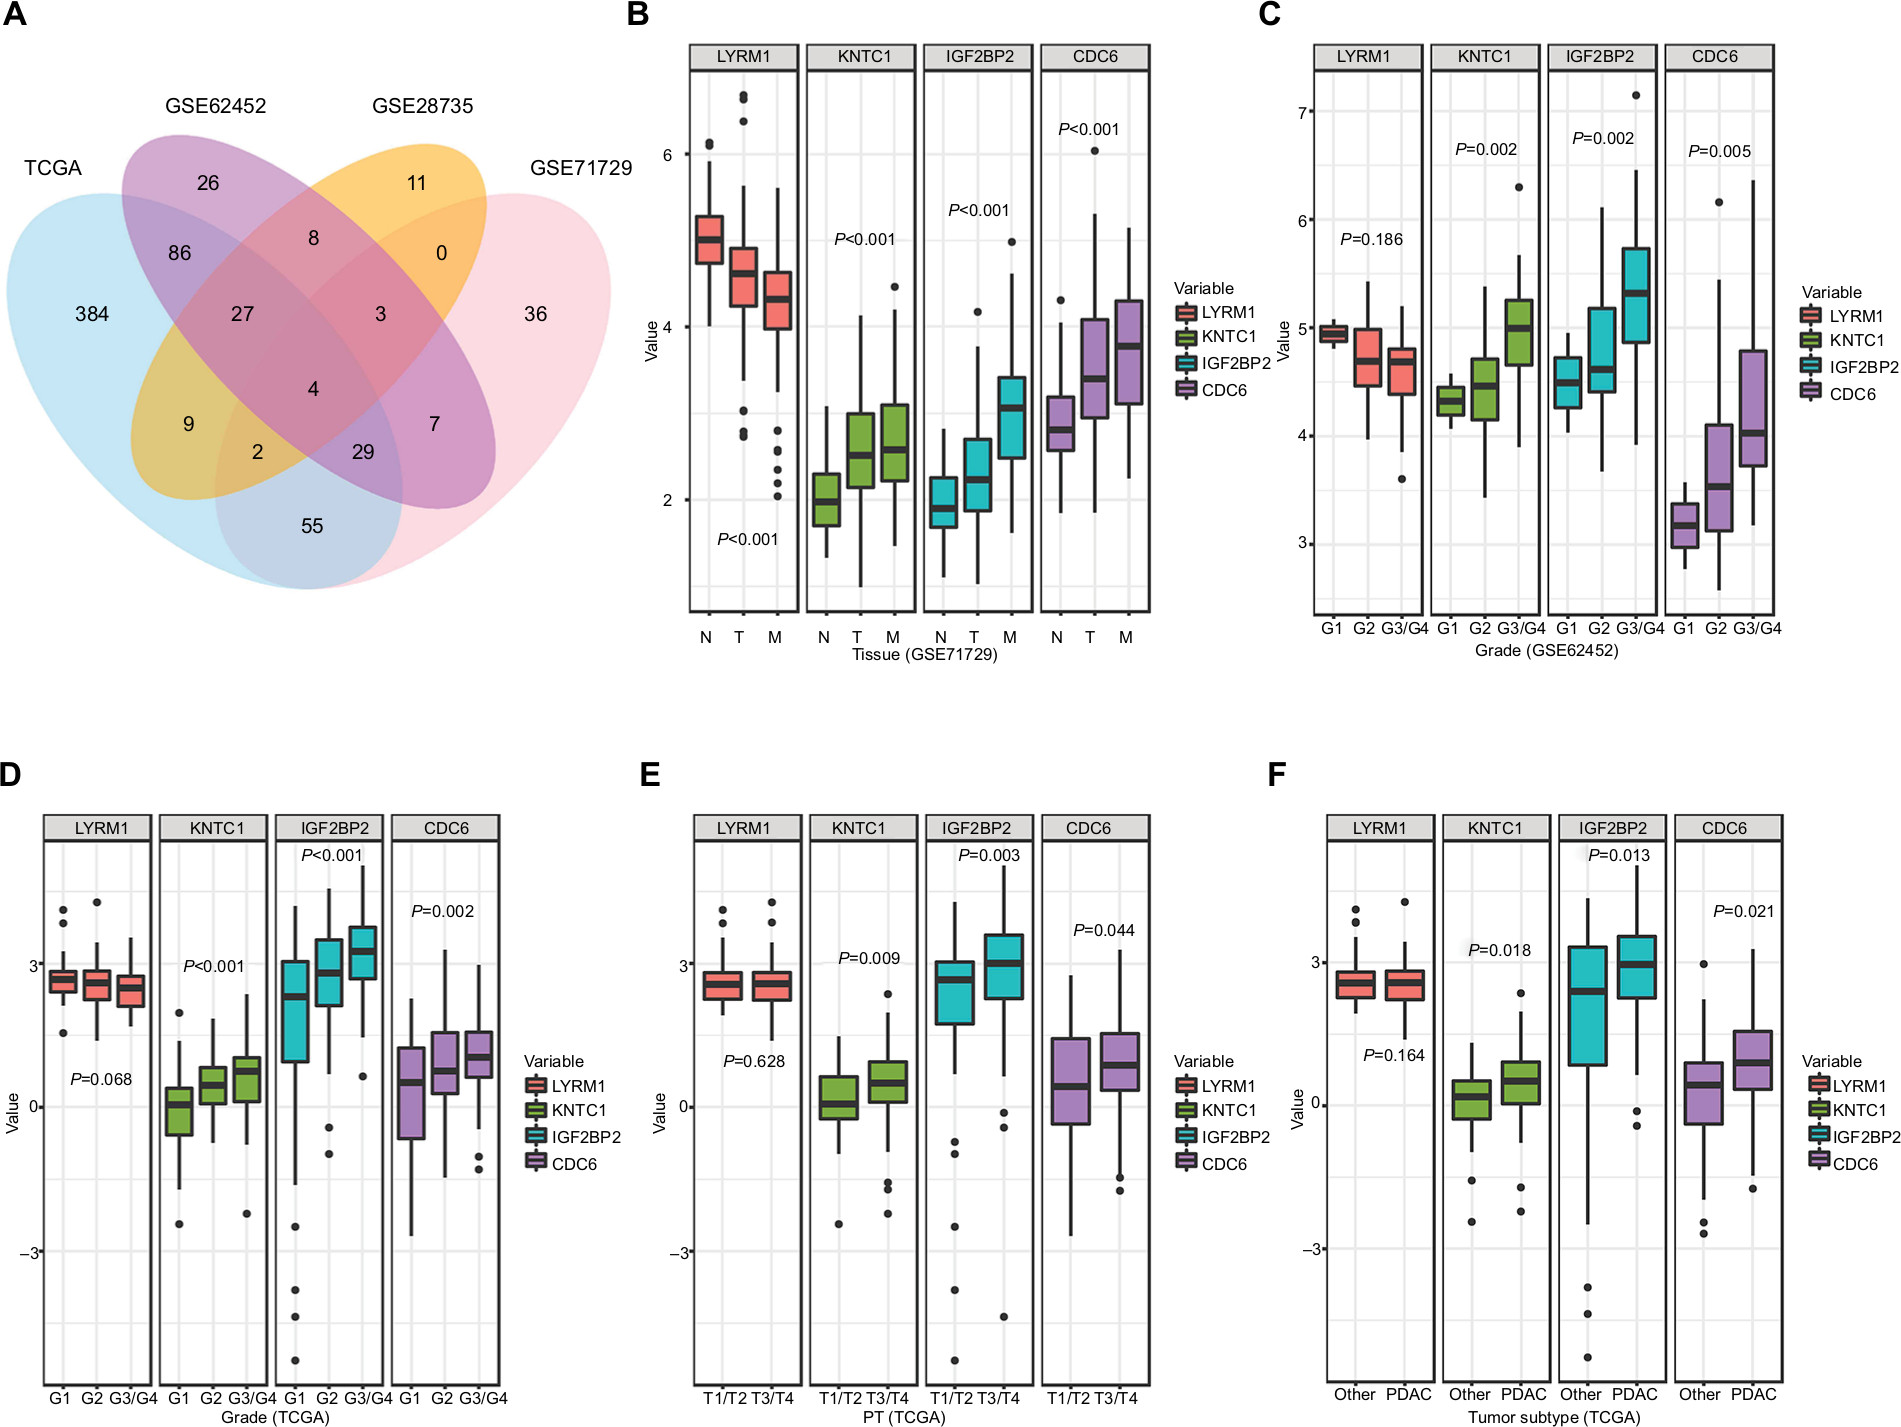 | Figure 2 Relationship between SRGs and clinicopathological information. Notes: (A) The Venn diagram shows four SRGs in four datasets. (B) Relationship between SRGs and tissues types. (C, D) Relationship between SRGs and histological grade. (E) Relationship between SRGs and PT. (F) Relationship between SRGs and tumor subtype. Other, including neuroendocrine carcinoma, colloid carcinomas, acinar cell carcinoma, and adenocarcinoma not otherwise specified. Abbreviations: M, metastatic samples; N, normal samples; PDAC, pancreatic ductal adenocarcinoma; PT, the extent of the tumor; SRGs, survival-related genes; T, tumor samples. |
Correlation analysis was performed to determine the association between the expression levels of SRGs and clinicopathological information, including tissues types (normal, tumor, and metastatic samples) (Figure 2B), histological grade (Figure 2C and D), the extent of the tumor (PT) (Figure 2E), tumor subtype (Figure 2F), AJCC stage (Figure S4A), tumor site (Figure S4B), and the extent of spread to the lymph nodes (Figure S4C). Among the SRGs, KNTC1, IGF2BP2, and CDC6 were significantly associated with tissues types, histological grade, PT, and tumor subtype (P<0.05); LYRM1 was significantly differentially expressed in normal, tumor, and metastatic tissues (P<0.05).
Meanwhile, the four SRGs were analyzed using X-tile to select the best cutoff values for OS, and on this basis, patients were divided into low- and high-expression groups. Kaplan–Meier survival analysis showed that all SRGs were significantly correlated with patient OS (P<0.05) in the four datasets (Figure 3A–D).
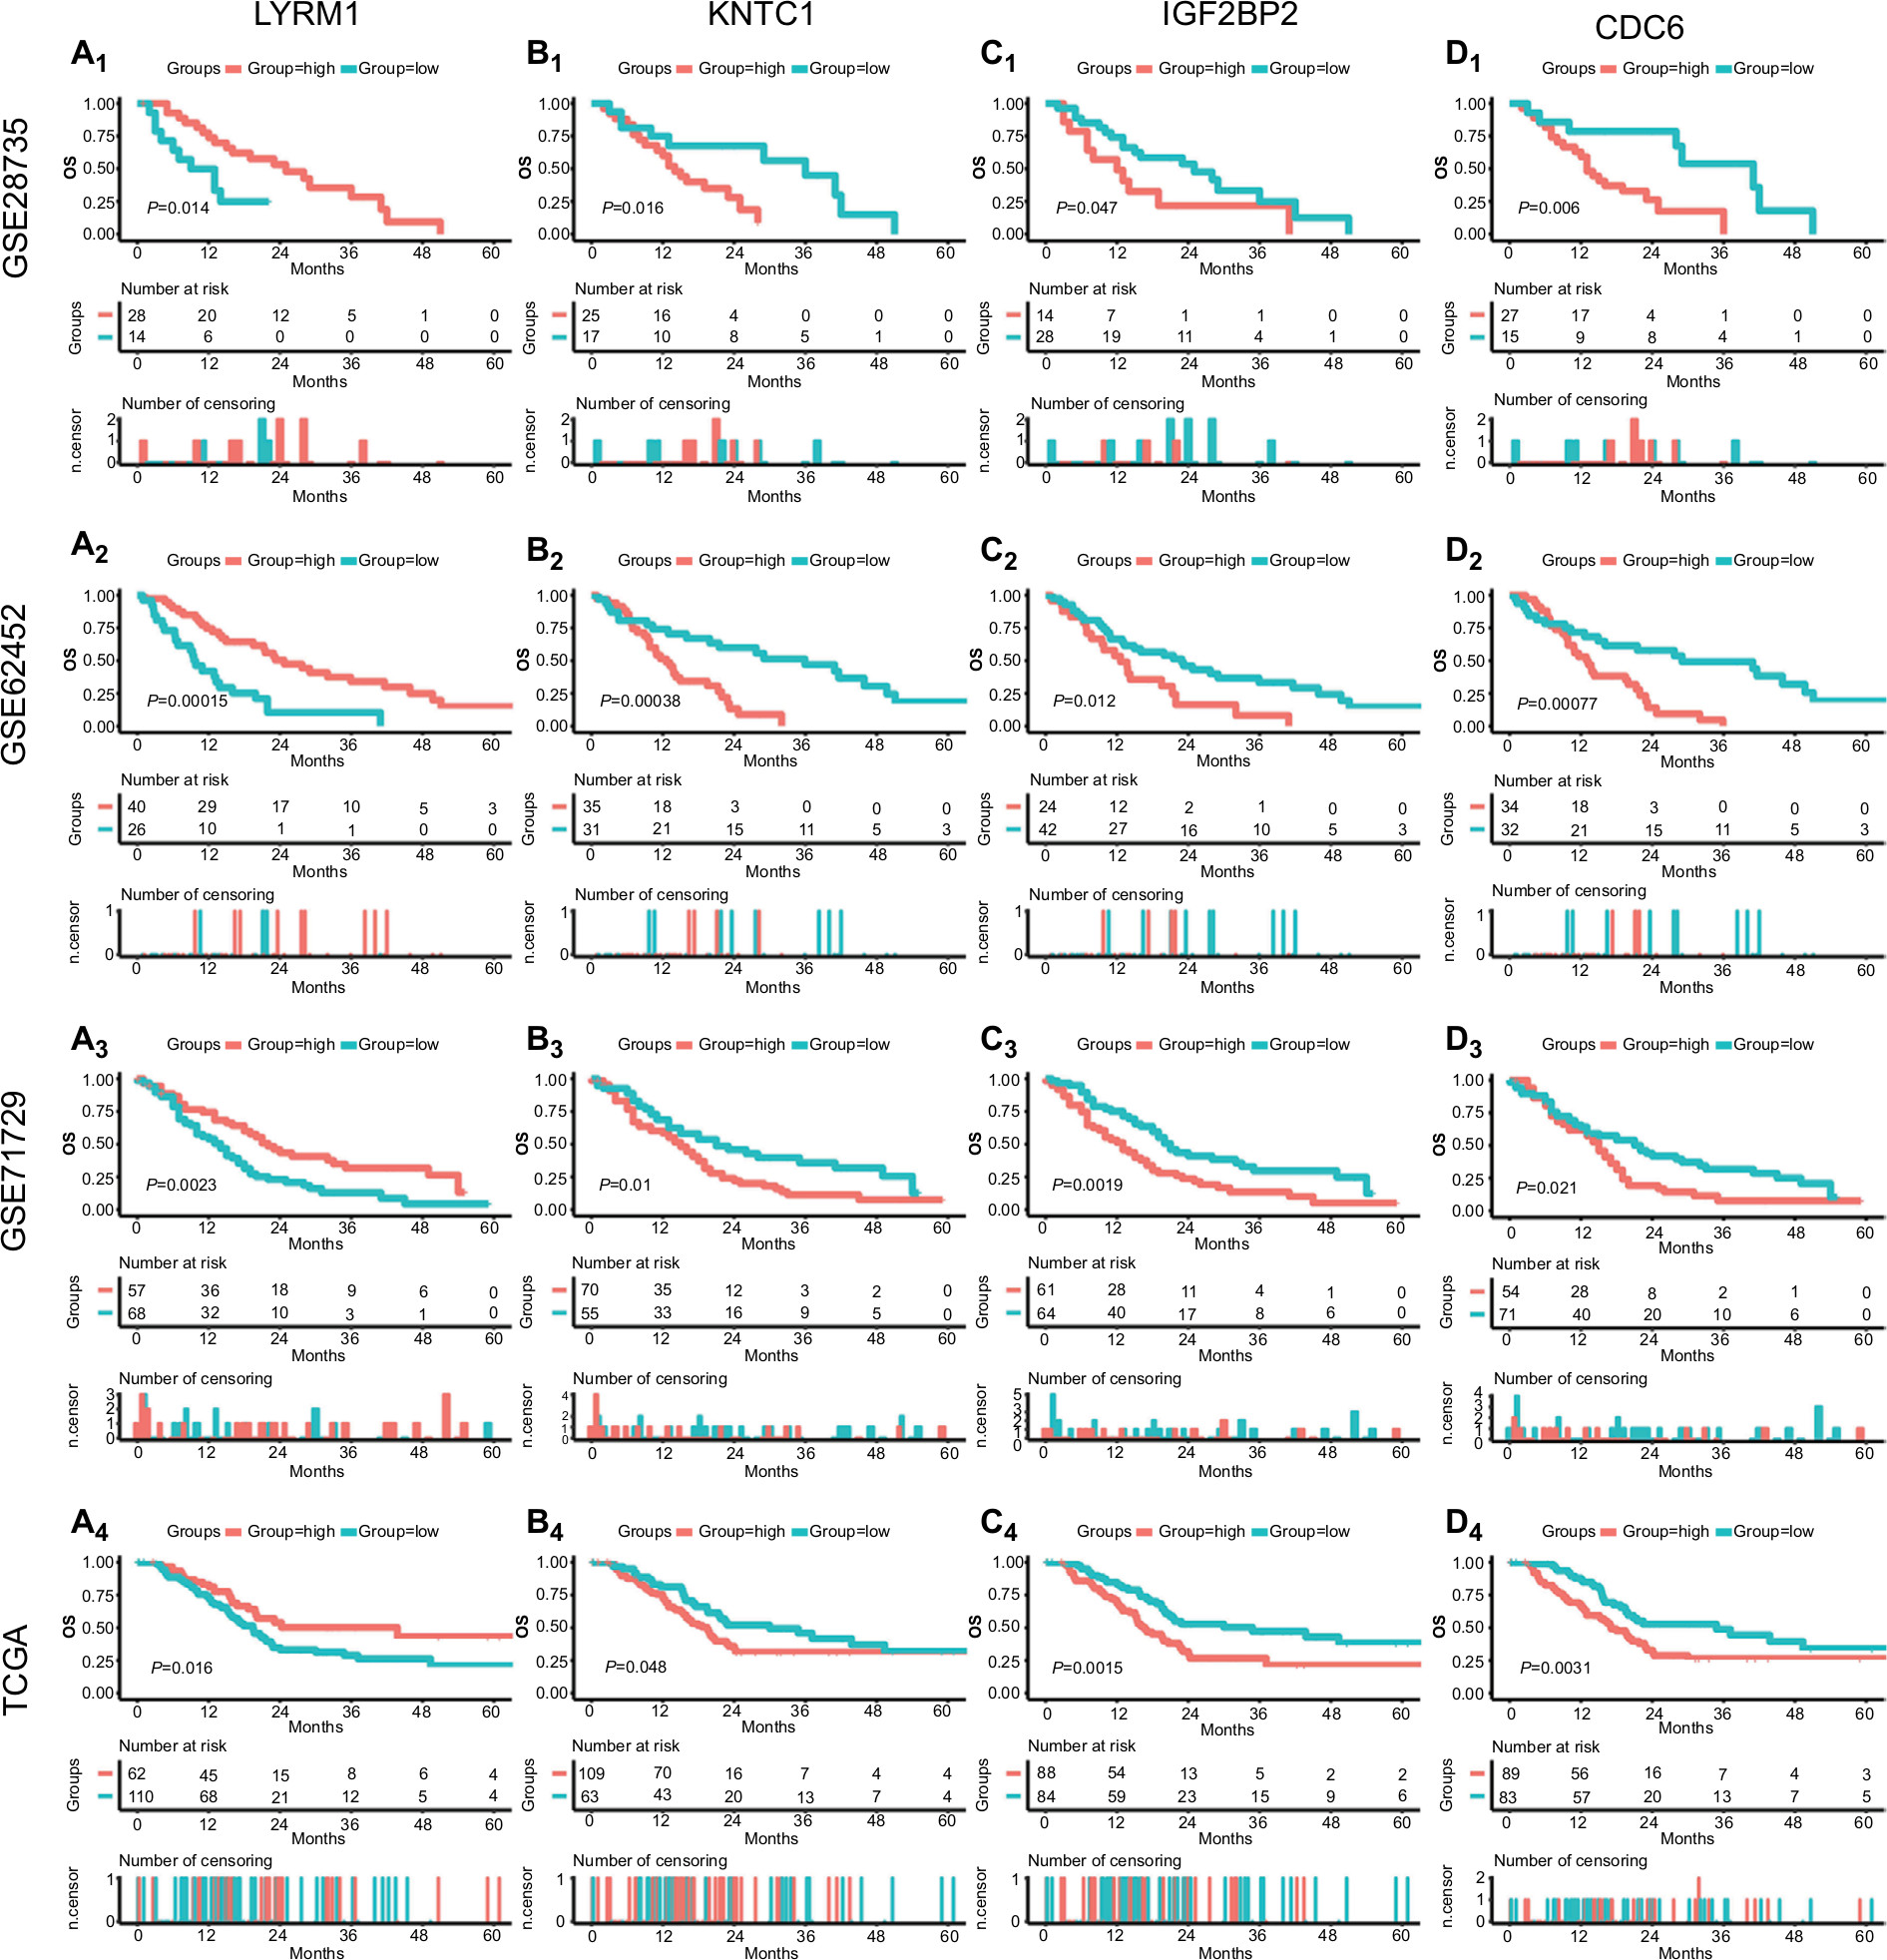 | Figure 3 Survival analysis of SRGs in four datasets. Notes: Survival curves of LYRM1 (A1–4), KNTC1 (B1–4), IGF2BP2 (C1–4), and CDC6 (D1–4) in GSE28735, GSE62452, GSE71729, and TCGA datasets. Abbreviations: SRGs, survival-related genes; TCGA, The Genome Cancer Atlas. |
Collectively, these results indicate that the identified SRGs play important roles in the development and progression of PC.
Performance assessment of risk score in predicting outcome
As described previously, the risk score was computed through the summation of the gene expression value multiplied by the corresponding coefficient (coefficients were obtained from the TCGA dataset through a univariate COX analysis): Risk score = (−0.4705 × expression value of LYRM1) + (0.3707 × expression value of KNTC1) + (0.4106 × expression value of IGF2BP2) + (0.4623 × expression value of CDC6).
Then, we stratified patients into low- and high-risk groups in accordance with the median risk scores in the GSE28735, GSE62452, GSE71729, and TCGA datasets. The Kaplan–Meier survival curves of both groups were notably different in the four datasets (P<0.05) (Figure 4A1–D1).
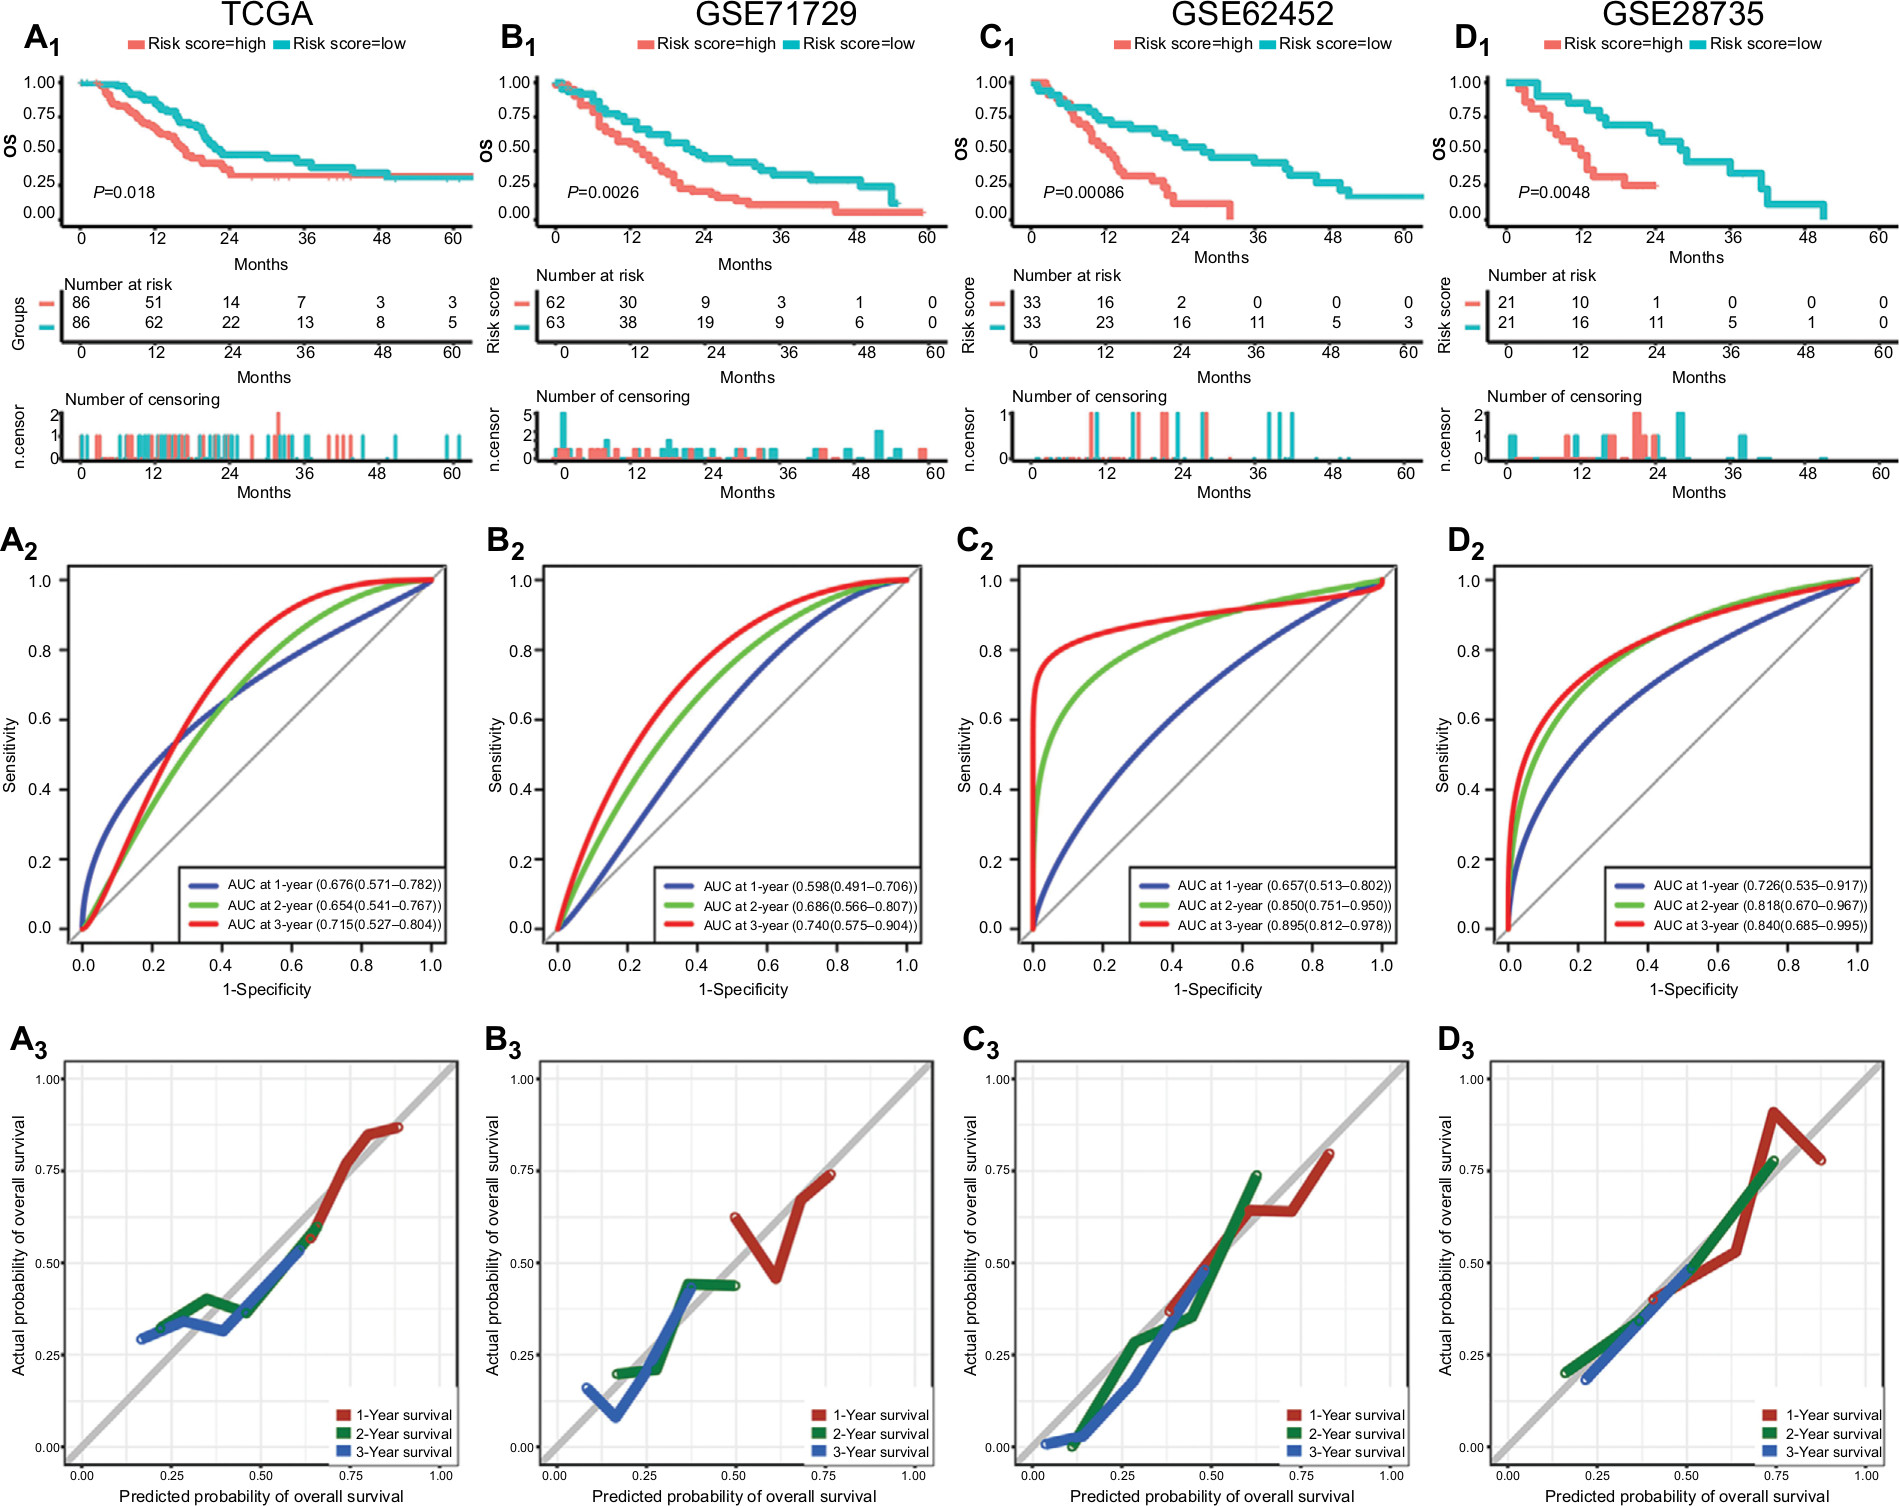 | Figure 4 Performance of risk score in predicting prognosis in four datasets. Notes: Survival curves, AUC, and calibration plots for risk score in TCGA (A1–3), GSE71729 (B1–3), GSE62452 (C1–3), and GSE28735 (D1–3). Abbreviations: AUC, area under the curve; TCGA, The Genome Cancer Atlas. |
The power of the risk score in predicting OS was assessed through C-index and ROC analysis. The C-index of the risk score in the TCGA, GSE71729, GSE62452, and GSE28735 datasets was 0.640 (95% CI, 0.572–0.708), 0.601 (95% CI, 0.531–0.671), 0.648 (95% CI, 0.558–0.738), and 0.689 (95% CI, 0.573–0.805), respectively (Figure S5). The ROC analysis of the risk score is shown in Figure 4A2–D2, and all AUC values at the 3-year point in the four datasets are greater than 0.70.
In addition, relatively good agreement was observed between the expected and observed outcomes for 1-, 2-, and 3-year OS in the calibration curves of risk score (Figure 4A3–D3).
In summary, these results indicate that the risk score shows relatively good performance in predicting the OS of PC patients.
Assessment of prognostic factors in PC patients
After removing patients for whom important clinical information was not available (including age, sex, malignancy history, diabetes history, pancreatitis history, tumor size, tumor site, tumor subtype, histological grade, residual tumor, AJCC stage, radiation treatment, and targeted therapy), 95 patients were retained. Univariate and multivariate adjusted Cox regression analyses were performed to identify prognostic factors for OS. As shown in Table 1, the unadjusted univariate analysis indicated that risk score (P<0.001), age (P=0.013), tumor size (P=0.022), tumor subtype (P=0.001), histological grade (P=0.016, G3 and G4 vs G1), AJCC stage (P=0.002 [IIB vs I], P=0.006 [III and IV vs I]), radiation treatment (P=0.014), and targeted therapy (P=0.014) were significantly associated with OS, while the multivariate adjusted Cox regression analysis showed that risk score, age, tumor size, tumor subtype, radiation treatment, and targeted therapy served as significant independent risk factors (P<0.05).
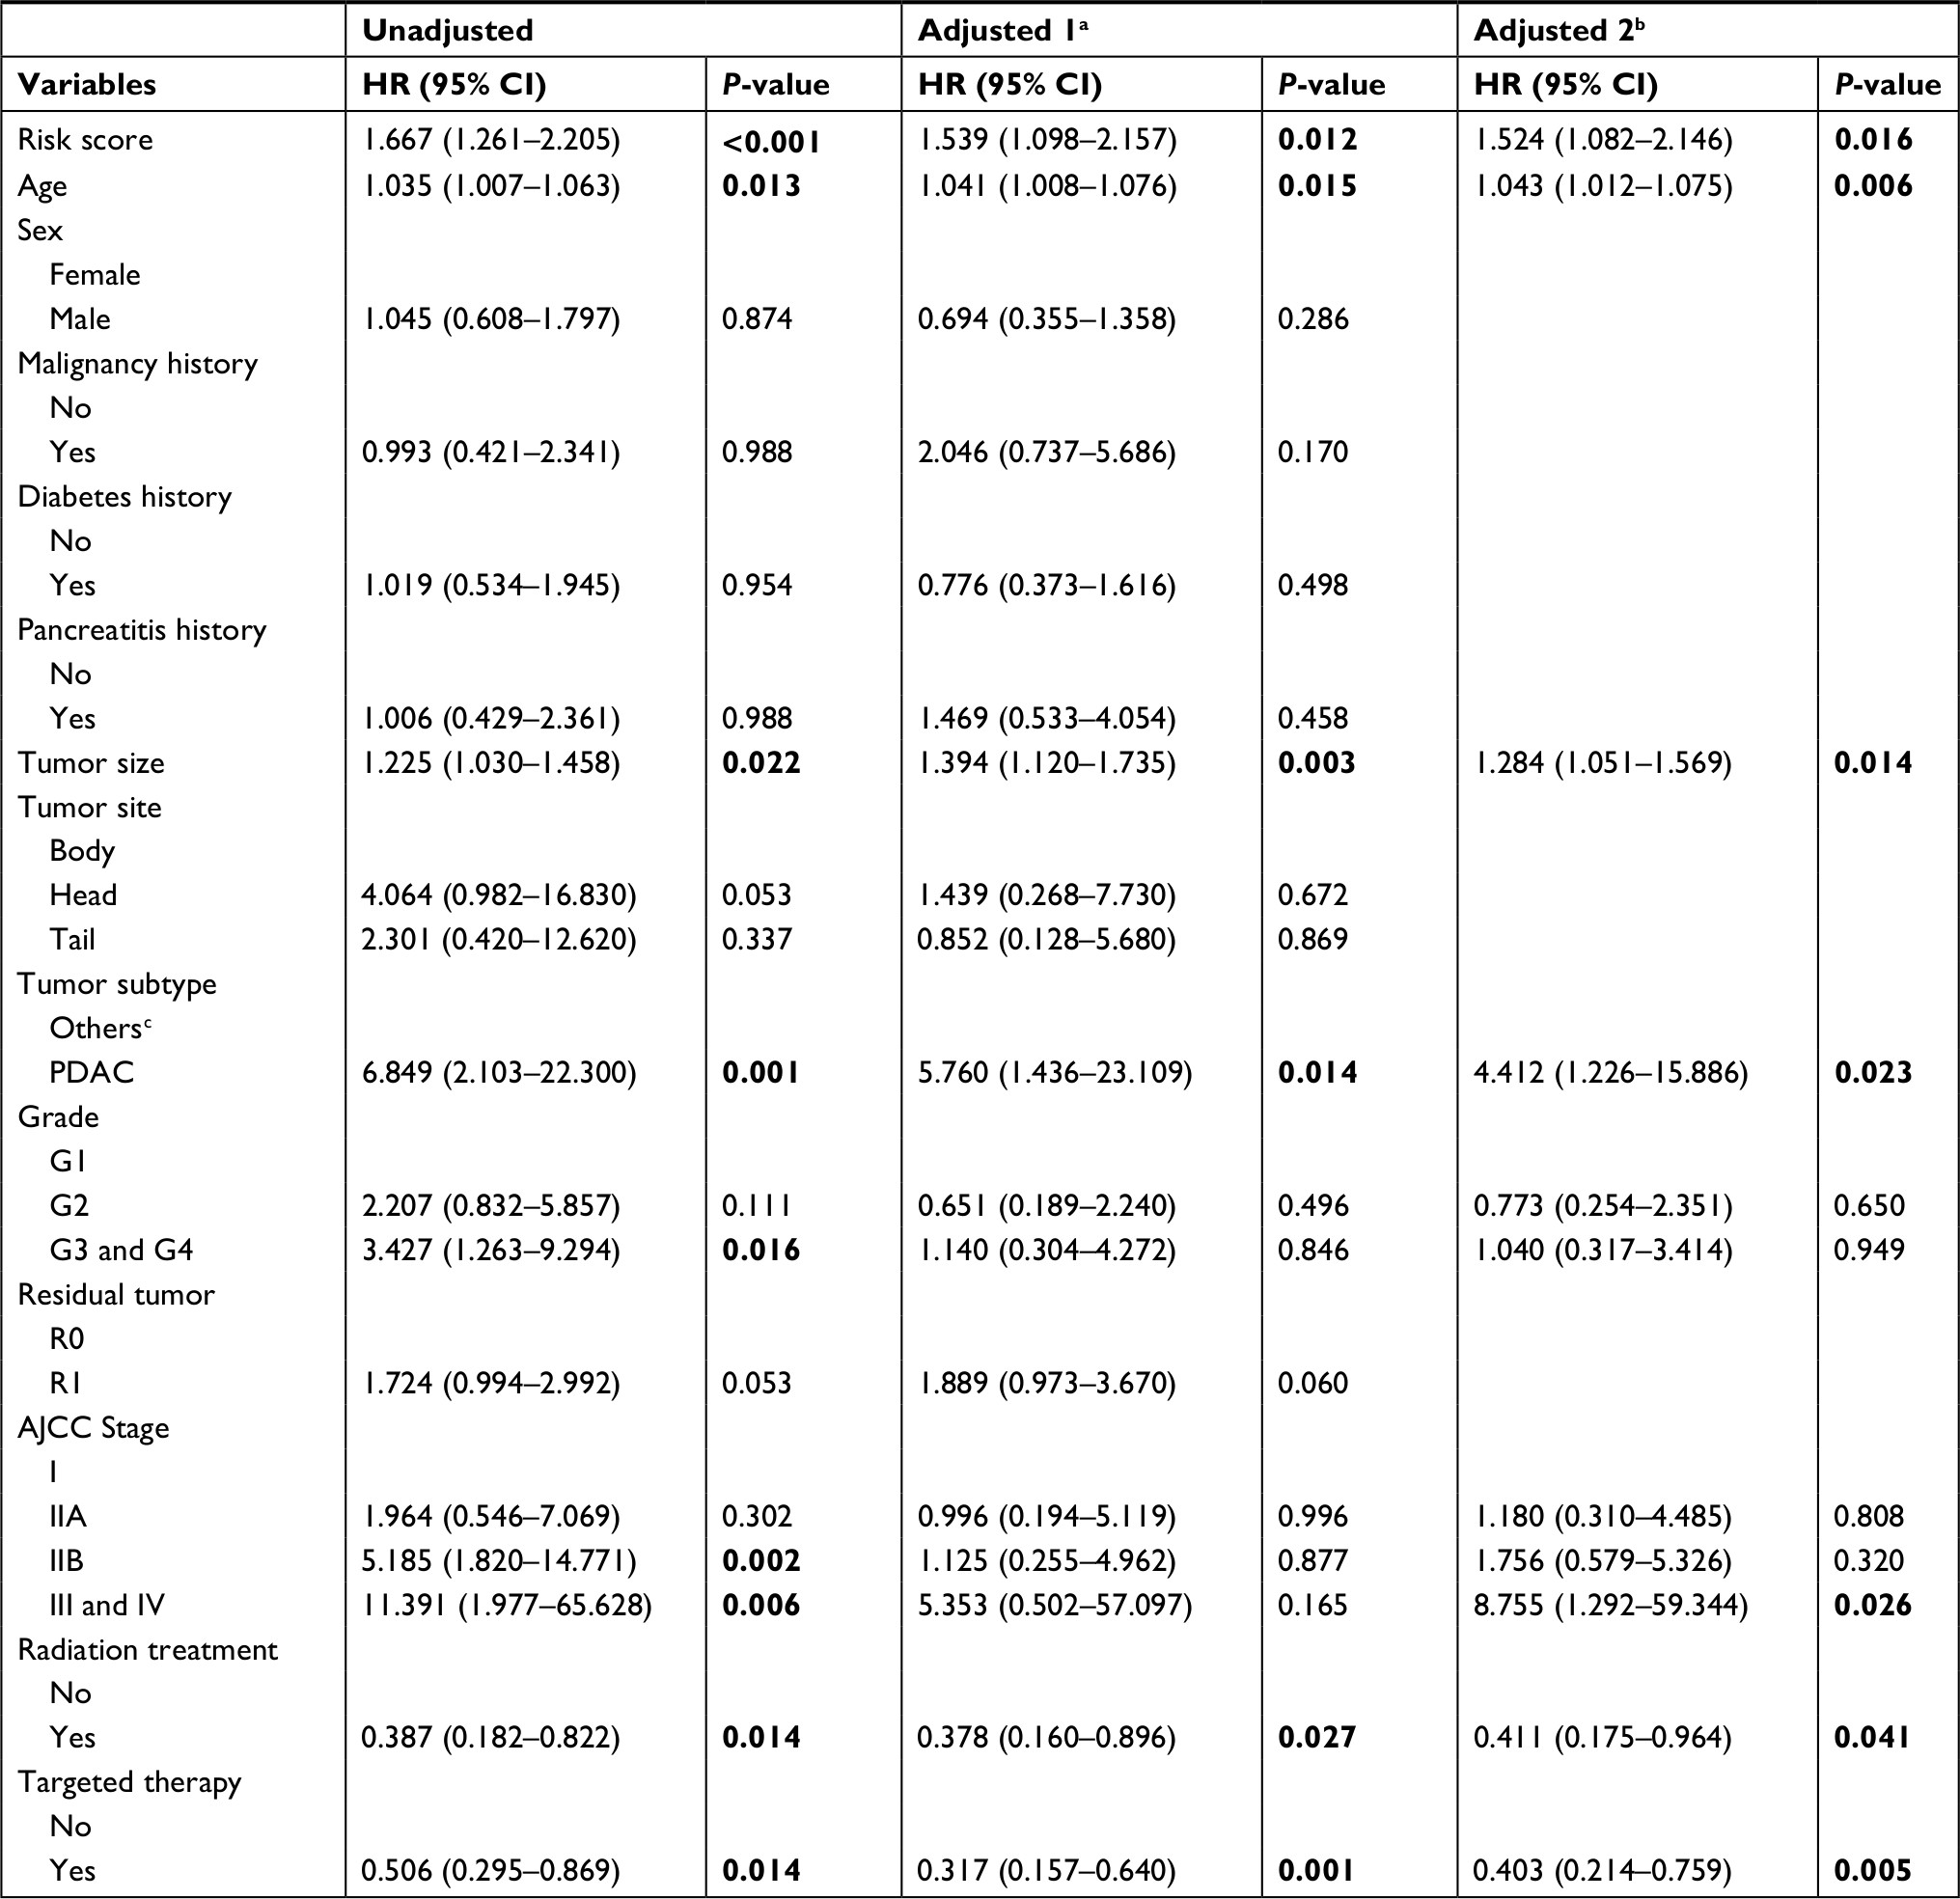 | Table 1 Cox regression analysis of risk factors associated with overall survival in the TCGA dataset Notes: aAdjusted covariates include all the indicators above; bAdjusted covariates include the prognostic factors from an unadjusted COX analysis; cIncluding neuroendocrine carcinoma, colloid carcinomas, acinar cell carcinoma and adenocarcinoma not otherwise specified. Bold number indicates statistical significance. Abbreviations: AJCC, the current American Joint Committee on Cancer stage; PDAC, pancreatic ductal adenocarcinoma; TCGA, The Genome Cancer Atlas. |
Development, comparison, and validation of predictive nomogram
To build a more applicable and individualized predictive model, a predictive nomogram integrating clinical information and gene signatures was constructed based on the 95 patients with complete clinical information in TCGA. Through a stepwise Cox proportional hazard analysis, risk score, age, sex, tumor subtype, tumor size, residual tumor, radiation treatment, and targeted therapy were selected to establish a nomogram model (Figure 5A). The calibration plot for predicting 1-, 2-, and 3-year OS (Figure 5B) showed that the nomogram model performed well with the ideal prediction model.
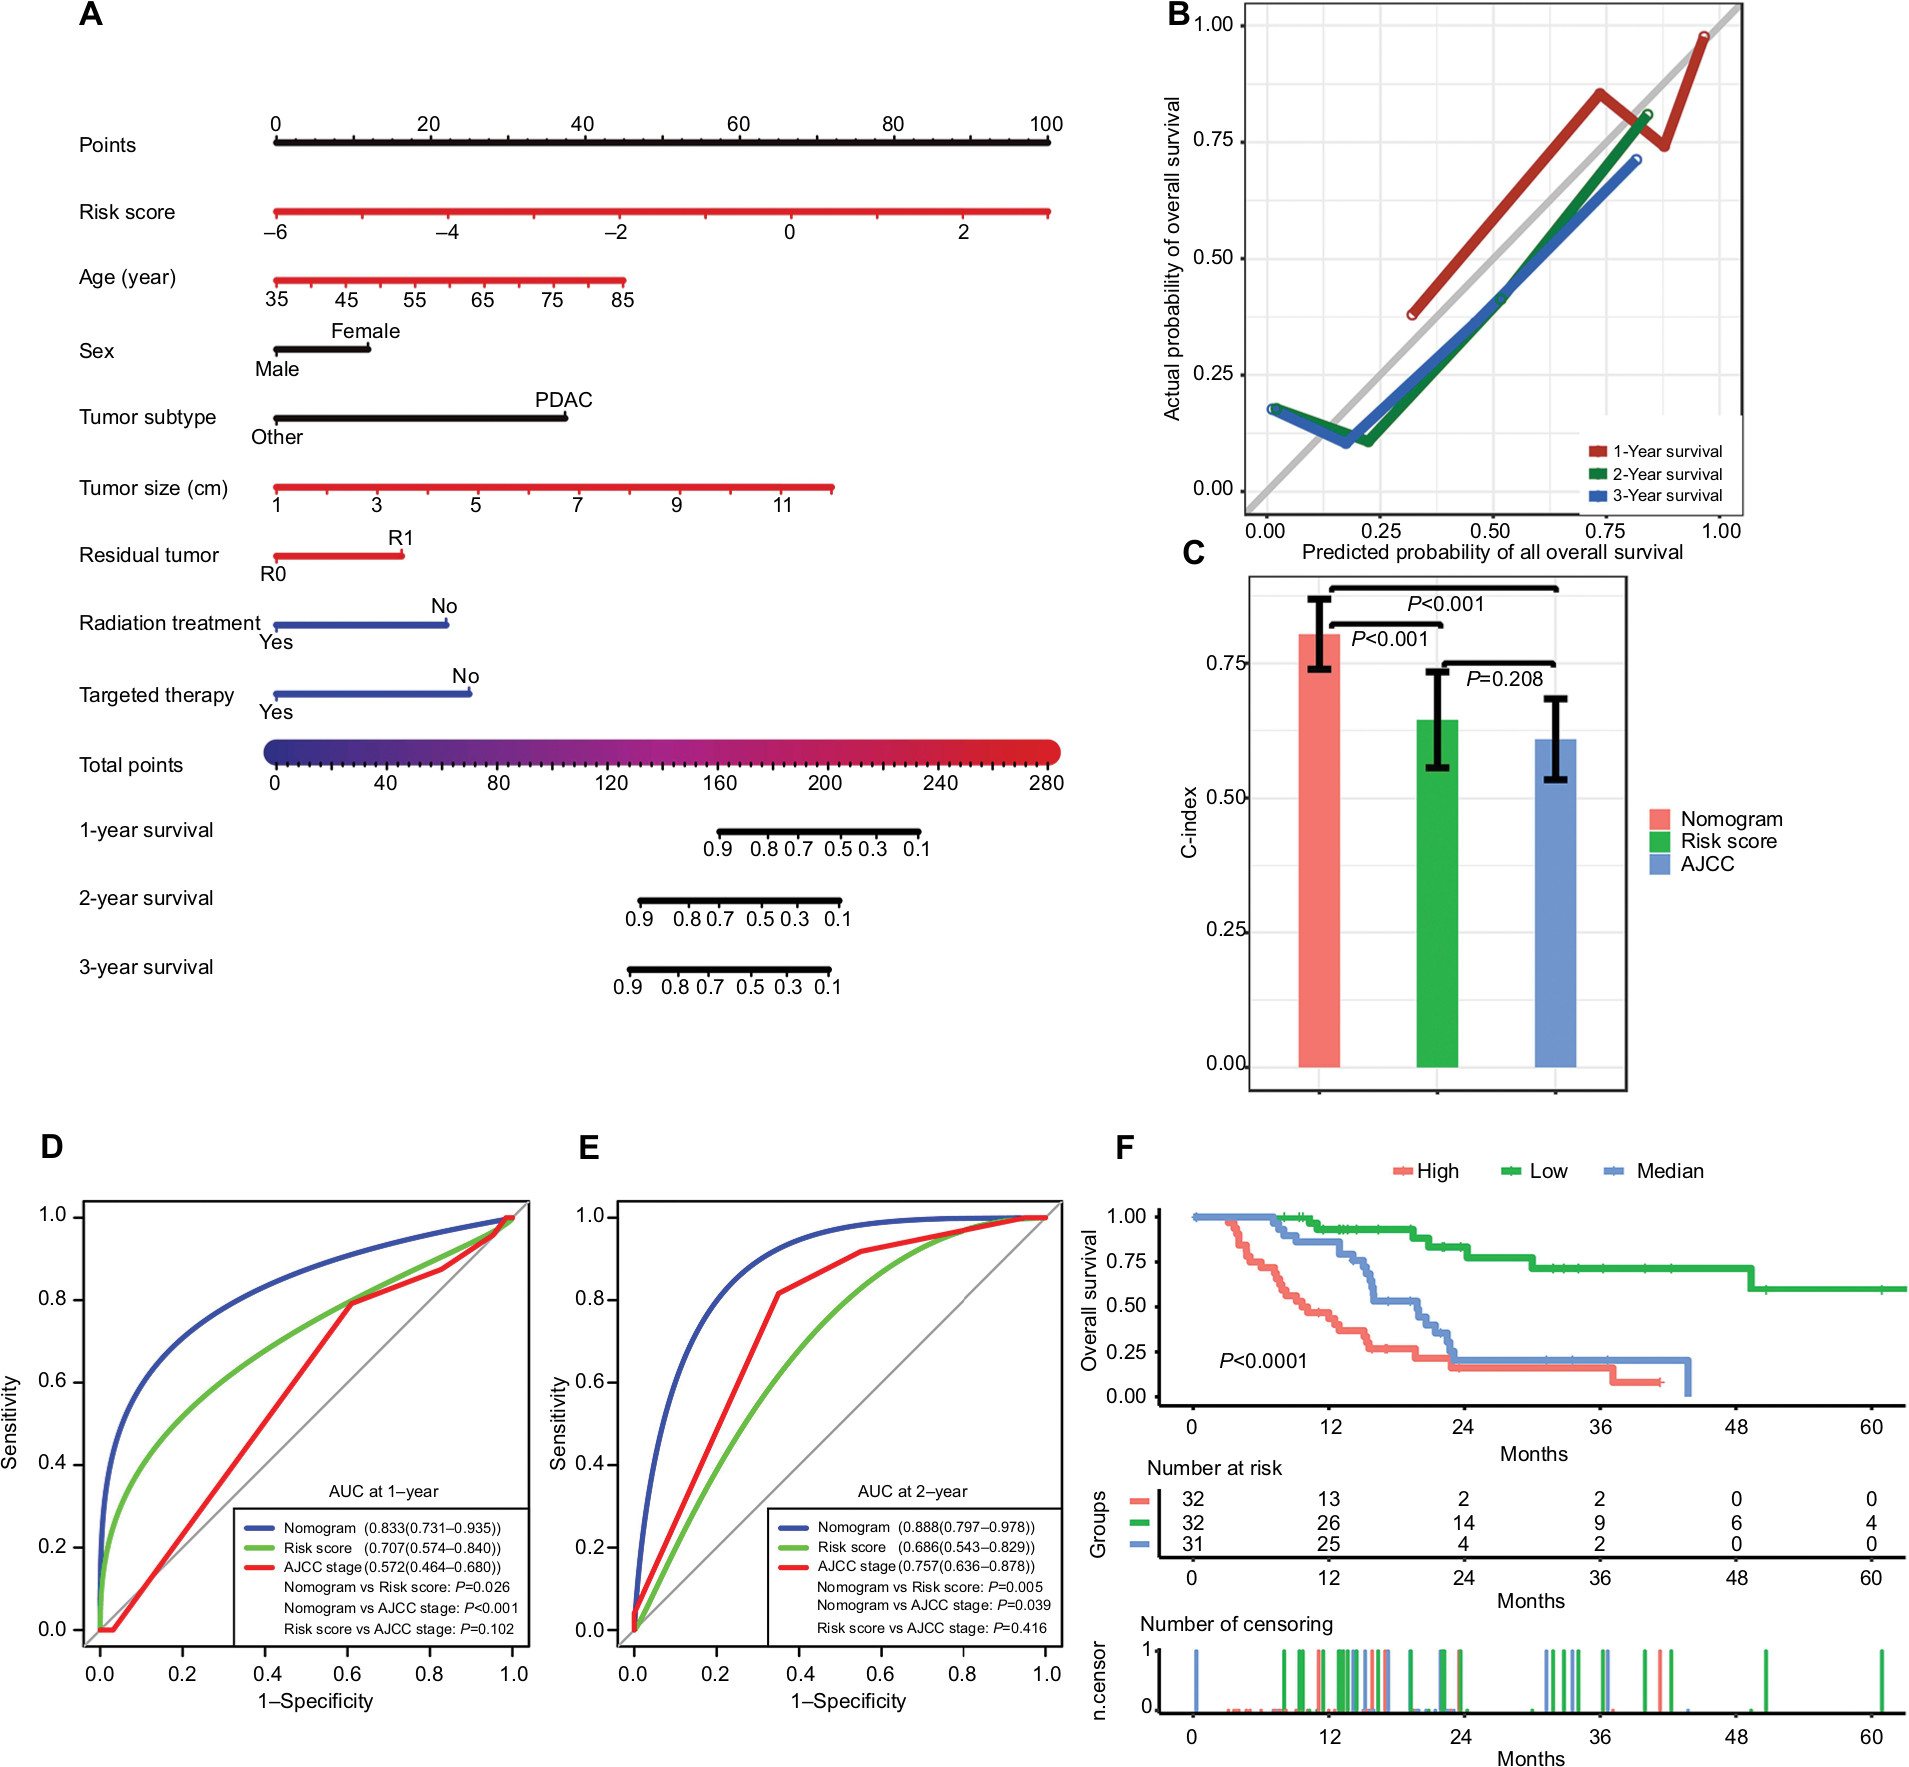 | Figure 5 Performance of the nomogram in predicting prognosis in the TCGA dataset. Notes: (A) Nomogram for predicting 1-, 2-, and 3-year OS in PC patients. (B) Calibration plot for 1-, 2-, and 3-year OS of the nomogram. (C) Comparison of the predictive power of the nomogram model, AJCC stage, and risk score, as assessed using C-index. (D, E) Comparison of the predictive power of the nomogram model, AJCC stage, and risk score by AUC at 1 and 2 years. (F) Kaplan–Meier analysis of risk groups stratified using total point of the proposed nomogram. Other, including neuroendocrine carcinoma, colloid carcinomas, acinar cell carcinoma, and adenocarcinoma not otherwise specified; vertical bars, 95% CI. Abbreviations: AJCC, the American Joint Committee on Cancer; AUC, area under the curve; C-index, concordance index; OS, overall survival; PC, pancreatic cancer; PDAC, pancreatic ductal adenocarcinoma; TCGA, The Genome Cancer Atlas. |
We compared the predictive power of the nomogram model, AJCC stage and risk score: the C-index (Figure 5C) of the nomogram was 0.804 (95% CI, 0.740–0.868), which is significantly greater than that of the AJCC stage (0.609 [95% CI, 0.536–0.683], P<0.001) and risk score (0.645 [95% CI, 0.558–0.732], P<0.001). The AUC of the nomogram at 1 year (Figure 5D) was 0.833 (95% CI, 0.731–0.935), which is superior compared with that of the AJCC stage (0.572 [95% CI, 0.464–0.680], P<0.001) and risk score (0.707 [95% CI, 0.574–0.840], P=0.026). The AUC of the nomogram at 2 years (Figure 5E) was 0.888 (95% CI, 0.797–0.978), which is superior to that of the AJCC stage (0.757 [95% CI, 0.636–0.878], P=0.039) and risk score (0.686 [95% CI, 0.543–0.829], P=0.005). In addition, based on the total point of the nomogram, we stratified patients into low-, medium-, and high-risk groups (cutoff points were selected at each tertile point). Then, Kaplan–Meier analysis revealed that scoring using the nomograms effectively discriminated the risk groups in PC (P<0.0001) (Figure 5F).
Discussion
In the past few decades, large amounts of data have been generated via high-throughput methods, such as microarrays and next-generation sequencing technologies, which significantly facilitates investigations of the interaction between gene signatures and disease. Meanwhile, an increasing number of studies tend to identify biomarkers through the analysis of multiple data sources, which often provides stronger evidence than a single data source. In the current study, to enhance the strength of our results, we identified DEGs and SRGs in PC via a joint analysis of six different data sources.
Through GO biological process and KEGG analyses of the DEGs, the main biological processes and pathways involved in human PC were identified (Figure 1C and D). Many previous studies have reported that the PI3K-Akt and p53 signaling pathways play important roles in cell cycle arrest, cell invasion, proliferation, angiogenesis, and metastasis in PC, which is consistent with our results.27–33 Therefore, the biological processes and pathways reported here are worth further study to increase our understanding of the mechanism underlying carcinogenesis and progression in PC.
Survival analyses and correlation analyses indicated that the SRGs (LYRM1, KNTC1, IGF2BP2, and CDC6) were significantly associated with PC prognosis. CDC6 is an essential gene required for DNA replication, which has been reported as overexpressed in various types of cancer.34–36 High expression of CDC6 could trigger tumor-like transformation, apoptosis attenuation, genomic instability, cell proliferation, and epithelial-to-mesenchymal transition37–39 and has been associated with poor prognosis in epithelial ovarian cancer.37 CDC6 depletion could result in increased cell death and attenuate tumor migration and invasion.35,40 IGF2BP2 is a post-transcriptional regulatory factor implicated in mRNA localization, stability, and translational control. In previous studies, IGF2BP2 has been confirmed as upregulated in different cancer types41–44 and is associated with tumor carcinogenesis, invasion, and prognosis.43,45,46 Although the function of Homo sapiens LYRM1 and KNTC1 have not yet been studied in cancer, these two genes have been reported to participate in the regulation of cell division, proliferation, and apoptosis,47–49 which may affect tumor development and progression. However, the roles of LYRM1, KNTC1, IGF2BP2, and CDC6 in PC are still unclear, and further study of their underlying mechanism in PC and potential therapeutic applications is warranted.
The current results demonstrated that the risk score based on the SRGs showed a relatively good and consistent performance in predicting OS in PC patients in the TCGA dataset and the other three validation cohorts (C-indexes of risk score were more than 0.60 and the AUC values at 3-year were more than 0.70 in the four datasets). However, a predictive model based on gene signatures or clinicopathological information alone may be unable to comprehensively elucidate tumor behaviors and their underlying mechanisms. Therefore, a composite and more effective predictive model integrating clinical and gene information is needed.
To the best of our knowledge, a predictive nomogram for PC based on both clinical factors and gene signatures has not been previously reported. In the current study, we generated an effective prognostic nomogram via integrating clinical factors as well as risk score in a TCGA dataset. Good agreement was observed in the calibration curve of our nomogram between the predicted and observed outcomes (Figure 5B). The nomogram demonstrated a greater C-index and AUC values than those of the AJCC stage and risk score (Figure 5C–E). Therefore, our predictive nomogram may facilitate clinicians in predicting the individual risk of patient death and provide guidance for patient assessment and therapeutic decision-making.
However, there are some limitations in the current study. First, we studied the roles of SRGs through data mining only, and no experimental data on the molecular mechanisms of these genes in PC have been reported. Therefore, further experimental studies may enhance our understanding of the biological behavior of PC. Second, the nomogram was developed and validated in a single dataset, and therefore the performance of our model needs to be further validated in independent external datasets with complete gene and clinical information.
Conclusion
The current study identified four new biomarkers that are significantly associated with PC carcinogenesis, progression, and prognosis, which may be helpful in studying underlying carcinogenesis mechanisms and potential therapeutic applications in PC. The predictive nomogram showed robust performance in predicting PC prognosis. Therefore, our model may provide an effective and reliable guide to prognosis assessment and treatment decision-making in the clinic.
Acknowledgments
This work was supported by grants from the Natural Science Foundation of China (81672882 and 81502441), the Science and Technology Support Program of Sichuan Province (2017SZ0003), and Gansu Province Science Foundation for Youths (18JR3RA058).
Author contributions
All authors contributed to data analysis, drafting and revising the article, gave final approval of the version to be published, and agree to be accountable for all aspects of the work.
Disclosure
The authors report no conflicts of interest in this work.
References
Kamisawa T, Wood LD, Itoi T, Takaori K. Pancreatic cancer. Lancet. 2016;388(10039):73–85. | ||
Appel BL, Tolat P, Evans DB, Tsai S. Current staging systems for pancreatic cancer. Cancer J. 2012;18(6):539–549. | ||
Wijnhoven BP, Tran KT, Esterman A, Watson DI, Tilanus HW. An evaluation of prognostic factors and tumor staging of resected carcinoma of the esophagus. Ann Surg. 2007;245(5):717–725. | ||
Oshima M, Okano K, Muraki S, et al. Immunohistochemically detected expression of 3 major genes (CDKN2A/p16, TP53, and SMAD4/DPC4) strongly predicts survival in patients with resectable pancreatic cancer. Ann Surg. 2013;258(2):336–346. | ||
Kong F, Li L, Wang G, Deng X, Li Z, Kong X. VDR signaling inhibits cancer-associated-fibroblasts’ release of exosomal miR-10a-5p and limits their supportive effects on pancreatic cancer cells. Gut. 2018. | ||
Gibori H, Eliyahu S, Krivitsky A, et al. Amphiphilic nanocarrier-induced modulation of PLK1 and miR-34a leads to improved therapeutic response in pancreatic cancer. Nat Commun. 2018;9(1):16. | ||
Mello SS, Valente LJ, Raj N, et al. A p53 Super-tumor Suppressor Reveals a Tumor Suppressive p53-Ptpn14-Yap Axis in Pancreatic Cancer. Cancer Cell. 2017;32(4):460–473. | ||
Chiou SH, Risca VI, Wang GX, et al. BLIMP1 Induces transient metastatic heterogeneity in pancreatic cancer. Cancer Discov. 2017;7(10):1184–1199. | ||
Wartenberg M, Cibin S, Zlobec I, et al. Integrated genomic and immunophenotypic classification of pancreatic cancer reveals three distinct subtypes with prognostic/predictive significance. Clin Cancer Res. 2018;24(18):4444–4454. | ||
Zhang D, Li L, Jiang H, et al. Constitutive IRAK4 activation underlies poor prognosis and chemoresistance in pancreatic ductal adenocarcinoma. Clin Cancer Res. 2017;23(7):1748–1759. | ||
Guo K, Cui J, Quan M, et al. The novel KLF4/MSI2 signaling pathway regulates growth and metastasis of pancreatic cancer. Clin Cancer Res. 2017;23(3):687–696. | ||
Alizadeh AA, Eisen MB, Davis RE, et al. Distinct types of diffuse large B-cell lymphoma identified by gene expression profiling. Nature. 2000;403(6769):503–511. | ||
Perou CM, Sørlie T, Eisen MB, et al. Molecular portraits of human breast tumours. Nature. 2000;406(6797):747–752. | ||
Mcdermott U, Downing JR, Stratton MR. Genomics and the continuum of cancer care. New Engl J Med. 2011;364(4):340–350. | ||
Song J, Xu Q, Zhang H, et al. Five key lncRNAs considered as prognostic targets for predicting pancreatic ductal adenocarcinoma. J Cell Biochem. 2018;119(6):4559–4569. | ||
Shi XH, Li X, Zhang H, et al. A five-microRNA signature for survival prognosis in pancreatic adenocarcinoma based on TCGA data. Sci Rep. 2018;8(1):7638. | ||
Tusher VG, Tibshirani R, Chu G. Significance analysis of microarrays applied to the ionizing radiation response. Proc Natl Acad Sci U S A. 2001;98(9):5116–5121. | ||
Huitzil-Melendez FD, Capanu M, O’Reilly EM, et al. Advanced hepatocellular carcinoma: which staging systems best predict prognosis? J Clin Oncol. 2010;28(17):2889–2895. | ||
Bley TA, Kotter E, Saueressig U, et al. Using receiver operating characteristic methodology to evaluate the diagnostic quality of radiography on paper prints versus film. AJR Am J Roentgenol. 2003;181(6):1487–1490. | ||
Huang JL, Fu YP, Jing CY, et al. A novel and validated prognostic nomogram based on liver fibrosis and tumor burden for patients with hepatocellular carcinoma after curative resection. J Surg Oncol. 2018;117(4):625–633. | ||
Wu J, Zhou L, Huang L, et al. Nomogram integrating gene expression signatures with clinicopathological features to predict survival in operable NSCLC: a pooled analysis of 2164 patients. J Exp Clin Cancer Res. 2017;36(1):4. | ||
Ito K, Murphy D. Application of ggplot2 to pharmacometric graphics. CPT Pharmacometrics Syst Pharmacol. 2013;2:e79. | ||
Moore HE, Andlauer O, Simon N, Mignot E. Exploring medical diagnostic performance using interactive, multi-parameter sourced receiver operating characteristic scatter plots. Comput Biol Med. 2014;47:120–129. | ||
Je˛droszka D, Orzechowska M, Hamouz R, Górniak K, Bednarek AK. Markers of epithelial-to-mesenchymal transition reflect tumor biology according to patient age and Gleason score in prostate cancer. PLoS One. 2017;12(12):e0188842. | ||
Moreno-Betancur M, Sadaoui H, Piffaretti C, Rey G. Survival analysis with multiple causes of death: extending the competing risks model. Epidemiology. 2017;28(1):12–19. | ||
Miller ME, Hui SL, Tierney WM. Validation techniques for logistic regression models. Stat Med. 1991;10(8):1213–1226. | ||
Ma J, Sawai H, Matsuo Y, et al. IGF-1 mediates PTEN suppression and enhances cell invasion and proliferation via activation of the IGF-1/PI3K/Akt signaling pathway in pancreatic cancer cells. J Surg Res. 2010;160(1):90–101. | ||
Roy SK, Srivastava RK, Shankar S. Inhibition of PI3K/AKT and MAPK/ERK pathways causes activation of FOXO transcription factor, leading to cell cycle arrest and apoptosis in pancreatic cancer. J Mol Signal. 2010;5:10. | ||
Wei WT, Chen H, Wang ZH, et al. Enhanced antitumor efficacy of gemcitabine by evodiamine on pancreatic cancer via regulating PI3K/Akt pathway. Int J Biol Sci. 2012;8(1):1–14. | ||
Awasthi N, Yen PL, Schwarz MA, Schwarz RE. The efficacy of a novel, dual PI3K/mTOR inhibitor NVP-BEZ235 to enhance chemotherapy and antiangiogenic response in pancreatic cancer. J Cell Biochem. 2012;113(3):784–791. | ||
Zhang S, Liu Q, Liu Y, Qiao H, Liu Y. Zerumbone, a southeast Asian ginger sesquiterpene, induced apoptosis of pancreatic carcinoma cells through p53 signaling pathway. Evid Based Complement Alternat Med. 2012;2012:1–8. | ||
Li L, Yue GG, Lau CB, et al. Eriocalyxin B induces apoptosis and cell cycle arrest in pancreatic adenocarcinoma cells through caspase- and p53-dependent pathways. Toxicol Appl Pharmacol. 2012;262(1):80–90. | ||
Hastie E, Cataldi M, Steuerwald N, Grdzelishvili VZ. An unexpected inhibition of antiviral signaling by virus-encoded tumor suppressor p53 in pancreatic cancer cells. Virology. 2015;483:126–140. | ||
Wu Z, Cho H, Hampton GM, Theodorescu D. Cdc6 and cyclin E2 are PTEN-regulated genes associated with human prostate cancer metastasis. Neoplasia. 2009;11(1):66–76. | ||
Chen S, Chen X, Xie G, et al. Cdc6 contributes to cisplatin-resistance by activation of ATR-Chk1 pathway in bladder cancer cells. Oncotarget. 2016;7(26):40362–40376. | ||
Mahadevappa R, Neves H, Yuen SM, et al. The prognostic significance of Cdc6 and Cdt1 in breast cancer. Sci Rep. 2017;7(1):985. | ||
Deng Y, Jiang L, Wang Y, et al. High expression of CDC6 is associated with accelerated cell proliferation and poor prognosis of epithelial ovarian cancer. Pathol Res Pract. 2016;212(4):239–246. | ||
Borlado LR, Méndez J. CDC6: from DNA replication to cell cycle checkpoints and oncogenesis. Carcinogenesis. 2008;29(2):237–243. | ||
Chen CH, Lin DS, Cheng CW, et al. Cdc6 cooperates with c-Myc to promote genome instability and epithelial to mesenchymal transition EMT in zebrafish. Oncotarget. 2014;5(15):6300–6311. | ||
Feng L, Barnhart JR, Seeger RC, et al. Cdc6 knockdown inhibits human neuroblastoma cell proliferation. Mol Cell Biochem. 2008;311(1-2):189–197. | ||
Barghash A, Helms V, Kessler SM. Overexpression of IGF2 mRNA-binding protein 2 (IMP2/p62) as a feature of basal-like breast cancer correlates with short survival. Scand J Immunol. 2015;82(2):142–143. | ||
Barghash A, Golob-Schwarzl N, Helms V, Haybaeck J, Kessler SM. Elevated expression of the IGF2 mRNA binding protein 2 (IGF2BP2/IMP2) is linked to short survival and metastasis in esophageal adenocarcinoma. Oncotarget. 2016;7(31):49743–49750. | ||
Kessler SM, Laggai S, Barghash A, et al. IMP2/p62 induces genomic instability and an aggressive hepatocellular carcinoma phenotype. Cell Death Dis. 2015;6:e1894. | ||
Liu W, Li Z, Xu W, Wang Q, Yang S. Humoral autoimmune response to IGF2 mRNA-binding protein (IMP2/p62) and its tissue-specific expression in colon cancer. Scand J Immunol. 2013;77(4):255–260. | ||
Huang RS, Zheng YL, Li C, Ding C, Xu C, Zhao J. MicroRNA-485-5p suppresses growth and metastasis in non-small cell lung cancer cells by targeting IGF2BP2. Life Sci. 2018;199:104–111. | ||
Ye S, Song W, Xu X, Zhao X, Yang L. IGF2BP2 promotes colorectal cancer cell proliferation and survival through interfering with RAF-1 degradation by miR-195. FEBS Lett. 2016;590(11):1641–1650. | ||
Zhu C, Liu YQ, Chen FK, Hu DL, Yu ZB, Qian LM. LYRM1, a gene that promotes proliferation and inhibits apoptosis during heart development. Molecules. 2010;15(10):6974–6982. | ||
Naqvi N, Li M, Yahiro E, Graham RM, Husain A. Insights into the characteristics of mammalian cardiomyocyte terminal differentiation shown through the study of mice with a dysfunctional c-kit. Pediatr Cardiol. 2009;30(5):651–658. | ||
Chan GK, Jablonski SA, Starr DA, Goldberg ML, Yen TJ. Human Zw10 and ROD are mitotic checkpoint proteins that bind to kinetochores. Nat Cell Biol. 2000;2(12):944–947. |
 © 2018 The Author(s). This work is published and licensed by Dove Medical Press Limited. The full terms of this license are available at https://www.dovepress.com/terms.php and incorporate the Creative Commons Attribution - Non Commercial (unported, v3.0) License.
By accessing the work you hereby accept the Terms. Non-commercial uses of the work are permitted without any further permission from Dove Medical Press Limited, provided the work is properly attributed. For permission for commercial use of this work, please see paragraphs 4.2 and 5 of our Terms.
© 2018 The Author(s). This work is published and licensed by Dove Medical Press Limited. The full terms of this license are available at https://www.dovepress.com/terms.php and incorporate the Creative Commons Attribution - Non Commercial (unported, v3.0) License.
By accessing the work you hereby accept the Terms. Non-commercial uses of the work are permitted without any further permission from Dove Medical Press Limited, provided the work is properly attributed. For permission for commercial use of this work, please see paragraphs 4.2 and 5 of our Terms.