")
Back to Journals » International Journal of Nanomedicine » Volume 11
Impairments of spatial learning and memory following intrahippocampal injection in rats of 3-mercaptopropionic acid-modified CdTe quantum dots and molecular mechanisms
Authors Wu T, He K, Ang S, Ying J, Zhang S, Zhang T, Xue Y, Tang M
Received 25 January 2016
Accepted for publication 14 March 2016
Published 10 June 2016 Volume 2016:11 Pages 2737—2755
DOI https://doi.org/10.2147/IJN.S104985
Checked for plagiarism Yes
Review by Single anonymous peer review
Peer reviewer comments 2
Editor who approved publication: Professor Lei Yang
Tianshu Wu,1,2 Keyu He,1,2 Shengjun Ang,1,2 Jiali Ying,1,2 Shihan Zhang,1,2 Ting Zhang,1,2 Yuying Xue,1,2 Meng Tang1,2
1Key Laboratory of Environmental Medicine and Engineering, Ministry of Education, School of Public Health, Collaborative Innovation Center of Suzhou Nano Science and Technology, 2Jiangsu Key Laboratory for Biomaterials and Devices, Southeast University, Nanjing, People’s Republic of China
Abstract: With the rapid development of nanotechnology, quantum dots (QDs) as advanced nanotechnology products have been widely used in neuroscience, including basic neurological studies and diagnosis or therapy for neurological disorders, due to their superior optical properties. In recent years, there has been intense concern regarding the toxicity of QDs, with a growing number of studies. However, knowledge of neurotoxic consequences of QDs applied in living organisms is lagging behind their development, even if several studies have attempted to evaluate the toxicity of QDs on neural cells. The aim of this study was to evaluate the adverse effects of intrahippocampal injection in rats of 3-mercaptopropionic acid (MPA)-modified CdTe QDs and underlying mechanisms. First of all, we observed impairments in learning efficiency and spatial memory in the MPA-modified CdTe QD-treated rats by using open-field and Y-maze tests, which could be attributed to pathological changes and disruption of ultrastructure of neurons and synapses in the hippocampus. In order to find the mechanisms causing these effects, transcriptome sequencing (RNA-seq), an advanced technology, was used to gain the potentially molecular targets of MPA-modified CdTe QDs. According to ample data from RNA-seq, we chose the signaling pathways of PI3K–Akt and MPAK–ERK to do a thorough investigation, because they play important roles in synaptic plasticity, long-term potentiation, and spatial memory. The data demonstrated that phosphorylated Akt (p-Akt), p-ERK1/2, and c-FOS signal transductions in the hippocampus of rats were involved in the mechanism underlying spatial learning and memory impairments caused by 3.5 nm MPA-modified CdTe QDs.
Keywords: CdTe quantum dots, neurotoxicology, nanotoxicology, learning and memory, RNA-seq, p-AKT, p-ERK1/2, c-FOS
Introduction
With the booming development of nanotechnology, quantum dots (QDs), nanometer-scale crystalline semiconductors widely used in electronics, have provided great opportunities in the field of neuroscience, due to their excellent optical properties and small size. Functionalized QDs could be a remarkable imaging toolbox for diagnosis of disorders in the nervous system. Feng et al used a QD probe conjugated with an anti-amyloid-β antibody to track the in vivo state of amyloid-β accumulation in mice, suggesting a potential use of QDs for early molecular diagnostic imaging of Alzheimer’s disease.1 Apart from reducing undesirable effects of medication and improving therapeutic efficacy, the nanoscale drug delivery of QDs is capable of visualizing and monitoring the process of drug delivery inside a living body.
However, although QDs could facilitate the diagnosis and therapy of some neurological disorders, even cure some presently incurable diseases, they will not be allowed to be used in human beings unless their toxicological profile is clear and methods to control their toxicity are mature. So far, there have been an increasing number of neurotoxicological studies showing that QDs could induce some generally toxic effects, such as damaging the construction and function of neurons and oxidative stress injury, and in particular neurotoxicity, such as behavior changes, neural electrophysiological damage, and learning and memory impairment.2–6 However, the potential molecular mechanisms of QDs causing these neurotoxic effects at the whole-animal level are underrepresented, which is the important information we hope this study will provide.
The methods used to study the toxic effects of QDs have been mostly based on traditional assays, which are highly reliable and reproducible, but provide less information on specific biological processes and well-defined molecular pathways. Transcriptome sequencing, also known as RNA-seq, is of growing importance in understanding how altered expression of genetic variants contributes to complex diseases. RNA-seq is suitable for gaining mechanistic insights of changes induced by various chemicals, often revealing impacts on biological pathways and processes that had not previously been considered. Even though the use of RNA-seq is becoming more and more popular in toxicology, to date the technology has found only a very marginal application to the study of the effects of QDs in biological systems. Given the substantial lack of knowledge concerning the interaction of novel nanoparticle QDs with the central nervous system (CNS), we chose to rely on new technology, applying an advanced whole-transcriptome analysis to investigate the modulation of gene expression upon treatment of the rat hippocampus with two sizes of CdTe QDs modified with 3-mercaptopropionic acid (MPA), which is one of the most commonly used QDs. Our study group has been studying the toxicity of MPA-modified CdTe QDs for several years, and found these QDs at certain concentrations were able to cause adverse effects on somatic cells, neurons, and model animals, but the potential mechanisms were not clear.7–10
In our study, we used intrahippocampal injection of MPA-modified CdTe QDs to stimulate a successfully clinical application of QDs for diagnosis and therapy of neurological disorders in the hippocampus. As the tested MPA-modified CdTe QDs were not conjugated with any biomolecules, our findings of MPA-modified CdTe QDs’ toxic effects and potential mechanisms in the CNS, especially the hippocampus, would be clear and explicit. During the study, we observed some adverse effects on MPA-modified CdTe-treated rats behavior, hippocampus, and ultrastructure of neurons and synapses, which could be explained by the findings obtained from RNA-seq, revealing the existence of a rich biodiversity of MPA-modified CdTe QDs with two different sizes. We further found that the downregulated protein expression of phosphorylated Akt (p-Akt), p-ERK1/2, and c-Fos induced by MPA-modified CdTe QDs in rat hippocampus was associated with impaired spatial learning and memory.
Materials and methods
Quantum dot preparation
The water-soluble MPA-modified CdTe QDs used in this study were prepared as described previously.7,11 Before the study, we evaluated the physicochemical properties of these QDs. High-resolution transmission electron microscopy (TEM) revealed that the average sizes of the MPA-modified CdTe QDs were 2.2±0.25 nm and 3.5±0.49 nm (Figure S1). Dynamic light scattering confirmed that comparable dimensions were 7.39±0.74 nm and 9.82±1.14 nm for 2.2 nm and 3.5 nm MPA-modified CdTe QDs in water solution, respectively (Figure S2A and B). The MPA contributed substantially to the size of the QDs in water. The surface charges through ζ-potential measurement were −31.84±3.06 mV and −26.46±4.75 mV for 2.2 nm and 3.5 nm MPA-modified CdTe QDs in water solution, respectively (Figure S2C and D). The absorption peaks occurred at 514 nm and 578 nm, and the photoluminescence-emission peaks were at 547 nm and 622 nm (excitation wavelength 388 nm) for 2.2 nm and 3.5 nm MPA-modified CdTe QDs in water solution, respectively (Figure S3). Three concentrations of MPA-modified CdTe QD suspensions (400 μg/mL, 800 μg/mL, and 1,600 μg/mL) were prepared by diluting the stock solution (2,200 μg/mL) of QDs, which had been sonicated for 20 minutes, with normal saline just prior to exposure. The concentrations for QDs used here were selected based on preliminary experiments and a series of previous studies.7,9,12
Animals and treatment
A total of 49 male Wistar rats aged 6 weeks with an average body weight of 130–150 g were purchased from Shanghai Super B&K Laboratory Animal Corp Ltd (Shanghai, People’s Republic of China). Seven rats were in each group. All rats were housed in stainless steel cages in a ventilated animal facility with the temperature maintained at 22°C±2°C and relative humidity of 65%±10% under a 12-hour light/dark cycle and fed with distilled water and sterilized food. All animal procedures were performed in strict accordance with the animal protocols approved by the Institutional Animal Care and Use Committee of Southeast University.
Rats were anesthetized with chloral hydrate (0.4 g/kg intraperitoneally) and positioned in a stereotaxic apparatus at a surgical level with supplemental injections as needed. The skull was exposed, and two holes were drilled in the skull at stereotaxic coordinates according to the atlas of Paxinos and Franklin: anteroposterior −3.8 mm from bregma; mediolateral ±2 mm from midline; and dorsoventral −3.0 mm from the skull.13 An injection cannula (21 gauge) was inserted into the holes, and 5 μL of different doses of MPA-modified CdTe QDs (six treatments) or normal saline (the control) were injected into each side of the CA1 region at a rate of 10 nL/s with an UltraMicroPump (World Precision Instruments, Sarasota, FL, USA) and the needles left in place for an additional 6 minutes to facilitate diffusion of the solution away from the needle tip. After 3 days of recovery, rats were used for the following experiments.
Open-field test
The open field (Jiliang, Shanghai, People’s Republic of China) contained a 40×40 cm floor and 65 cm high walls. The floor was divided by lines into 16 squares of equal size. A rat was placed in one of four corners of the open field for 3 minutes. Recorded data included distance moved, velocity, duration of movement (velocity >1.75 cm/s), frequency and time spent in the center of the square arena, rearing incidence (the mouse lifts both its forefeet off the floor), and number of feces.
Y-maze test
The Y-maze (Jiliang, Shanghai, People’s Republic of China) comprised three similar arms arranged 120° apart around a central joining region with an electrified grid floor. A signal light was located at the end of each arm. When the test began, one arm with the light on indicated the shock-free area, whereas the other two arms with the light off indicated a 0.7 mV electric current would pass through the floor (ie, shock area). The rats were placed in a random arm of the Y-maze and allowed to explore for 3 minutes. Electric shocks were delivered to the arms clockwise. The correct response was the rat to run to the light zone within 10 seconds after the light shifted from one arm to another arm. During the test, the rats were considered to have learned the task when they had performed nine correct responses of the ten tests. The learning rate was measured by the number of sessions required to achieve this criterion. At 24 hours later, the test was repeated, and the percentage of correct responses was a measure of memory.
Preparation of hippocampi and histopathological examination
After the Y-maze test (9 days after QD-exposure), all rats were killed after being anesthetized using diethyl ether. The brains were quickly removed and placed on ice, and the hippocampi were dissected and frozen in liquid nitrogen for further tests. The histopathological examination was performed using standard laboratory procedures. The brain tissues were dehydrated using an automatic tissue spine-dryer, embedded in paraffin blocks, and sliced to 5 μm thickness. After hematoxylin–eosin staining, the sections were evaluated by a histopathologist unaware of the treatment allocation using light microscopy. Then, fluorescent and corresponding bright-field images of the slices were observed by fluorescent microscopy (FSX100; Olympus, Tokyo, Japan) to assess the localization of QDs.
Observation of ultrastructure of hippocampal neurons and synapses
The hippocampi were fixed in fresh 0.1 M sodium cacodylate buffer containing 2.5% glutaraldehyde, followed by a 2-hour fixation period at 4°C with 1% osmium tetroxide in 50 mM sodium cacodylate (pH 7.2–7.4). The specimens were dehydrated in a graded series of ethanol (75%, 85%, 95%, and 100%), embedded in Epon 812, and sliced in an ultramicrotome. Ultrathin sections were strained with uranyl acetate and lead citrate, and observed by TEM (Tecnai G2 Spirit BioTwin; FEI, Hillsboro, OR, USA).
Transcriptome-library preparation and sequencing
Total RNA was obtained from rats exposed to 1,600 μg/mL 2.2 nm or 3.5 nm MPA-modified CdTe QDs using Trizol (Thermo Fisher Scientific, Waltham, MA, USA) according to the manufacturer’s protocol. Then, total genomic DNA was removed from RNA samples using DNase I (New England BioLabs, Ipswich, MA, USA). RNA purity was assessed using the NanoDrop 2000. Each RNA sample had an A260:A280 ratio above 1.9 (data not shown). Concentrations of the RNA were assessed by Qubit 2.0 (Thermo Fisher Scientific). RNA integrity number was determined for each sample using a Bioanalyzer RNA 6000 Pico Kit (Agilent Technologies, Santa Clara, CA, USA). The complementary cDNA libraries were prepared using the TruSeq RNA Sample Prep Kit v2 (Illumina, San Diego, CA, USA) as per the manufacturer’s instructions. The final product was assessed for size distribution using a Bioanalyzer DNA High Sensitivity Kit (Agilent Technologies). Each library was loaded into one lane of the Illumina HiSeq 2500 for 2×125 bp pair-end sequencing. Eight libraries were pooled per HiSeq lane, followed by onboard cluster generation on a Rapid Run pair-end flow cell and subsequent 125 cycles’ sequencing (v3 sequencing kit) according to the manufacturer’s instructions.
Bioinformatic analysis
FastQC was used to control the quality of the data. An initial filtering step was performed to exclude poor-quality reads, including discarding reads with adaptors or unknown base more than 10% and low-quality reads (reads with >50% bases with quality value ≤5). The clean reads were first mapped onto the rat reference genome (Rn6) independently by TopHat 2.0.10. The “-G” option of TopHat, together with the gene-transfer format file of Ensembl gene annotation, was used for read mapping.14–16 The remaining parameters were set to default values. Then, the mapped reads of each sample were assembled separately using Cufflinks Version 2.2.1.15 To get high-confidence isoforms, only those assembled transcript with fragments per kilobase of transcript per million mapped reads >0 were retained for further analyses. Finally, the filtered transcriptome was merged to generate a final transcriptome using Cuffmerge.16 Figure 1 shows the main flow diagram of bioinformatic analysis.
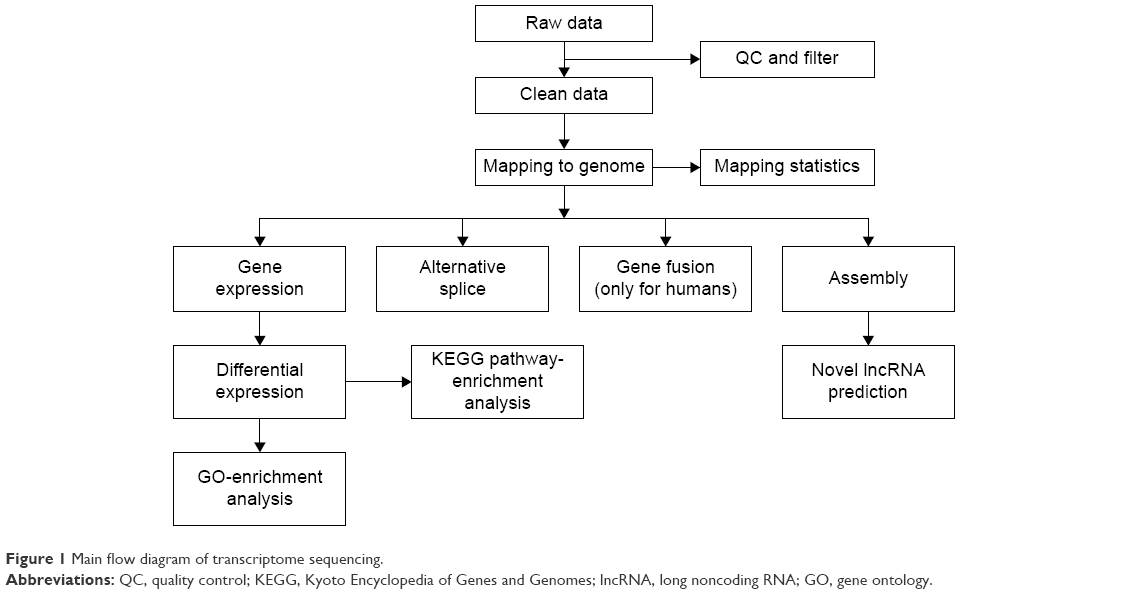 | Figure 1 Main flow diagram of transcriptome sequencing. |
Based on the TopHat binary alignment/map file, HTSeq 0.6.1 was used to estimate and quantify gene expression with default parameters, yielding raw read count for each of the protein and long noncoding RNA genes.17 Gene expression was measured in reads per kilobase of exons per million reads mapped. Finally, EdgeR was used to normalize the expression levels in both samples to identify the differentially expressed transcripts by pairwise comparisons.18
The difference was considered significant if the false-discovery rate was ≤0.05. Gene ontology (GO) enrichment analysis provides all GO terms that are significantly enriched in differentially expressed genes (DEGs), relative to a genome background, and filters the DEGs that correspond to specific biological functions. This method first maps all DEGs to GO terms in the database http://www.geneontology.org, calculating gene numbers for every term, and then uses the hypergeometric test to find significantly enriched GO terms in the input list of DEGs. The Database for Annotation, Visualization, and Integrated Discovery (DAVID; http://david.abcc.ncifcrf.gov) was used to enrich the DEGs.19 The calculated P-value goes through Bonferroni correction, taking a corrected P-value ≤0.05 as a threshold. Kyoto Encyclopedia of Genes and Genomes (KEGG) pathway-enrichment analysis identifies significantly enriched metabolic pathways or signal-transduction pathways in the whole-genome background using the KEGG oncology-based annotation system,20 with a false-discovery rate ≤0.05 as a threshold to identify an enrichment pathway.
Quantitative real-time reverse-transcription polymerase chain-reaction analysis
Equal quantities of total RNA of each MPA-modified CdTe QD-treatment group were used for quantitative real-time reverse-transcription polymerase chain-reaction (qRT-PCR) analysis, which was carried out as described earlier. The qRT-PCR primers were designed by Primer Premier software, based on the National Center for Biotechnology Information (Table 1). Relative quantities of messenger RNA (mRNA) were normalized against the mRNA of the reference gene – ACTB. Three replicates were used for each qRT-PCR analysis.
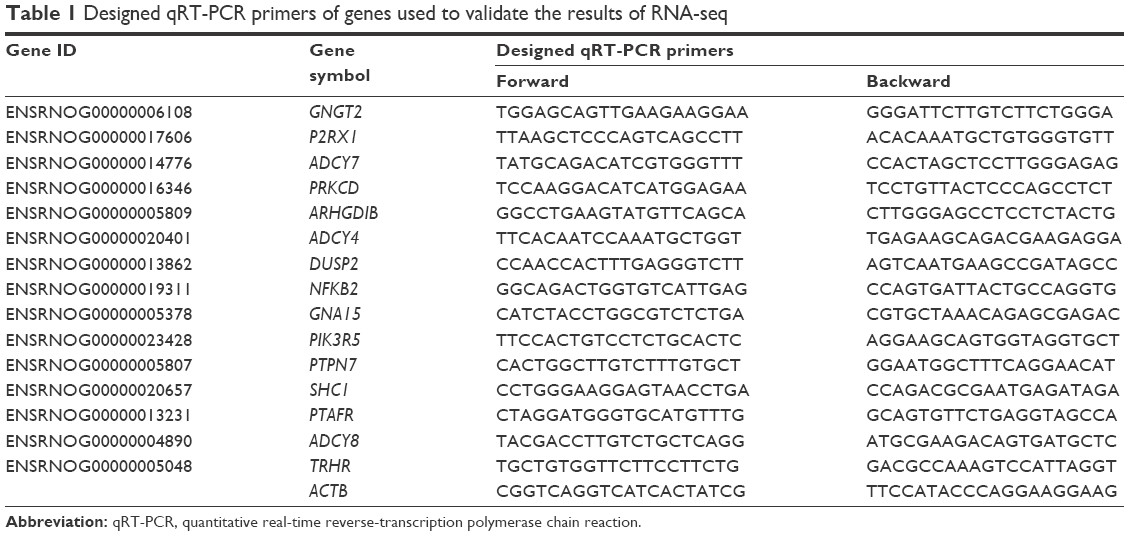 | Table 1 Designed qRT-PCR primers of genes used to validate the results of RNA-seq |
Western blotting analysis
Both total and phosphorylated protein contents were extracted by radioimmunoprecipitation assay with phenylmethylsulfonyl fluoride (100:1; Beyotime Institute of Biotechnology, Shanghai, People’s Republic of China). After centrifugation at 12,000 rpm at 4°C for 15 minutes, the supernatants were collected and stored at −80°C until use. The bicinchoninic acid protein assay (KeyGen Biotech, Nanjing, People’s Republic of China) was used to measure the protein concentrations of the extracts of each group. An equal amount (50 mg) of protein was separated on a 10% sodium dodecyl sulfate polyacrylamide gel-electrophoresis gel and electrotransferred to polyvinylidene difluoride membranes that were blocked with 5% bovine serum albumin in Tris-buffered saline containing 0.05% Tween 20 and were rocked gently for at least 1 hour at room temperature. Then, the membranes were incubated with first antibodies of anti-c-Fos (1:200 dilution), anti-ERK1/2 (1:1,000 dilution), anti-p-ERK1/2 (1:1,000 dilution) (Abcam, Cambridge, UK), anti-Akt (1:1,000 dilution), anti-p-Akt (1:2,000 dilution), and anti-GAPDH (1:1,000 dilution) (Cell Signaling Technology Inc, Danvers, MA, USA) at appropriate dilution overnight at 4°C. After being washed with Tris-buffered saline containing 0.05% Tween 20 five times, the membranes were incubated with horseradish peroxidase-conjugated goat antirabbit secondary antibody (1:1,000 dilution) (Beyotime Institute of Biotechnology) for 1 hour at room temperature. Protein bands were visualized using the West Pico chemiluminescence reagent (Thermo Fisher Scientific), and the films were scanned and analyzed by ImageJ 1.48 software. Each experiment was conducted at least three times.
Data analysis
All data are displayed as mean ± standard deviation. Statistical analysis was performed using SPSS 19.0 (IBM Corporation, Armonk, NY, USA). One-way analysis of variance was used to determine the statistical significance between control and exposed groups, followed by Dunnett’s t-test to determine the significance of differences between the groups. Probability levels of <0.05 and <0.01 were considered statistically significant.
Results
MPA-modified CdTe QDs caused mild effects on the learning efficiency and spatial memory of rats
The open-field test is a widely used procedure for examining the exploratory behavioral effects of chemicals. The role of novelty in the expression of behavioral sensitization will provide neurotoxicity information. Apart from a significantly decreased duration of movement in the high-dose 2.2 nm CdTe-exposure group (P<0.05), other parameters in treatment groups were not significantly different from those in the control (P>0.05) (Table 2).
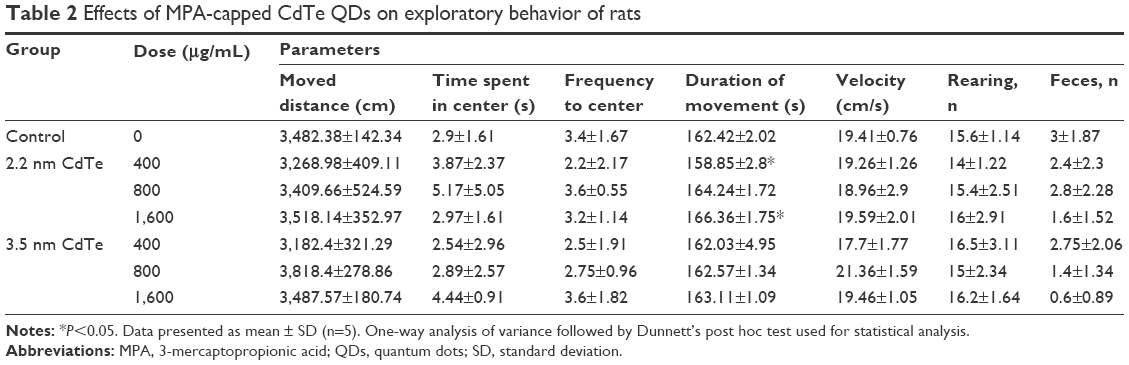 | Table 2 Effects of MPA-capped CdTe QDs on exploratory behavior of rats |
We used the light foot shock-avoidance Y-maze, which is a good method to test learning and memory function, especially on associative learning and spatial memory of rats.21,22 Rats prefer to enter the dark zones at the beginning of the test by nature. After several foot shocks, most rats soon learned to escape from the dark to the light zone to avoid electric shocks, and they learned and remembered that the light zone was a safe region. Therefore, the rats would run to the light zone directly when the light was shifted from one arm to the other. After rats were intrahippocampally injected with 1,600 μg/mL 3.5 nm MPA-modified CdTe QDs, the duration of all responses was significantly larger than those in the control (P<0.05), and the correct rate after 24 hours was significantly lower than that in the control (P<0.05), which indicated that learning efficiency and memory ability were poorer. However, no significant differences were detected in learning or memory parameters between the control and treatment groups (P>0.05) (Table 3).
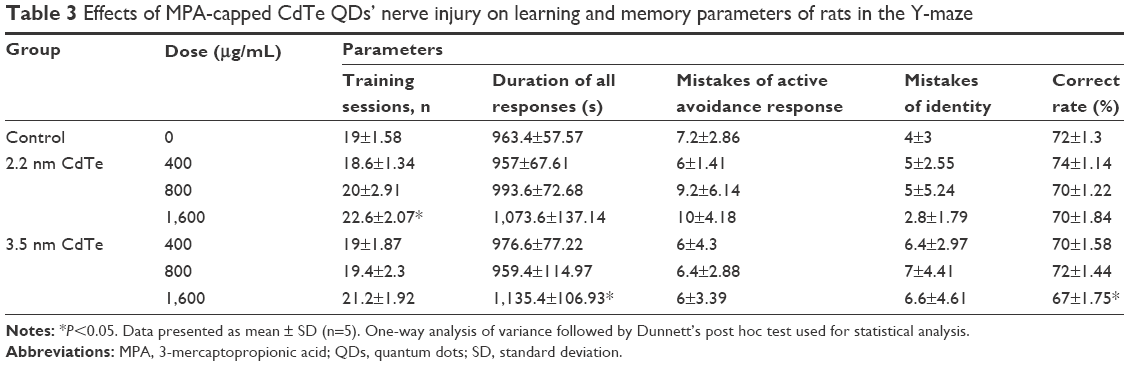 | Table 3 Effects of MPA-capped CdTe QDs’ nerve injury on learning and memory parameters of rats in the Y-maze |
Biodistribution of MPA-modified CdTe QDs in the brain
As general fluorescence microscopy cannot achieve nanoscale resolution, we did not observe single nanosized QDs in the brain slices. Fluorescence microscopy was merely able to capture the fluorescence from a certain amount of accumulated QDs, resulting in less clear fluorescent images. However, we still observed QDs fluorescence (green for 2.2 nm CdTe QDs, red for 3.5 nm CdTe QDs), due to their long-lasting fluorescence, even after 9 days of QD exposure. Flashing fluorescent points were shown in the hippocampi of rat brains treated with 1,600 μg/mL MPA-modified CdTe QDs (Figure 2), while the fluorescence in the 400 μg/mL and 800 μg/mL CdTe QD-treatment groups was barely visible (data not shown).
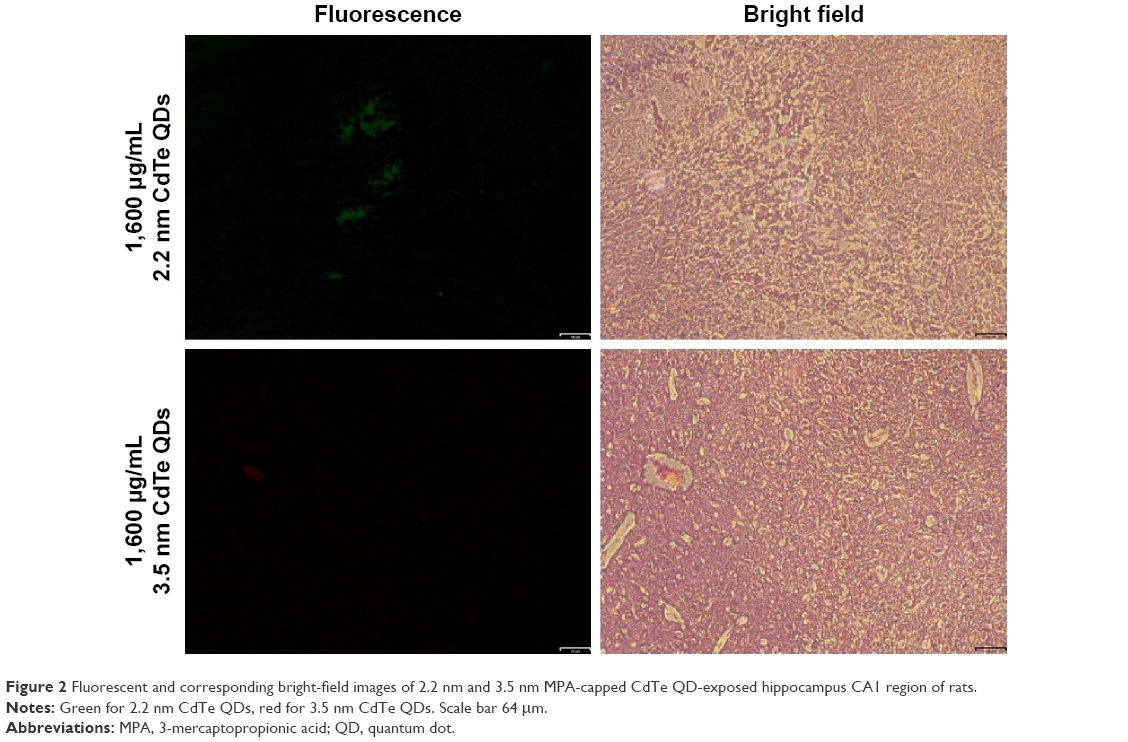 | Figure 2 Fluorescent and corresponding bright-field images of 2.2 nm and 3.5 nm MPA-capped CdTe QD-exposed hippocampus CA1 region of rats. |
MPA-modified CdTe QDs induced histopathological changes in the hippocampus
Hematoxylin–eosin staining showed that inflammatory cell infiltration in the hippocampal CA1 region of rats in the >800 μg/mL 2.2 nm and 3.5 nm MPA-modified CdTe QD-treatment groups was generally severer than that in the control (Figure 3). Moreover, irregular arrangement of neurons and cellular swelling in the hippocampus were shown, and karyopyknosis and dark staining were observed in some neuron nuclei. There were some foamy cells in the hippocampus, which could have been microglia-consuming QDs, necrotic tissue, or lipids. More seriously, a large amount of cell necrosis was observed in some hippocampi. These pathological lesions were not observed in rats treated with 400 μg/mL CdTe QDs of the two sizes (Figure 3).
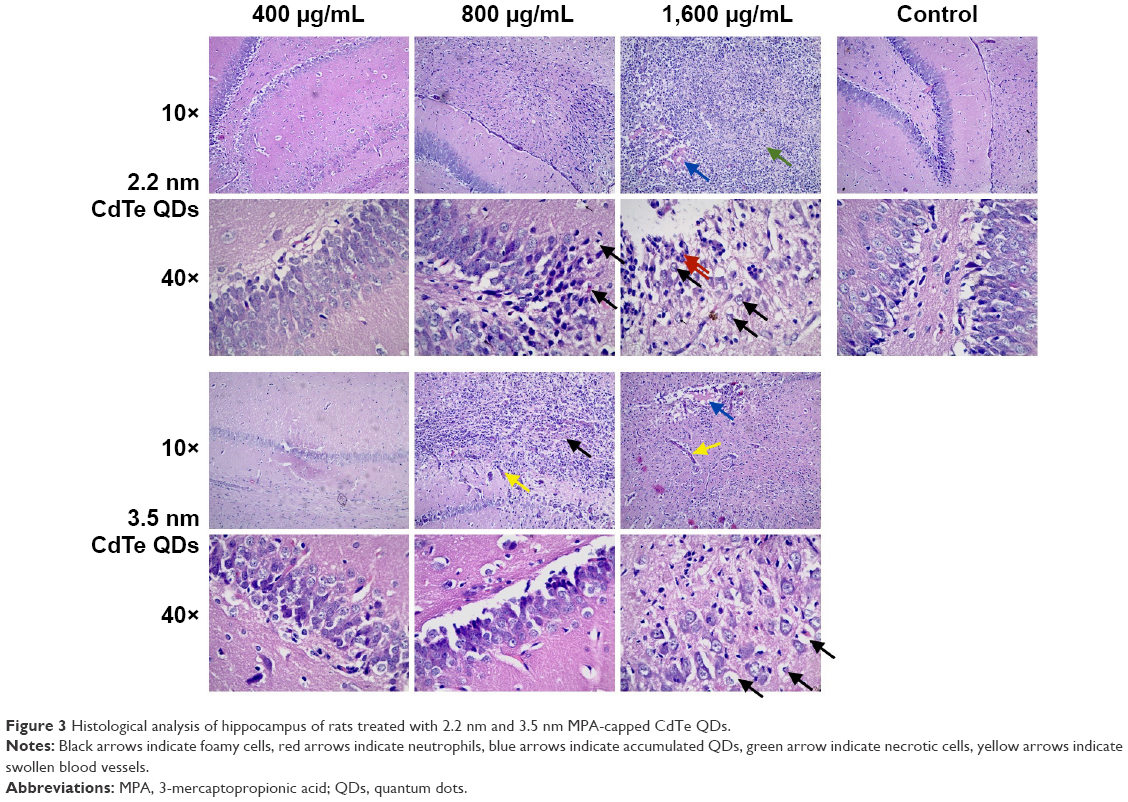 | Figure 3 Histological analysis of hippocampus of rats treated with 2.2 nm and 3.5 nm MPA-capped CdTe QDs. |
MPA-modified CdTe QDs changed the ultrastructure of hippocampal neurons and synapses
TEM images in Figure 4 show that neurons in the control group were normal, revealing that shapes of cells and nuclei were irregular, nucleus chromatins stacked, organelles in the cytoplasm abundant, and rough endoplasmic reticulum and free ribosome aggregated into piles. Synapses in the control group were normal as well, showing that presynaptic membranes contained multiple cavities and postsynaptic membranes were dark due to high electron density. In the high-dose MPA-modified CdTe QD-treatment groups, pathological changes in several neurons and synapses were relatively common and severe, including ruptured nuclear membrane, dissolved mitochondrial membrane, aggregated endoplasmic reticulum, and swollen postsynaptic membrane (Figure 4). There were some visible black particles observed in lysosomes of some neurons of the QD-treatment groups, perhaps accumulated QDs not belonging to any particle seen in the control group (Figure S4). The rat hippocampal neurons and synapses in the low- and middle-dose QD-treatment groups were not obviously different from those in the control group and showed only occasional neuronal cytoplasms or postsynaptic membranes that were slightly swollen (Figure S5).
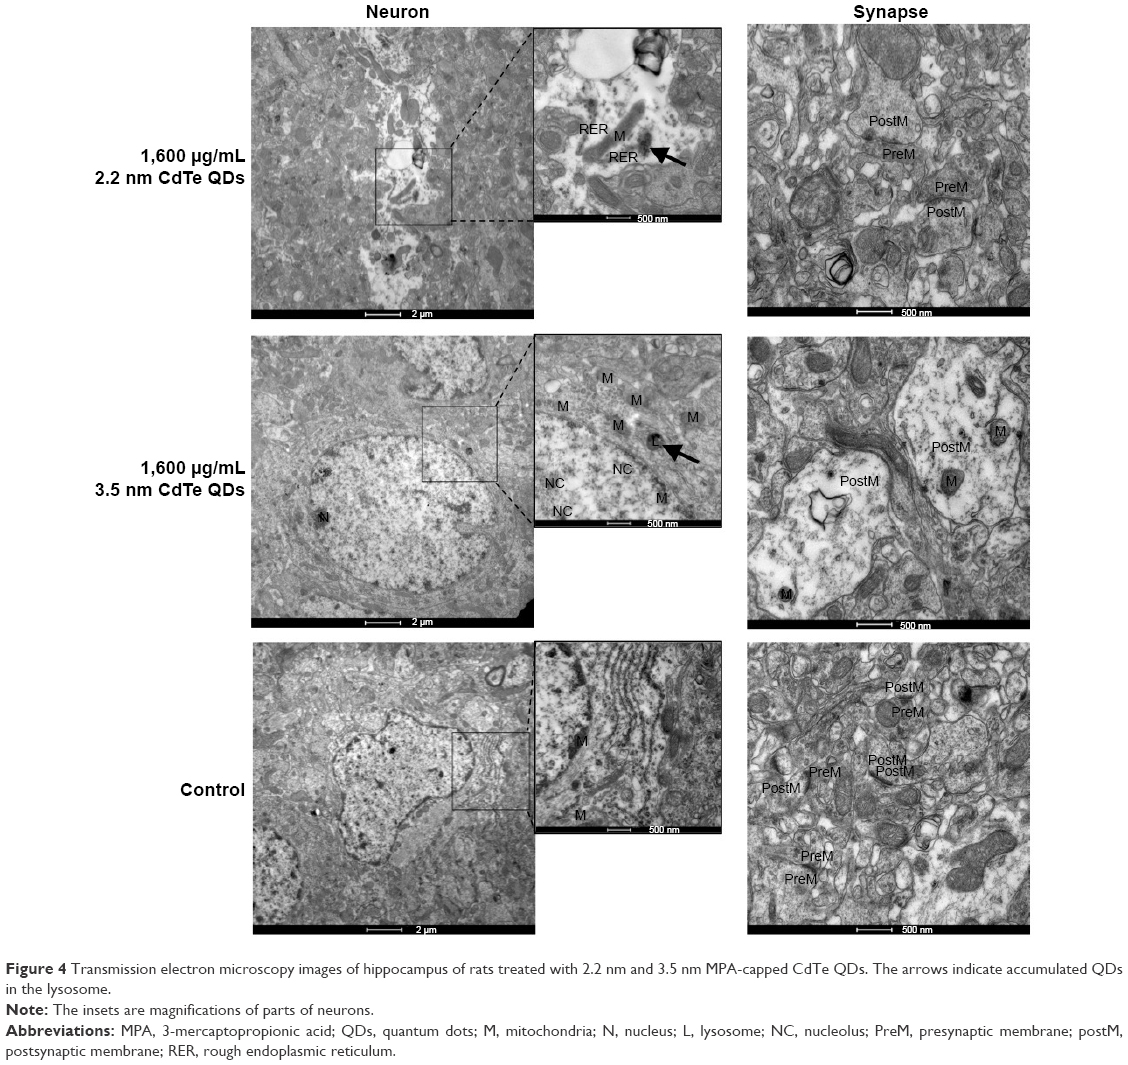 | Figure 4 Transmission electron microscopy images of hippocampus of rats treated with 2.2 nm and 3.5 nm MPA-capped CdTe QDs. The arrows indicate accumulated QDs in the lysosome. |
RNA-seq of the rat hippocampal transcriptome
There were three complementary DNA-library preparations sequenced from rat hippocampi sampled from the negative control and 1,600 μg/mL 2.2 nm and 3.5 nm MPA-modified CdTe QD-treatment groups. The average number of total reads produced for each library was approximately 50 million (Table 4). After filtering, 44.7–51.8 million clean reads were mapped onto a reference rat-genome data set (University of California Santa Cruz Version rn6), and then the number of unambiguous clean reads for each gene was calculated and normalized to the number of transcripts per million clean reads. Finally, there were 28.1–44.2 million unique mapped reads, and the percentages of these mapped reads of the three groups were all over 95% (Table 4), fully saturated and large enough for gene-expression analysis.
 | Table 4 Summary of RNA-seq data collected from hippocampal tissues of Wistar rats treated with MPA-capped CdTe QDs |
Differentially expressed genes in MPA-modified CdTe QD-treatment groups
Based on the DEGs calculated by EdgeR, there were 1,192 genes in total differently expressed in two treatment groups, and 55 and 1,180 gene expressions were significantly different from the control group in 1,600 μg/mL 2.2 nm and 3.5 nm MPA-modified CdTe QD-treatment groups, respectively (Figure 5). Heat maps were generated to show the expression values of differently expressed transcripts, including protein genes, known long noncoding RNA, and novel long noncoding RNA, for each group by color based on read count, while as normalized expression-value z score moved from −1 to 1, the color changed from red to green (Figure 6). The magnitude distribution of those significantly changed genes in the 2.2 nm and 3.5 nm MPA-modified CdTe QD-treatment groups was illustrated by MA plots and volcano diagrams (Figure 7).
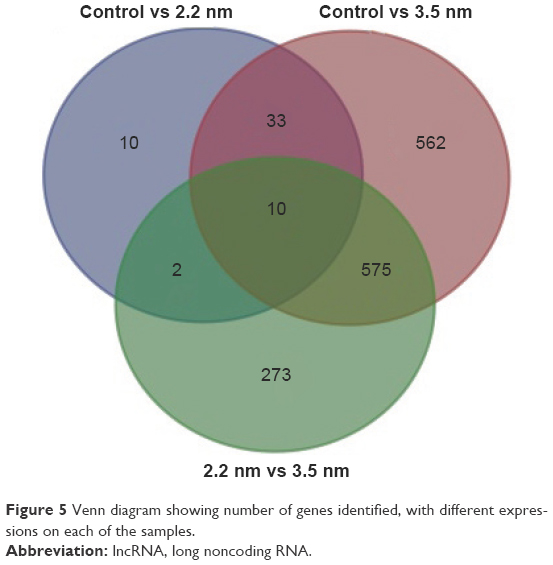 | Figure 5 Venn diagram showing number of genes identified, with different expressions on each of the samples. |
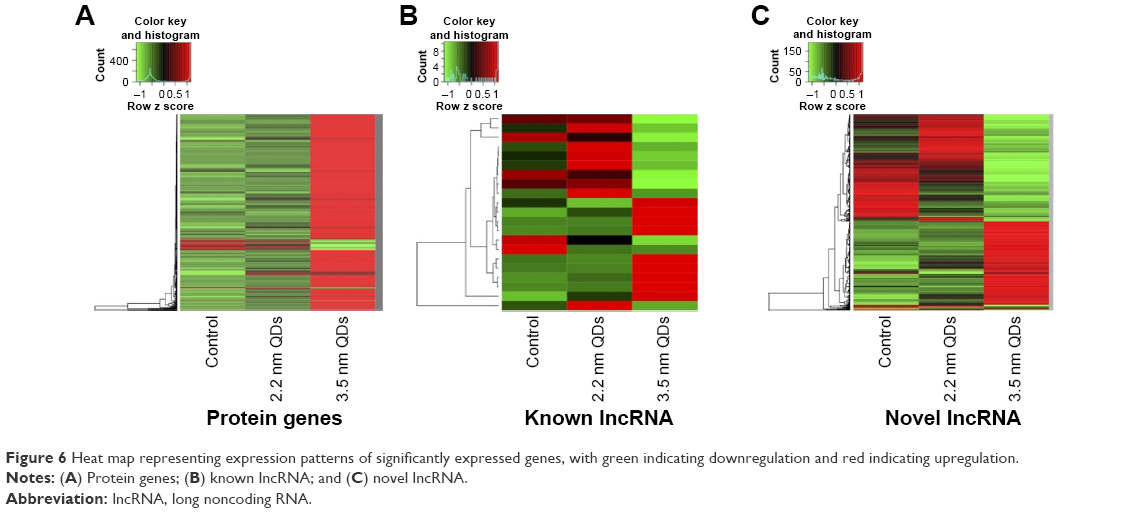 | Figure 6 Heat map representing expression patterns of significantly expressed genes, with green indicating downregulation and red indicating upregulation. |
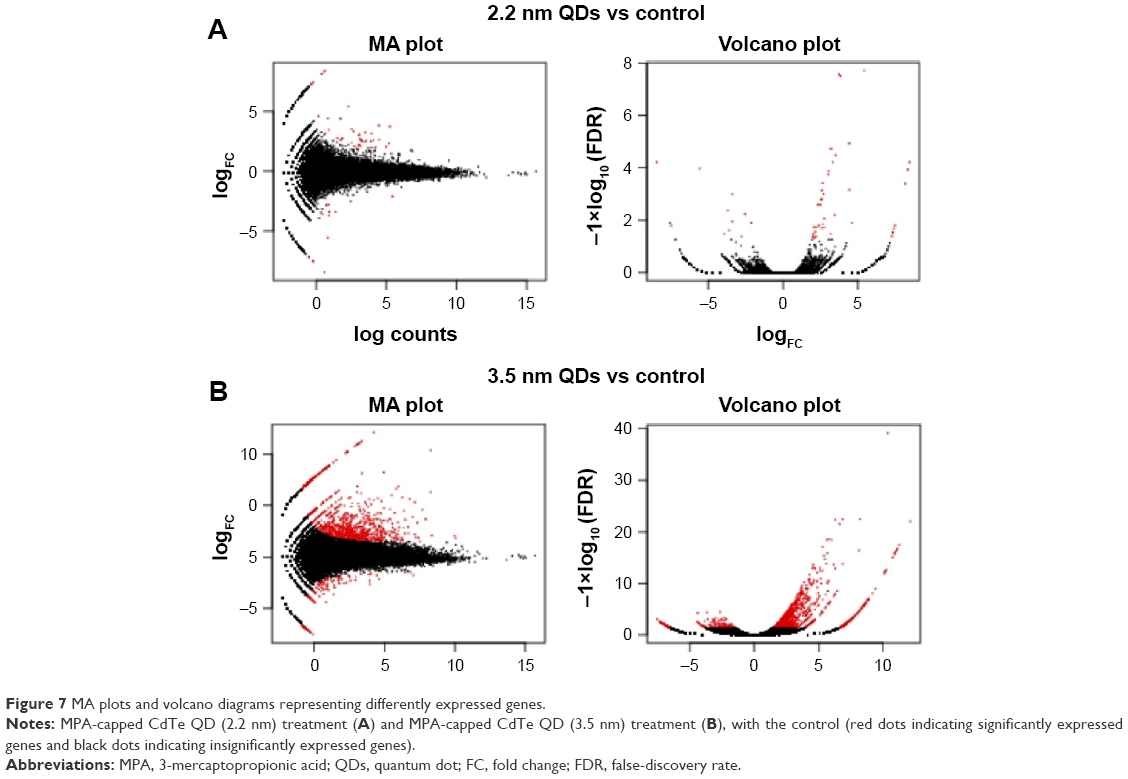 | Figure 7 MA plots and volcano diagrams representing differently expressed genes. |
GO enrichment analysis and KEGG enrichment analysis of DEGs
All DEGs identified during CdTe QD exposure were annotated for GO enrichment analysis according to the DAVID dataset. There are three ontologies, ie, biological process, molecular function, and cellular component, that include several terms individually in GO. Following 1,600 μg/mL 2.2 nm MPA-modified CdTe QD exposure, the GO terms of biological process “immune response” and “response to virus” (Figure 8) and only the term of cellular component “integrin complex” were enriched. However, following exposure to 3.5 nm MPA-modified CdTe QDs with the same dose, DEGs were assigned to 135 GO terms in all three ontologies, and biological processes appeared to capture most of these terms (Table S1). The GO terms, which are significantly enriched in DEGs, were relevant to distinct biological processes, with the 15 highest percentages of genes shown in Figure 8.
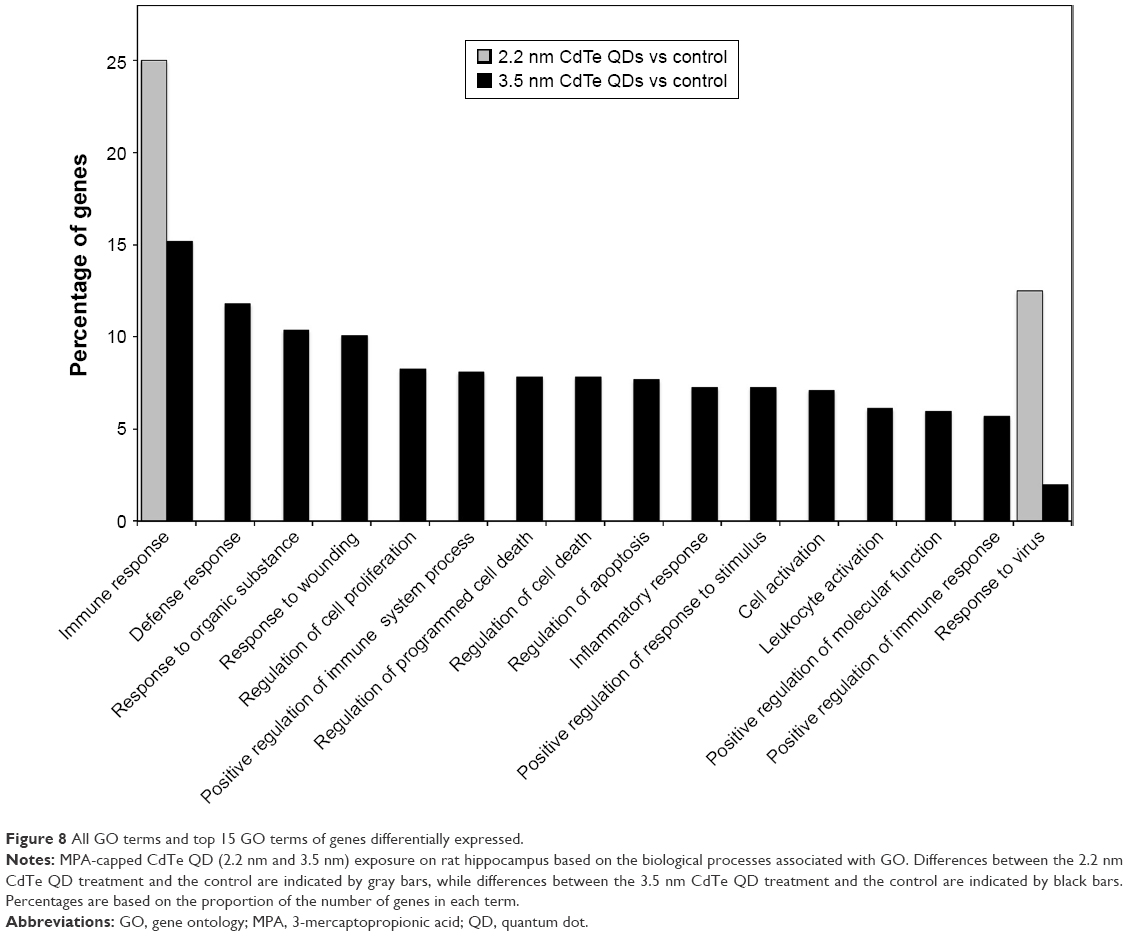 | Figure 8 All GO terms and top 15 GO terms of genes differentially expressed. |
Compared to the control group, four DEGs enriched pathways in the 2.2 nm CdTe QD-treatment group, while 40 DEGs enriched pathways in the 3.5 nm CdTe QD-treatment group (Table 5 and Table S2). As shown in Table 5, all DEGs enriched pathways in the 2.2 nm CdTe QD-treatment group, and in the 3.5 nm CdTe QD-treatment group, the top 15 DEGs enriched pathways are listed, where most signaling pathways were related to the rat immune system, including some classical inflammatory response and apoptosis pathways, such as the cytosolic DNA-sensing pathway, Toll-like receptor-signaling pathway, and cytokine–cytokine receptor interaction. Figure 9 shows the pathways involving changes of genes in immune responses after 3.5 nm MPA-modified CdTe QD treatment in rat hippocampi.
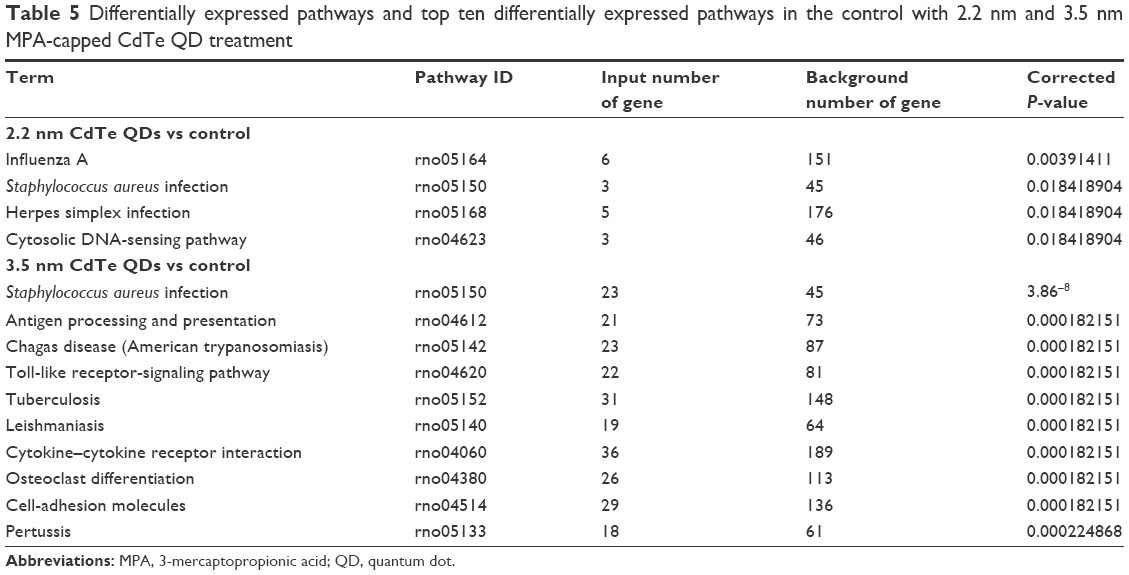 | Table 5 Differentially expressed pathways and top ten differentially expressed pathways in the control with 2.2 nm and 3.5 nm MPA-capped CdTe QD treatment |
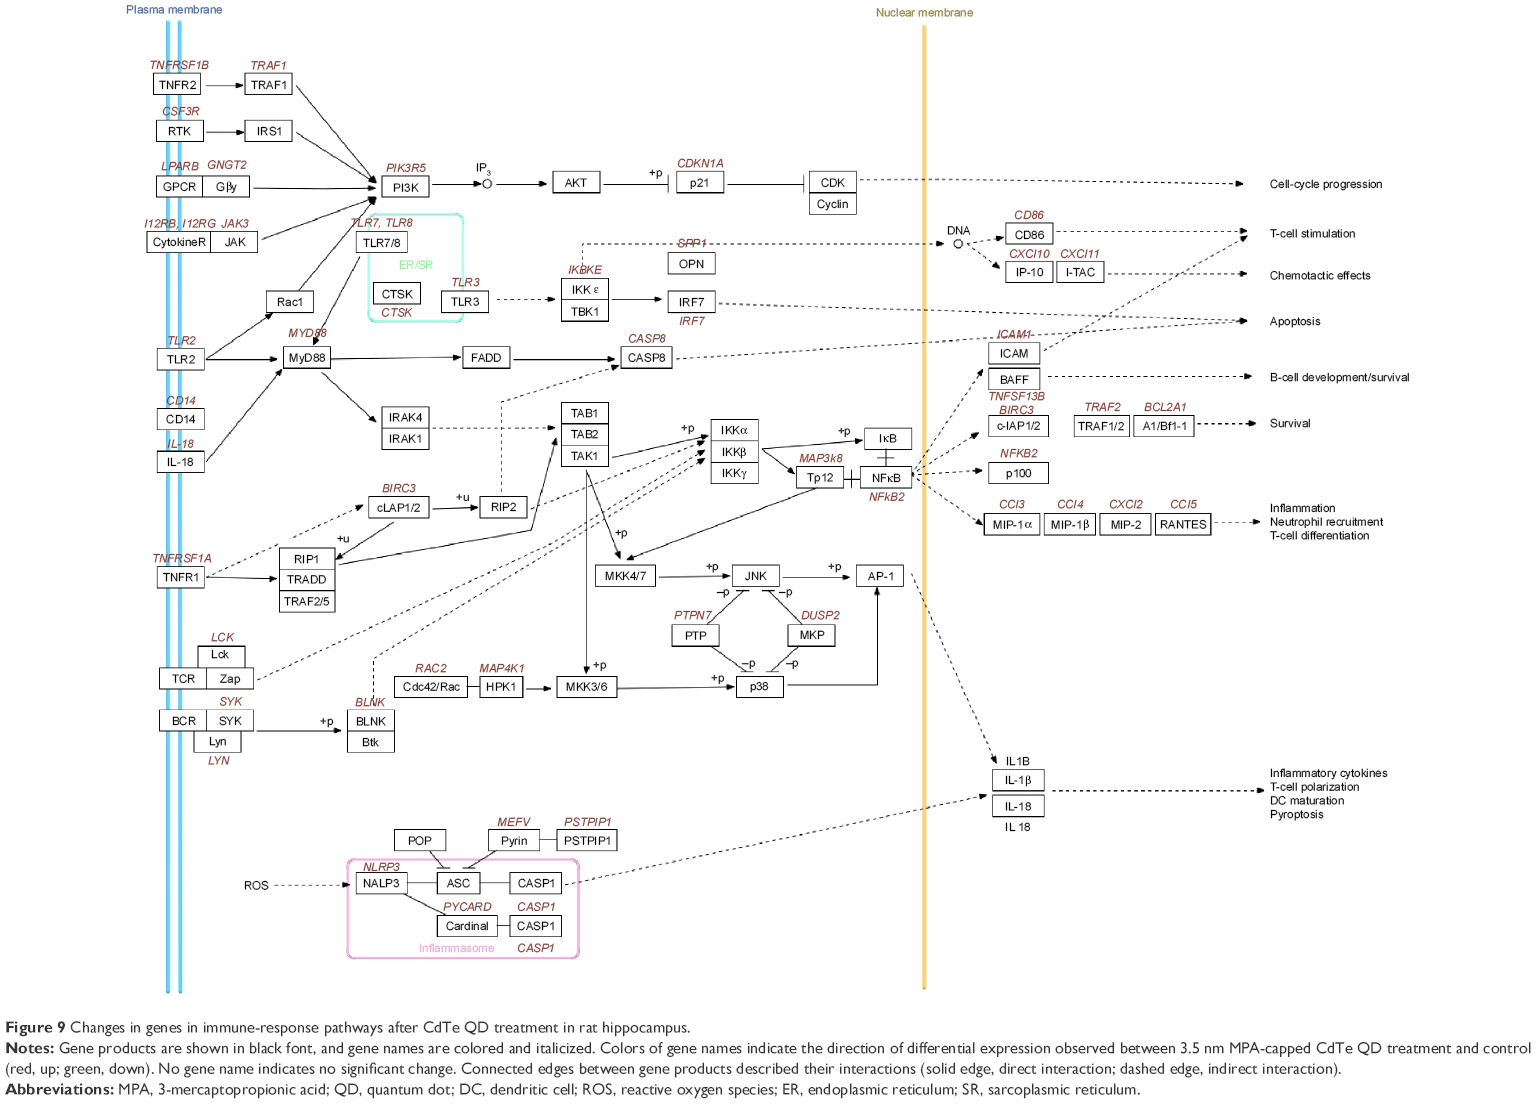 | Figure 9 Changes in genes in immune-response pathways after CdTe QD treatment in rat hippocampus. |
qRT-PCR validation of selected genes in the rat hippocampus under control and MPA-modified CdTe QD conditions
As some signaling pathways related to learning and memory in the 1,600 μg/mL 3.5 nm CdTe QD-treatment group were altered, 15 relevant genes were validated by qRT-PCR. All 15 transcripts selected for qRT-PCR were identical to those obtained by RNA-seq, where 13 gene expressions were upregulated and two gene expressions were downregulated (Table 6). As shown in Figure 10, the RNA-seq data of the degree of changes in these 15 genes were generally correlated with the data from qRT-PCR analysis, which validated the accuracy and reliability of RNA-seq.
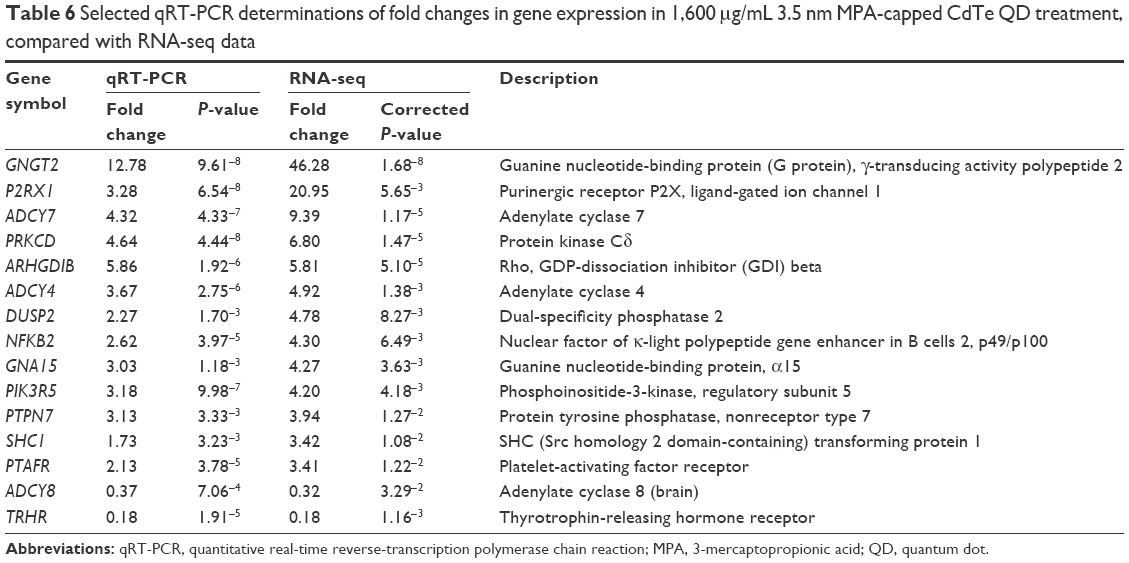 | Table 6 Selected qRT-PCR determinations of fold changes in gene expression in 1,600 μg/mL 3.5 nm MPA-capped CdTe QD treatment, compared with RNA-seq data |
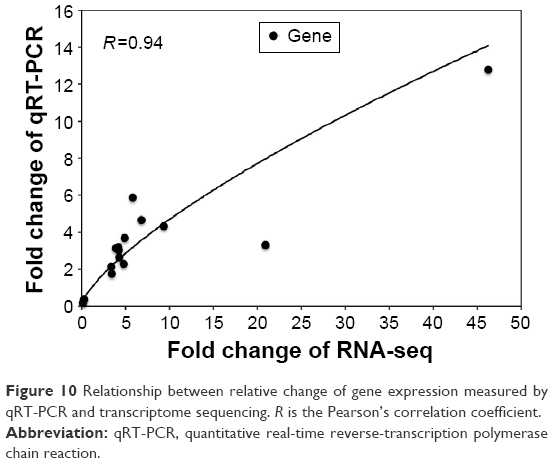 | Figure 10 Relationship between relative change of gene expression measured by qRT-PCR and transcriptome sequencing. R is the Pearson’s correlation coefficient. |
Meanwhile, we investigated the effects of 3.5 nm CdTe QD exposure with different doses on the mRNA levels of GNGT2, PIK3R5, DUSP2, and PTPN7. The results showed that >800 μg/mL 3.5 nm CdTe QD exposure upregulated the gene expression of GNGT2 and DUSP2 (P<0.01), while only 1,600 μg/mL upregulated the gene expression of PIK3R5 and PTPN7 (P<0.01) (Figure 11). There was a dose–effect relationship.
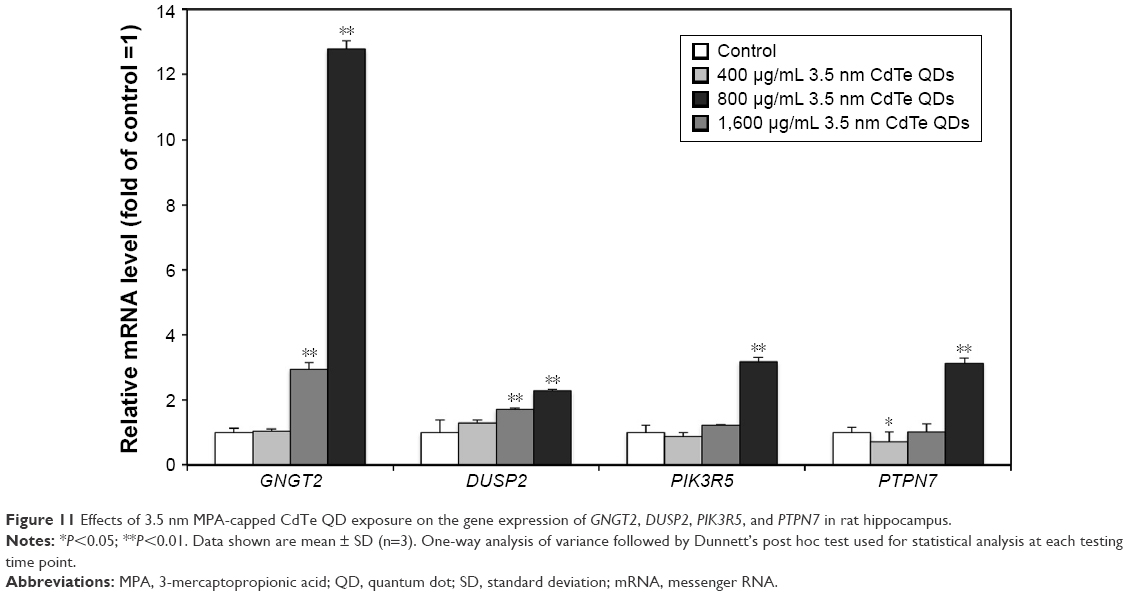 | Figure 11 Effects of 3.5 nm MPA-capped CdTe QD exposure on the gene expression of GNGT2, DUSP2, PIK3R5, and PTPN7 in rat hippocampus. |
3.5 nm MPA-modified CdTe QD exposure downregulated the protein expression of p-Akt, p-ERK1/2, and c-Fos in the rat hippocampus
According to the findings from qRT-PCR, we speculated that 3.5 nm MPA-modified CdTe QD treatment might affect the PI3K–Akt signaling pathway and classical MAPK pathways, resulting in damage to synaptic plasticity (Figure 12). Therefore, we used Western blotting to test three key proteins: Akt, ERK1/2, and c-Fos. The results showed that the total proteins of Akt and ERK1/2, based on the reference protein GAPDH, were not influenced by any dose of 3.5 nm CdTe QD when compared to the control group (Figure 13A and B). However, the expressions of p-Akt and p-ERK1/2, based on Akt and ERK1/2, respectively, were downregulated in rat hippocampi exposed to the 3.5 nm CdTe QD at a concentration over 800 μg/mL (Figure 13A and B). Similarly, the same dose of 3.5 nm CdTe QD exposure caused significant decreases in c-Fos levels, based on GAPDH (Figure 13C).
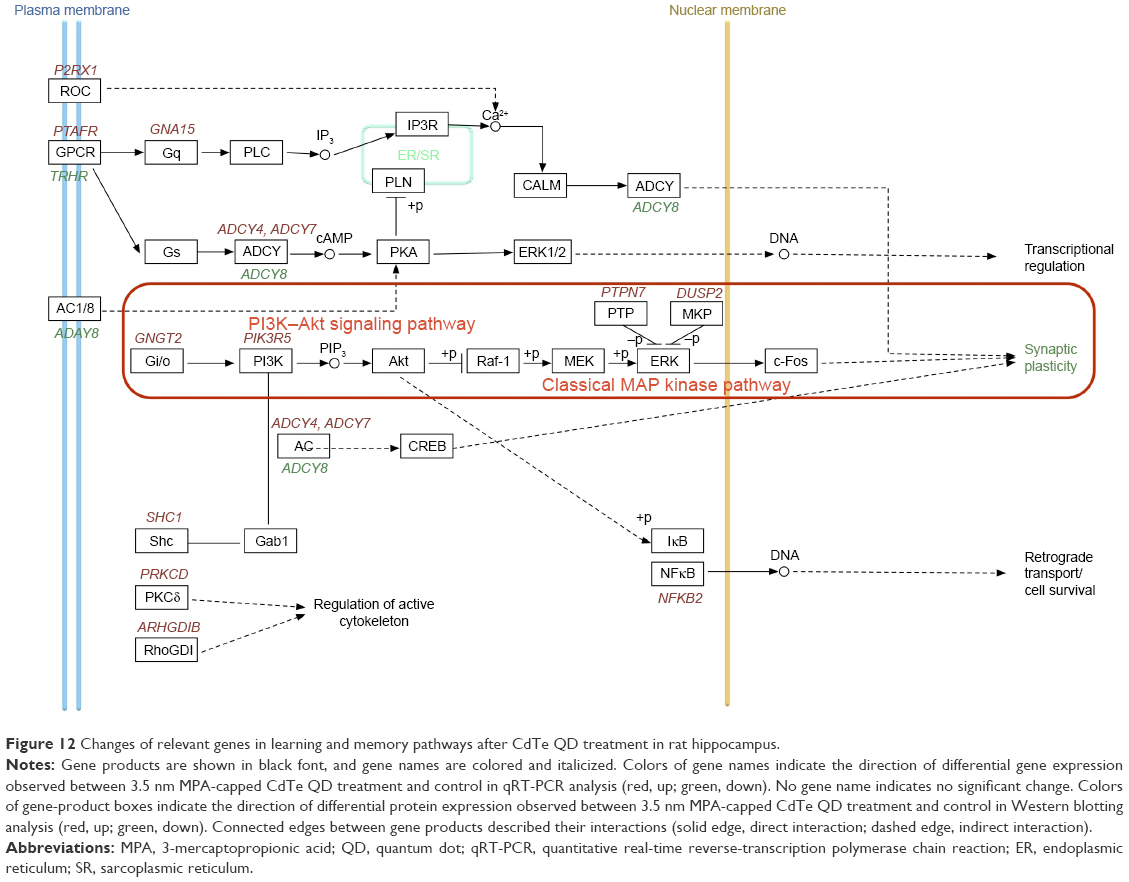 | Figure 12 Changes of relevant genes in learning and memory pathways after CdTe QD treatment in rat hippocampus. |
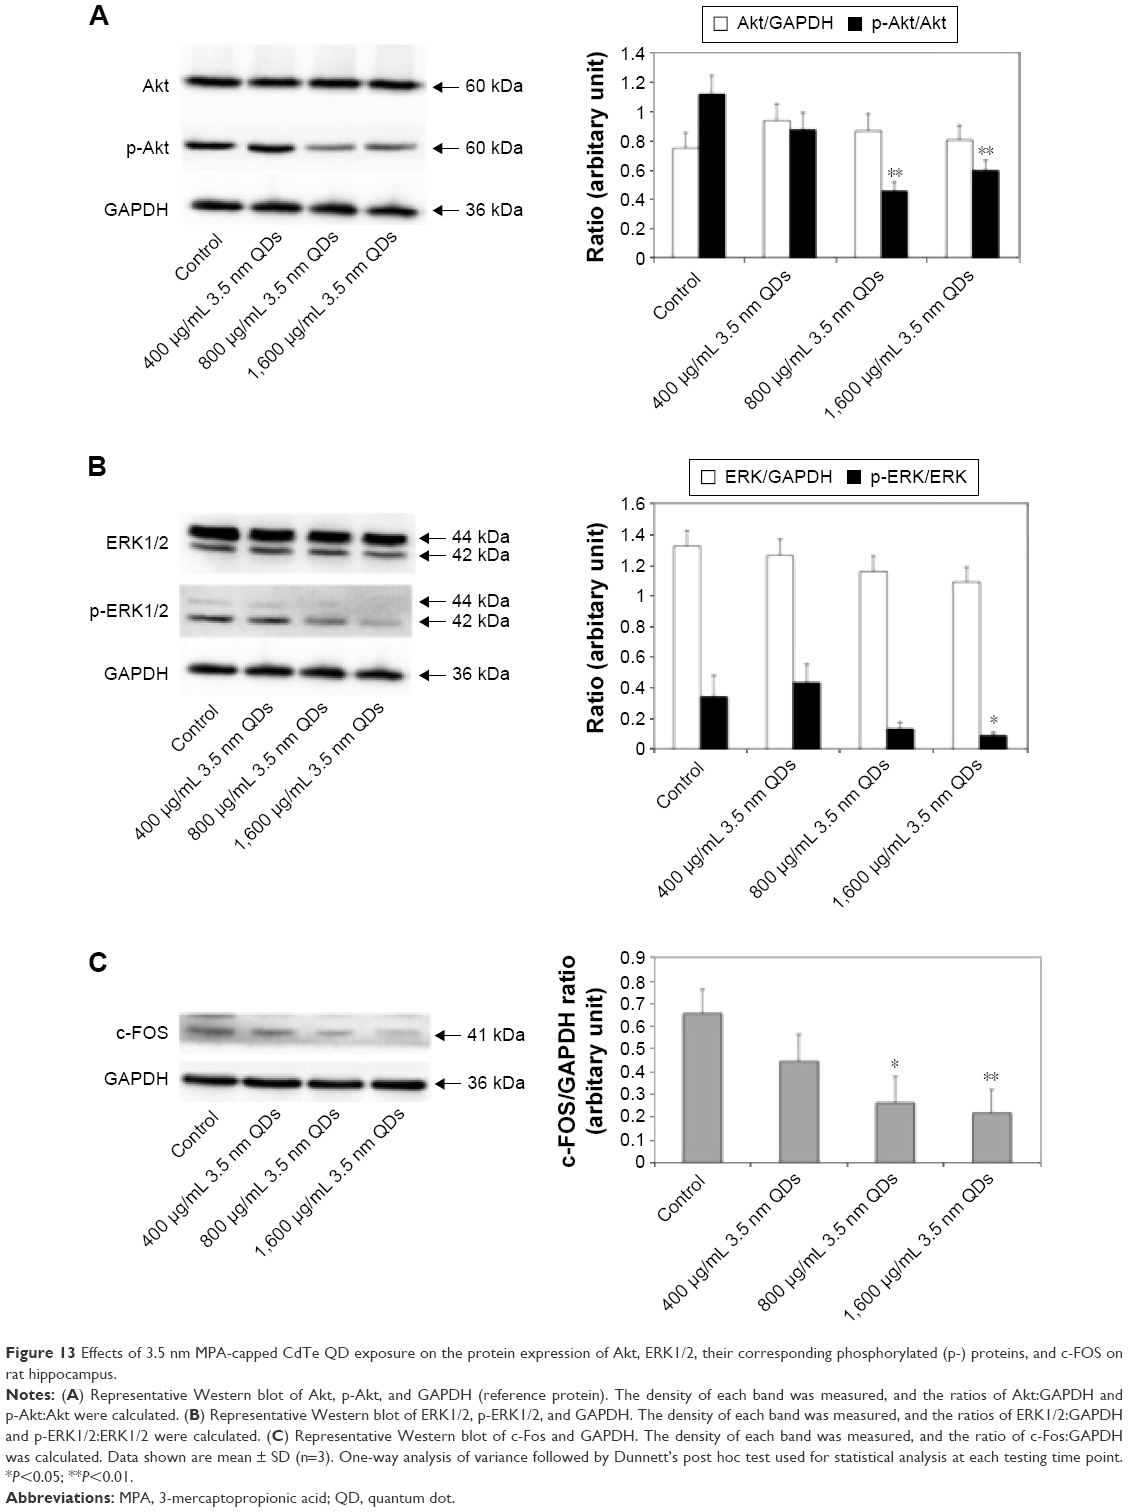 | Figure 13 Effects of 3.5 nm MPA-capped CdTe QD exposure on the protein expression of Akt, ERK1/2, their corresponding phosphorylated (p-) proteins, and c-FOS on rat hippocampus. |
Discussion
A major problem in the treatment of neurodegenerative diseases, such as Alzheimer’s, is the lack of noninvasive methods of trafficking drugs to a particular area of the brain. QD drug delivery offers the possibility of overcoming this problem with better drug targeting, therapeutic efficacy, and fluorescent visibility. Even though the benefits of QD application in biomedicine are plentiful, it is still indispensable to ensure the biosafety of QDs on the nervous system before applying them in living beings. Unfortunately, there have been few neurotoxicological studies of QDs, which makes our study, which deeply investigated the neurotoxicity of CdTe QDs on the hippocampus, valuable.
Our previous study showed that the hippocampus was one of the main targets of nanoparticles, and MPA-modified CdTe QD exposure was capable of inducing hippocampal neuron apoptosis and even death through oxidative stress damage and elevated intracellular calcium levels,9 which could support and promote the investigation of adverse effects and action mechanisms of QDs on the hippocampi of living beings. The hippocampus is an important part of the brain, being responsible for learning and memory. Therefore, the decreased learning-efficiency and memory findings of high-dose MPA-modified CdTe QD-treated animals in this study could indicate that MPA-modified CdTe QDs might damage the hippocampus.
Moreover, studies conducted on freely moving rats have shown that many hippocampal neurons have place fields, which means they fire bursts of action potential when a rat passes through a particular point of the environment.23,24 From the open-field test, we found that low-dose MPA-modified CdTe QDs inhibited exploratory, excitatory, and locomotive activities, while high-dose QDs had the opposite effect. These findings confirm the influence of MPA-modified CdTe QDs of a certain concentration on the hippocampus to a certain extent, but the effects are complicated.
After observing the impairments in spatial learning and memory in MPA-modified CdTe QD-treated rats, we tried to find the reasons for the adverse effects by a series of toxicology and molecular biology approaches. First of all, pathological changes in the hippocampus and damaged ultrastructure of hippocampal neurons and synapses could be an explanation. Hippocampi of rats in the control group merely showed mild inflammation, which might have been due to the injection, while the inflammation became severer with cellular swelling and necrosis when the exposed dose of MPA-modified CdTe QDs increased. Furthermore, TEM provided a chance to observe changes to the ultrastructure of hippocampal neurons and synapses induced by MPA-modified CdTe QDs. Unsurprisingly, pathological lesions on neuron nuclei, mitochondria, the endoplasmic reticulum, and synaptic membranes were observed in the hippocampi of rats treated with the MPA-modified CdTe QDs. Additionally, we found that the lysosomes might be long-term accumulation sites of CdTe QDs in neurons, similar to a previous study,4 which could be partially explained by the findings of Walters et al that negative charge on the QD coating resulted in preferential uptake in neurons.25
The pathological lesion findings could explain the impaired capabilities of learning and memory in MPA-modified CdTe QD-treated rats. However, the definite mechanisms causing this damage is not yet clear. We used advanced RNA-seq technology to investigate the possible genes affected by MPA-modified CdTe QDs, since the analysis of genome-wide differential RNA expression is capable of providing researchers with greater insights into biological pathways and molecular mechanisms that regulate cell fate, development, and toxicity progression.
We found that most DEGs in the MPA-modified CdTe QD-treatments were categorized into the biological process in the GO enrichment analysis. The top 15 GO terms of biological process in the 3.5 nm CdTe QD-treatment group were related to immunity disorders, such as “immune response”, “defense response”, “regulation of immune system”, and “inflammatory response”, and cell damage, such as “regulation of programmed cell death”, “regulation of cell death”, and “regulation of apoptosis”, which was able to explain those pathological lesions. Though there were numerous DEGs in the high-dose MPA-modified CdTe QD-treatment groups, unfortunately no transcripts were found with known roles in neurological signaling or processing with altered expression. It is possible that the high number of transcripts of unknown function in this category contributed to not seeing expected results.26 However, in the KEGG enrichment analysis, we found several pathways regulated by 3.5 nm MPA-modified CdTe QD exposure, related to synaptic plasticity or long-term potentiation (LTP), the foundation of learning, recognition, and memory (Figure 12).
After a comprehensive analysis of Figure 12 and Table 5, two main components of the Toll-like receptor-signaling pathway, ie, the PI3K–Akt signaling pathway and the classical MAPK pathway (also known as the MAPK–ERK pathway) caught our attention. These are two classically intracellular signaling pathways important in regulating the cell cycle, including cell growth, proliferation, survival, and metabolism. Recently, the two pathways have been found to be necessary components in neural processing.27–29 As we know, the apoptosis caused by QDs through inhibition of the survival-related signal-transduction proteins of Akt and ERK1/2 has been reported;30,31 however, investigations of their roles in QD-induced adverse effects on the CNS are rare.
Sui et al found that phosphorylation of Akt at the Ser473 residues was activated in response to LTP-inducing high-frequency stimulation in the medial prefrontal cortex, which was able to be suppressed by PI3K inhibitors, resulting in disturbed long-term memory.28 It seems that PI3K and its downstream target, Akt, may play important roles in synaptic plasticity, LTP, and memory formation in the hippocampus. Some studies have suggested that toxins, such as propofol and arsenic, could impair basal synaptic transmission, hippocampal LTP, and memory, along with decreased p-Akt levels.32,33 Our results showed that p-Akt was significantly downregulated in 3.5 nm MPA-modified CdTe QD exposure, which indicated that dysfunction of the PI3K–Akt signaling pathway might be one of the mechanisms of CNS impairment induced by MPA-modified CdTe QD exposure. However, the effects of 3.5 nm MPA-modified CdTe QDs on the phosphorylation of Akt are complicated in view of the findings that the mRNA level of the gene PIK3R5 (encoding PI3K) was significantly upregulated in high-dose 3.5 nm MPA-modified CdTe QD exposure, and decreased p-Akt levels were not dose-dependent.
Thus far, it has been reported that the ERK-signaling pathway has an important link with the higher functions of learning and memory.27,34 Decreased phosphorylation of ERK1/2 has been observed in hippocampi exposed to ketamine and chronic multiple stress with impaired learning and memory,35,36 while upregulation of the MAPK–ERK signaling pathway via drugs can enhance the cognitive performance of mice.37 Therefore, the decreased level of p-ERK1/2 and increased expression of DUSP2 and PTPN7 (encoding MKP and PTP, activity of which inhibits ERK activity)38,39 observed in 3.5 nm MPA-modified CdTe QD treatment suggested the inhibition of ERK pathway might be another of the mechanisms of CdTe QD causing impairment in spatial learning and memory in rats.
As the activation of ERK in mature neurons results in a translocation from the cytoplasm into the nucleus, the regulation of certain nuclear transcription factors may be one of the roles of the ERK-signaling system in the process of LTP and synaptic plasticity.40,41 The transcription factor c-Fos, encoded by immediate early gene CFOS, is an important downstream ERK1/2-signaling component for the formation of long-term modification of synaptic response. It has been confirmed that p-ERK1/2 can mediate the upregulation of c-Fos expression, which enables neurons to transcribe and translate the corresponding proteins affecting memory function.42,43 When mice were lacking c-Fos in the CNS, they were specifically impaired in hippocampus-dependent spatial and associative learning tasks.44 Additionally, downregulated c-Fos expression following toxin exposure has been implicated in neuronal damage.45–47 Here, we observed c-Fos levels were significantly decreased in the 3.5 nm CdTe QD-treated group in a dose-dependent pattern, which suggested that downregulation of c-Fos was involved in the process of MPA-modified CdTe QD-induced neurotoxic effects.
As we know, there are multiple factors, such as concentration, size, and outer coating, on which the toxicity of QDs depends, apart from the inherent toxicity of core materials.8,48,49 Given that the dose– and size–effect relationship of MPA-modified CdTe QDs has been investigated here, the role of functionalized ligand MPA should be investigated in further studies, as well as other key molecular targets.
Conclusion
In this study, the neurotoxicity of MPA-modified CdTe QDs was evaluated. The results showed that MPA-modified CdTe QDs of less than a certain concentration had no significant toxicity on the hippocampus, which suggested MPA-modified CdTe QDs are promising for further use in biomedicine. However, we still observed some pathological lesions in the rat hippocampus and impairments in spatial recognition and memory induced by MPA-modified CdTe QDs at high doses and/or of certain size, which promoted us to investigate the specific mechanisms of MPA-modified CdTe QDs causing these adverse effects. Our present findings of the inhibited phosphorylation of Akt and ERK1/2 and decreased level of the subsequent transcription of c-Fos elucidated an important molecular mechanism underlying the impairments in spatial recognition and memory caused by MPA-modified CdTe QDs. Otherwise, owning to the largely complex mechanisms of MPA-modified CdTe QDs, we will conduct further research according to the ample molecular targets of MPA-modified CdTe QDs provided by RNA-seq.
Acknowledgments
This work was supported by the National Natural Science Foundation of China (30972504, 81172697, 81302461, 81473003), the National Important Project on Scientific Research of China (2011CB933404), and the Provincial Natural Science Foundation of Jiangsu (BK2011606).
Disclosure
The authors report no conflicts of interest in this work.
References
Feng L, Long HY, Liu RK, et al. A quantum dot probe conjugated with Aβ antibody for molecular imaging of Alzheimer’s disease in a mouse model. Cell Mol Neurobiol. 2013;33(6):759–765. | ||
Tang M, Xing T, Zeng J, et al. Unmodified CdSe quantum dots induce elevation of cytoplasmic calcium levels and impairment of functional properties of sodium channels in rat primary cultured hippocampal neurons. Environ Health Perspect. 2008;116(7):915–922. | ||
Zhao Y, Wang X, Wu Q, Li Y, Wang D. Translocation and neurotoxicity of CdTe quantum dots in RMEs motor neurons in nematode Caenorhabditis elegans. J Hazard Mater. 2015;283:480–489. | ||
Corazzari I, Gilardino A, Dalmazzo S, Fubini B, Lovisolo D. Localization of CdSe/ZnS quantum dots in the lysosomal acidic compartment of cultured neurons and its impact on viability: potential role of ion release. Toxicol In Vitro. 2013;27(2):752–759. | ||
Tang M, Li Z, Chen L, et al. The effect of quantum dots on synaptic transmission and plasticity in the hippocampal dentate gyrus area of anesthetized rats. Biomaterials. 2009;30(28):4948–4955. | ||
Wu T, Zhang T, Chen Y, Tang M. Research advances on potential neurotoxicity of quantum dots. J Appl Toxicol. 2016;36(3):345–351. | ||
Liu X, Tang M, Zhang T, et al. Determination of a threshold dose to reduce or eliminate CdTe-induced toxicity in L929 cells by controlling the exposure dose. PloS One. 2013;8(4):e59359. | ||
Wu T, Tang M. Toxicity of quantum dots on respiratory system. Inhal Toxicol. 2014;26(2):128–139. | ||
Wu T, He K, Zhan Q, et al. Partial protection of N-acetylcysteine against MPA-capped CdTe quantum dot-induced neurotoxicity in rat primary cultured hippocampal neurons. Toxicol Res. 2015;4(6):1613–1622. | ||
Wu T, He K, Zhan Q, et al. MPA-capped CdTe quantum dots exposure causes neurotoxic effects in nematode Caenorhabditis elegans by affecting the transporters and receptors of glutamate, serotonin and dopamine at the genetic level, or by increasing ROS, or both. Nanoscale. 2015;7(48):20460–20473. | ||
Liu J, Zhang Y, Ge C, Jin Y, Hu S, Gu N. Preparation and characterization of highly luminescent water-soluble CdTe quantum dots as optical temperature probes. J Nanosci Nanotechnol. 2010;10(11):7578–7582. | ||
Zhang T, Hu Y, Tang M, et al. Liver toxicity of cadmium telluride quantum dots (CdTe QDs) due to oxidative stress in vitro and in vivo. Int J Mol Sci. 2015;16(10):23279–23299. | ||
Paxinos G, Franklin KB. The Mouse Brain in Stereotaxic Coordinates. 2nd ed. San Diego: Elsevier; 2004. | ||
Trapnell C, Pachter L, Salzberg SL. TopHat: discovering splice junctions with RNA-seq. Bioinformatics. 2009;25(9):1105–1111. | ||
Trapnell C, Williams BA, Pertea G, et al. Transcript assembly and quantification by RNA-seq reveals unannotated transcripts and isoform switching during cell differentiation. Nat Biotechnol. 2010;28(5):511–515. | ||
Trapnell C, Roberts A, Goff L, et al. Differential gene and transcript expression analysis of RNA-seq experiments with TopHat and Cufflinks. Nat Protoc. 2012;7(3):562–578. | ||
Anders S, Pyl PT, Huber W. HTSeq – a Python framework to work with high-throughput sequencing data. Bioinformatics. 2015;31(2):166–169. | ||
Robinson MD, McCarthy DJ, Smyth GK. edgeR: a Bioconductor package for differential expression analysis of digital gene expression data. Bioinformatics. 2010;26(1):139–140. | ||
Huang DW, Sherman BT, Lempicki RA. Systematic and integrative analysis of large gene lists using DAVID bioinformatics resources. Nat Protoc. 2009;4(1):44–57. | ||
Wu J, Mao X, Cai T, Luo J, Wei L. KOBAS server: a web-based platform for automated annotation and pathway identification. Nucleic Acids Res. 2006;34 Suppl 2:W720–W724. | ||
Mika A, Mazur GJ, Hoffman AN, et al. Chronic stress impairs prefrontal cortex-dependent response inhibition and spatial working memory. Behav Neurosci. 2012;126(5):605–619. | ||
Conrad CD, Galea LA, Kuroda Y, McEwen BS. Chronic stress impairs rat spatial memory on the Y maze, and this effect is blocked by tianeptine pretreatment. Behav Neurosci. 1996;110(6):1321–1334. | ||
Moser EI, Kropff E, Moser MB. Place cells, grid cells, and the brain’s spatial representation system. Annu Rev Neurosci. 2008;31:69–89. | ||
Smith DM, Mizumori SJ. Hippocampal place cells, context, and episodic memory. Hippocampus. 2006;16(9):716–729. | ||
Walters R, Medintz IL, Delehanty JB, et al. The role of negative charge in the delivery of quantum dots to neurons. ASN Neuro. 2015;7(4):1759091415592389. | ||
Hook SE, Osborn HL, Spadaro DA, Simpson SL. Assessing mechanisms of toxicant response in the amphipod Melita plumulosa through transcriptomic profiling. Aquat Toxicol. 2014;146:247–257. | ||
Peng S, Zhang Y, Zhang J, Wang H, Ren B. ERK in learning and memory: a review of recent research. Int J Mol Sci. 2010;11(1):222–232. | ||
Sui L, Wang J, Li BM. Role of the phosphoinositide 3-kinase-Akt-mammalian target of the rapamycin signaling pathway in long-term potentiation and trace fear conditioning memory in rat medial prefrontal cortex. Learn Mem. 2008;15(10):762–776. | ||
Shu Y, Zhang H, Kang T, et al. PI3K/Akt signal pathway involved in the cognitive impairment caused by chronic cerebral hypoperfusion in rats. PloS One. 2013;8(12):e81901. | ||
Zhan QL, Tang M. Research advances on apoptosis caused by quantum dots. Biol Trace Elem Res. 2014;161(1):3–12. | ||
Chan WH, Shiao NH, Lu PZ. CdSe quantum dots induce apoptosis in human neuroblastoma cells via mitochondrial-dependent pathways and inhibition of survival signals. Toxicol Lett. 2006;167(3):191–200. | ||
Wang YL, Chen X, Wang ZP. Detrimental effects of postnatal exposure to propofol on memory and hippocampal LTP in mice. Brain Res. 2015;1622:321–327. | ||
Qu L, Gao Y, Sun H, Wang H, Liu X, Sun D. Role of PTEN-Akt-CREB signaling pathway in nervous system impairment of rats with chronic arsenite exposure. Biol Trace Elem Res. 2016;170(2):366–372. | ||
Giovannini MG, Lana D, Pepeu G. The integrated role of ACh, ERK and mTOR in the mechanisms of hippocampal inhibitory avoidance memory. Neurobiol Learn Mem. 2015;119:18–33. | ||
Peng S, Zhang Y, Zhang J, Wang H, Ren B. Effect of ketamine on ERK expression in hippocampal neural cell and the ability of learning behavior in minor rats. Mol Biol Rep. 2010;37(7):3137–3142. | ||
Zheng G, Luo WJ, Chen YM, Liu MC, Ma JL, Chen JY. [Effects of chronic multiple stress on learning and memory and the expression and phosphorylation of cerebral ERK of rats]. Zhongguo Ying Yong Sheng Li Xue Za Zhi. 2011;27(1):33–36. Chinese. | ||
Guo X, Chen ZH, Wang HL, et al. WSKY, a traditional Chinese decoction, rescues cognitive impairment associated with NMDA receptor antagonism by enhancing BDNF/ERK/CREB signaling. Mol Med Rep. 2015;11(4):2927–2934. | ||
Duff JL, Monia BP, Berk BC. Mitogen-activated protein (MAP) kinase is regulated by the MAP kinase phosphatase (MKP-1) in vascular smooth-muscle cells. J Biol Chem. 1995;270(13):7161–7166. | ||
Kim SY, Kwon YW, Jung IL, Sung JH, Park SG. Tauroursodeoxycholate (TUDCA) inhibits neointimal hyperplasia by suppression of ERK via PKCα-mediated MKP-1 induction. Cardiovasc Res. 2011;92(2):307–316. | ||
Besnard A, Laroche S, Caboche J. Comparative dynamics of MAPK/ERK signalling components and immediate early genes in the hippocampus and amygdala following contextual fear conditioning and retrieval. Brain Struct Funct. 2014;219(1):415–430. | ||
Ciccarelli A, Giustetto M. Role of ERK signaling in activity-dependent modifications of histone proteins. Neuropharmacology. 2014;80:34–44. | ||
Tischmeyer W, Grimm R. Activation of immediate early genes and memory formation. Cell Mol Life Sci. 1999;55(4):564–574. | ||
Kaczmarek L, Lapinska-Dzwonek J, Szymczak S. Matrix metalloproteinases in the adult brain physiology: a link between c-Fos, AP-1 and remodeling of neuronal connections? EMBO J. 2002;21(24):6643–6648. | ||
Fleischmann A, Hvalby O, Jensen V, et al. Impaired long-term memory and NR2A-type NMDA receptor-dependent synaptic plasticity in mice lacking c-Fos in the CNS. J Neurosci. 2003;23(27):9116–9122. | ||
Liu H, Yang J, Liu Q, et al. Lanthanum chloride impairs spatial memory through ERK/MSK1 signaling pathway of hippocampus in rats. Neurochem Res. 2014;39(12):2479–2491. | ||
Toropova KA, Anokhin KV, Tiunova AA. [Inhibition of histone deacetylases in the chick brain modulates expression of c-Fos and ZENK transcription factors and facilitates establishment of long-term memory]. Zh Vyssh Nerv Deiat Im I P Pavlova. 2014;64(5):551–561. Russian. | ||
Lu B, Ma Z, Cheng F, et al. Effects of electroacupuncture on ethanol-induced impairments of spatial learning and memory and Fos expression in the hippocampus in rats. Neurosci Lett. 2014;576:62–67. | ||
Schneider R, Wolpert C, Guilloteau H, Balan L, Lambert J, Merlin C. The exposure of bacteria to CdTe-core quantum dots: the importance of surface chemistry on cytotoxicity. Nanotechnology. 2009;20(22):225101. | ||
Aldeek F, Balan L, Lambert J, Schneider R. The influence of capping thioalkyl acid on the growth and photoluminescence efficiency of CdTe and CdSe quantum dots. Nanotechnology. 2008;19(47):475401. |
 © 2016 The Author(s). This work is published and licensed by Dove Medical Press Limited. The full terms of this license are available at https://www.dovepress.com/terms.php and incorporate the Creative Commons Attribution - Non Commercial (unported, v3.0) License.
By accessing the work you hereby accept the Terms. Non-commercial uses of the work are permitted without any further permission from Dove Medical Press Limited, provided the work is properly attributed. For permission for commercial use of this work, please see paragraphs 4.2 and 5 of our Terms.
© 2016 The Author(s). This work is published and licensed by Dove Medical Press Limited. The full terms of this license are available at https://www.dovepress.com/terms.php and incorporate the Creative Commons Attribution - Non Commercial (unported, v3.0) License.
By accessing the work you hereby accept the Terms. Non-commercial uses of the work are permitted without any further permission from Dove Medical Press Limited, provided the work is properly attributed. For permission for commercial use of this work, please see paragraphs 4.2 and 5 of our Terms.