")
Back to Journals » Risk Management and Healthcare Policy » Volume 14
Impacts of the COVID-19 Pandemic on Public Hospitals of Different Levels: Six-Month Evidence from Shanghai, China
Authors Chen Y , Cai M , Li Z , Lin X , Wang L
Received 19 April 2021
Accepted for publication 30 July 2021
Published 1 September 2021 Volume 2021:14 Pages 3635—3651
DOI https://doi.org/10.2147/RMHP.S314604
Checked for plagiarism Yes
Review by Single anonymous peer review
Peer reviewer comments 2
Editor who approved publication: Dr Jongwha Chang
Yuqian Chen,1 Miao Cai,2 Zhipeng Li,3 Xiaojun Lin,4,5 Linan Wang6
1Department of Health Policy Research, Shanghai Health Development Research Center, Shanghai, People’s Republic of China; 2Department of Epidemiology, School of Public Health, Sun Yat-sen University, Guangzhou, Guangdong, People’s Republic of China; 3Qu Qiubai School of Government, Changzhou University, Changzhou, Jiangsu, People’s Republic of China; 4HEOA Group, West China School of Public Health and West China Fourth Hospital, Sichuan University, Chengdu, Sichuan, People’s Republic of China; 5Institute for Healthy Cities and West China Research Center for Rural Health Development, Sichuan University, Chengdu, Sichuan, People’s Republic of China; 6School of Public Economics and Administration, Shanghai University of Finance and Economics, Shanghai, People’s Republic of China
Correspondence: Linan Wang
School of Public Economics and Administration, Shanghai University of Finance and Economics, No. 777 Guoding Road, Yangpu District, Shanghai, 200433, People’s Republic of China
Tel +86 18917769202
Fax +86 021 22121623
Email [email protected]
Xiaojun Lin
West China School of Public Health and West China Fourth Hospital, Sichuan University, No. 16, Section 3, Ren Min Nan Road, Chengdu, Sichuan, 610041, People’s Republic of China
Tel +86 028 85503396
Email [email protected]
Purpose: Hospitals suffered from a precipitous loss of medical service globally due to COVID-19. The tragedy paradoxically produced an opportunity to investigate the patterns of change in medical services and revenue in hospitals at different levels when faced with a natural shock. This study aims to examine the effects of the COVID-19 pandemic in the first half of 2020 on hospital operation in Shanghai.
Methods: We obtained monthly characteristic and operational data of public hospitals (N=156) from January 1, 2018, to July 31, 2020, in Shanghai from the China Statistical Survey of Health Resources and Services Program. We constructed a set of difference-in-differences models to investigate the pandemic (from February 1 to March 31, 2020) and post-pandemic (from April 1 to July 31, 2020) effects on operational outcomes in hospitals of different levels, including outpatient and inpatient visits, outpatient and inpatient revenue, as well as the differential effects on local and nonlocal patients.
Results: There were 46 tertiary hospitals and 110 non-tertiary hospitals involved in this study. Compared to a non-tertiary hospital during the COVID-19 pandemic, a tertiary hospital averagely experienced substantially more significant losses in outpatient visits (57.91 thousand, p < 0.01), inpatient visits (1.93 thousand, p < 0.01), outpatient revenue (18.88 million RMB, p < 0.01), and inpatient revenue (30.65 million RMB, p < 0.01) monthly. Compared to a non-tertiary hospital in the post-pandemic period, a tertiary hospital averagely lost more outpatient visits (18.02 thousand, p < 0.01) from all patients and inpatient visits (0.15 thousand, p < 0.01) from nonlocal patients, but was associated with higher inpatient revenue (2.24 million RMB, p < 0.01) from all patients and outpatient revenue (0.87 million RMB, p < 0.01) from nonlocal patients monthly.
Conclusion: Medical service and revenue for public hospitals in Shanghai dropped precipitously during the COVID-19 pandemic, but mainly recovered after the pandemic. Compared to non-tertiary hospitals, medical services and revenue in tertiary hospitals experienced more substantial reduction during the pandemic but had a faster recovery that maintained longer during the post-pandemic period.
Keywords: COVID-19, health services research, health utilization, hospital level
Introduction
COVID-19 has spread rapidly around the world since December 2019.1,2 From late January to early March 2020, most Chinese hospitals suffered from a precipitous loss of medical service.3–5 Since non-critical care, and elective services were postponed by public policy regulations, hospital volumes fell. Some hospitals reported a decline of over half of the hospital volume at the peak of the COVID-19 pandemic in lots of countries.6–8 As the lockdown in Wuhan was officially lifted on April 8, 2020, and most parts of China started to reopen, hospital volumes and capacity started to recover from the shock caused by COVID-19.
Hospitals in China are classified into three levels based on their capability to provide medical service, education, and conduct research.9 Primary hospitals often occupy fewer than 100 beds and provide local community health and rehabilitation services. Secondary hospitals are medium- or small-size regional hospitals (often 100 to 1000 beds) that provide comprehensive medical care to patients and refer patients with complex diseases to tertiary hospitals. Tertiary hospitals are often large medical centers with specialist medical services and are allowed to offer medical care of various complexity.
Since hospitals of different levels have substantial differences in funding, policy support, human resource, and medical equipment, they are hypothesized to manifest different patterns of medical services and revenue when faced with a natural shock such as COVID-19. It is valuable to examine the short- and long-term pattern of hospital volume change and operation after the COVID-19 pandemic, as a better understanding can inform the planning and recovery of health systems hit by COVID-19 around the world.10,11
Shanghai is an eastern Chinese megacity with over 24 million residents. It is one of China’s major transportation hubs, which makes it susceptible to an airborne transmitted disease like COVID-19. Since 2007, the China Statistical Survey of Health Resources and Services Program (SHRSP) regularly collects monthly-aggregated hospital operational data. In this paper that leverages the breadth and depth of the SHRSP, we aim to examine the effects of the COVID-19 pandemic in early 2020 on public hospital operation in Shanghai, China.
Methods
Data Sources
Datasets in these two steps were both collected from the SHRSP. First, monthly hospital-grade level healthcare service data from January 2019 to November 2020 were provided by Shanghai Health Commission, to show the crude effect of the COVID-19 pandemic on public hospitals. Second, longitudinal monthly hospital-level medical service data from January 1, 2018 to July 31, 2020 were used to estimate the adjusted effects with regression models. All hospital-level data included hospital characteristics and economic operation, as well as the records.12 The hospital-grade level data were calculated by adding all the hospitals in the same grade. Due to the data sharing restrictions, we were not able to involve more hospital-level data beyond July 2020 in this study. The SHRSP is a nationwide program that was initiated by the China National Bureau of Statistics in 2007 and conducted by the local Municipal Health Commission. This program collects: hospital characteristics and operational data; information on healthcare personnel, medical equipment, medical records, blood collection, and supply data; as well as demographics on discharged patients. The hospital- and patient-level data were uploaded in the National Health Statistics Network Direct Reporting System, which could be accessed with permission from local Municipal and National Health Commissions.12 In the present study, we obtained data from these levels through the Shanghai Health Commission.
Hospital Selection
All 159 public hospitals out of the 387 hospitals in Shanghai were included in the initial sample, and this was done for two reasons. First, in China,a public hospital is a leading player in the healthcare market.13,14 In 2019, These public hospitals provided 89.10% outpatient visits and 89.64% inpatient visits.15 Furthermore, the bed median of public hospitals in Shanghai was 460 (interquartile range [IQR], 217–782.5), and there were 23 (14.5%) hospitals with at least 1000 beds. Second, Shanghai’s public hospitals are enrolled in an unified data collection system, which guarantees the data quality and consistency of measurements. No hospital changed its tertiary status in our sample, however, we further excluded three hospitals (1.89%, 1 tertiary, and 2 non-tertiary hospitals) from the initial sample with non-continuous data from January 2018 to July 2020. Our final sample involved 156 public hospitals from Shanghai, including 46 (29.5%) tertiary and 110 (70.5%) non-tertiary hospitals (104 secondary hospitals, and 6 primary hospitals).
COVID-19 Pandemic Periods Definition
According to the spread of COVID-19 and the schedule of control measures in China, we divided the COVID-19 epidemic period (from February 1 to July 31, 2020) in Shanghai into two periods: pandemic period (from February 1 to March 31, 2020) and post-pandemic period (from April 1 to July 31, 2020). Firstly, we considered the spread situation of COVID-19 in China, especially in Shanghai. The COVID-19 epidemic in Chinese provinces outside Hubei mostly started in late January, reached at peak in early February, and then gradually receded since late February.16,17 Secondly, most Chinese provinces and cities initiated the top degree major public health emergency response mechanism in late January and downgraded its local emergency response level around March (Shanghai downgraded on March 24, 2020).17 The emergency response included: improved rates of diagnostic testing; clinical management; rapid isolation of suspected cases, confirmed cases and contacts; and, most notably, restrictions on mobility.18 After downgrading, the population mobility and the control measure of the hospitals began to recover quickly. Since we only had monthly aggregated data, we could not divide January 2020 into pre-pandemic and pandemic periods, which would be based on the date of lockdown in Wuhan (January 23, 2020). However, in sensitivity analyses, we further included January 2020 into the pandemic period and estimated the effects using this broader definition.
Outcomes
The number of outpatient and inpatient visits, as well as outpatient and inpatient revenue, were used as the outcomes. In previous studies that investigated external treatment effects on hospital operation, these four indicators served as proxies for overall operational status.19,20 All number of visits in the present study were expressed in thousands. All revenue was expressed in million Renminbi (RMB), and adjusted by Shanghai monthly Consumer Price Index (CPI), which was based on January 2018.
As a healthcare centre in China, Shanghai plays a significant role in providing healthcare services to nonlocal patients, whose permanent residence are not in Shanghai.21 In 2018, Shanghai provided 6.67% outpatient visits and 29.24% inpatient visits to nonlocal patients, accounting for 14.65% of the total revenue. 76.65% of the outpatient visits and 83.05% of the inpatient visits were provided in tertiary hospitals.22 Due to the different care-seeking preferences and the interprovincial population mobility control policies, we collected operational indicators from local and nonlocal patients. The residential information was obtained from the home address in patient medical records.
Explanatory Variables
Tertiary hospitals in our sample were taken as the treatment group, and the non-tertiary hospitals were taken as the control group. The corresponding dummy indicator (treat) was taken as an explanatory variable in the statistical model to represent the difference in healthcare volume between tertiary and non-tertiary hospitals. The pandemic (pandemic) and post-pandemic (post-pandemic) dummy indicators were included to investigate the pandemic and post-pandemic effects on all hospitals in this sample. The interaction term of tertiary with pandemic (treat*pandemic) and tertiary with post-pandemic (treat*post-pandemic) were the key explanatory variables, that denoted the pandemic and post-pandemic effects on tertiary hospitals when compared to non-tertiary hospitals. Additionally, the hospital type (type) is included as a categorical variable to control for differences in hospital volume and revenue across different types of hospitals. The sample hospitals were divided into three categories: general hospitals, specialized hospitals, and traditional Chinese medicine (TCM) hospitals.
Statistical Analysis
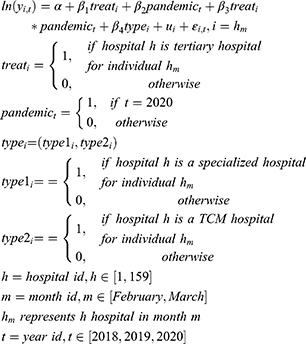
Difference-in-difference (DID) models with hospital-level and month-level random effect (RE) models were conducted to analyse the effect of COVID-19 on tertiary hospitals when compared to non-tertiary hospitals that occurred, during the pandemic (from February 1 to March 31, 2020). This study design is described in Table 1. The parameterization of the model is shown in Equation 1.
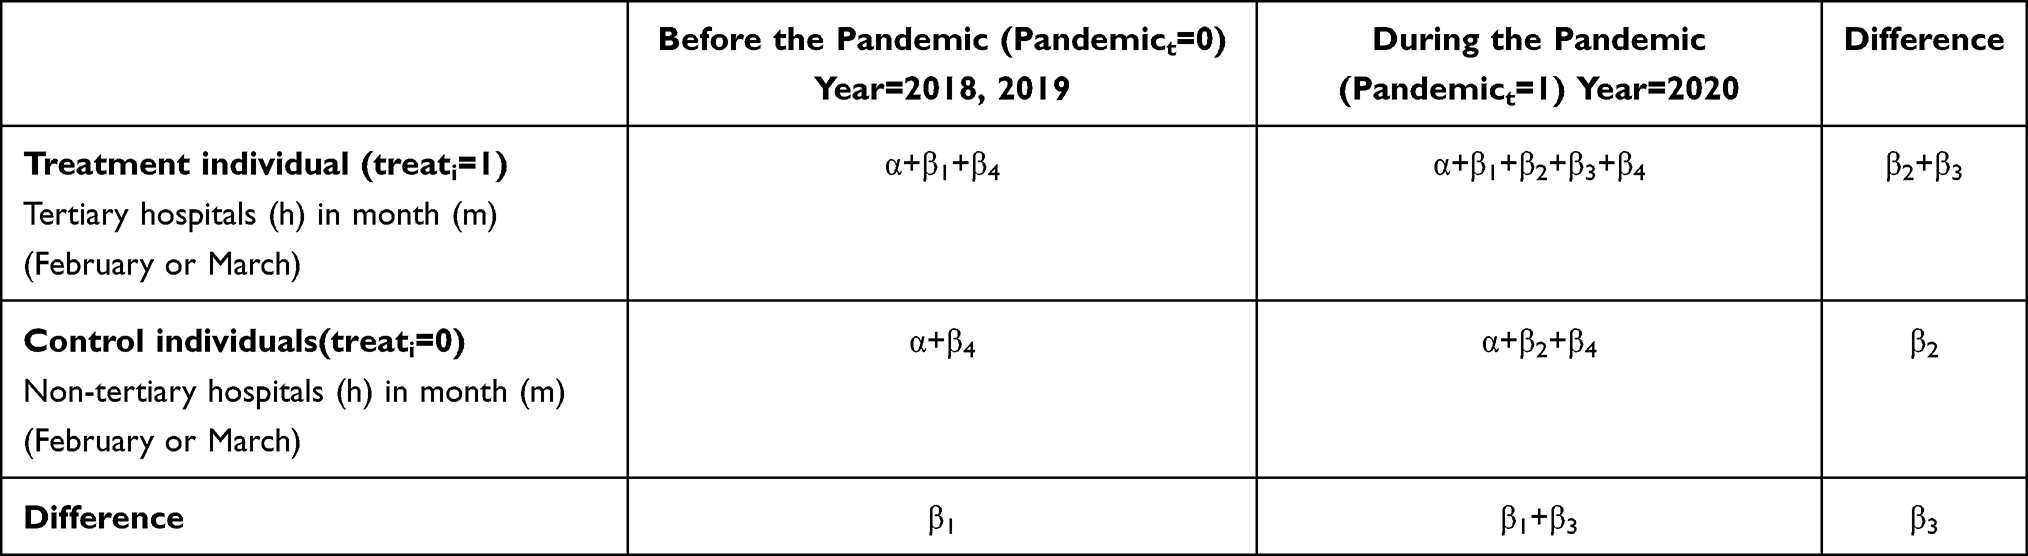 |
Table 1 DID Models to Estimate the COVID-19’s Differential Effect on Tertiary Hospitals in the Pandemic Period |
Where yi,t stands for the four outcomes: number of outpatient visits, number of inpatient visits, outpatient revenue, and inpatient revenue. A hospital (h) in the same month (m) in different years (t) was taken as an individual (i), to eliminate the monthly fluctuations in the healthcare market. The year variable t was taken as the time period indicator. Treati is a dummy variable that has a value of 1 if hospital h is a tertiary hospital for panel id i. The month does not need to be taken into consideration because there was no hospital that changed its tertiary and non-tertiary levels, from January 1, 2018 to July 31, 2020. Pandemict is an indicator variable for which a value of 1 indicates the COVID-19 pandemic period. The key explanatory variable was treati*pandemict, which denotes the tertiary hospitals affected by the COVID-19 during the pandemic period. The typei is a categorical indicator, controlling for the type of each hospital. Thus, in the process of regression, the variable typei was replaced by two dummy variables, and general hospitals were taken as reference. The coefficient β1 is the average increment of outcomes for tertiary hospitals, β2 is the average pandemic effect on the outcomes of non-tertiary hospitals, β3 is the differential impact of the pandemic on the outcomes of tertiary hospitals and β4 is the average difference between different hospital types. The ui term is a vector of the panel id hospital-month’s individual random effect, and  is the error term.
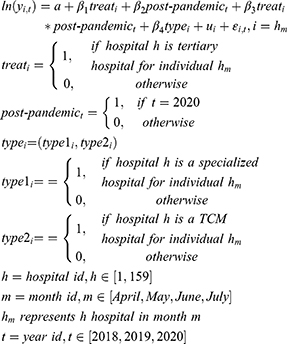
A similar set of DID models were conducted to analyse the effect of COVID-19 on tertiary hospitals compared to non-tertiary hospitals in the post-pandemic period (from April 1 to July 31, 2020), as shown in Equation 2 (Please see Table 2 for further details). All variables and coefficients indicated the same meaning as in Equation 1, except for post-pandemict, β2 and β3. The post-pandemict is an indicator variable that denotes the COVID-19 post-pandemic period. The key explanatory variable was treati*post-pandemict, which denotes the tertiary hospitals affected by the COVID-19 during the post-pandemic period in comparison to non-tertiary hospitals. The coefficient β2 is the average post-pandemic effect on the outcomes of non-tertiary hospitals and β3 is the differential impact of the post-pandemic on the outcomes of tertiary hospitals.
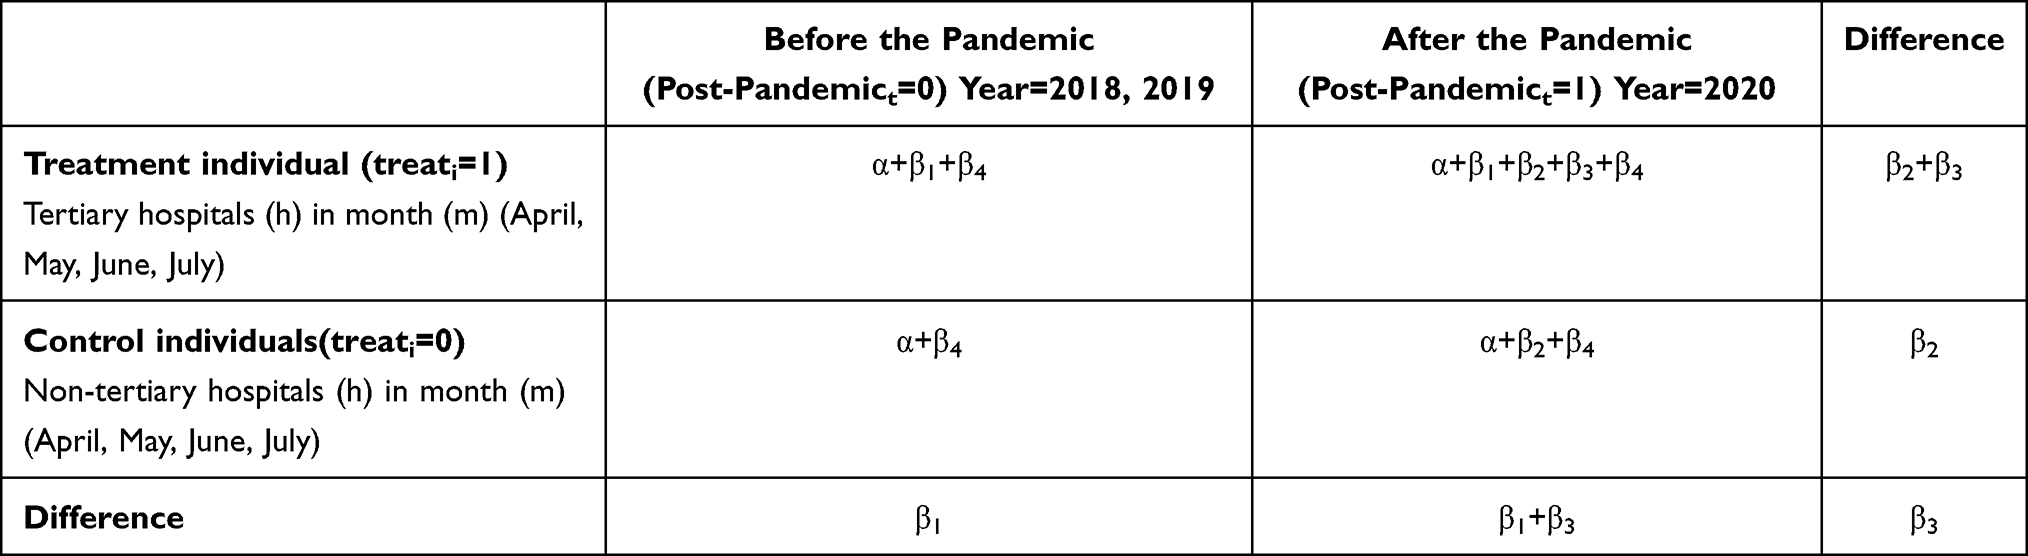 |
Table 2 DID Models to Estimate the COVID-19’s Differential Effect on Tertiary Hospitals in the Post-Pandemic Period |
A parallel trend is a critical assumption that enables DID to account for unobserved variables.23,24 We had only two untreated years in 2018 and 2019 that occurred before the beginning of the COVID-19 pandemic; thus, we could not construct pseudo models for the parallel test. Instead, to illustrate such trends among years in the same month, we plotted the mean medical services and revenue in tertiary and non-tertiary hospital groups from January 1, 2018, to July 31, 2020.
Since the official date of lockdown in Wuhan was in the latter half of January (January 23, 2020), hospitals in Shanghai may have been affected starting from this date, and therefore there is controversy over whether January 2020 should be included as a COVID-19 pandemic period. Consequently, we further included January 2020 into COVID-19 period in sensitivity analyses. The results were compared with the results in Equation 1, to justify the robustness of our analysis.
A p-value of less than 0.05 was considered statistically significant. Stata version 16 for Windows (Stata Corp, College Station, TX, USA) was used for the statistical analysis. R (version 4.0.5) software was used for graphing.
Ethical Considerations
Helsinki declaration for medical research involving human subjects was followed. Ethical clearance was obtained from Shanghai Health and Development Research Center ethics committee (NO. 2021002). A permission letter was written for each study hospital and a permission letter was taken from the study hospital’s administrator. The need for written patient consent was waived because of the observational nature of this study, the subject can no longer be found, and the research project does not involve personal privacy or commercial interests.
Results
Characteristics of the Study Hospitals
Characteristics of the study hospitals are shown in Table 3. Among the 156 hospitals, the median of beds in tertiary hospitals (903; IQR: 610–1390) was much larger than that in the non-tertiary hospitals (326; IQR,162–536). For the tertiary hospitals, there were 24 (52.17%) general hospitals, 16 (34.78%) specialized hospitals, and 6 (13.04%) TCM hospitals. The non-tertiary hospitals included a lower ratio of general hospitals (N=43, 39.09%) and a higher ratio of specialized hospitals (N=53, 48.18%) (p=0.00). In total, 3276 hospital-month observations were included in this study.
 |
Table 3 The Characteristics of the Sample Public Hospitals from January 1, 2018, to July 31, 2020, in Shanghai, China |
Temporal Trend of Operational Data in Tertiary and Non-Tertiary Hospitals
Figure 1 presents the temporal trends of operational data in tertiary (blue lines) and non-tertiary (red lines) hospitals in 2019 (dashed lines) and 2020 (solid lines). Tertiary hospitals in Shanghai experienced a larger decline compared to non-tertiary hospitals in outpatient visits (−59.27% versus −47.55% in February, −48.32% versus −48.25% in March), inpatient visits (−59.19% versus −45.16% in February, −49.07% versus–43.45% in March), outpatient revenue (−44.30% versus −32.74% in February, −35.67% versus −38.03% in March), and inpatient revenue (−57.32% versus −39.88% in February, −39.53% versus −33.07% in March) for February and March 2020, respectively, compared to the same month in 2019 (Supplementary Table 1).
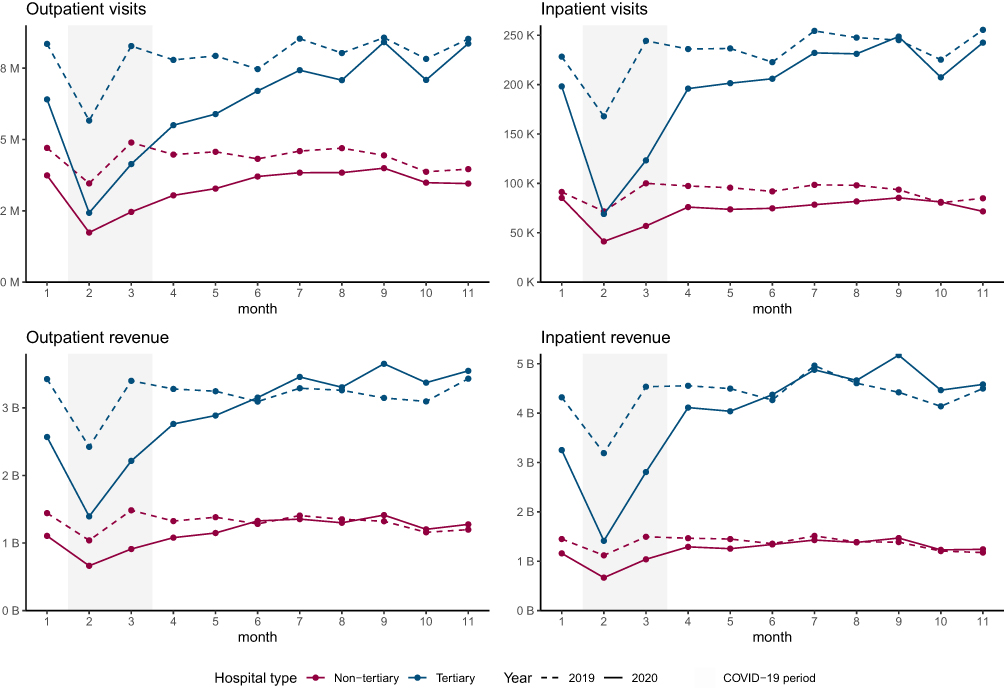 |
Figure 1 The monthly temporal trends of operational data in tertiary (blue lines) and non-tertiary (red lines) hospitals in 2019 (dashed lines) and 2020 (solid lines), from January to November, in Shanghai, China. The gray area in the figure indicated the COVID-19 pandemic period in Shanghai (February 2020–March 2020). There are 156 public hospitals in this analysis, including 46 tertiary and 110 non-tertiary hospitals. The public hospitals’ medical services and revenue in Shanghai suffered a precipitous fell during the COVID-19 pandemic period. During the post-pandemic period (from April 1 in 2020), tertiary hospitals rebounded quicker than non-tertiary hospitals, especially for the medical revenue. |
However, in the post-pandemic period (from April 2020 to July 2020), according to the year-over-year (YOY) growth ratio, tertiary public hospitals in Shanghai showed a faster recovery when compared to non-tertiary public hospitals in outpatient visits (−27.16% versus −29.14% in April, −24.33% versus −26.46% in May, −6.31% versus −10.63% in June, −12.54% versus −16.57% in July), inpatient visits (−15.00% versus −20.98% in April, −11.07% versus −22.20% in May, −4.05% versus −20.98% in June, −4.64% versus −20.45% in July), outpatient revenue (−14.96% versus −17.51% in April, −11.72% versus −15.42% in May, 4.88% versus 6.21% in June, −0.23% versus −5.92% in July), and inpatient revenue (−10.87% versus −10.09% in April, −10.56% versus −10.50% in May, 1.91% versus 0.69% in June, −1.92% versus −9.29% in July) for April, May, June and July 2020, respectively (Supplementary Table 1).
Additionally, these temporal trends were different for services provided to local and nonlocal patients (Figure 2). For the tertiary hospitals: the service provided to nonlocal patients decreased more drastically than to local patients during the pandemic period; and the rebound for local patients during the post-pandemic was more marked and maintained for a longer time when compared to nonlocal patients, especially for the service volume. As for the non-tertiary hospitals: the service provided to nonlocal patients accounted for a relatively small proportion of the total and had less contribution to overall variation; and its service volume and revenue were relatively stable during the post-pandemic period.
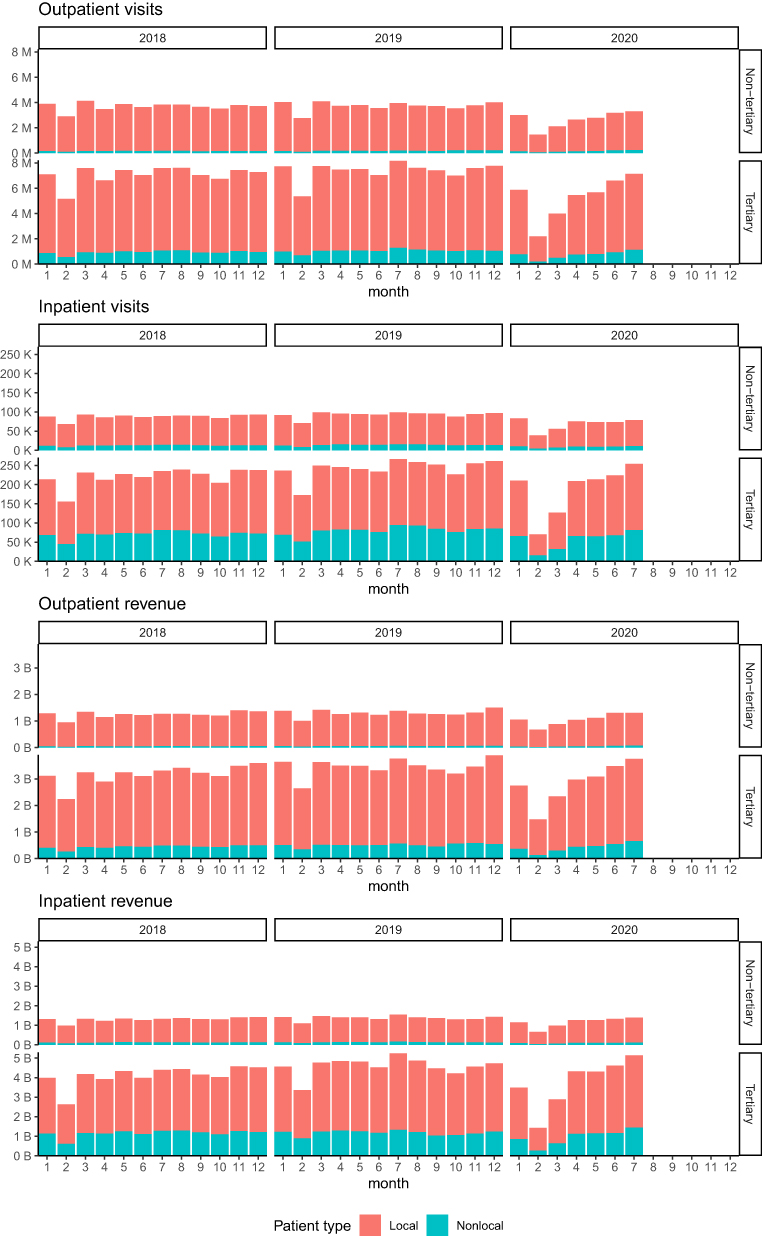 |
Figure 2 The distribution of tertiary and non-tertiary hospitals’ total medical services and revenue attributable to local patients (orange) and nonlocal patients (green), from January 2018 to July 2020, in Shanghai, China. There are 156 public hospitals in this analysis, including 46 tertiary and 110 non-tertiary hospitals. Nonlocal patients prefer seeking inpatient service in tertiary hospitals in Shanghai. The COVID-19 effect on the medical services and revenue attributable to nonlocal patients was shorter than local patients. During the post-pandemic period, the volume and revenue due to nonlocal were relatively stable, while the local part kept increasing, especially for tertiary hospitals. |
Tertiary Hospitals Experienced a Sharper Reduction of Medical Services and Revenue
Table 4 presents the DID point estimates and standard errors for effect of the COVID-19 pandemic on operational outcomes of tertiary hospitals compared to non-tertiary hospitals (please see Equation 1 for further details on the DID model). There were 312 hospital-month individuals (156 hospitals, February and March) in three years (2018, 2019, 2020) involved in these models. Compared to a non-tertiary hospital, a tertiary hospital experienced substantially larger losses in outpatient visits (57.91 thousand, p<0.01), inpatient visits (1.93 thousand, p<0.01), outpatient revenue (18.88 million RMB, p<0.01), and inpatient revenue (30.65 million RMB, p<0.01) during the COVID-19 pandemic. For all medical services and revenue, the impacts of the pandemic on tertiary hospitals were about one-third or two-thirds of the total tertiary incremental effects.
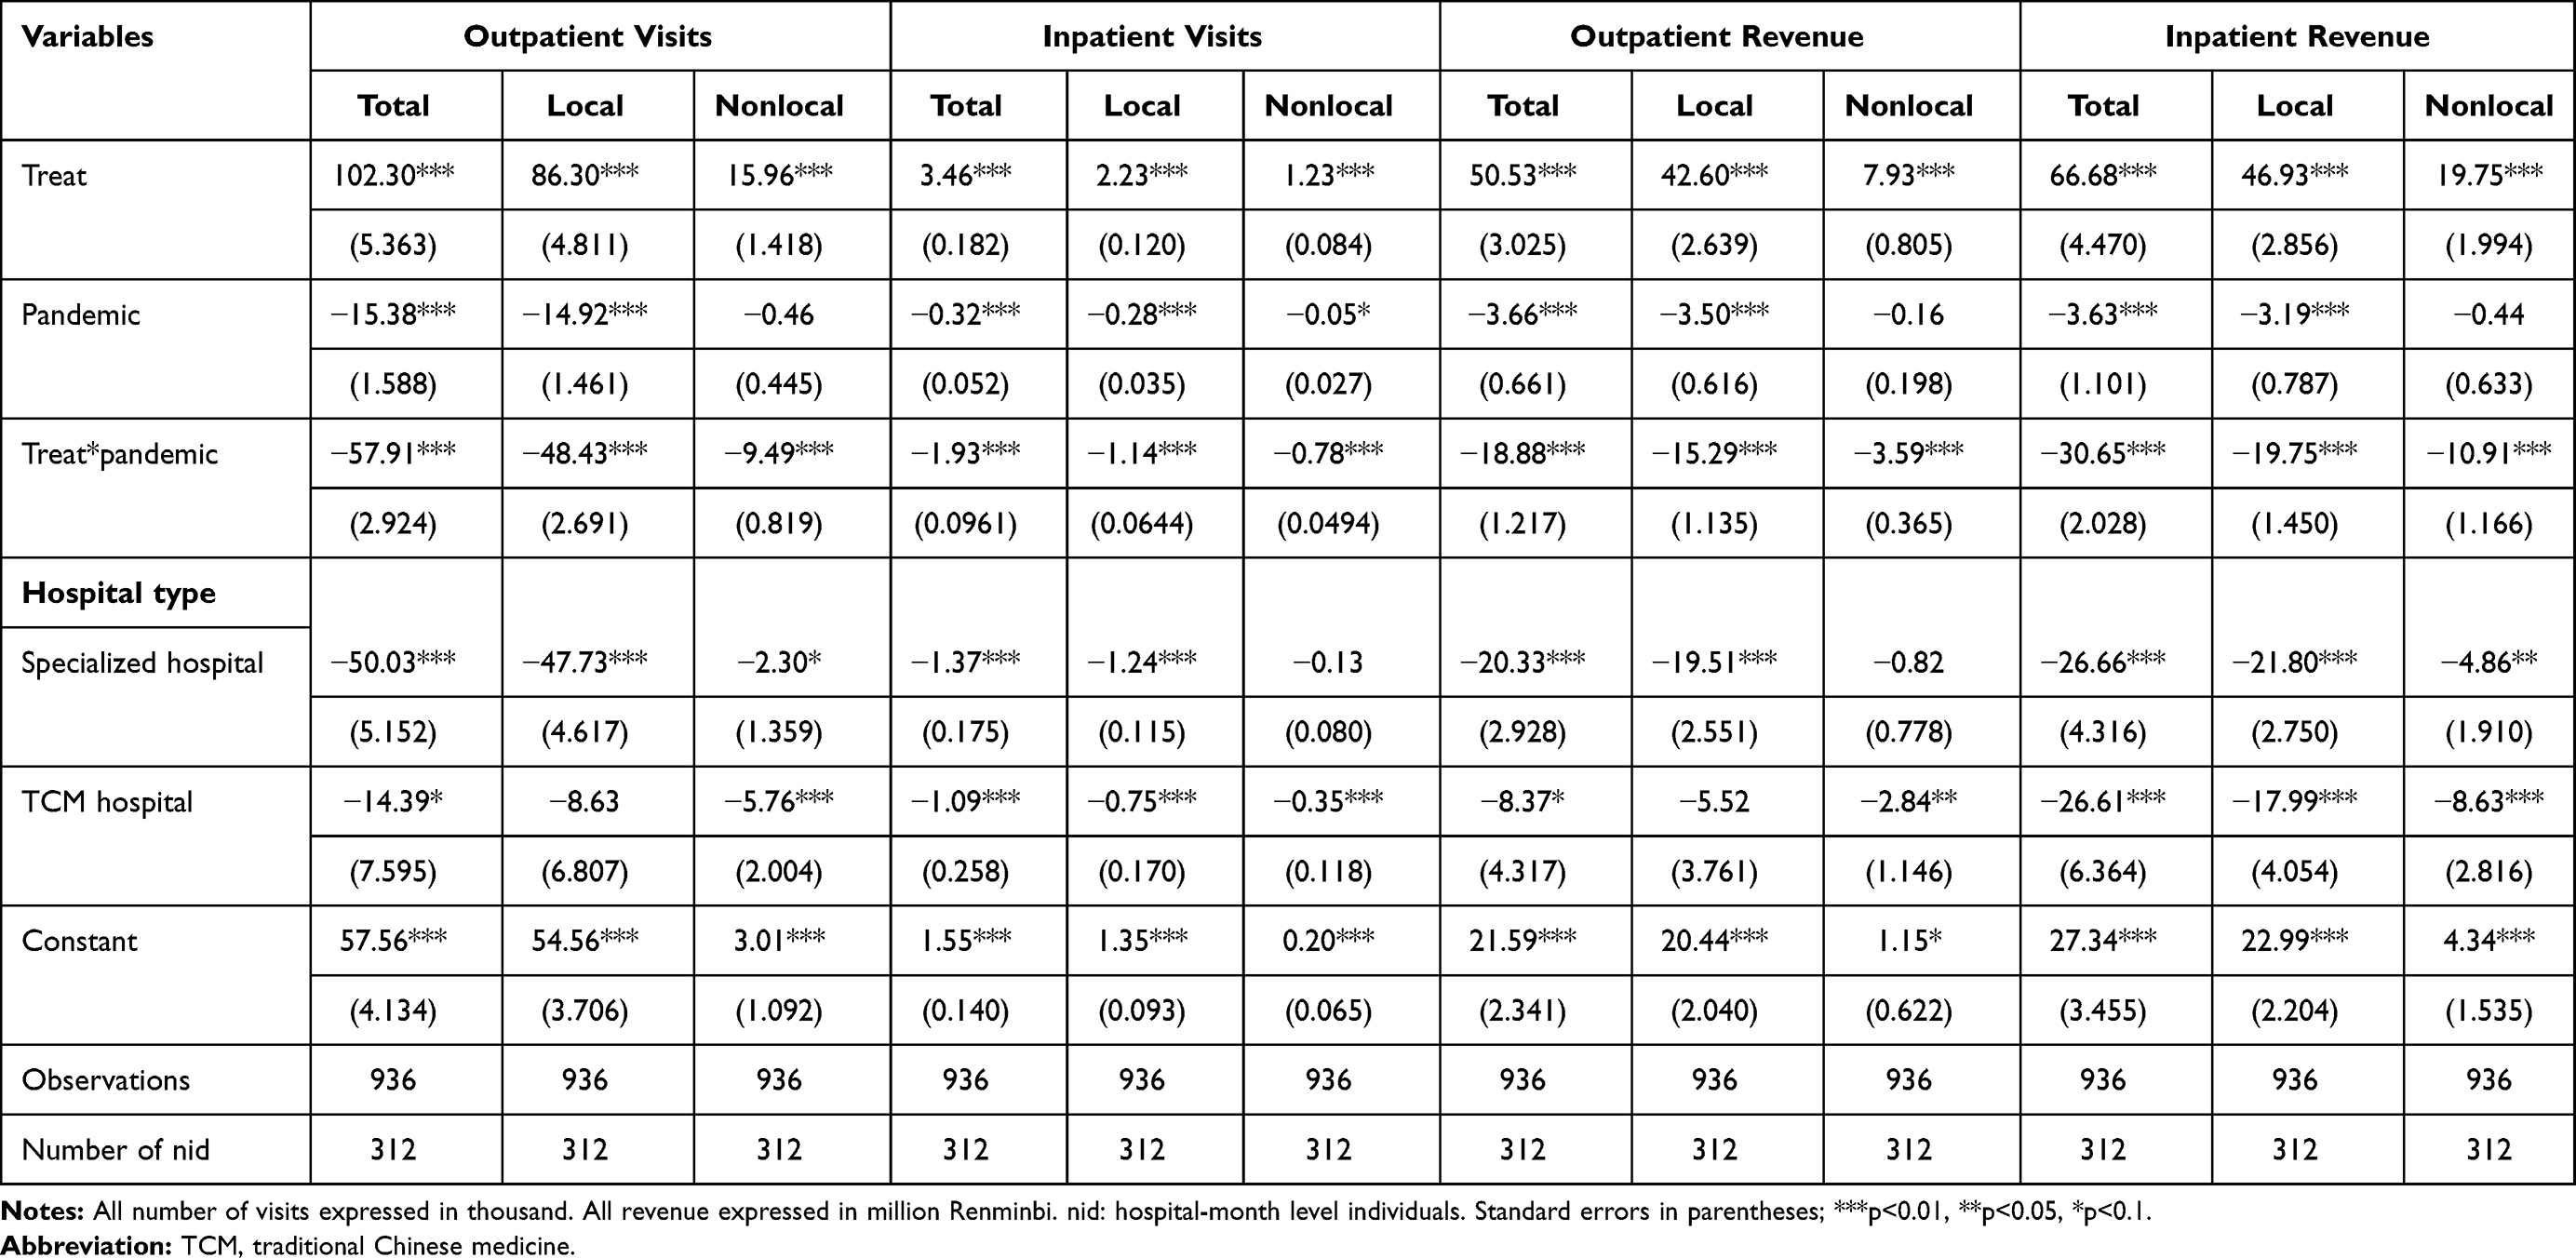 |
Table 4 The Pandemic Effect of Operation Data on Public Hospitals, During the Pandemic of COVID-19 in Shanghai, China (321 Hospital*Month (156 Hospitals, in February and March), in 2018, 2019, and 2020) |
Compared to a non-tertiary hospital, a tertiary hospital averagely supplied 102.30 thousand (p<0.01) more outpatient visits and 3.46 thousand (p<0.01) more inpatient visits, as well as generated 50.53 million (p<0.01) RMB more outpatient revenue and 66.68 (p<0.01) million RMB more inpatient revenue. The COVID-19 pandemic averagely reduced 15.38 thousand (p<0.01) outpatient visits, 0.32 thousand (p<0.01) inpatient visits, 3.66 million RMB (p<0.01) outpatient revenue, and 3.63 million RMB (p<0.01) inpatient revenue on a non-tertiary hospital. Compared to general hospitals, specialized and TCM ones were associated with less medical services and revenue both for outpatient and inpatient services (p<0.01), which was primarily due to the difference from local patients. For instance, TCM hospitals were more likely to have fewer nonlocal patients and fewer inpatients revenue from all patients (p<0.01). However, since tertiary hospitals have a higher proportion (52.17%) of general hospitals, in comparison to 39.09% of general hospitals in non-tertiary hospitals (Table 3), tertiary hospitals were associated with higher medical services and revenue.
The Medical Services and Revenue of Tertiary Hospitals Rebounded Faster Than Non-Tertiary Hospitals in the Post-Pandemic Period
Similar to the analysis for the effect of the COVID-19 pandemic, the impacts of post-pandemic on public hospitals were calculated based on the regression results of Equation 2, which were shown in Table 5. There were 624 hospital-month individuals (156 hospitals, from April to July) in three years (2018, 2019, 2020) involved in these models. Compared to non-tertiary hospitals, the post-pandemic additionally reduced outpatient visits for a tertiary hospital by 18.02 thousand (p<0.01) monthly, and this was mainly due to local patients (decreased 14.67 thousand, p<0.01). The post-pandemic period had no other significant additional impacts on number of inpatient visits in tertiary hospitals when compared to non-tertiary hospitals, which was due to the opposite impacts on local patients (increased 0.09 thousand, p<0.1) and nonlocal patients (decreased 0.15 thousand, p<0.01). Nevertheless, the post-pandemic significantly increased outpatient revenue of tertiary hospitals (average 0.87 million RMB monthly, p<0.01) from nonlocal patients and inpatient revenue (average 2.24 million RMB monthly, p<0.01) from all patients.
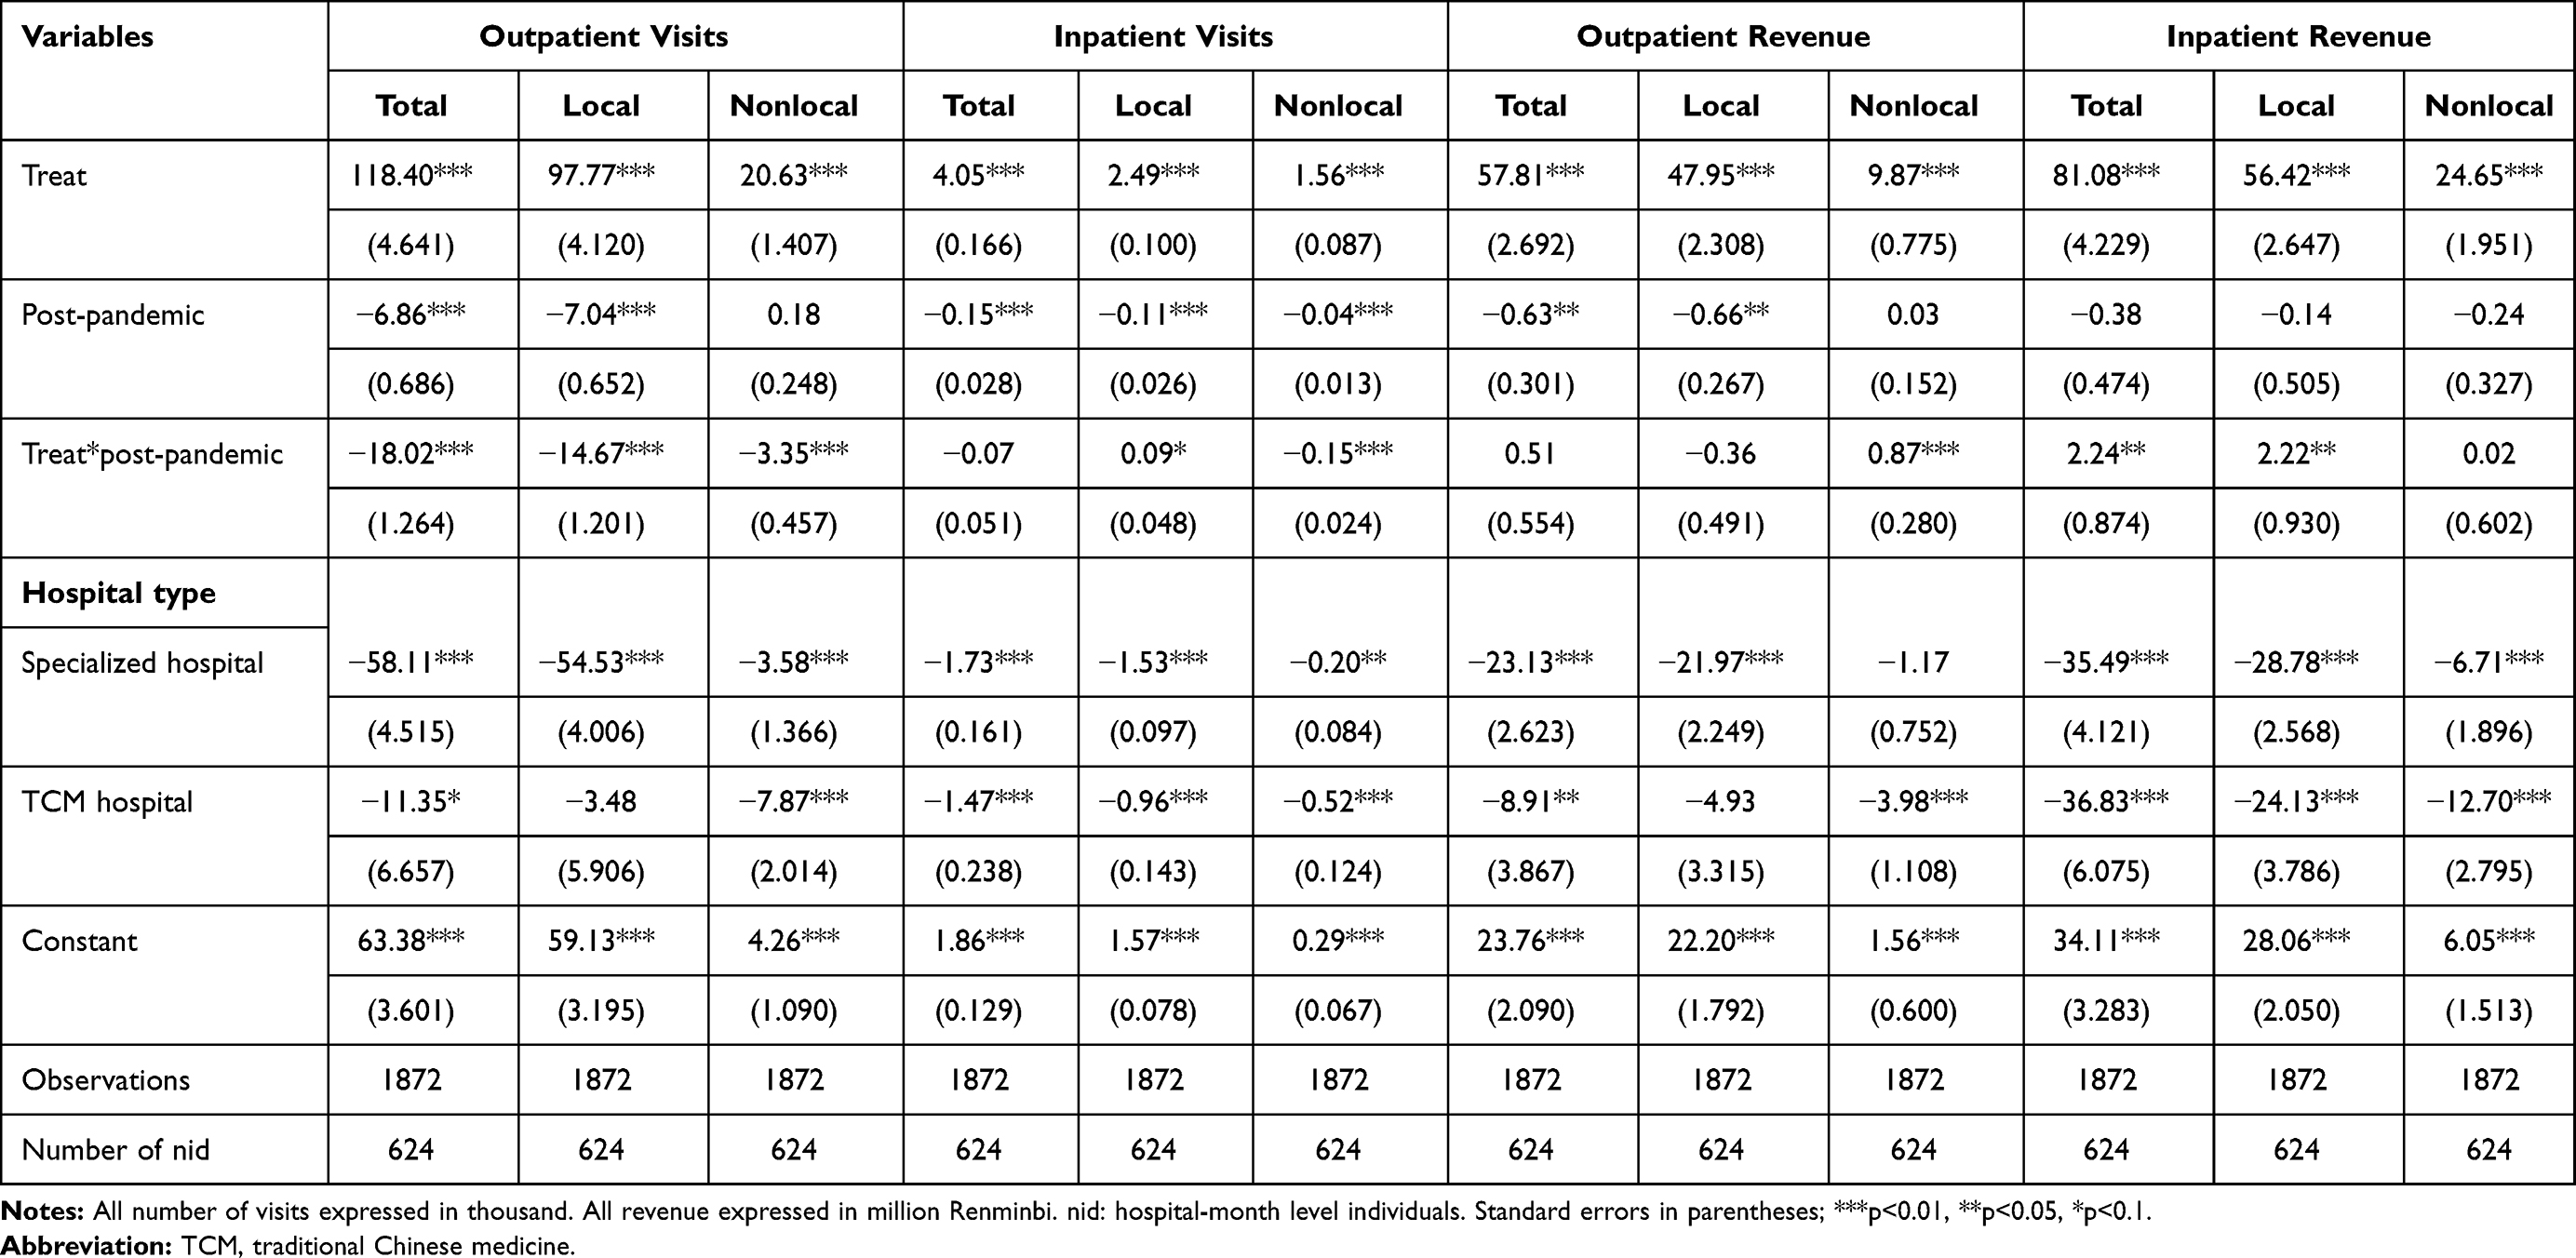 |
Table 5 The Post-Pandemic Effect of Operation Data on Public Hospitals, During the Post-Pandemic of COVID-19 in Shanghai, China (624 Hospital*Month (156 Hospitals, in April, May, June, and July), in 2018, 2019, and 2020) |
The differences in medical services and revenue by hospital level and type during the post-pandemic period (Table 5) were consistent with the pandemic period estimated results in Table 4. During this period, the COVID-19 averagely cut down a hospital 6.86 thousand (p<0.01) outpatient visits, 0.15 thousand (p<0.01) inpatient visits and 0.63 million (p<0.01) RMB outpatient revenue for a hospital. Furthermore, these losses were mainly due to the decrease in local patients. The reduction impacts of COVID-19 during the post-pandemic period were less than it showed during the pandemic period (from February 2020 to March 2020).
Specifically, we divided the post-pandemic period into two parts: the early post-pandemic period (April and May in 2020) and the later post-pandemic period (June and July in 2020), to explore the post-pandemic effect on tertiary hospitals of different stages. During the early post-pandemic period, the reduction impact of COVID-19 on all hospitals, as well as additional reduction in medical services and revenue on tertiary hospitals were much weaker than that in the pandemic period (Supplementary Table 2, Table 4). During the later post-pandemic period, those losses kept diminishing, and the post-pandemic even boosted outpatient revenue and inpatients revenue for tertiary hospitals (p<0.01) (Supplementary Table 3).
Robustness
A potential challenge for the DID strategy was that differential changes between tertiary and non-tertiary hospitals may be driven by preexisting differences in the time trends of the outcomes. To illustrate such trend before COVID-19, we plotted the means of outpatient visits, inpatient visits, outpatient revenue, and inpatient revenue due to total patients and nonlocal patients, respectively (Figure 3). The plots include data from the tertiary hospitals (treatment group, blue line) and non-tertiary hospitals (control group, red line) for 2018 (dotted line), 2019 (dash line) and 2020 (solid line). The grey area in the figure indicates the COVID-19 pandemic period for COVID-19 in Shanghai (February 2020–March 2020). The figure provides graphical support that the treatment and control groups exhibited almost parallel trends in medical service and revenue levels among years in the same month before COVID-19’s nationwide outbreak in China. This result may predict that the differences found for medical services and revenue levels in tertiary and non-tertiary hospitals, in the long-term, might return to the previous level.
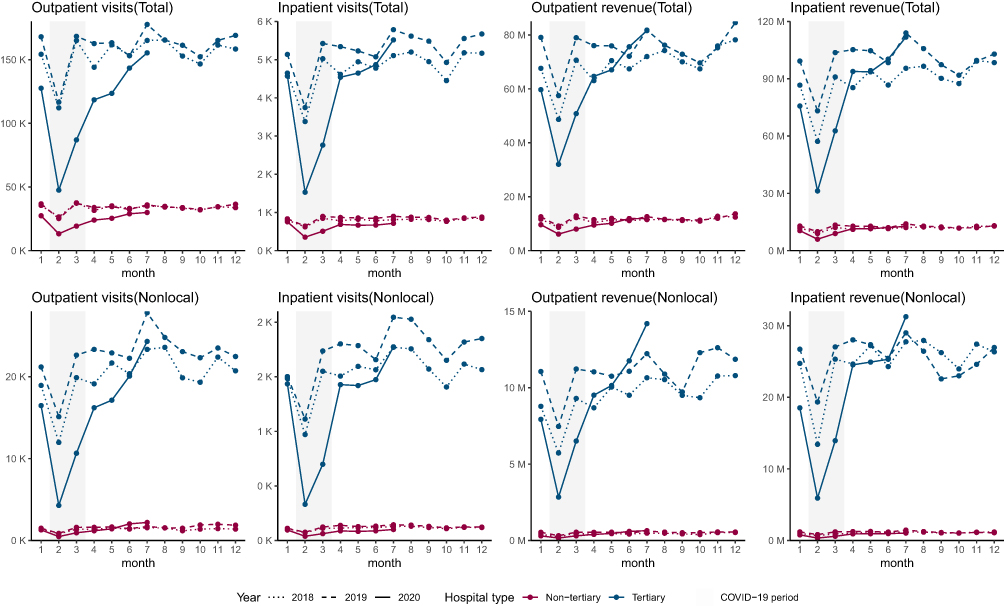 |
Figure 3 Monthly temporal trends of the average medical services and revenue in tertiary (blue) and non-tertiary (red) hospitals from total patients and nonlocal patients among 2018 (dot line), 2019 (dash line), and 2020 (solid line), in Shanghai, China. Data were collected from January 2018 to July 2020. The monthly gaps between tertiary and non-tertiary hospitals were relatively stable before the COVID-19 pandemic. During and after the pandemic, the gap changed substantially, from February to June in 2020. The gray area in the figure indicated the COVID-19 pandemic period in Shanghai (February 2020–March 2020). |
Sensitivity analyses were conducted by incorporating January into the pandemic period. There were 468 hospital-month individuals (156 hospitals, from January to March) in three years (2018, 2019, 2020) involved in the RE models shown in Equation 1. The associated estimated effects are shown in Table 6. The effects of levels and types of hospitals were consistent with the above regressions. However, the effects of the pandemic on medical services and revenue for all hospitals were slightly smaller in these analyses, compared to the analyses performed during February 2020 to March 2020. When compared to non-tertiary hospitals, the differential impacts of the pandemic on medical services and revenue in tertiary hospitals were weakened. These results support our definition of the pandemic period for COVID-19, as well as the estimations for the effects of the pandemic.
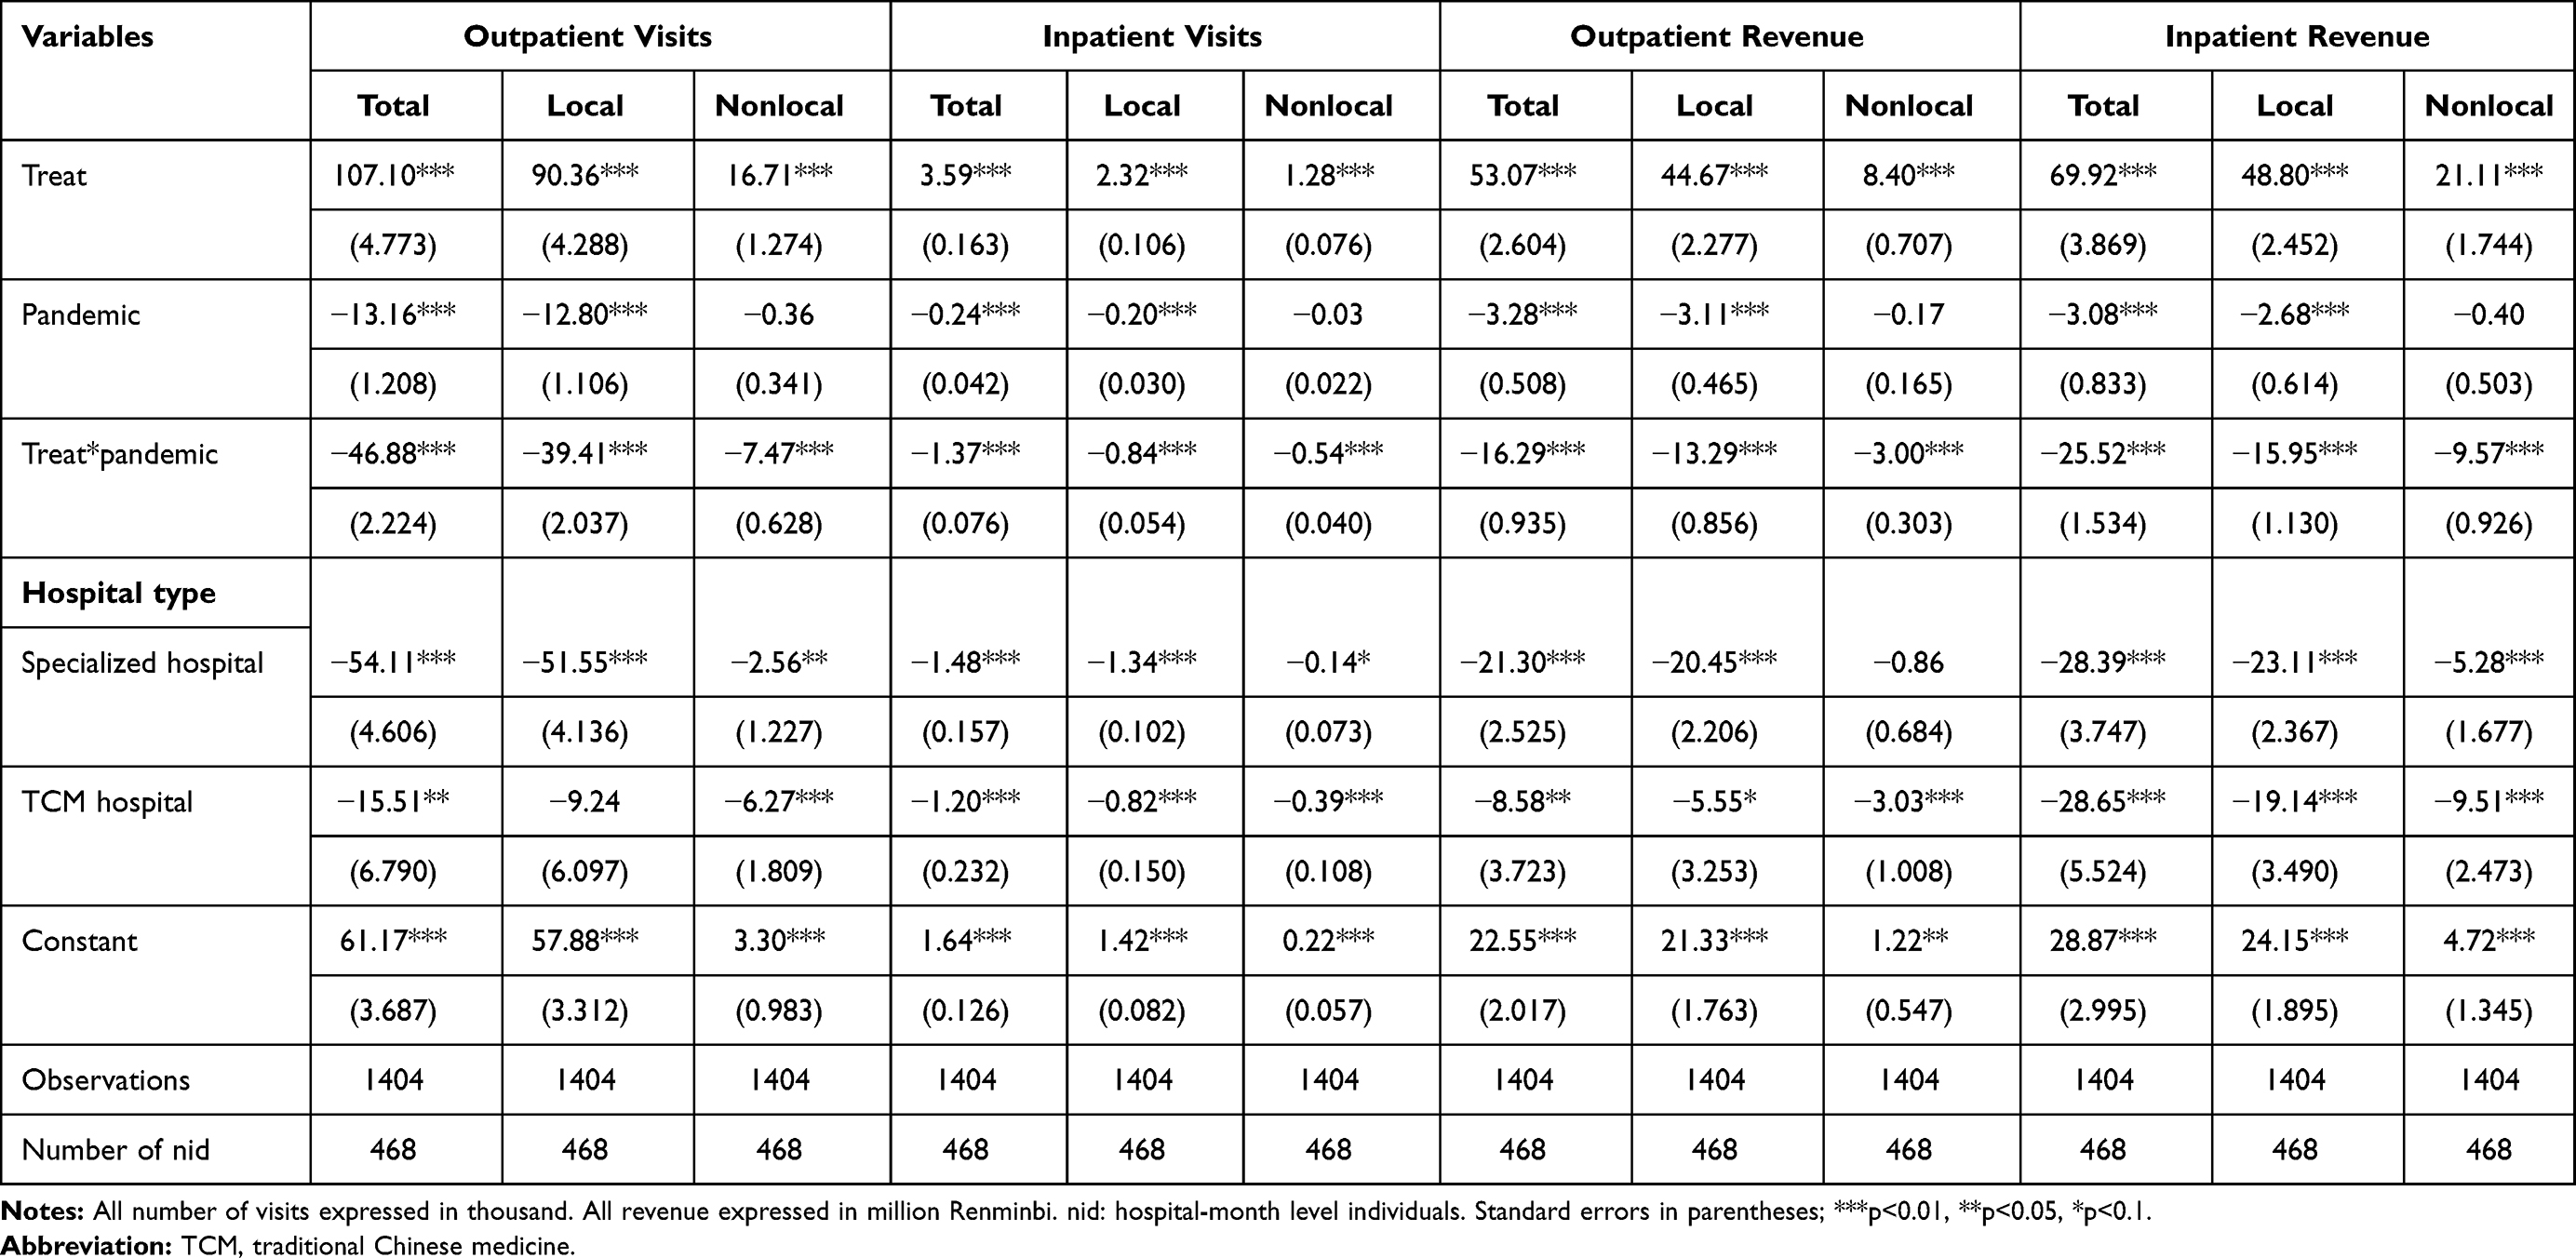 |
Table 6 The Pandemic Effect on Public Hospitals, During the Pseudo Pandemic of COVID-19 Including January 2020 in Shanghai, China (468 Hospital*Month (156 Hospitals, in January, February, and March), in 2018, 2019, and 2020) |
Discussion
Based on monthly operational data of 156 public hospitals in Shanghai, we found that public hospitals in Shanghai experienced substantial losses in medical service and revenue during and after the COVID-19 pandemic in China in 2020. The DID models revealed that tertiary hospitals experienced a significantly larger reduction in medical services and revenue during the COVID-19 pandemic in February and March 2020 when compared to non-tertiary hospitals; however, tertiary hospitals showed a faster recovery in medical services and revenue after the pandemic.
Our study is consistent with previous reports on hospital volume change during the COVID-19 pandemic in the United States and Germany.8,25 In the United States, at the nadir in April 2020, national personal consumption expenditures on health services (not including pharmaceuticals) were cut down by 31.9% on an annualized basis.8 This was less than the YOY decrease ratio found in February for outpatient revenue (41.13%) and inpatient revenue (53.05%) in Shanghai. Additionally, according to a study that covered 18 German University hospitals, the overall inpatient hospital admissions decreased by 35% in weeks 1 to 4 and by 30.3% in weeks 5 to 8 after the lockdown announcement when compared to 2018.25 The decrease ratio in this German study was much lower than those reported in our study for the first month (February 2020, 55.11%) and second month (March 2020. 47.48%) after the declaration of COVID-19 in Shanghai.
The differential decrease ratio in our study may be caused by the characteristics of hospitals. There were no community healthcare centres in our sample. Previous studies have shown the different reduction ratios in different medical service fields. A study from a large nationally representative hospitalist group in the United States had shown that the declines in non-COVID-19 admissions from February to April 2020 was just over 20% for all primary admission diagnoses, which was much lower than the average nationwide overall medical service and revenue deduction rate.6 In contrast, another US study found that the emergency department (ED) visits decreased in five sample states in the first months of the COVID-19 pandemic, ranging from 41.5% to 63.5%, which was much higher than the nationwide overall medical service deduction rate.26 In this latter study, there was no significant difference between the decreases in outpatient and inpatient services volume; however, the desrease in ED visits was much lower than the outpatient visits in the first half of 2020. In other studies from China, the surgical cases in Wuhan (epicentre, 94%) and other cities in the Hubei provinces (64%) experienced more dramatic decreases in February 2020 when compared to the overall situation in Shanghai.27 The stroke thrombolysis and thrombectomy treatments YOY growth ratio decreased to a lower level (26.7% and 25.33%).28 Meanwhile, the stroke outpatient visits and inpatient visits YOY growth ratios dropped by 36.6% and 27.4%, respectively. These decreases were less than the overall situation in Shanghai. Additionally, surveys from 46 countries showed that the outpatient services recovered slower than the inpatient services in stroke and other neurological diseases after the pandemic.29 The paediatric visits in a tertiary hospital in Zhejiang Province fell to a quarter but recovered quickly.4 These differences suggest the effect of COVID-19 on hospital operational data may be associated with the spread of the epidemic and the the type of diseases (health demand). This remains to be tested and awaits further research.
Several reasons may explain the dramatic decrease in hospital volume and revenue during and after the COVID-19 pandemic. First, the draconic population mobility control measures were implemented in China to mitigate the spread of the pandemic,18,21,22 while non-emergency services and elective surgeries were postponed or cancelled in Shanghai during the pandemic period. Second, some patients chose to postpone their treatment to comply with the population mobility control measures or to prevent themselves from being infected in the hospitals.3,4,30,31 Third, some health demands might be eliminated by particular external environmental factors and lifestyles choices during the pandemic period. For instance, the air pollution reduction during the COVID-19 pandemic has been proved to lessen mortality in China and other countries.32–34 Living habits, such as popularized mask-wearing during the period,35 physical distancing (including school closures) and public health messaging (including hand hygiene), have been considered to be essential protective factors for other respiratory infections in previous studies.30,36–38 The relatively higher ED visits YOY decrease ratio during the pandemic and post-pandemic period in Shanghai and other places may also indicate a reduction in some accidents.7,26 Fourth, the long-term reduction in health service might suggest some of the reduction was for unnecessary overtreatment, both for the local and nonlocal patients. Previous studies have reported that during the COVID-19 pandemic, patients might avoid unnecessary tests, diagnoses, and treatments that would cause more harm than good.39,40
The DID models suggested that medical services and revenue in tertiary hospitals were cut down much more significantly than those in non-tertiary hospitals, which could be explained by a few aspects. First, nonlocal patients, which were susceptible to the population mobility control measures, were more likely to seek medical service in tertiary hospitals.22 The differential pandemic effect on tertiary hospitals when compared to non-tertiary hospitals, during the pandemic period for nonlocal patients is shown in Table 4. Second, unnecessary overtreatment, especially for the tests and laboratory work, was more likely to be supplied by tertiary and large hospitals.39,41 Since the crisis caused by the pandemic requires health systems to prioritize interventions “that have demonstrated effectiveness and concrete benefits for patients”, the reduction of unnecessary medical service may lead to a more substantial decrease in tertiary hospitals. Third, tertiary hospitals tend to be much more crowded than non-tertiary hospitals in China,13 which increases the likelihood of respiratory transmission. Therefore, patients might choose to seek care in their nearby non-tertiary hospitals to reduce the chances of being infected in a crowded tertiary hospital or on the way to the tertiary hospital during the pandemic period.
The COVID-19 pandemic period seemed to have additional lifting effects on the medical services and revenue of tertiary hospitals in the post-pandemic period when compared to non-tertiary hospitals. Operation data indicates that tertiary hospitals rebounded faster and maintained the rebound for a longer time than non-tertiary hospitals. These lifting effects were substantial for medical services provided to both local and nonlocal patients. For nonlocal patients, most of them sought care in Shanghai, because they had more severe disease that required the high-quality of medical service that is available at higher-level hospitals.22 With the recovery of transportation after the pandemic, the demand for medical care among nonlocal patients was unshackled, which contributed to a rapid increase in the medical services and revenue of tertiary hospitals.
Furthermore, our finding that tertiary hospitals recovered at a much faster rate than non-tertiary hospitals in the post-pandemic period for local patients may be explained in four parts. First, the ease on demand to seek care in their nearby non-tertiary hospitals by patients who wanted to reduce their chances of being infected in a crowded tertiary hospital or on the way to the tertiary hospital during the pandemic period might result in a return of those patients to tertiary hospitals. Second, the tertiary hospitals may absorb some patients that should be treated in non-tertiary hospitals. Because of the enormous reduction during the first half of 2020, tertiary hospitals have more supply capacity to provide services to additional patients, who prefer to seek care in higher-level and larger hospitals.42–44 Third, tertiary hospitals may have induced a demand for patients to make up for their losses during the pandemic. Tertiary hospitals are believed to provide high-quality medical care and have a better reputation among Chinese residents. The ability to induce unnecessary care was associated with information superiority in an uncertain medical care market with information asymmetry, like the medical service market.45,46 Thus, tertiary hospitals with better skills were more easily able to induce more health demand, which is suggested by the substantial increase in average expenditure: with lower visits and higher revenues after the pandemic shown in Figure 1. Fourth, lower-level hospitals primarily provide ordinary or noncompulsory care that may be avoided by patients after the pandemic.39 The increase in average expenditure may support this explanation: the YOY growths of average outpatient expenditure and inpatient expenditure were at their highest level since 2006: 15.78% and 9.28%.
As the country where COVID-19 was initially detected, China has managed to largely control the pandemic rapidly and effectively. While most parts of the world are still fighting to control COVID-19, the early experience from China could be a good example for counties that are still in the midst of the pandemic. The dramatic reduction of medical services caused by COVID-19 should be investigated to avoid the worsening of symptoms and the rising incidence of other diseases due to undertreatment.30,31 We should pay attention to the various effects of COVID-19 on different levels and types of hospitals, to protect them from an induced demand and a potential surge of patients. This should be done in an effort to restore medical services according to the normal function of each hospital.
There are at least two measures that should be taken to prevent the interruption of medical service from a future pandemic. Firstly, to improve the serviceability of basic medical institutions, there should be strengthened cooperation among medical institutions at all grades. As discussed in this study, the services volume for higher level (larger) hospitals decreased more. Lots of patients postpone seeking-care due to pandemic control measures as well as fears of higher infection probability in crowded large hospitals and with longer traveling distances. If the nearby primary hospitals could provide reliable healthcare services, then these fears would be eliminated, while complying with restrictions placed by control measures. Secondly, to establish a quick pandemic response mechanism in hospitals. During the period of COVID-19, many hospitals stopped providing normal healthcare services, due to the insufficient stock of sanitation supplies, consumables, blood, etc., as well as a lacking of quick response management protocols for this kind of pandemic.3 The success of China’s pandemic control measures were attributed to this kind of quick response.47
This paper should be interpreted in view of several limitations. First, the statistical model was constructed based on the traditional DID model, but both the control group (non-tertiary hospitals) and the treated group (tertiary hospitals) were affected by COVID-19. However, we focused on analysing the differential effect of COVID-19 on tertiary hospitals compared to non-tertiary hospitals, instead of the pure effect of COVID-19. Second, since the COVID-19 tests were generally required for patients seeking medical service in hospitals during and after the pandemic, we could not evaluate the constituents of the revenue. Third, since Shanghai plays a significant role in providing healthcare services to nonlocal patients,21 the results may not be generalizable to other smaller cities. Fourth, we analysed the effects of COVID-19 on hospitals but did not have the data to explore the pathway for these effects. Moreover, it was unclear from our analysis what drove the reduction in medical services and revenue.
Conclusion
The medical services and revenue of public hospitals in Shanghai dropped precipitously during and after the COVID-19 pandemic, from February to July in 2020. Compared to non-tertiary hospitals, tertiary hospitals experienced more substantial fluctuation, which was characterized: by a sharper reduction during the pandemic, as well as a faster rebound that was maintained for a longer time during the post-pandemic period. Particular attention should be given to reassure patients in need to obtain hospital care adequately and timely. This final note is especially vital for those countries still suffering from the pandemic or facing the other natural shock.
Abbreviations
SHRSP, China Statistical Survey of Health Resources and Services Program; IQR, interquartile range; RMB, Renminbi; CPI, Consumer Price Index; TCM, traditional Chinese medicine; DID, difference-in-difference; RE, random effect; SE, standard error; YOY, year-over-year; ED, emergency department.
Acknowledgments
We gratefully acknowledge Financial Department in Shanghai Municipal Health Commission for the data collecting. Authors acknowledge Dr. Xin Cui and Zhenyi Shao from Shanghai Health Information Center for data extraction.
Disclosure
The authors report no conflicts of interest in this work.
References
1. Li Q, Guan X, Wu P, et al. Early transmission dynamics in Wuhan, China, of novel coronavirus–infected pneumonia. N Engl J Med. 2020;382(13):1199–1207. doi:10.1056/NEJMoa2001316
2. Huang C, Wang Y, Li X, et al. Clinical features of patients infected with 2019 novel coronavirus in Wuhan, China. Lancet. 2020;395(10223):497–506. doi:10.1016/S0140-6736(20)30183-5
3. Wang H, Wu J, Wei Y, Zhu Y, Ye D. Surgical volume, safety, drug administration, and clinical trials during COVID-19: single-center experience in Shanghai, China. Eur Urol. 2020;78(1):120–122. doi:10.1016/j.eururo.2020.04.026
4. Li H, Yu G, Duan H, Fu J, Shu Q. Changes in children’s healthcare visits during coronavirus Disease-2019 pandemic in Hangzhou, China. J Pediatr. 2020;224:146–149. doi:10.1016/j.jpeds.2020.05.013
5. Wu Z, McGoogan JM. Characteristics of and important lessons from the coronavirus disease 2019 (COVID-19) outbreak in China: summary of a report of 72 314 cases from the Chinese center for disease control and prevention. JAMA. 2020;323(13):1239–1242. doi:10.1001/jama.2020.2648
6. Birkmeyer JD, Barnato A, Birkmeyer N, Bessler R, Skinner J. The impact of the COVID-19 pandemic on hospital admissions in the United States: study examines trends in US hospital admissions during the COVID-19 pandemic. Health Aff. 2020;39(11):2010–2017. doi:10.1377/hlthaff.2020.00980
7. Hartnett KP, Kite-Powell A, DeVies J, et al. Impact of the COVID-19 pandemic on emergency department visits—United States, January 1, 2019–May 30, 2020. Morb Mortal Wkly Rep. 2020;69(23):699–704. doi:10.15585/mmwr.mm6923e1
8. Cox C, Amin K,Kamal R. How have health spending and utilization changed during the coronavirus pandemic?. Health System Tracker. 2021.
9. Cai M, Liu E, Tao H, Qian Z, Lin X, Cheng Z. Does level of hospital matter? A study of mortality of acute myocardial infarction patients in Shanxi, China. Am J Med Qual. 2018;33(2):185–192. doi:10.1177/1062860617708608
10. Wong J, Goh QY, Tan Z, et al. Preparing for a COVID-19 pandemic: a review of operating room outbreak response measures in a large tertiary hospital in Singapore. Can J Anaesth. 2020;67(6):732–745. doi:10.1007/s12630-020-01620-9
11. Nacoti M, Ciocca A, Giupponi A, et al. At the epicenter of the Covid-19 pandemic and humanitarian crises in Italy: changing perspectives on preparation and mitigation. NEJM Catal Innov Care Deliv. 2020;1(2).
12. Circular of the Ministry of Health on the Implementation of the National Health Resources and Medical Services Survey System and the National Health Supervision Survey System; Establish department: Ministry of Health of PRC; Establish year: 2007. Available form: http://www.nhc.gov.cn/bgt/pw10709/200709/c2f58da8d8754fe09f3b364da335b95f.shtml.
13. Sun Z, Wang S, Barnes SR. Understanding congestion in China’s medical market: an incentive structure perspective. Health Policy Plan. 2016;31(3):390–403. doi:10.1093/heapol/czv062
14. Yip W, Fu H, Chen AT, et al. 10 years of health-care reform in China: progress and gaps in universal health coverage. Lancet. 2019;394(10204):1192–1204. doi:10.1016/S0140-6736(19)32136-1
15. Health Statistics of Shanghai in 2019; Author/institution/ publish department: Shanghai Municipal Health Commission; publish date: July 24, 2020. Available form: http://wsjkw.sh.gov.cn/tjsj2/20200724/6ac31287f7074c869f563fefe79c75d3.html. Accessed Aug 13, 2021.
16. Xu S, Li Y. Beware of the second wave of COVID-19. Lancet. 2020;395(10233):1321–1322. doi:10.1016/S0140-6736(20)30845-X
17. Leung K, Wu JT, Liu D, Leung GM. First-wave COVID-19 transmissibility and severity in China outside Hubei after control measures, and second-wave scenario planning: a modelling impact assessment. Lancet. 2020;395(10233):1382–1393. doi:10.1016/S0140-6736(20)30746-7
18. Kraemer MU, Yang C-H, Gutierrez B, et al. The effect of human mobility and control measures on the COVID-19 epidemic in China. Science. 2020;368(6490):493–497. doi:10.1126/science.abb4218
19. Jiang X, He P, Zhu D, Shi X, Meng Q. Different impacts of the zero-markup drug policy on county general and traditional Chinese medicine hospitals: evidence from Shandong province, China. Int J Equity Health. 2020;19(1):219. doi:10.1186/s12939-020-01326-w
20. Desai NR, Smith KL, Boal J. The positive financial contribution of home-based primary care programs: the case of the Mount Sinai Visiting Doctors. J Am Geriatr Soc. 2008;56(4):744–749. doi:10.1111/j.1532-5415.2007.01641.x
21. Jin C, Wang L, Hu S, Wang C, Li F. The study on the process and impact of external-care-seeking behavior in Shanghai. Open J Prev Med. 2015;5(03):103. doi:10.4236/ojpm.2015.53012
22. Li F, Gu S, Zhu B, et al. Analysis on the status of non-residents’medical service in Shanghai under the perspective of improving health ex-pense accounting. Chin Health Econ. 2020;39(5):50–53.
23. Dimick JB, Ryan AM. Methods for evaluating changes in health care policy: the difference-in-differences approach. JAMA. 2014;312(22):2401–2402. doi:10.1001/jama.2014.16153
24. Doudchenko N, Imbens GW. Balancing, Regression, Difference-In-Differences and Synthetic Control Methods: A Synthesis. National Bureau of Economic Research; 2016:22791.
25. Kapsner LA, Kampf MO, Seuchter SA, et al. Reduced rate of inpatient hospital admissions in 18 German university hospitals during the COVID-19 lockdown. Front Public Health. 2021;8:1018.
26. Jeffery MM, D’Onofrio G, Paek H, et al. Trends in emergency department visits and hospital admissions in health care systems in 5 states in the first months of the COVID-19 pandemic in the US. JAMA Intern Med. 2020;180(10):1328–1333. doi:10.1001/jamainternmed.2020.3288
27. Wu J, Yao S, Liu R. Towards a full capacity of anaesthesia and surgical services in the epicenter (Wuhan) of the COVID-19 epidemic. Br J Surg. 2021;108(1):e1–e2. doi:10.1093/bjs/znaa044
28. Zhao J, Li H, Kung D, Fisher M, Shen Y, Liu R. Impact of the COVID-19 epidemic on stroke care and potential solutions. Stroke. 2020;51(7):1996–2001. doi:10.1161/STROKEAHA.120.030225
29. Zhao J, Wang Y, Fisher M, Liu R. Slower recovery of outpatient clinics than inpatient services for stroke and other neurological diseases after COVID-19 pandemic. CNS Neurosci Ther. 2020;26(12):1322–1326. doi:10.1111/cns.13459
30. Kadambari S, Abo Y-N, Phuong LK, Osowicki J, Bryant PA. Decrease in infection-related hospital admissions during COVID-19: why are parents avoiding the doctor? Pediatr Infect Dis J. 2020;39(11):e385–e386. doi:10.1097/INF.0000000000002870
31. Diegoli H, Magalhães PS, Martins SC, et al. Decrease in hospital admissions for transient ischemic attack, mild, and moderate stroke during the COVID-19 era. Stroke. 2020;51(8):2315–2321. doi:10.1161/STROKEAHA.120.030481
32. Le Quéré C, Jackson RB, Jones MW, et al. Temporary reduction in daily global CO 2 emissions during the COVID-19 forced confinement. Nat Clim Chang. 2020;10(7):647–653. doi:10.1038/s41558-020-0797-x
33. Chen K, Wang M, Huang C, Kinney PL, Anastas PT. Air pollution reduction and mortality benefit during the COVID-19 outbreak in China. Lancet Planet Health. 2020;4(6):e210–e212.
34. Han C, Hong Y-C. Decrease in ambient fine particulate matter during COVID-19 crisis and corresponding health benefits in Seoul, Korea. Int J Environ Res Public Health. 2020;17(15):5279. doi:10.3390/ijerph17155279
35. Greenhalgh T, Schmid MB, Czypionka T, Bassler D, Gruer L. Face masks for the public during the covid-19 crisis. BMJ. 2020;369:m1435. doi:10.1136/bmj.m1435
36. Chan K-S, Liang F-W, Tang H-J, Toh HS, Yu W-L. Collateral benefits on other respiratory infections during fighting COVID-19. Med Clin. 2020;155(6):249–253. doi:10.1016/j.medcle.2020.05.019
37. Asadi‐Pooya AA, Cross JH. Is wearing a face mask safe for people with epilepsy? Acta Neurol Scand. 2020;142(4):314–316. doi:10.1111/ane.13316
38. Matuschek C, Moll F, Fangerau H, et al. Face masks: benefits and risks during the COVID-19 crisis. Eur J Med Res. 2020;25(1):1–4. doi:10.1186/s40001-020-00430-5
39. Moynihan R, Johansson M, Maybee A, Lang E, Légaré F. Covid-19: an opportunity to reduce unnecessary healthcare. BMJ. 2020;m2752. doi:10.1136/bmj.m2752
40. Lantelme P, Targe SC, Metral P, et al. Worrying decrease in hospital admissions for myocardial infarction during the COVID-19 pandemic. Arch Cardiovasc Dis. 2020;113(6–7):443–447. doi:10.1016/j.acvd.2020.06.001
41. Lyu H, Xu T, Brotman D, et al. Overtreatment in the united states. PLoS One. 2017;12(9):e0181970. doi:10.1371/journal.pone.0181970
42. Liu Y, Zhong L, Yuan S, van de Klundert J. Why patients prefer high-level healthcare facilities: a qualitative study using focus groups in rural and urban China. BMJ Glob Health. 2018;3(5):e000854. doi:10.1136/bmjgh-2018-000854
43. Hu Y, Zhang Z. Skilled doctors in tertiary hospitals are already overworked in China. Lancet Glob Health. 2015;3(12):e737. doi:10.1016/S2214-109X(15)00192-8
44. Cui C, Zuo X, Wang Y, Song H, Shi J, Meng K. A comparative study of patients’ satisfaction with different levels of hospitals in Beijing: why do patients prefer high-level hospitals? BMC Health Serv Res. 2020;20(1):1–11. doi:10.1186/s12913-020-05507-9
45. Bloom G, Standing H, Lloyd R. Markets, information asymmetry and health care: towards new social contracts. Soc Sci Med. 2008;66(10):2076–2087. doi:10.1016/j.socscimed.2008.01.034
46. Arrow KJ. Uncertainty and the welfare economics of medical care. Am Econ Rev. 1963;53(5):941–973.
47. The Lancet. COVID-19: too little, too late? Lancet. 2020;395(10226):755. doi:10.1016/S0140-6736(20)30522-5
 © 2021 The Author(s). This work is published and licensed by Dove Medical Press Limited. The full terms of this license are available at https://www.dovepress.com/terms.php and incorporate the Creative Commons Attribution - Non Commercial (unported, v3.0) License.
By accessing the work you hereby accept the Terms. Non-commercial uses of the work are permitted without any further permission from Dove Medical Press Limited, provided the work is properly attributed. For permission for commercial use of this work, please see paragraphs 4.2 and 5 of our Terms.
© 2021 The Author(s). This work is published and licensed by Dove Medical Press Limited. The full terms of this license are available at https://www.dovepress.com/terms.php and incorporate the Creative Commons Attribution - Non Commercial (unported, v3.0) License.
By accessing the work you hereby accept the Terms. Non-commercial uses of the work are permitted without any further permission from Dove Medical Press Limited, provided the work is properly attributed. For permission for commercial use of this work, please see paragraphs 4.2 and 5 of our Terms.